
Downloads

Download report PDF
PDF | 703.2 KB
Executive summary
The Education Maintenance Allowance (EMA) is a weekly cash transfer paid to 16- to 19-year-olds from poorer households in full-time non-university-level education. The EMA was first introduced as a pilot scheme in 15 local authorities (LAs) in England in 1999, before being expanded to an additional 40 LAs in 2000. It was rolled out nationwide in 2004 and cost around £900 million per year across the UK by 2010 (in 2023–24 prices). Although it was scrapped in England in 2011, it remains in place in Scotland, Wales and Northern Ireland.
While a large government-funded evaluation of the EMA assessed the short-run impacts of the pilot phase of the programme, this report estimates the effect of the 2004 national roll-out of the EMA on both the short- and longer-run outcomes of eligible students. Using detailed administrative data, we explore the effect of the EMA on educational outcomes, earnings, employment and criminal behaviour.
Primarily for data reasons, we focus on England and on students who were eligible for free school meals. Institutional differences between the countries of the UK and changes in the economic environment since the mid 2000s mean that our results may not reflect the effects of the current live versions of the policy in the devolved nations, although in our view they can still inform the debate on these programmes.
Key findings
- Among students eligible for free school meals, the EMA increased full-time education participation in Year 12 by around 2.5 percentage points. This increase mostly came from students who would otherwise have been in training or part-time education rather than from those who would otherwise not have been in either education or training. Attendance increased primarily at further education colleges rather than school sixth forms. Effects are smaller in Year 13 and insignificant in Year 14. These impacts are considerably smaller than the participation effects estimated from the pilot phase of the EMA.
- The increase in participation in full-time education was largest for those with very poor performance at GCSE (fewer than five GCSEs with an A*–G grade), whose participation increased by over 4 percentage points. Boys and students receiving support for special educational needs were also much more likely to remain in education because of the EMA, at the expense of drops in training.
- The EMA reduced students’ earnings at age 17 by an average of about 7%. This was probably due mostly to reduced part-time working hours amongst those who would have remained in full-time education even in the absence of the EMA. The lower number of students in paid work-based training probably also contributed to this effect. Less part-time work amongst students might have increased potential study time but will also have reduced potentially valuable work experience.
- The EMA did not lead to a measurable increase in attainment. Despite high uptake amongst eligible students, and even though the EMA payments were contingent on students attending their classes, students did not see an improvement in A-level grades or pass rates, or an increase in the probability of receiving a Level 2 or Level 3 vocational qualification. There is also no evidence that the EMA improved educational performance beyond the period of eligibility, with no increase in university attendance.
- There is suggestive evidence that the EMA slightly reduced earnings and employment in the longer run. We estimate that the EMA reduced earnings of eligible students in employment by around 1% each year in their 20s. We also find that students eligible for the EMA were also slightly less likely to be in employment, and slightly more likely to claim out-of-work benefits, as a result of the EMA. These effects were plausibly driven by weaker connections to the labour market due to reduced work experience amongst young adults, as well as by students being diverted from high-return training.
- The EMA may have caused a small reduction in crime, but statistical power is insufficient to make a definitive statement. We find tentative evidence that the EMA slightly lowered criminal convictions, starting at the age of EMA eligibility and persisting into eligible students’ 20s. This result is driven by students with the lowest prior attainment (fewer than five GCSEs with an A*–G grade), who experienced a drop in convictions of around 7%.
- Taken together, our estimates imply that even though the EMA was a direct transfer from the government to students, it provided only around 40 pence of benefits for every £1 spent. This mostly stems from the estimated negative effects on employment and earnings later in life, which also imply lower later-life tax payments and higher government spending on out-of-work benefits.
1. Introduction
The Education Maintenance Allowance (EMA) was introduced in the United Kingdom as part of a government agenda to improve education participation beyond the minimum school-leaving age of 16,1 which was low relative to other OECD countries (OECD, 2004). The EMA was paid to young people from poorer backgrounds if they signed up for a full-time education course between the ages of 16 and 18 and attended their classes. Payments were worth up to £30 per week (roughly £50 in 2024 prices), with small additional bonuses paid at the end of each term.
The policy’s roll-out was staggered over a five-year period from 1999 to 2004. It began with a pilot phase in 15 English local authorities (LAs) in 1999, expanding to 40 more in 2000 and reaching the remaining two-thirds of English LAs in 2004. It was also rolled out in Scotland, Wales and Northern Ireland in 2004, and the policy is still in place in those countries in 2025.
The EMA was an ambitious and expensive intervention. At the time of the national roll-out in 2004, a full EMA award was worth more than a quarter of per-pupil spending on school sixth forms. At its peak in 2009–10, the programme cost around £820 million per year in England (2023–24 prices) or around 5% of direct government funding for 16–19 education in school sixth forms and further education colleges. However, evidence from the pilot phase suggested this investment could be worthwhile.
Studies of the initial roll-out found an increase in full-time education participation in Year 12 of 4.5 percentage points amongst those eligible for any EMA, with a larger effect of 6.7 percentage points for those eligible for the full award (Middleton et al., 2003; Dearden et al., 2009). Moreover, students who would have continued their education anyway might have attended classes more regularly or reduced their paid work hours to focus on studying. If this additional education had translated into higher later-life earnings, the policy might have been excellent value for money. In addition, there might have been wider social returns, such as reduced crime rates.
However, whether the EMA in fact delivered these benefits has not so far been studied. Our research addresses this evidence gap. We evaluate the policy’s impact by comparing outcomes across different areas and cohorts of students either side of the national roll-out of the policy. Specifically, we look at how outcomes changed between cohorts of students in areas of England that first received the EMA in 2004, comparing the first cohorts after the roll-out with the cohorts just before the roll-out. We then contrast these changes with changes across cohorts in areas that had already started receiving the EMA before 2004, which helps us account for other factors that might have changed across cohorts during this period. Drawing on linked administrative data, we track the population of secondary school pupils in England over time to measure the EMA’s longer-term effects on educational qualifications, employment, earnings, benefit receipt and crime. Because we cannot observe parental income or EMA receipt directly in the administrative data, we focus our analysis on the roughly 15% of students who were eligible for free school meals (FSM) at 16, virtually all of whom had a household income low enough to be eligible for the EMA.
This report provides an accessible overview of our research on the EMA’s short- and longer-term impacts. While it contains all key findings and necessary background information, readers interested in technical details can refer to our accompanying IFS Working Paper (Britton et al., 2025). The report is structured as follows. Chapter 2 provides more detail on the EMA policy and Chapter 3 describes our data and methods. Chapter 4 presents our main findings, before Chapter 5 shows how our estimates vary for different sub-populations. In Chapter 6, we consider the overall cost-effectiveness of the policy. Chapter 7 concludes.
2. The Education Maintenance Allowance
The version of the EMA that was rolled out across England in 2004 provided weekly payments to 16- to 19-year-old students from low-income backgrounds who remained in full-time education. Students could claim the allowance starting from Year 12 (the academic year in which they turned 17), with the possibility of extending up to Year 14.2 To be eligible, students had to be above the minimum school-leaving age of 16 and enrolled on a full-time academic or further education course. While both vocational and academic courses were eligible, more advanced further education courses (above Level 3), higher education courses and (work-based) training were excluded.
The payment operated on a sliding scale based on parental income. The specific amounts and thresholds used for the English system in 2004 are presented in Table 2.1. Students whose parents or carers living in the same home had a combined total gross income of up to £19,630 (roughly £34,000 in today’s prices) in the preceding tax year – approximately 40% of the population – received £30 per week during term time, or approximately £1,200 annually. This represented a substantial sum, equivalent to a quarter of full-time minimum wage earnings for a 16-year-old, or more than a quarter of per-pupil spending on school sixth forms. Students from households earning more than £19,630 and up to £24,030 (£42,000 in today’s prices, or the next 10% of the population) received £20 per week, while those with parental income above that up to £30,000 (£53,000 in today’s prices, or the following 10%) received £10 per week. Additional incentives included £50 bonuses for completing each school term and for good examination performance.3
Table 2.1. Income thresholds and EMA awards in England, 2004
Parental income | Weekly EMA award |
£0–£19,630 | £30 |
£19,631–£24,030 | £20 |
£24,031–£30,000 | £10 |
£30,001+ | £0 |
Source: Middleton et al., 2005.
First announced in Spring 1999, the EMA was initially rolled out as pilot schemes in 15 out of 150 English local authorities in September 1999. Students living in these LAs were eligible for up to £30 or £40 per week, depending on their LA’s pilot scheme variant and their parental income. Eleven LAs were designated as control areas, chosen for their similar characteristics to the pilot LAs. Both pilot and control LAs were predominantly deprived, urban areas outside London.
In September 2000, the pilots expanded to another 40 LAs, which did not include any of the original control LAs. For the next four years, LAs containing about one-third of England’s population and around half of England’s FSM-eligible population – mostly urban areas with higher deprivation levels – had access to the EMA, while the remaining LAs – predominantly rural and suburban areas with lower deprivation – did not. Although students could participate in education in a different LA from the one they lived in, eligibility was based entirely on where they lived, meaning they could not cross LA borders in order to receive it.
Past work on the EMA (Dearden et al., 2009; Sabates and Feinstein, 2008) examined differences between the 1999 pilot and control areas to estimate short-term effects of the policy. Dearden et al.’s main analysis focuses on nine of the pilot areas and nine control LAs, selecting an urban non-London subset from the pilot and control areas for better comparability.
Figure 2.1 shows the EMA roll-out across areas in England, demonstrating the similarity between the nine comparable pilot and control areas in terms of geography and size. The 2000 expansion generally though not exclusively included more urban areas, including several areas in the North West and in London. In 2004, the EMA was extended nationwide across the rest of England (and also to Wales, Scotland and Northern Ireland). This roll-out was typically in more rural areas, although it also included several cities (Bristol, York, Leicester and Brighton) as well as the pilot control LAs, which were typically more urban.
Figure 2.1. Map of the roll-out of the Education Maintenance Allowance in England
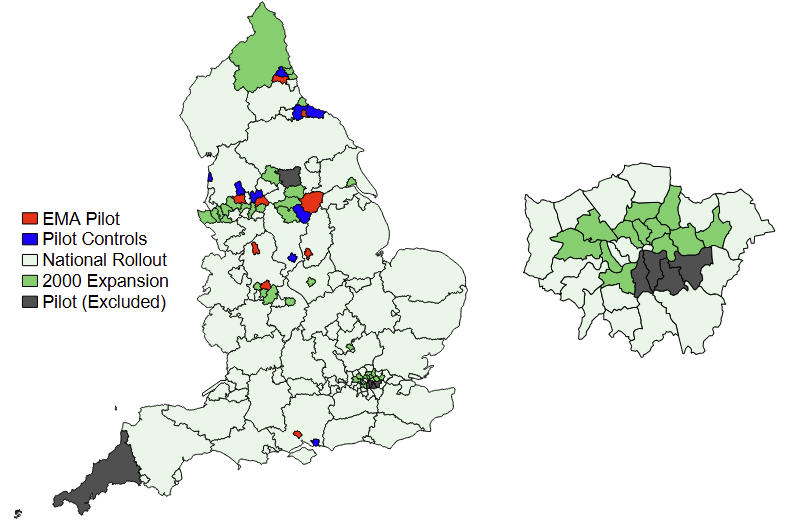
Note: Map of England’s local education areas, with London expanded to the right, by year in which the EMA was implemented. ‘Pilot (Excluded)’ indicates areas that received the EMA in 1999 but did not have direct control comparison areas and so were excluded from analysis of the pilot.
Following the 2004 national roll-out, all students in the country with parental income below £30,000 were eligible for the weekly stipend. While different variants of the EMA had existed from 1999 to 2004 (varying in payment amounts, income thresholds, achievement bonuses, and whether payments were received by the student or their mother across different areas), a uniform version paying students directly was implemented in 2004.4 The weekly stipend remained unchanged in nominal terms until the policy was abolished in England in 2011.5
3. Data and methods
We use a linked administrative dataset on school outcomes, earnings and criminal behaviour to compare the change in outcomes across cohorts either side of the national roll-out in English areas that received the EMA in the national roll-out and contrast this with the change in outcomes across cohorts over this period in areas that received the EMA earlier. This allows us to look at how the EMA affected outcomes such as post-compulsory education participation, short-run and long-run earnings, university attendance, and criminal behaviour during and after the period of EMA receipt. Unfortunately, these linked data are only available for those who attended secondary school in England, so we are not able to provide evidence on what happened in Wales, Scotland and Northern Ireland.
3.1 Data
We use two different sets of linked administrative datasets to estimate the effect of the EMA in the short and long run on educational outcomes, labour market outcomes and crime. To estimate the effects on education and labour market outcomes, we use the Longitudinal Educational Outcomes (LEO) dataset, which links school records of all state-educated children in England from the National Pupil Database (NPD) with separate administrative data from further education colleges and from universities, as well as administrative tax and benefits data. For the evaluation of the effect of the EMA on criminal outcomes, we use the Ministry of Justice’s NPD–PNC database, which links the NPD with criminal records from the Police National Computer (PNC).
School records from the NPD include data on results in national academic exams. These include the Key Stage 2 National Curriculum tests (commonly known as SATs), taken at age 11 by all state-educated students; GCSEs, taken at age 16 by all students; and A levels, taken at age 18 by some students. The NPD incorporates data on whether students remained in school after age 16. It also includes some demographic information on students. This includes month and year of birth, gender, ethnicity, first language, and special educational needs status.
The school records do not have any marker of eligibility for the EMA, so we focus our analysis on those who were eligible for free school meals in Year 11, a marker for which is available in the NPD. Eligibility for free school meals is generally determined by household receipt of certain benefits.6 Using the Family Resources Survey, we estimate that approximately 99% of those who were eligible for free school meals in the Spring Census in Year 11 would also have been eligible for the full EMA award in Year 12. Since those eligible for free school meals are typically from the lower end of the parental income distribution, our results should therefore be interpreted as the effect of the EMA on those from the bottom 15% of the parental income distribution (so roughly the bottom 40% of those who are eligible for the full EMA award). However, in practice, we do not find much evidence of impacts varying substantially between those eligible for free school meals and those who were eligible for the EMA but not eligible for free school meals.
Data on further education come from the Individualised Learner Record (ILR). This has data on whether a student was attending a further education college in each academic year. It also provides data on all the courses they studied, from which we can derive the level and type of qualification achieved. It also has information on whether students were taking courses on a full-time basis, or whether they were studying as part of a work-based learning scheme or other form of part-time education.7
Data on university education come from the Higher Education Statistics Authority (HESA). They include data on which university students attended, which degree classification they achieved and at what age they attended.
Administrative data from HMRC, the tax authority, are available covering both earnings and benefit receipt (taken from Department for Work and Pensions records). Tax data from HMRC include earnings from employment in each tax year for all individuals, allowing us to develop a picture of the earnings of students during and after education.8 They do not include data on other aspects of employment, such as hours or occupation, so we only use annual earnings as an outcome variable.
The data from HMRC also include information on individual benefit spells. This includes information on which benefit was received (such as jobseeker’s allowance), for how long it was received and whether it was an out-of-work benefit. This allows us to estimate the effect of the EMA on receipt of different benefits.
The Ministry of Justice’s NPD–PNC database links the NPD dataset described above with criminal records from the Police National Computer. The PNC contains individual-level records on crimes for which an individual is convicted in court, including, for each offence, details on the type of offence, the day of the offence and the punishment received.
Table 3.1 shows key summary statistics for our sample, divided by whether their area received the EMA before or during the national roll-out. We also include the summary statistics for a subsample of areas that we specifically match to each other, which we use for most outcomes. Broadly, FSM-eligible students had much lower attainment upon finishing Year 11, with less than 30% of them achieving five A*–C grades at GCSE, compared with over 50% across all students. Perhaps as a result of this, FSM-eligible students had much higher post-16 dropout rates than the wider population, with approximately 60% (compared with over 70%) of students continuing in full-time education after finishing their GCSEs. About 20% of former FSM-eligible students were not in any form of education or training and the rest were split between training and part-time education.
Table 3.1. Sample descriptives for FSM-eligible pupils, 2004 and 2005 GCSE cohorts
| Areas that received the EMA before 2004 | Areas that received the EMA in 2004 | All areas | ||
| Matched areas only, FSM | All areas, FSM | Matched areas only, FSM | All areas, FSM | All areas, all students |
Percentage of students: |
|
|
|
|
|
5 A*–C at GCSE | 25.3% | 30.0% | 24.1% | 26.0% | 53.4% |
5 A*–G at GCSE | 74.2% | 77.3% | 74.6% | 76.0% | 90.0% |
In full-time education, Year 12 | 55.9% | 60.9% | 55.6% | 57.9% | 71.3% |
Not in education or training, | 21.8% | 19.2% | 21.7% | 22.8% | 14.1% |
Earning over lower earnings limit, age 17 | 10.8% | 8.6% | 11.0% | 12.7% | 15.2% |
Receiving a criminal conviction, ages 16–18 | 7.1% | 6.4% | 7.6% | 6.7% | 3.3% |
Attending university by age 23 | 17.9% | 25.0% | 17.2% | 18.2% | 37.0% |
Total number of students | 30,075 | 80,705 | 23,495 | 73,525 | 1,107,160 |
Total number of LAs | 25 | 53 | 25 | 96 | 147 |
Note: Data cover cohorts turning 16 in the 2003–04 and 2004–05 academic years. The lower earnings limit was the minimum level of earnings necessary to count towards social security benefits – it was £4,108 in the 2004–05 tax year. These figures exclude Sunderland, Suffolk and Lancashire, each of which received a version of the EMA that included free transport but did not include weekly payments.
Source: Office for National Statistics.
Around one in ten FSM-eligible students earned above the lower earnings limit (LEL),9 from either part-time or full-time work, a lower rate than among those not eligible for free school meals. Around 7% of students received a criminal conviction between the ages of 16 and 18, a much higher rate of interaction with the criminal justice system than among those not eligible for free school meals. Meanwhile, fewer than a quarter of all FSM-eligible students attended university by the age of 23.
3.2 Methodology
Understanding the impact of the EMA on long-run outcomes poses a methodological challenge. We do not have data on cohorts involved in the original pilot, as our administrative data start with the cohort that finished their GCSEs in 2002, three years after the introduction of the EMA in the pilot areas, so we cannot exactly replicate the strategy of the pilot evaluations. Instead, we exploit the introduction of the EMA in areas that did not receive the programme until the national roll-out in 2004.
The national roll-out of the EMA creates an ideal setting for evaluating the policy using a cohort difference-in-differences design. This involves comparing changes in outcomes across cohorts in areas that first received the EMA in the national roll-out with the change in outcomes across cohorts in areas that had already had the EMA for several years. Because of the relatively large early roll-outs of the policy in 1999 and 2000, we have reassuringly large numbers of individuals in both the treated and control areas: roughly half the population of FSM-eligible school children in England lived in areas that first received the EMA in 2004, while the other half lived in areas that first received it earlier. We further boost our sample sizes by using two cohorts on either side of the national roll-out, meaning we compare the 2002 and 2003 GCSE cohorts with the 2004 and 2005 cohorts, across both early roll-out and national roll-out areas.
The underlying assumption in this strategy is that had the EMA not been introduced, the national roll-out areas would have experienced the same changes from cohort to cohort as occurred in the areas in which the EMA had already been introduced. Given this assumption, the differential change between the GCSE cohorts before and after the national roll-out among areas that did and did not receive the EMA that year can be interpreted as the effect of the EMA.10 To add to the credibility of this assumption, for most outcomes we do not use all LAs in England, but rather a selected subsample. This includes the 18 areas (nine from the pilot and nine control areas) that were used in the original pilot evaluation and an additional 32 areas (16 early receivers of the EMA and 16 later areas) that were matched to each other based on having similar characteristics. A full list of these areas can be found in Table A.1 in the appendix. We use as our main sample all FSM-eligible students in these 50 LAs.11 These areas appear to follow similar trends in the outcomes of interest after the introduction of the EMA. This provides support for our assumption that had the EMA not been introduced in the national roll-out areas, the two sets of areas would have experienced similar trends in outcomes from cohort to cohort.
We use this estimation method and sample for all outcomes except for crime. For crime, we use results from the sample of FSM-eligible students in all LAs in England, not just from the pilot and matched areas. This is because criminal convictions are relatively uncommon, reducing our statistical power, meaning we would only be able to detect very large effects on crime in the matched sample. There are two reasons why including all LAs is less concerning for crime outcomes than for other outcomes. First, criminal convictions were similarly common among FSM-eligible students across areas that received the EMA earlier and later, as can be seen in Table 3.1, so differential trends across areas seem less likely. Second, we can use an additional source of variation for crime, as we can observe criminal convictions relating to students younger than Year 12, before they became eligible for the EMA. Therefore, we can check our results against results obtained using a different empirical strategy relying on different assumptions.12
4. Results
4.1 Education decisions
Figure 4.1 shows the short-run effect of the EMA on the education choices of FSM-eligible students in Year 12, their first year of eligibility for the EMA and their first year after the end of compulsory schooling. It shows that the EMA significantly13 increased the number of students in full-time education, by around 2.5 percentage points. The increase mostly came via an increase in the number of students enrolled in vocational courses at further education colleges, rather than through an increase in those attending school sixth forms.
Figure 4.1. Effect of the EMA on education decisions in Year 12

Note: Black error bars represent 95% confidence intervals. NET stands for not in education or training.
Source: Authors’ calculations based on Office for National Statistics data.
The graph also shows the impact of the EMA on the share of individuals in other activities. Although these estimates are imprecise, we can use them to better understand what the people induced to stay in full-time education by the EMA would have done otherwise. Prior to the introduction of the EMA, roughly one-quarter of individuals were classified as not in education or training (NET). We do not observe any impact of the EMA on the proportion of students who were NET. When we break the effect down into NEET (not in employment, education or training) and full-time work, using the link between education and earnings data, we do not see a statistically significant effect on either outcome.14 Instead, most of the increase in full-time education appears to come from individuals who would otherwise have enrolled in training schemes, such as apprenticeships, or part-time education (with the remainder coming from individuals who would have been in full-time work), neither of which were eligible for the EMA.15 This suggests that while the EMA was effective in bringing students into full-time education, it mostly prompted students to shift between types of learning, rather than bringing them into education from inactivity.
Figure A.1 in the appendix shows the same results as Figure 4.1 but for Year 13. These effects are similar in direction to those for Year 12, but the increase in full-time education is smaller, at just over 1 percentage point, and is not statistically significant. Interestingly, there is a statistically significant increase in the share of NEET students of 1.7 percentage points, suggesting that less part-time work and training in Year 12 already translated into higher inactivity in Year 13.
These results are slightly different when we include all areas or only consider the pilot areas. Then, we do observe reductions in the NEET share in Year 12, of around 1 percentage point, suggesting that nearly half of the increase in full-time education was due to people who would otherwise have been NEET. This is offset to an extent (though not entirely) by corresponding increases in NEET rates in Year 13, which is consistent with a small overall impact on NEET rates.
4.2 Comparison with evaluations of the pilot phase of the EMA
As described above, the EMA was initially introduced in England through a pilot phase that began in 1999. The pilot was evaluated in a series of pilot studies commissioned by the UK government.16 Our results suggest much smaller effects of the EMA on full-time education participation than were found by these studies. For example, Dearden et al. (2009) found a 6.7 percentage point increase in full-time Year 12 participation among those eligible for the full EMA, and evidence of even larger effects in Year 13.
These differences do not seem to be explained by the specific areas the pilot was conducted in: we get similar effects when we run our analysis only on the nine pilot and nine control areas used in past analysis. Nor are they explained by our focus on students who are eligible for free school meals, rather than everyone who was eligible for the EMA: Figure 4.2 shows that the effects on education decisions for all students imply a similar size of effect for FSM-eligible students as for other EMA-eligible students, while Dearden et al. (2009) found the largest effects amongst the poorest groups.
Figure 4.2. Effect of the EMA on education decisions in Year 12: comparison of FSM-eligible and other students

Note: Black error bars represent 95% confidence intervals. Implied effect based on the assumption that 60% of all students have parents below the income threshold, and that the EMA had an effect proportional to the size of the award at all points of the income distribution within this group – it is calculated as (Effect on all students – Effect on FSM students × 0.15) / 0.35, where 0.15 is the proportion of the population eligible for FSM and 0.35 is the proportion of the population eligible for the EMA, reweighted according to the size of the award.
Source: Authors’ calculations based on Office for National Statistics data.
However, there are several other possible explanations. First, while we employ a difference-in-differences approach, the pilot evaluations did not measure differences within area across time, only cross-sectional differences across areas, which may be subject to bias.17 Second, the EMA may have become less effective between 1999 and 2004 because of the decreasing real value of the transfer due to the weekly payment being frozen in cash terms or because nationwide increases in education participation during this period left less room for the EMA to have an effect in later years. Third, the pilot estimates were quite imprecise, due to relatively small sample sizes of around 3,000 individuals. The estimated increase in participation of 6.7 percentage points had a standard error of 1.7 percentage points, implying a 95% confidence interval between 3.3 and 10.0. The lower end of this range is not far away from our own central estimate of a 2.5 percentage point increase in participation.
Finally, the survey data used in pilot evaluations may capture participation differently from our administrative data. On the one hand, survey responses could be influenced by the existence of the EMA itself, potentially biasing estimates upward, as students in EMA areas might be more likely to report full-time education courses they are taking. On the other hand, surveys might better capture actual engagement in education rather than just enrolment, and engagement might have been boosted by the EMA. This would be consistent with Dearden et al.’s (2009) finding that the majority of the increase in participation came from the NEET population, while we do not find this – this might be because the surveys were better at identifying the true activity of people who were technically enrolled on a course but who in reality were not attending.
4.3 Short-term earnings and crime
In addition to affecting educational choices beyond compulsory schooling, the EMA might also have affected other behaviours, including labour supply and criminal behaviour. While our data do not allow us to look at the effect on hours worked, we do observe the annual labour earnings of individuals at age 17, which can be interpreted as a proxy for hours worked at that age, under the assumption that there is very limited variation in hourly earnings among 17-year-olds.18
Figure 4.3 shows the estimated impact of the EMA on annual earnings of FSM-eligible students at age 17, across everyone and across only individuals in full-time education. We estimate the EMA reduced annual earnings by around £150. Since the average earnings of a 17-year-old in our population were around £2,200 per year, this equates to a roughly 7% reduction in earnings. One explanation is a reduction in labour supply for those now receiving an additional £30 per week. Another is a reduction in earnings due to students shifting away from training (where they earned a wage) to full-time education (where they had to work part-time to earn an income).
Figure 4.3. Effect of the EMA on mean annual earnings at age 17

Note: Black error bars represent 95% confidence intervals. Earnings expressed in 2023–24 prices. ‘Aged 17’ reflects the tax year in which every individual in the academic cohort was 17 years old at some point.
Source: Authors’ calculations based on Office for National Statistics data.
To test these different mechanisms, Figure 4.3 also shows the effect of the EMA on earnings for FSM-eligible individuals who were in full-time education. These fell by a similar amount – around £145 – and from a lower baseline, corresponding to more than a 10% fall in earnings because of the EMA. This suggests that the increase in income from the EMA reduced students’ labour supply, most likely because they have an additional source of income meaning they do not need to work so much, but also possibly because the attendance requirements of the EMA reduced working opportunities.19 The size of the impact was not nearly enough to fully counteract the value of the transfer: the £145 (or £90 in contemporary prices) reduction in earnings represents less than 10% of the amount a student could expect to receive in weekly transfers across the school year.
We also investigate whether the EMA affected criminal behaviour. It is plausible that it did because additional income may have disincentivised behaviour such as theft, due to reduced financial need. The attendance requirements of the EMA may also have had an ‘incapacitation effect’, whereby students have less time in which to commit crimes because they are in school or college.
Figure 4.4 shows the estimated effect of the EMA on criminal behaviour of FSM-eligible students from 16–18, the ages of EMA eligibility. We find some suggestion of a drop in convictions due to the EMA of around 2%, although these estimates are not statistically distinguishable from zero. As the error bars on the graph show, we would not be able to pick up an effect smaller than 5% as statistically significant, so we cannot rule out drops in crime on that scale. For thefts, we see effects even closer to zero. We see a hint of an increase in drug convictions, which would align with the theory that an increase in income might lead to an increase in drug buying, and thus drug crime, though this increase is also far from being statistically significant. Overall, there is some tentative evidence that the EMA slightly reduced criminal behaviour when young people received it, but it is not conclusive.
Figure 4.4. Effect of the EMA on crime at ages 16–18

Note: Black error bars represent 95% confidence intervals. The baseline proportion of 16- to 18-year-olds with a conviction is 4.3% per year. It is 1.7% for theft convictions and 0.4% for drugs convictions.
Source: Authors’ calculations based on Office for National Statistics data.
4.4 Qualifications
There are several reasons why the EMA might have improved the qualifications of its recipients. First, people deciding to stay in full-time education because of the EMA might go on to obtain qualifications they would not otherwise have received. Indeed, those additional qualifications may act as a gateway to achieving additional, higher-level qualifications, such as a university degree. Second, we might expect the EMA to allow people more time to focus on their studies. We have already seen that students work less alongside their education course, potentially giving them more time and energy to focus on their studies. The EMA also included strict attendance requirements. Although we are unable to directly study the impact of the EMA on attendance here, it is plausible that those requirements would increase attendance and that would improve learning and exam performance. Finally, any reductions in criminal behaviour might also pass through to improved academic performance.
Figure 4.5 shows the effect of the EMA on qualifications of different levels and types amongst FSM-eligible students. There is no evidence of an effect of the EMA on attainment of Level 2 qualifications (equivalent to getting an A*–C grade at GCSE) or Level 3 qualifications (equivalent to a pass at A level), and we can rule out effects larger than 1.5 percentage points. There is some evidence of an increase in the share of students achieving Level 1 qualifications, which comes from an increased share completing vocational qualifications considered equivalent to a D–G grade at GCSE.
Figure 4.5. Effect of the EMA on qualifications obtained from 16 to 23

Note: Black error bars represent 95% confidence intervals. The effects on Level 1, Level 2 and Level 3 qualifications represent the effect on the number of students for whom that is the highest qualification they receive.
Source: Authors’ calculations based on Office for National Statistics data.
These results are not statistically significant, but analysis including all areas (as opposed to the 50 matched areas only) for students eligible for free school meals does show significant effects on Level 1 qualifications (Britton et al., 2025). Therefore, it seems likely that some of the individuals the EMA shifted from being NEET to being in full-time education went on to achieve Level 1 qualifications, as those who would otherwise have been in work-based learning would likely have achieved a Level 1 qualification or above anyway. Meanwhile, those who switched into full-time education from part-time education or work-based learning do not appear to have gone on to achieve higher vocational qualifications.
Figure 4.5 also shows the effect of the EMA on achievement of specifically academic qualifications. Here the results are precisely zero – we see no effect of the EMA on the number of students passing at least two A levels.20 Given this, it is perhaps unsurprising that we see no effect of the EMA on university attendance.
4.5 Long-run labour market outcomes
Using the link in the data between education records and data on earnings and criminal convictions, we can also estimate the effect of the EMA on employment, earnings and criminal behaviour up until individuals reached their late 20s.
We start by showing the effect of the EMA on employment in the longer term. We do not directly observe hours worked, so we use two different measures of employment. The first is if individuals were earning above the lower earnings limit. This is significantly below the amount someone would earn if they worked full-time at the minimum wage, so this measure captures a large proportion of individuals with any positive earnings. The second measure is being in receipt of out-of-work benefits for six months in the year, denoting a sustained spell out of employment (though not all those who were not in work would be eligible for out-of-work benefits).
Figure 4.6 shows the effect of the EMA on both measures of employment from age 17 up to age 28 for FSM-eligible students. Similarly to Figure 4.3, we can see a significant drop in employment – as defined by the number of people earning over the LEL – in the short run, which might be explained by the increase in education participation. However, the drop in employment appears to continue beyond the point where we see significant impacts on education participation. In fact, the impact remains negative at every age right up to age 28, although the estimates are small (typically less than 1 percentage point) and are not statistically significantly different from zero after age 20.
Figure 4.6. Effect of the EMA on employment and benefit receipt by age

Note: Black error bars represent 95% confidence intervals. Individuals counted as receiving out-of-work benefits for more than six months of the year. The horizontal axis reflects an individual’s age on 31 August of a given tax year.
Source: Authors’ calculations based on Office for National Statistics data.
We see almost exactly the opposite pattern for receipt of out-of-work benefits. There are small and positive but statistically insignificant effects on this between ages 17 and 23, but these grow in magnitude and become statistically significantly positive – at around 1.5 percentage points, from a baseline of around 25% of the population – by people’s mid 20s. Again, these results are consistent with a small long-run fall in employment as a result of the EMA.
For those who were in employment, Figure 4.7 shows the effect of the EMA on earnings for FSM-eligible students.21 These are expressed in a log scale, approximating the percentage change in average earnings for those in work in each year. Similar to the estimates for employment, we see a small drop in earnings at most ages from 17 to 28, of around 1%, though in most cases the results are not statistically significant. When the effects on earnings are taken cumulatively from ages 20 to 28, we see a statistically significant drop in earnings of around 3.5% (at the 10% significance level) – capturing both the drop in annual earnings for those in work and the drop in the probability of being in work (see Britton et al. (2025) for this result).
Figure 4.7. Effect of the EMA on earnings by age

Note: Black error bars represent 95% confidence intervals. Effect on earnings conditional on earnings above the lower earnings limit. Effects are expressed in log points, which are a close approximation of percentage effects: a reduction of 0.02 log points in earnings represents a 2% drop in earnings. The horizontal axis reflects an individual’s age on 31 August of a given tax year.
Source: Authors’ calculations based on Office for National Statistics data.
Although these results are counter-intuitive, there are several possible explanations. First, the EMA seems to have discouraged part-time work alongside study. Although one might expect this to benefit students by allowing them more time to focus on their studies, it could also have a negative long-run impact, as part-time work has been shown to boost long-run employment prospects (Dustmann, Micklewright and van Soest, 2009). This channel is likely to be particularly important as it affects all students, not just the marginal students induced to stay in education as a result of the EMA.
Second, it is possible that one of the arguments behind the introduction of the EMA – that there were reasonably large numbers of students who would benefit a lot from staying in education beyond 16 but couldn’t due to financial constraints – was flawed. Instead, it could be the case that the students choosing to leave education at 16 did so because they knew they would not benefit from staying. In this case, the ‘marginal students’ induced to stay in education as a result of the EMA would only do so because the short-run benefits of receiving it outweigh the long-run costs they incur from staying in school.
Third, the EMA might have actually discouraged people from doing valuable activities alongside educational qualifications. We see that most of the increase in participation in full-time education came alongside a drop in the number of students in training. While these students obtained similar levels of qualifications in school or college to what they would have obtained in work-based training, it is possible that the training schemes provided students with better preparation for the labour market, perhaps because they took place within a working environment.22
4.6 Long-run crime outcomes
Figure 4.8 shows the effect of the EMA on crime amongst FSM-eligible students at ages 19–29. The estimates suggest that the EMA reduced the probability of receiving a conviction in each year by around 4%, a drop that is significant at the 10% level. There appears to be a similar drop in theft convictions – though, due to them being a rarer event, the confidence intervals are much wider. Meanwhile, there appears to be no positive or negative long-run effect on drug convictions.
Figure 4.8. Effect of the EMA on crime at ages 19–29

Note: Black error bars represent 95% confidence intervals. The baseline proportion of 19- to 29-year-olds with a conviction is 3.5% per year. It is 0.7% for theft convictions and 0.5% for drugs convictions.
Source: Authors’ calculations based on Office for National Statistics data.
The EMA appears to have had a persistent negative impact on criminal behaviour that extended into later life. This is most likely due to its initial impact on criminal convictions at ages 16–18, as students diverted from criminal activity at younger ages become less likely to commit crimes at older ages (consistent with Bell, Bindler and Machin (2018)). This could be attributed to a lack of criminal experience, whereby a reduction in crime at younger ages means people are less able – perhaps because they do not have the necessary networks, knowledge or confidence – to commit crimes at later ages, and so reduce their offending later on. An alternative explanation – that the EMA might have improved employment and earnings, which might then have reduced criminality – is less plausible given our finding that the EMA actually reduced employment and earnings.
5. The impact of the EMA by gender, SEN status and prior attainment
We now examine how the effects of the EMA vary across different subgroups of the population. We consider the differential effects of the policy across gender, special educational needs (SEN) status and prior educational attainment. The first outcome we consider is the effect on education choices in Year 12, which increased the number in full-time education by around 2.5 percentage points. As shown in Figure 5.1, this effect seems to have been stronger for boys than for girls: the increase for boys is over 3 percentage points, while for girls the effect is less than 2 percentage points. This aligns with the findings of Dearden et al. (2009), who also find a greater effect of the EMA among boys.
Figure 5.1. Effect of the EMA on Year 12 full-time education, by gender, SEN status and GCSE grades
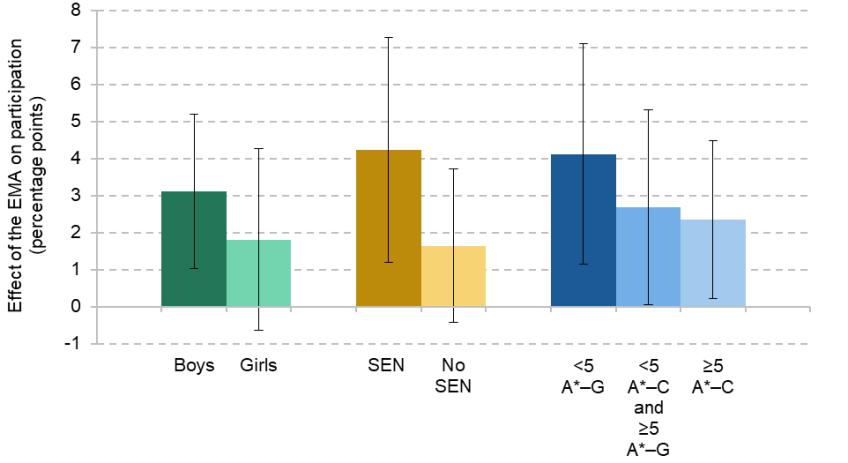
Note: Black error bars represent 95% confidence intervals. Students are marked as SEN if they were marked as having been assessed to have special educational needs in the School Census in Year 11.
Source: Authors’ calculations based on Office for National Statistics data.
The differential effects of the EMA are starker by SEN status: full-time participation increased by over 4 percentage points for SEN students (who made up around one-quarter of FSM-eligible students in this period). Meanwhile, those not assessed to have SEN only experienced an increase in participation of around 1.5 percentage points, which was not statistically significantly different from zero.
We also see much larger effects for those with the lowest prior attainment. Among those who did not achieve five grades of G or above at GCSE, participation in full-time education in Year 12 increased by more than 4 percentage points. This finding helps to explain our earlier result showing increases in Level 1 qualification achievement, as these were precisely the students who had not yet achieved a full Level 1 qualification by age 16.
In terms of short-run earnings, we also find important variation across subgroups (Figure 5.2). We again see larger effects for boys than for girls. This aligns with their participation response – boys saw bigger increases in full-time education, and thus larger drops in training, where they were more likely to earn significant amounts. In contrast, when we look by SEN status and prior achievement, we do not find the largest effects among those for whom the participation effects were largest. Non-SEN students saw drops of around £200, compared with only £50 (and not statistically different from zero) for SEN students, while those with the highest prior attainment (roughly 25% of the FSM-eligible population) experienced earnings reductions of £380, or 15% of their baseline level. Since we see relatively small effects on education choices among this group, the earnings reduction likely reflects reduced labour supply among those who would have been in full-time education even in the absence of the EMA. However, the time freed up did not translate into improved performance in A levels or equivalent vocational qualifications, perhaps because the additional free time was not devoted to activities that improve academic performance.
Figure 5.2. Effect of the EMA on earnings aged 17, by gender, SEN status and GCSE grades

Note: Black error bars represent 95% confidence intervals. Students are marked as SEN if they were marked as having been assessed to have special educational needs in the School Census in Year 11. Earnings expressed in 2023–24 prices.
Source: Authors’ calculations based on Office for National Statistics data.
There is also some heterogeneity across subgroups in criminal activity at ages 16–18, with greater evidence of a negative effect on crime for some specific subgroups. In Figure 5.3, we see drops in convictions of over 5% among students who obtained fewer than five A*–G grades at GCSE. This group also experienced one of the largest participation effects from the EMA, suggesting the increased education participation helped reduce criminal behaviour. These effects pass through to the long run, with significant drops in later-life criminal behaviour for those with poor prior attainment (see Figure A.2 in the appendix).
Figure 5.3. Effect of the EMA on criminal convictions aged 16–18, by gender, SEN status and GCSE grades

Note: Black error bars represent 95% confidence intervals. Error bars are much wider for girls and for those with higher prior attainment because the underlying rates of convictions are much lower. Students are marked as SEN if they were marked as having been assessed to have special educational needs in the School Census in Year 11.
Source: Authors’ calculations based on Office for National Statistics data.
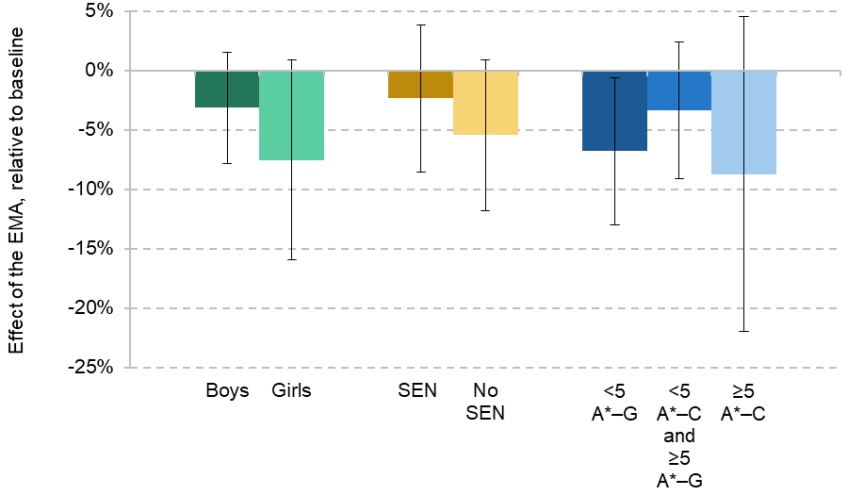
Finally, despite the substantial heterogeneity in short-run effects of the EMA, there is much less heterogeneity in the effect on long-run earnings (see Figure A.3 in the appendix).23 Boys experience smaller long-run effects than girls (though the differences are not statistically significant), and there is very little difference at all in the effect on long-run earnings by SEN status or prior attainment, despite very different participation effects. This suggests that while different groups responded to the EMA in different ways – with higher attainers reducing part-time work alongside study and lower attainers switching more from other activities – the various channels led to similarly negative labour market outcomes.
6. Cost–benefit analysis
In this chapter, we consider the costs and benefits associated with the Education Maintenance Allowance. All results are estimated as the costs and benefits of making the EMA available to students eligible for free school meals, as this group was the focus of our empirical analysis. The estimates can be thought of as the per-person costs and benefits of making the EMA available to the average FSM-eligible child, with both costs and benefits discounted to Year 12 values.24 We only include costs and benefits of the EMA that were realised by age 28.
The approach used (marginal value of public funds) divides the net private benefits (or costs) accruing to individuals as a result of the programme by the net costs of the programme to the government. The cost–benefit analysis is neutral between income arising to different groups of the population. A consequence of this neutrality is that no extra value is assigned to additional income arising to groups that would particularly benefit from this income in terms of reduced financial hardship or improved mental health.
6.1 Up-front costs
The primary cost to the government stems from the cost of the weekly transfers themselves. The average FSM-eligible student in full-time education could expect to receive £30 per week during term time if they attended their classes, plus additional end-of-term bonuses of £50 depending on attendance and achievement. We approximate this at £1,300 per year for those in full-time education. At the time of introduction, 55% of FSM-eligible students were in full-time education in Year 12, 40% in Year 13, and 25% in Year 14 (though only half of the students in full-time education in Year 14 would have been eligible for the EMA), meaning that the average FSM-eligible student would have received the EMA for 1.1 years, and thus the average spend per person by the government was approximately £1,400 (£2,230 in 2024 prices).
While this represented a cost to the government, it is important to emphasise that the EMA is a transfer, as the money is redistributed to young people from poorer households. Crucially, this means that – in contrast to many other spending programmes, in which the money is spent on services – the spending on the EMA by the government is almost entirely offset by equally-sized immediate financial benefit to individuals. The exception to this is administration costs, which were estimated at around 6% of the total cost, or around £150 per student.25
Given its effects in the short run, the EMA also increased the up-front costs of education, by bringing additional students into full-time education (our central estimate is that participation increased by 2.5 percentage points in Year 12 and 1 percentage point in Year 13). Per-pupil funding for students at further education colleges was around £6,200 per year in 2004 (in 2024 prices). We therefore estimate that the total cost of the additional students in full-time education in Years 12 and 13 averaged out at around £185 per FSM-eligible student (2024 prices). However, many of these students would otherwise have been in work-based learning, which also incurs costs for the government. Across Years 12 and 13, these reductions in work-based learning would have led to a saving of around £130 per FSM-eligible student, negating much of the increase in costs from increased full-time education. Unlike the EMA itself, this additional spending was not a direct transfer to students, and so we do not count this as a financial benefit for the recipients. Families of students brought into full-time education would also have continued to receive child tax credit and child benefit, an additional transfer of £130 per FSM-eligible student.
6.2 Labour market outcomes
We also consider costs both to the government and to the individual resulting from the shift in labour market outcomes. For the individual, the EMA led to a discounted drop in earnings of around £2,200 (in 2024 prices) per person from age 16 to age 28. However, around £500 of this drop was experienced between the ages of 16 and 19 when the individual was eligible for the EMA. It is best to interpret earnings reductions during the eligibility period differently from reductions experienced later in life. At ages 16 to 19, students who reduced their work hours were probably making an active choice to work less – the EMA allowed them to focus more time on their studies or other activities by providing an alternative source of income. The reduction in earnings thus reflects a voluntary substitution of work for other activities. In contrast, the drop in earnings between ages 20 and 28, which we estimate at approximately £1,660 per student, is unlikely to be explained by voluntary choices, as we do not find any evidence of any increased education participation during this period. Instead, this later reduction appears to reflect a loss of productivity in the labour market, representing a genuine cost to these individuals.
We might also expect there to be a reduction in taxes on income paid due to these lower earnings.26 On average, students who were FSM-eligible in school earned above the National Insurance threshold but below the income tax personal allowance during their 20s.27 As a simplifying assumption, we assume that revenue loss for the taxpayer comes entirely through reduced National Insurance contributions (both employee and employer). This leads to a reduction in the tax take of £430 per FSM-eligible student (2024 prices).28
Finally, we calculate the cost of the increase in out-of-work benefit take-up. In the average year, the EMA increased the use of out-of-work benefits for over six months by around 1 percentage point. In 2014–15, when our sample were in their mid 20s, jobseeker’s allowance (JSA) – the main out-of-work benefit – could be received for six months for a total payment of £1,960 (2024 prices). This means an additional discounted cost of around £175 per person per year to the exchequer for out-of-work benefits, which, like the EMA payments, represents a transfer to individuals in our sample.29
6.3 Crime outcomes
The effects of the EMA on crime generated savings both through reduced pressure on the criminal justice system and through reduced victimhood. The costs of offending to the criminal justice system are significant, particularly for young people, due to the cost of processing cases and offender management.30 Taking into account the cost of convictions between ages 16 and 29, we estimate that the EMA led to a saving of approximately £90 per FSM-eligible student (2024 prices).31
The benefits to potential victims were also substantial. These came through reductions in defensive expenditure, insurance costs, property stolen, physical and emotional harm, and lost output. Using the weighted average of costs to victims across all crime types, we estimate that the average crime for which someone receives a criminal conviction represents a cost to victims of approximately £3,200 (2024 prices).32 Including the total cost to victims adds an additional £120 per person of savings.
6.4 Comparison of costs and benefits
Table 6.1 shows the tally of costs to the government and private benefits of the EMA. Our findings suggest that the policy delivered only around 40 pence of benefits for every £1 of government spending. This is particularly disappointing given the EMA was primarily a direct cash transfer – even accounting for administrative costs and additional education spending, each £1 of government spending translated into close to 90 pence of immediate benefits to recipients. However, the negative long-run effects on earnings meant that much of this initial benefit was lost, while reduced tax receipts further increased the costs to government. These long-run effects substantially worsened the overall cost-effectiveness of the policy and were only partially offset by benefits through reduced crime.
Table 6.1. Costs to the government and private benefits of the EMA: FSM students, 2024 prices
Costs to the government per FSM student |
|
Up-front payments | +£2,230 |
Increase in full-time education | +£185 |
Decrease in work-based learning | –£130 |
Short-run increase in benefit payments | +£130 |
Administration costs | +£150 |
Reductions in taxes on income | +£430 |
Long-run increase in benefit payments | +£175 |
Costs of crime processing | –£90 |
Total | £3,080 |
Private benefits for an FSM student |
|
Up-front payments | +£2,230 |
Short-run increase in benefit payments | +£130 |
Change in long-run post-tax earnings | –£1,460 |
Long-run increase in benefit payments | +£175 |
Reduction in crime victimhood | +£120 |
Total | £1,195 |
Note: + indicates that the value represents an extra cost to the government or an extra private benefit to the individual. – indicates that the value represents a saving to the government or an extra cost to the individual.
7. Conclusion
This report summarises the findings from the first comprehensive evaluation of the long-run impact of the Education Maintenance Allowance, tracking outcomes into recipients’ late 20s. It is the first study to examine how this major educational intervention affected not just education participation, but also educational attainment, employment, earnings and criminal behaviour over the longer term.
Our findings draw primarily on students who were eligible for free school meals who lived in a subset of 50 local authorities in England and turned 16 in the mid 2000s. They paint a more nuanced picture of the EMA’s effectiveness than was suggested by evaluations of the pilot phase of the programme. The policy’s impact on education participation was notably smaller, increasing full-time participation by just 2.5 percentage points in Year 12 and by just 1 percentage point in Year 13, compared with estimates of 5 percentage points or more from the pilot evaluations. We find some evidence that the policy encouraged achievement of basic Level 1 qualifications, particularly among those who would otherwise not have been in education or training. However, we find no evidence that it encouraged achievement of more advanced qualifications or improved exam performance among students who would have attended school regardless of the EMA.
The policy’s long-run outcomes were similarly disappointing: we find drops in earnings of around 1% every year and suggestive evidence of worse employment outcomes and increased benefit receipt. Combined, we observe a drop in cumulative earnings between ages 20 and 28 of around 3.5% (statistically significant at the 10% level). We highlight reduced work experience as a key potential mechanism – our analysis suggests that students reduced their part-time work in response to receiving the EMA, and this appears to have harmed rather than helped their long-run labour market prospects. More positively, there is tentative evidence that the EMA reduced crime overall, with particularly pronounced (and statistically significant) negative effects for students with lower prior attainment.
Our cost–benefit analysis suggests the EMA delivered only around 40 pence of benefits for every £1 of government spending. This is particularly disappointing given that the EMA was a direct cash transfer to students – even though the money went straight to recipients, the negative effects on long-run earnings meant that much of this initial benefit was lost. While the policy was more effective at increasing education participation among certain groups – particularly boys, students with special educational needs and those with lower prior attainment – even these groups did not see improved long-run economic outcomes.
These findings have important implications for current policy debates. The EMA remains active in Northern Ireland, Scotland and Wales (it was replaced in England in 2011 by the more limited 16–19 bursary scheme). Our results highlight that the roll-out of the EMA in England in 2004 did not achieve its ultimate aim of improving the long-run outcomes of disadvantaged students, probably in large part because of the role it played in disincentivising training and work experience. While there are some crucial differences between the scheme in England and the EMA that is active today, our work provides crucial new evidence on the long-run cost-effectiveness of the policy, bringing into question whether it is the best use of limited resources in the devolved nations. Our findings suggest that approaches to reducing disadvantage gaps in post-16 education that support disadvantaged students while maintaining valuable work experience may prove more effective than financial incentives that encourage full-time education at the expense of work experience.
Appendix
Table A.1. EMA areas used in main estimation
Pilot | Pre-2004 areas | National roll-out areas |
| Walsall | Redcar and Cleveland |
| Doncaster | Rotherham |
| Gateshead | Newcastle upon Tyne |
| Bolton | Rochdale |
| Oldham | Blackburn with Darwen |
| Middlesbrough | Stockton on Tees |
| Southampton | Portsmouth |
| Stoke-on-Trent | Blackpool |
| Nottingham | Derby |
Matched | Pre-2004 areas | National roll-out areas |
| Ealing | City of London |
| Coventry | Croydon |
| St Helens | Enfield |
| Wirral | Dudley |
| Salford | Stockport |
| Tameside | Kirklees |
| Wigan | Derbyshire |
| Leeds | Durham |
| Wakefield | Darlington |
| North Tyneside | Slough |
| Luton | Plymouth |
| Leicester | Torbay |
| Halton | Thurrock |
| Worcestershire | Nottinghamshire |
| Cornwall | Cumbria |
| Northumberland | Isle of Wight |
Figure A.1. Effect of the EMA on education decisions in Year 13

Note: Black error bars represent 95% confidence intervals. NET stands for not in education or training.
Source: Authors’ calculations based on Office for National Statistics data.
Figure A.2. Effect of the EMA on criminal convictions aged 19–29, by gender, SEN status and GCSE grades
Note: Black error bars represent 95% confidence intervals. Error bars are much wider for girls and for those with higher prior attainment because the underlying rates of convictions are much lower. Students are marked as SEN if they were marked as having been assessed to have special educational needs in the School Census in Year 11.
Source: Authors’ calculations based on Office for National Statistics data.
Figure A.3. Effect of the EMA on earnings aged 20–28 by gender, SEN status and GCSE grades

Note: Black error bars represent 95% confidence intervals. Effects are expressed in log points, which are a close approximation of percentage effects: a reduction of 0.02 log points in earnings represents a 2% drop in earnings. Students are marked as SEN if they were marked as having been assessed to have special educational needs in the School Census in Year 11.
Source: Authors’ calculations based on Office for National Statistics data.
References
Ashworth, K., Hardman, J., Liu, W-C., Maguire, S., Middleton, S., Dearden, L., Emmerson, C., Frayne, C., Goodman, A., Ichimura, H. and Meghir, C., 2001. Education Maintenance Allowance: the first year: a quantitative evaluation. Department for Education and Employment, Research Report RR257.
Bell, B., Bindler, A. and Machin, S., 2018, Crime scars: recessions and the making of career criminals. Review of Economics and Statistics, 100(3), 392–404, https://doi.org/10.1162/rest_a_00698.
Bibby, D., Gorman, E., Thomson, D., Urwin, P. and Zhang, M., 2024. Post-16 pathways to employment for lower attaining pupils: are they working? Nuffield Foundation Report, https://ffteducationdatalab.org.uk/2024/03/post-16-pathways-to-employment-for-lower-attaining-pupils-are-they-working/.
Britton, J., Ridpath, N., Villa, C. and Waltmann, B., 2025. Short- and long-run effects of paying disadvantaged teenagers to go to school. IFS Working Paper 25/06, https://ifs.org.uk/publications/short-and-longer-term-effects-paying-disadvantaged-teenagers-go-school.
Cavaglia, C., McNally, S. and Ventura, G., 2020. Do apprenticeships pay? Evidence for England. Oxford Bulletin of Economics and Statistics, 82(5), 1094–134, https://doi.org/10.1111/obes.12363.
Dearden, L., Emmerson, C., Frayne, C. and Meghir, C., 2009. Conditional cash transfers and school dropout rates. Journal of Human Resources, 44(4), 827–57, https://www.jstor.org/stable/20648921.
Dustmann, C., Micklewright, J. and van Soest, A., 2009. In-school labour supply, parental transfers, and wages. Empirical Economics, 37, 201–18, https://doi.org/10.1007/s00181-008-0230-1.
Heeks, M., Reed, S., Tafsiri, M. and Prince, S., 2018. The economic and social costs of crime: second edition. Home Office, Research Report 99, https://assets.publishing.service.gov.uk/media/5b684f22e5274a14f45342c9/the-economic-and-social-costs-of-crime-horr99.pdf.
HM Treasury, 2024. The Green Book: appraisal and evaluation in central government. https://www.gov.uk/government/publications/the-green-book-appraisal-and-evaluation-in-central-government.
Middleton, S., Maguire, S., Ashworth, K., Legge, K., Allen, T., Perren, K., Battistin, E., Dearden, L., Emmerson, C., Fitzsimons, E. and Meghir, C., 2003. The evaluation of Education Maintenance Allowance pilots: three years evidence: a quantitative evaluation. Department for Education and Skills, Research Report RR499.
Middleton, S., Perren, K., Maguire, S., Rennison, J., Battistin, E., Emmerson, C. and Fitzsimons, E., 2005. Evaluation of Education Maintenance Allowance pilots: young people aged 16 to 19 years: final report of the quantitative evaluation. Department for Education and Skills, Research Report RR678.
National Audit Office, 2011. The cost of a cohort of young offenders to the criminal justice system. https://www.nao.org.uk/wp-content/uploads/2010/12/1011663_technical_paper.pdf.
OECD, 2004. Education at a Glance 2004: OECD Indicators.https://doi.org/10.1787/eag-2004-en.
Sabates, R. and Feinstein, L., 2008. Effects of government initiatives on youth crime. Oxford Economic Papers, 60(3), 462–83, https://www.jstor.org/stable/25167701.
Data
Department for Work and Pensions, NatCen Social Research. (2021). Family Resources Survey. [data series]. 4th Release. UK Data Service. SN: 200017, DOI: http://doi.org/10.5255/UKDA-Series-200017.
Acknowledgements
The authors would like to thank seminar participants at IFS, the University of York, the Workshop of Education Economics and Policy at NTNU, the Economics of Education Workshop at the University of Oslo, and the Workshop of Family and Labour Economics at York. They also thank Paul Bolton, Frank Bowley, Matt Dickson, Parminder Kaur, Sue Maguire, Sandra McNally and Huw Morris for comments through our Advisory Group.
The authors gratefully acknowledge the support of the ESRC Centre for the Microeconomic Analysis of Public Policy (grant ES/T014334/1) and funding from the Nuffield Foundation (grant EDO/FR-000023448). The Nuffield Foundation is an independent charitable trust with a mission to advance social well-being. It funds research that informs social policy, primarily in Education, Welfare, and Justice. The Nuffield Foundation is the founder and co-funder of the Nuffield Council on Bioethics, the Ada Lovelace Institute and the Nuffield Family Justice Observatory. The Foundation has funded this project, but the views expressed are those of the authors and not necessarily the Foundation.
Bluesky: @nuffieldfoundation.org
X: @NuffieldFound
LinkedIn: Nuffield Foundation
Website: nuffieldfoundation.org
This work contains statistical data from the Office for National Statistics (ONS), which are Crown Copyright. The use of the ONS statistical data in this work does not imply the endorsement of the ONS in relation to the interpretation or analysis of the statistical data. This work uses research datasets which may not exactly reproduce National Statistics aggregates. The work was carried out in the Secure Research Service, part of the Office for National Statistics.
The views and analysis presented in this report are those of the authors, as are any errors or omissions.
Endnotes
Authors

Jack Britton
Jack's main interests lie in human capital accumulation and discrete choice dynamic modelling.

Nick Ridpath
Nick joined the IFS in 2023 and works in the Education and Skills sector, focusing on the long-run impacts of education policy.

Carmen Villa
Carmen is a Research Associate at IFS and an Assistant Professor at the University of Zurich and the Jacobs Centre for Productive Youth Development.

Ben Waltmann
Ben's main research areas are tax and social protection in developing countries, higher education, and dynamic discrete choice models.
More from IFS
Understand this issue


Policy analysis


Academic research


