
Downloads
Download the report as PDF
PDF | 921.27 KB
Executive summary
This report uses administrative data to examine the rise in the number of young people not in employment, education or training (NEET) in recent years. It shows trends in payrolled employment and out-of-work benefit claims, both overall and by subgroup, and compares them with trends in the Labour Force Survey – the official source of NEET statistics, but one which has faced well-documented challenges with response rates in recent years. The report considers whether the recent rise in NEET rates reflects a cyclical downturn in labour demand, or whether there may be structural changes in the economy that specifically affect young people. Finally, it focuses on one widely discussed structural factor – the rise in minimum wages for young people – and assesses what we can learn about its impact on youth employment.
Key findings
- Administrative data point to a fall in youth labour market participation in recent years. In the three years to December 2025, the share of 16- to 24-year-olds in payrolled employment fell by 4.3 percentage points, from 54.9% to 50.6%. This is approaching the 5.4 percentage point fall in youth employment seen over the financial crisis (after accounting for the downward trend in employment in the years leading up to 2008) and the 6.5 percentage point fall over the COVID-19 pandemic. Compared with other OECD countries, the UK has historically had high youth employment rates, but one of the lowest shares of 18- to 24-year-olds in education.
- The share of 18- to 24-year-olds claiming out-of-work benefits increased by 1.4 percentage points to 10.9%, just over half (0.8 percentage points) of which was due to inactivity-related benefits with no work search requirements. The administrative data broadly corroborate the official rise in NEET rates from 10.8% in 2022 to 12.8% at the end of 2025 based on the Labour Force Survey.
- Administrative data show a widespread fall in labour market participation across regions. Payrolled employment fell by at least 3 percentage points in 8 out of the 12 NUTS1 regions of the UK, including by 4 percentage points in London. The share of 18- to 24-year-olds claiming out-of-work benefits increased across regions, though the composition of benefits varied, with inactivity-related benefits accounting for a larger share of the increase in Northern regions, Scotland and Wales.
- Payrolled employment fell most for the youngest and oldest youths between 2022 and 2025: by 7.3 percentage points for 16- and 17-year-olds, likely reflecting at least in part a fall in casual work alongside studies, and by 4.8 percentage points for 22- to 24-year-olds. The change for those aged 18–21 was more muted (a 1.1 percentage point fall). However, 18- to 20-year-olds saw a slightly larger rise in out-of-work benefit claims than older youths – 9.4% of 18- to 20-year-olds claimed out-of-work benefits in 2025, up from 7.2% in 2022.
- There are reasons to believe that the recent rise in NEET rates is not entirely cyclical. NEET rates are higher than we would expect given the historical relationship between NEET rates and adult (25–64) employment and unemployment rates. Moreover, changes in youth and adult employment rates across regions are not very strongly correlated, contrary to what we would expect for a purely cyclical decline in the economy. This suggests that NEET rates may not return to previous levels without specific policy interventions.
- We consider several potential structural causes of the increase in the NEET rate. One widely discussed structural factor is the recent rise in youth minimum wage rates. The data available do not allow us to confidently say one way or the other whether minimum wages have had a sizeable effect on employment, but our central estimates suggest that it is likely that other structural factors are playing a role.
- The rises in the NEET rate have been similar for university graduates and for non-graduates entering the labour market, cutting against the idea that AI is having a disproportionate impact on entry-level graduate jobs (though AI could be weighing on employment across the board).
- The recent increase in employer National Insurance contributions (NICs) has been flagged as another potential driver of rising NEET rates, since it is most significant for low earners. But under-21s are largely exempt, and the decline in employment among older youths began at the end of 2022 – two years before the NICs reform was announced – so it is unlikely to be the primary cause.
1. Introduction
The share of young people not in education, employment or training (NEET) has become a recent political priority. After a sustained fall for more than a decade, the NEET rate started to rise after the pandemic, increasing by 1.8 percentage points (17%) between 2022 and 2025 (Figure 1). In the latest data, for the fourth quarter of 2025, 12.8% of 16- to 24-year-olds were NEET, similar to the share in 2015.
Figure 1. Share of 16- to 24-year-olds not in education, employment or training (NEET)
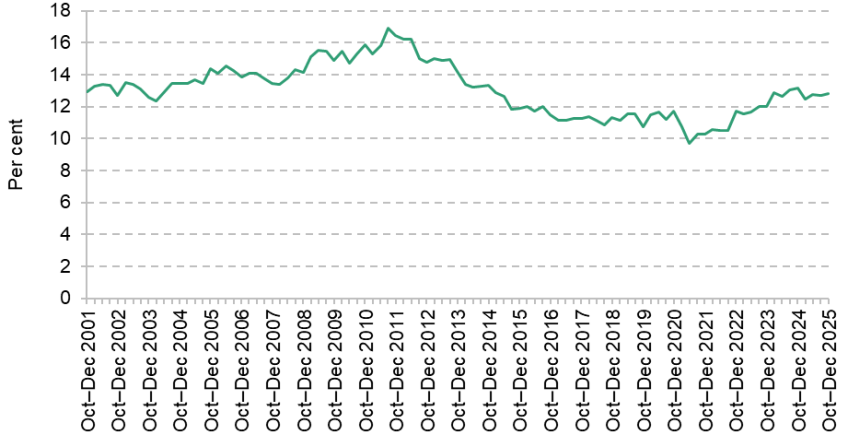
Note: Seasonally adjusted. Quarterly data.
Source: Office for National Statistics NEET series. Estimated using the Labour Force Survey.
The government has introduced a host of policies to increase youth labour market participation, including introducing and expanding a Youth Guarantee of employment for long-term benefit claimants (Department for Work and Pensions, 2025a); making reforms to apprenticeships (Department for Education, 2026a); and introducing flexibility to slow down the pace of aligning youth minimum wage rates with the adult minimum (Low Pay Commission, 2026). Other policies have been proposed – for example, restricting health-related incapacity benefits for under-22s (Department for Work and Pensions, 2025b). An independent review of NEET rates, led by Alan Milburn, has been commissioned.
However, analysis on NEETs tends to be based on the Labour Force Survey (LFS), which faces a number of challenges. The survey saw a large fall in response rates after the pandemic, reaching a low of 13% in mid 2023 (Office for National Statistics, 2026a) – shortly after the NEET rate started to climb – and has been shown to diverge from other labour market sources in recent years. And, quite apart from concerns about reliability, the LFS is simply too small to examine the problem in any level of detail. This makes it difficult to conduct subgroup analysis – for example, by age and geography – that would help unpack the potential causes of the rise.
This report examines trends in and potential drivers of the recent rise in NEET rates, supplementing LFS analysis with data from administrative sources. The available administrative data do not allow us to measure NEET status directly: linked data on education and employment (the Longitudinal Education Outcomes dataset) are more than four years out of date, and other datasets do not capture the overlap between education and employment. We therefore consider payrolled employment and out-of-work benefit claims as two alternative measures of youth labour market participation. These indicators can be thought of as proxies for the NEET rate: the former captures people who are definitely not NEET, and the latter is a subset of all NEETs (since not all NEETs are eligible for or claim out-of-work benefits).
International context on education and employment
The UK has for some time had low levels of education participation compared with other countries. In 2019 – before the pandemic and the recent rise in NEET rates – the share of 18- to 24-year-olds in education in the UK was the sixth-lowest among OECD countries, and lower than in all other European countries (Figure 2). Historically, higher youth employment in the UK compensated for lower education participation, so that overall NEET rates were middling by OECD standards. However, in recent years, youth employment has fallen, taking us down the international NEET league table. OECD statistics show that the vast majority (84%) of the 2.5 percentage point increase in the 18–24 NEET rate in the UK between 2019 and 2024 was due to a fall in the share of young people in work and not in education (OECD, 2025).
Figure 2. Share of 18- to 24-year-olds by labour market status, 2019
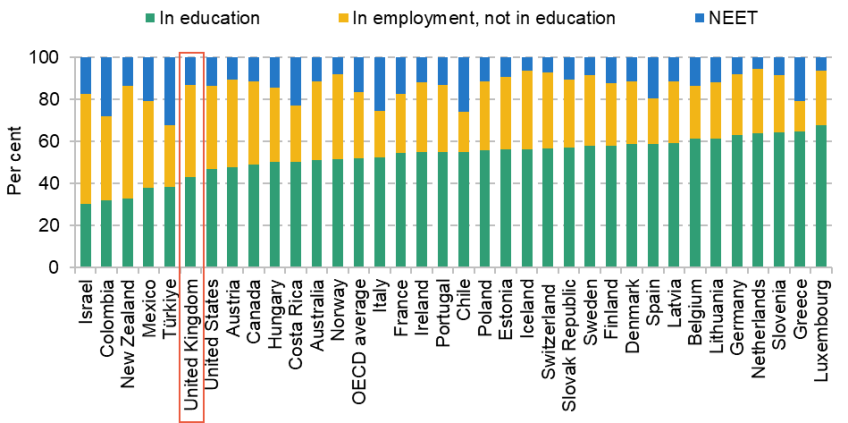
Note: Data for Chile refer to 2018. Data usually refer to the first three months of the calendar year, but in some countries to the second. Education includes vocational education.
Source: OECD Education at a Glance 2025.
This report focuses on the recent rise in the NEET rate. Given that this has been driven by changes in labour market participation rather than participation in education, we focus on the former. However, it is worth acknowledging that reducing the NEET rate could also be done through raising education participation, which would bring the UK closer to our European counterparts.
The report is structured as follows. Section 2 documents the decline in youth labour market participation in recent years using data on payrolled employment and out-of-work benefit claims, comparing trends in these administrative datasets with trends in the Labour Force Survey. It then uses the administrative data to examine how changes have differed across subgroups, specifically by age and region. Section 3 considers whether the recent rise in NEET rates is likely to be purely cyclical – reflecting a downturn in labour demand – or whether there is evidence for structural changes that are specific to young people. Section 4 assesses the role of one potential structural factor: the large real-terms increases in youth minimum wage rates since 2024. Section 5 concludes.
This report is part of a wider programme on NEETs at IFS, using large-scale datasets to study trends in and drivers of NEET rates. This includes future work on youth employment transitions using the Registration and Population Interaction Database (RAPID) and on the role of mental health in driving NEET rates using Next Steps and the Millennium Cohort Study.
2. Trends in youth labour market participation using administrative data
The official NEET statistics are based on the Labour Force Survey (LFS), which has faced well-documented challenges since the pandemic. Response rates fell sharply, reaching a low of 12.7% in mid 2023 – shortly after the NEET rate started rising (Office for National Statistics, 2026a). Since then, the Office for National Statistics (ONS) has taken various measures to improve sample sizes, response rates and its weighting methodology. However, there are still concerns around the quality of LFS data, which remain badged as ‘official statistics in development’ rather than ‘official statistics’.
Moreover, changes to survey methods make comparisons over time in the LFS unreliable. Movements in the data are likely to reflect not just real changes in the labour market, but also changes in how the survey is run. The latest ONS LFS quality update in April 2026 states that ‘caution is still advised when assessing change over time periods’ (Office for National Statistics, 2026b). Recent trends in total employment in the LFS have diverged from other labour market sources, including payroll data and the ‘workforce jobs’ data based on business surveys (Francis-Devine and Powell, 2026).
Quite apart from these worrying discrepancies, the LFS is simply too small to examine the problem in any level of detail. There were just over 4,500 16- to 24-year-olds in the survey and around 450 NEETs in the last quarter of 2022, when NEET rates started to climb. This makes it difficult to reliably conduct analysis by subgroup – for example, by age and geography – which would help to identify where the rise has been greatest and test hypotheses on the potential causes of the rise.
In this section, we supplement LFS analysis using two administrative data sources: payroll statistics from HMRC’s Pay As You Earn (PAYE) Real Time Information system, obtained through a Freedom of Information (FOI) request, and data on out-of-work benefit claimants from the Department for Work and Pensions (DWP). The payroll data exclude self-employed workers, but self-employment is rare among 16- to 24-year-olds (see footnote 3). We use official population estimates and projections from the ONS to convert these into the share of 16- to 24-year-olds who are in payrolled employment and the share claiming out-of-work benefits. As discussed in the introduction, these measures can be thought of as proxies for the NEET rate: the former is a subset of people in education, employment or training (that is, not NEET) and the latter is a subset of people who are NEET.
We start by assessing whether the fall in youth labour market participation since 2022, documented in the LFS, is supported by our administrative datasets. We then use the administrative data to examine how changes have differed across subgroups, focusing on age and geography.
Trends in youth labour market participation using administrative data
The share of 16- to 24-year-olds in payrolled employment fell by 4.3 percentage points in the three years to December 2025
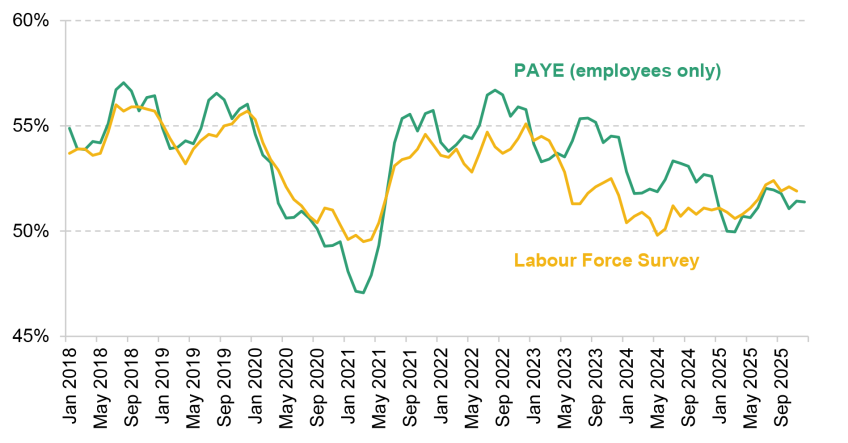
Figure 3 shows the share of 16- to 24-year-olds in payrolled employment between 2018 and 2025, adjusted for seasonality.1 In 2022, around 55% of young people were in payrolled employment, similar to levels seen before the pandemic. Employment started to decline around the end of 2022, falling by 4.3 percentage points between December 2022 and the latest data in December 2025. This is a very large decrease – for context, youth employment fell by 6.5 percentage points over the COVID-19 period and by around 5.4 percentage points over the financial crisis after accounting for the fact that youth employment was already on a negative trend prior to the financial crisis.2 By the end of 2025, payrolled employment rates had returned to levels seen in June 2020, towards the end of the first COVID lockdown.
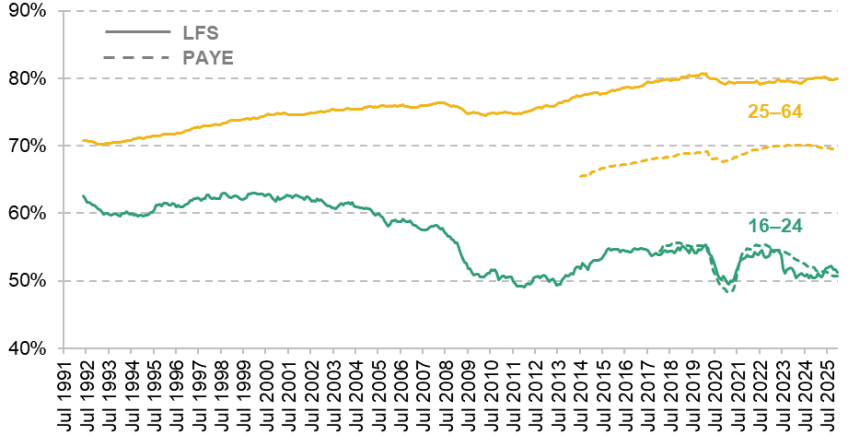
Figure 3. Share of 16- to 24-year-olds in employment
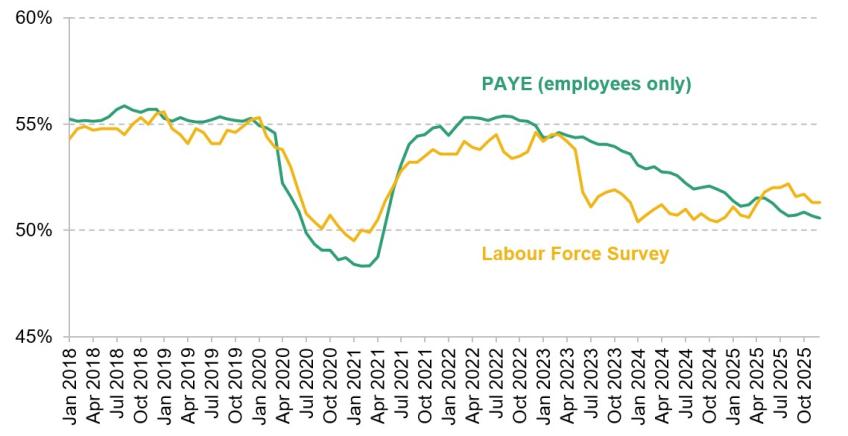
Note: Seasonally adjusted. Unadjusted data are shown in Figure A1 in the appendix. LFS series shows three-month averages. PAYE series does not include the self-employed.
Source: ONS LFS series AIVZ, FOI PAYE statistics and population estimates and projections.
For comparison, Figure 3 also shows employment rates for 16- to 24-year-olds in the LFS. The definitions of employment are slightly different between the two series; most notably, PAYE excludes the self-employed.3 Nonetheless, the two series track one another fairly closely up to the end of 2022. Both show falls in youth employment starting around 2022–23 of a similar magnitude up to the start of 2025 – though the LFS shows a sharp fall rather than a gradual decline.
The LFS records a recovery in youth employment in 2025 that is not seen in payroll data. However, this discrepancy is unlikely to have materially affected estimates of NEET rates. The majority (71%) of the 1.2 percentage point recovery in LFS employment between 2024 and 2025 was due to people who were both studying and working, meaning that they would already have been classified as non-NEET due to their education participation.4 As such, the administrative payroll data broadly support the rise in NEET rates observed in the LFS.
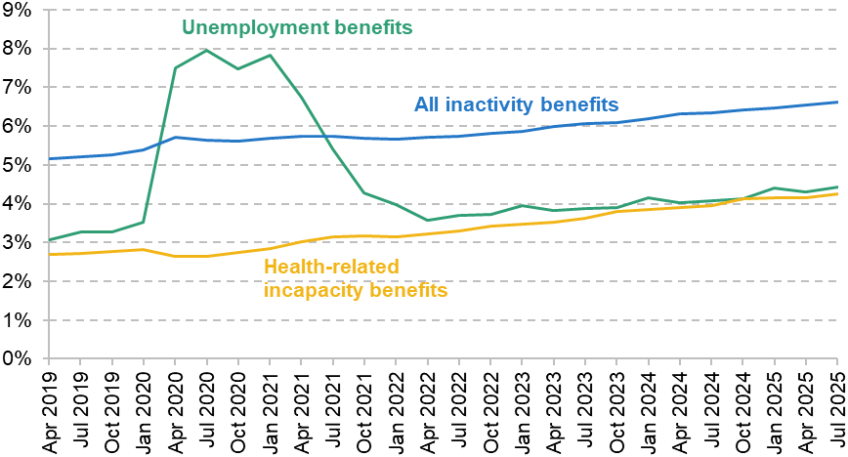
The share of 18- to 24-year-olds claiming out-of-work benefits increased by 1.4 percentage points, of which 0.6 was due to unemployment benefits
Figure 4 plots the change in the share of young people claiming out-of-work benefits between 2022 and the latest data in 2025.5 Because most 16- and 17-year-olds are not eligible for means-tested benefits, we focus on young people aged 18–24. We distinguish between unemployment benefits (out-of-work benefits with work search requirements), ‘inactivity benefits’ (out-of-work benefits without work search requirements) and health-related incapacity benefits (a subset of inactivity benefits).6 In each case, corresponding LFS measures are plotted for comparison: the share who are NEET and unemployed, inactive, and inactive due to long-term health conditions.
Figure 4. Share of 18- to 24-year-olds claiming out-of-work benefits in administrative data and NEET rate in the Labour Force Survey, 2022 and 2025
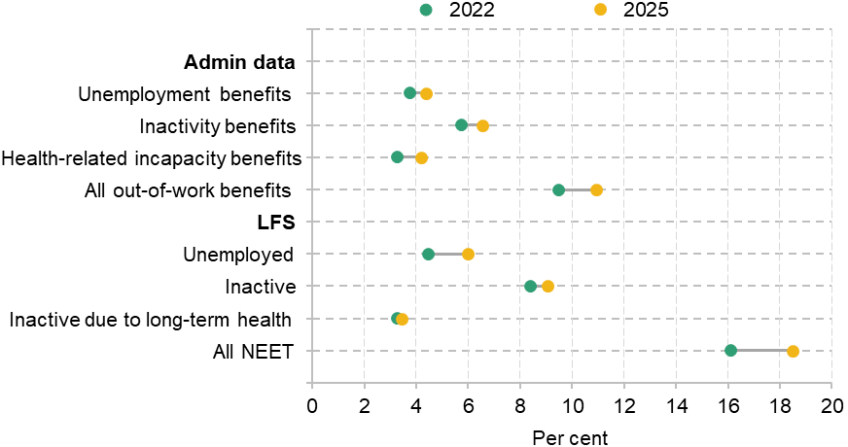
Note: Not seasonally adjusted. Benefits series are for Great Britain only. Both LFS and benefits data refer to averages for calendar year 2022. The benefits data are averaged over the first three quarters of 2025, whilst LFS data are averaged over all four quarters.
Source: ONS quarterly NEET statistics, authors’ analysis of LFS and DWP Stat-Xplore and population estimates and projections.
The share of 18- to 24-year-olds claiming any out-of-work benefit increased by 1.4 percentage points in the three years leading up to 2025, of which just under half (0.6 percentage points) was due to unemployment benefits. The share claiming health-related incapacity benefits went up by 0.9 percentage points. There was a small (0.1 percentage point) fall in the share claiming inactivity benefits not related to health.
The increase in the share of 18- to 24-year-olds claiming out-of-work benefits is smaller than the 2.4 percentage point increase in the LFS NEET rate for this age group. This is not surprising: some NEETs are not eligible for out-of-work benefits (e.g. migrants with no recourse to public funds), and not everyone who is eligible for benefits claims them. Combining the claimant and NEET rates would imply that roughly 60% of NEETs were claiming out-of-work benefits in 2022. If this proportion remained constant, a 1.4 percentage point rise in out-of-work benefit claimant shares would correspond to a 2.4 percentage point increase in the NEET rate – the same as the increase observed in the LFS.
Changes in labour market participation by age and region
The analysis above suggests that the rise in NEET rates documented in the LFS is broadly supported by administrative data. However, sample sizes in the LFS are too small to move beyond aggregate changes: estimates by age and region are extremely noisy, as shown in Figures A3 and A4 in the appendix. This section uses the administrative data to document changes by subgroup, to identify where the fall in participation has been most severe and potentially help target policy solutions.
Payrolled employment fell most for the youngest and oldest youths, but benefit claims increased most among 18- to 20-year-olds
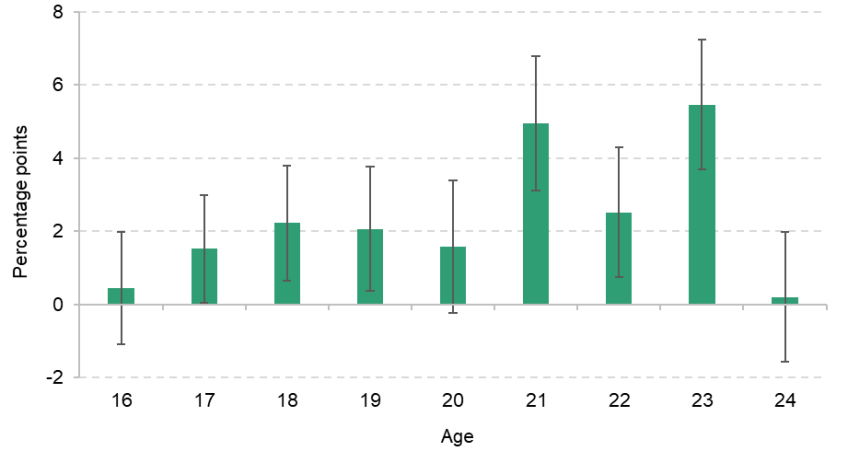
We start by looking at variation by age. Figure 5 plots the change in payrolled employment rates between 2022 and 2025 by single year of age. Employment declined by 4.8 percentage points among 22- to 24-year-olds, whilst 16- and 17-year-olds saw even bigger drops of 7.3 percentage points on average. By contrast, changes were much smaller for those aged 18–21 (a 1.1 percentage point decline).
The fall in payrolled employment among 16- and 17-year-olds is unlikely to be driven by a rising share studying instead of working. The latest administrative data from the Department for Education show that the share of 16- and 17-year-olds in full-time education or apprenticeships increased by only half a percentage point between 2022 and 2024 (Department for Education, 2025).7 That said, the fall in payrolled employment does not necessarily imply a rise in NEET rates for this group. The vast majority of 16- and 17-year-olds are in full-time education (84% in 2024),8 so it may reflect a decline in weekend jobs or other casual work alongside studies. Indeed, Figure A3 in the appendix shows that the LFS does not capture a marked rise in NEET rates for this group, though estimates are very noisy.
The fall in employment among 22- to 24-year-olds is consistent with widespread reports of a challenging job market for university graduates entering the labour market (Financial Times, 2026). However, it does not necessarily imply that graduates are disproportionately hit compared with other labour market entrants; we return to this question in Section 3. One natural hypothesis is that the fall for those aged 21 and over is driven by the recent rise in employer National Insurance contributions (NICs) in April 2025, which impacts low earners more than higher earners, but largely does not affect under-21s. However, the timing of the fall does not map onto the timing of the NICs reform. As shown in Figure A5 in the appendix, employment rates at each of the affected ages (21–24) declined gradually from the end of 2022, with no obvious changes in trend in October 2024, when the NICs reform was announced, or in April 2025, when it was implemented.
Figure 5. Change in PAYE employment rate by age, 2022 to 2025
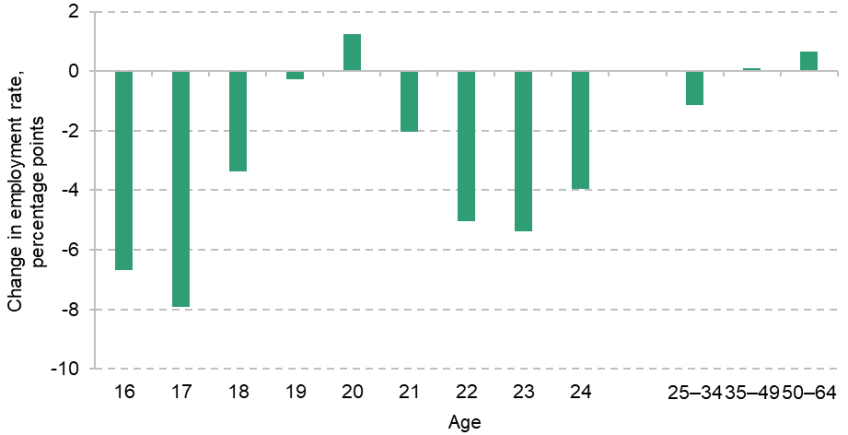
Note: Averages across all months in a year.
Source: FOI PAYE statistics and population estimates and projections.
Benefits data show a different age profile. Excluding 16- and 17-year-olds, who are mostly ineligible for universal credit, there has been a fairly even increase in the share claiming health-related incapacity benefits across all ages 16–24, of around 1 percentage point between 2022 and 2025 (Figure 6). Increases in unemployment benefit receipt are concentrated among 18- to 20-year-olds. Non-health-related inactivity benefits also rose slightly for this group whilst declining among older youths. As a result, the overall claimant rate for 18- to 20-year-olds has risen by 2.2 percentage points over the last three years, compared with 0.9 percentage points for 21- to 24-year-olds.
Figure 6. Change in rates of claiming out-of-work benefits by age, 2022 to 2025
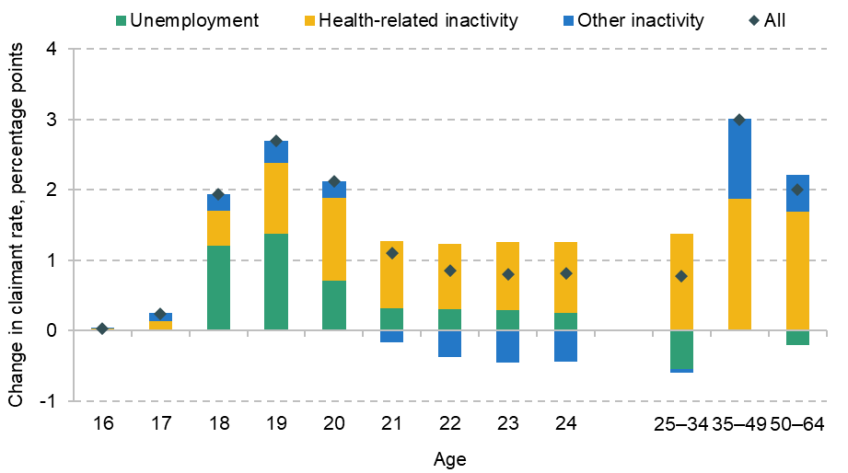
Note: Averages across all quarters of 2022 and across the first three quarters of 2025. Increases in ‘other inactivity’ benefits for older adults may reflect migration onto universal credit, for people who previously only claimed child tax credit or housing benefit.
Source: DWP Stat-Xplore.
It is not straightforward to reconcile the fact that 19- and 20-year-olds saw a rise in out-of-work benefit claims with no fall in payrolled employment. It is unlikely to reflect people moving out of education, or at least higher education – the latest data from the Department for Education show that higher education participation at age 20 increased by 2 percentage points between 2022 and 2024 (Department for Education, 2026b). Possible explanations include increases in part-time work alongside studies offsetting falls in employment for non-students, changes in the benefit eligibility of NEETs9 and changes in benefit take-up.
Administrative data show a widespread fall in youth participation across regions
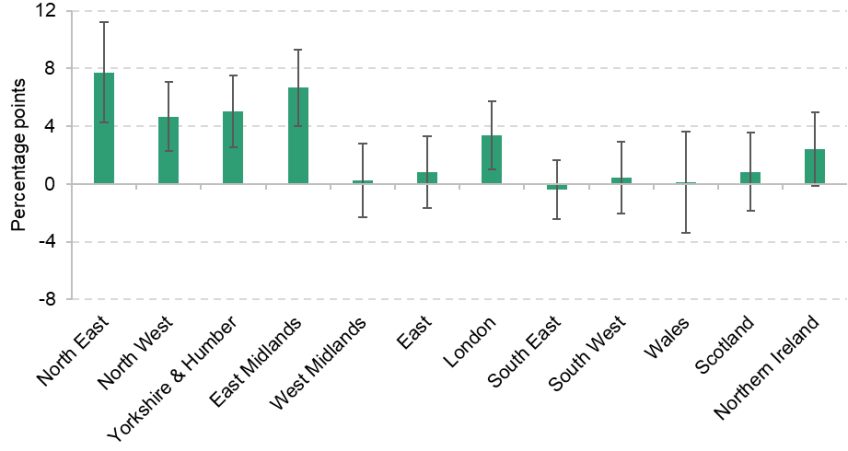
We now turn to how the decline in youth labour market participation varies across regions. Again, we focus on 18- to 24-year-olds to make changes in payrolled employment and benefit claims more comparable, since 16- and 17-year-olds are not generally eligible for means-tested benefits. Figure 7 plots the change in the share of 18- to 24-year-olds in payrolled employment by (NUTS1) region between 2022 and 2025, whilst Figure 8 plots changes in out-of-work benefit claims.
Figure 7. Change in PAYE employment rate by region, 2022 to 2025, 18- to 24-year-olds
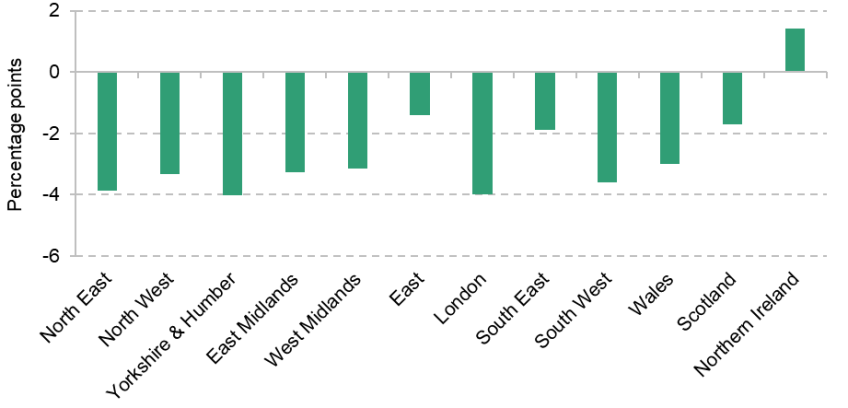
Note: Averages across all months in a year.
Source: FOI PAYE statistics and population estimates and projections.
Figure 8. Change in rates of claiming out-of-work benefits by region, 2022 to 2025, 18- to 24-year-olds
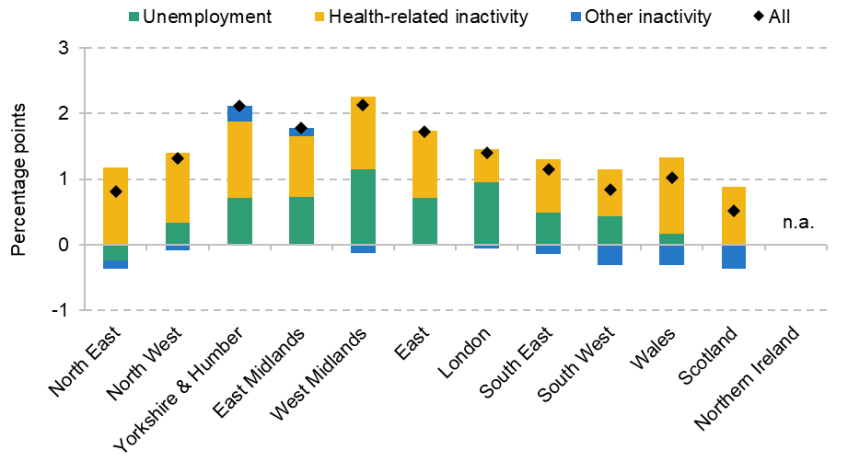
Note: Averages across all quarters in a year. Benefits data are not available for Northern Ireland, where benefits are not administered by the Department for Work and Pensions.
Source: DWP Stat-Xplore.
Both administrative datasets show a widespread fall in labour market participation across regions (in contrast to the (noisy) LFS estimates, which suggest that the rise in NEET rates was almost entirely concentrated in the North of England and the East Midlands; see Figure A4 in the appendix). Payrolled employment rates fell by at least 3 percentage points in 8 of the 12 regions of the UK, including by 4 percentage points in London. The share of young people claiming out-of-work benefits rose everywhere.10
However, there are differences in the composition of benefit changes across regions. For example, London and the North West saw similar increases in claimant rates (1.4 and 1.3 percentage points respectively). But in London, most (68%) of the increase came from unemployment benefits, whereas in the North West, 80% of the increase came from incapacity benefits. In general, inactivity-related benefits accounted for a larger share of the increase in Northern regions, as well as in Wales and Scotland.
3. Is the recent rise in NEET rates cyclical or structural?
The previous section showed that the rise in NEET rates in the Labour Force Survey is supported by administrative data. This rise could be driven by cyclical or structural forces – or both – and in this section we explore the evidence on this question.
By ‘cyclical’, we mean that the rise in NEET rates is driven by weak underlying labour demand. If it was purely cyclical, we would expect NEET rates to return to their previous levels when the economy rebounds, even without interventions specifically targeting young people. A ‘structural’ rise is one that reflects more fundamental changes in the economy or society that have disproportionately affected young people. In this instance, NEET rates may remain elevated even after the wider economy recovers, and reducing NEET rates may require policies aimed specifically at young people.
There are several reasons to think that the rise in NEETs could be cyclical. Geopolitical uncertainty created by the Russia–Ukraine war, US tariffs and more recently the war in Iran have resulted in high inflation, tighter monetary policy and reduced business confidence. Discounting the COVID-19 period, job vacancies in the UK are at their lowest in over a decade (Office for National Statistics, 2026c). This fall in vacancies is especially pronounced in the UK, but several Western European countries have suffered similarly from the negative global economic shocks of the last three years (Eurostat, 2026).
Cyclical economic downturns of this kind often disproportionately affect young people. It is easier to freeze hiring than it is to lay off existing employees, and inexperienced young workers may be the first to be deemed surplus to requirements if firms do make redundancies. The most recent Economic and Fiscal Outlook (Office for Budget Responsibility, 2026) suggests ongoing labour market weakness is being driven primarily by entrants into the labour force struggling to find work, consistent with employment patterns observed during previous economic downturns. As shown by Figure 9, falls in the employment rate for 16- to 24-year-olds following the early 1990s recession, the financial crisis and the pandemic were all much larger than the associated falls in the employment rate for older adults.
Figure 9. Employment rates for young people and older adults
Note: Seasonally adjusted. Shows three-month averages. PAYE series do not include the self-employed.
Source: ONS LFS series A05, FOI PAYE statistics and population estimates and projections.
This means that the fact that we observe a significant fall in the 16–24 employment rate since 2022, but are yet to see a large fall in the 25–64 employment rate in either the LFS or PAYE data, is not itself evidence that the rise in the NEET rate is structural.
However, there are also good reasons to suspect a structural component to the recent rise in NEET rates. Three factors have received particular attention in the media and policy debate. First, there have been large increases in youth minimum wage rates in recent years, alongside an increase in employer National Insurance contributions for those aged 21 and over and the introduction of the Employment Rights Act in 2025. These policies have increased the cost of hiring young workers and/or increased employer costs in the low-paid industries in which they tend to work (Ray-Chaudhuri and Xu, 2025). Second, the rapid adoption of artificial intelligence (AI) offers firms a cheaper substitute to junior workers in many sectors, which could reduce demand for young workers. Third, there has been a sustained decline in mental health among young people (Blanchflower, Bryson and Xu, 2025), and persistent school absences remain much higher than before the pandemic (Department for Education, 2026c). This means that new cohorts leaving education may be less attached to the labour market than previous cohorts.
The increase in health-related inactivity among young people is often cited as evidence of a structural shift. The proportion of NEETs reporting sickness or disability as their main reason for being out of work has risen steadily, whilst the proportion actively searching for work (unemployed) has remained steady over the last few years. This is very different from the rise in NEETs over the financial crisis, when the proportion citing unemployment rose sharply (Diniz and Murphy, 2025).
However, the fact that health-related incapacity benefits are more generous than unemployment benefits, and do not come with work search requirements, could incentivise people to take up incapacity benefits when out of work. This in turn could affect their work search behaviour and their self-reported reasons for not working. The gap between the generosity of unemployment benefits and the highest rate of incapacity benefits has also increased since the financial crisis due to consecutive nominal freezes to non-health-related benefits (Institute for Fiscal Studies, 2025), which strengthened the incentive to claim incapacity benefits. Rather than relying on stated reasons for inactivity, we therefore consider other relationships in the data to assess whether the recent rise is likely to be cyclical or structural.
The NEET rate is higher than we would expect given adult unemployment
NEET rates and adult unemployment tend to move together over the business cycle. Figure 10 plots the quarterly 16–24 NEET rate against the unemployment rate for 25- to 64-year-olds since 2006, with quarters up to 2022 shown in green and quarters from 2023 onwards in yellow. There is a clear positive relationship – as shown by the dotted green line, a 1 percentage point increase in the adult unemployment rate was associated with a 1.5 percentage point increase in NEET rates between 2006 and 2022.
Figure 10. Relationship between NEET rates and adult unemployment rate, 2006–25
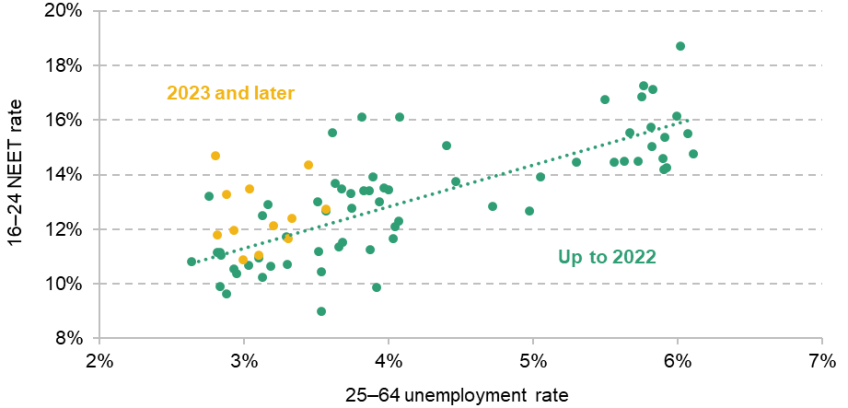
Note: Not seasonally adjusted. Points are individual quarters.
Source: PAYE Real Time Information and LFS.
If the rise in NEETs were purely cyclical, we would expect the most recent data (the yellow dots) to lie along this line. However, current NEET rates are 1 percentage point higher than we would expect given current adult unemployment, statistically significant at the 1% level. This suggests that there is a structural component to the rise in NEET rates.
The logic is similar to that of the Beveridge curve, which plots the relationship between the unemployment rate and the job vacancy rate, and argues that a shift in the relationship is evidence of a structural shock whereas moves up and down the curve are cyclical. Recent work at the Resolution Foundation uses the same approach to conclude that cyclical factors can explain just over half of the increase in the 18–24 NEET rate since 2019 (Clegg et al., 2026).
However, it is possible that the current level of adult unemployment is underestimated in the Labour Force Survey, since the LFS does not capture the fall in employment seen in other datasets (Francis-Devine and Powell, 2026). We therefore validate our result by comparing NEET rates and adult PAYE employment rates, which are available from the second quarter of 2015. This is shown in Figure A6 in the appendix. Using PAYE employment generates an even bigger shift, with NEET rates over 2 percentage points higher than expected given pre-2023 data.
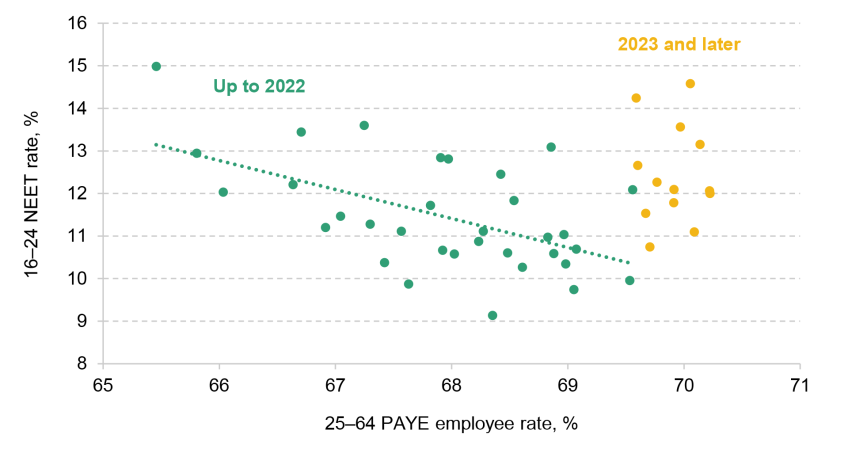
Changes in youth employment rates across regions are not correlated with changes in adult employment
Cyclical downturns hit labour demand. Demand shocks tend to vary across places, partly reflecting differences in industrial structure, particularly in procyclical sectors such as construction, manufacturing and hospitality. As such, if changes in employment were due to cyclical demand shocks, we would expect changes in youth and adult employment to be positively correlated across places – the regions that see the biggest falls in youth employment should also be those that see the biggest falls in adult employment.
Figure 11 plots changes in PAYE employment rates between 2022Q4 and 2025Q4 across NUTS2 regions for young people against the corresponding change for 25- to 64-year-olds. Panel A shows 16- to 24-year-olds overall; Panels B, C and D present more granular age groups. Overall, there is no correlation between changes in youth employment and changes in employment for 25- to 64-year-olds. We do see a positive correlation for 22- to 24-year-olds, who are likely to be more similar to older adults.
Figure 11. Change in PAYE employment rates, 2022Q4 to 2025Q4 (percentage points)
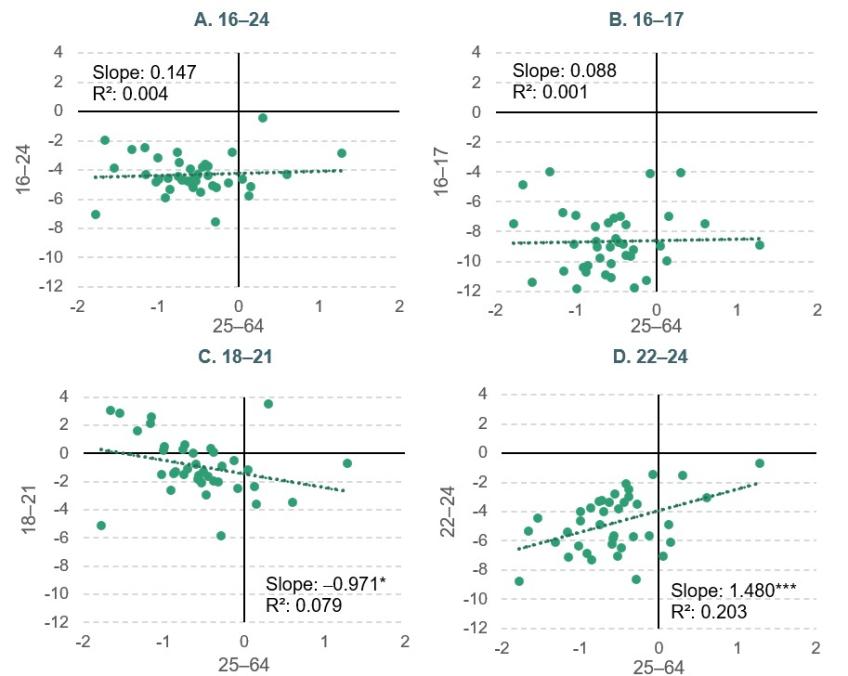
Note: Not seasonally adjusted. Observations are NUTS2 regions. Excludes Northern Ireland. Asterisks indicate significance at the 10% (*), 5% (**) and 1% (***) levels.
Source: FOI PAYE statistics and population estimates and projections.
These patterns are very different from those observed during the COVID-19 shock, which provides a useful (albeit unusual) example of a more cyclical shock. Table 1 compares the relationship between youth and adult employment changes across NUTS2 regions over COVID and over the last three years. In contrast to the current period, employment changes for 18- to 21-year-olds over the pandemic period were clearly positively correlated with changes for older adults – the R² of 0.497 indicates that nearly half of the variation in youth employment changes can be explained by changes in adult employment. The correlation between employment rates for 22- to 24-year-olds and older adults is also much stronger than in the current period (the slope and R² are roughly twice as high).11 The fact that the relationships from 2022–25 are so much weaker further suggests that there may be a structural component to the recent rise in NEET rates.
Table 1. Relationship between youth and 25–64 PAYE employment rate changes
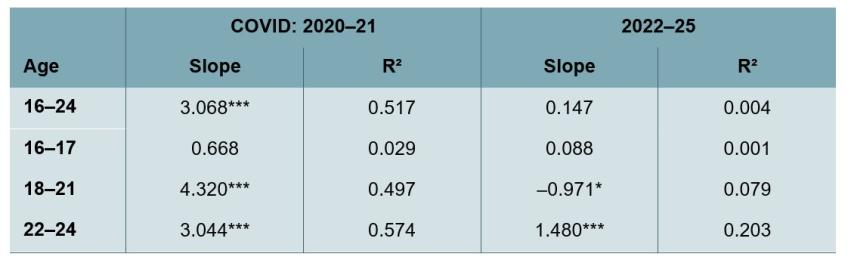
Note: Not seasonally adjusted. Based on regression of Q4-to-Q4 youth employment rate change (in percentage points) on the 25–64 employment rate change at the NUTS2 regional level. Asterisks indicate significance at the 10% (*), 5% (**) and 1% (***) levels. Excludes Northern Ireland.
Source: FOI PAYE statistics and population estimates and projections.
There is no evidence that graduates are disproportionately affected
There has been widespread speculation that AI will create a graduate ‘jobpocalypse’, driving a rapid decline in entry-level university graduate positions (Financial Times, 2025). If this were true, we might expect a disproportionate impact on graduates. The large fall in payrolled employment for 22- to 24-year-olds shown in the previous section would be consistent with this narrative, though we cannot distinguish between graduates and non-graduates in payroll data.
Figure 12 plots the NEET rate for recent graduate labour market entrants against the NEET rate for recent non-graduate entrants across quarters between 2006 and 2025. We focus on recent entrants – defined as individuals who left education within the last two years – because the current labour market downturn mostly reflects weaker hiring (Office for Budget Responsibility, 2026). Comparing outcomes of, for example, 21-year-old graduates trying to get a first job after university with the outcomes of 21-year-old non-graduates who have already been in the labour market for several years would therefore be misleading.
Figure 12. Relationship between NEET rates for recent graduates and non-graduates, 2006Q1 to 2025Q4
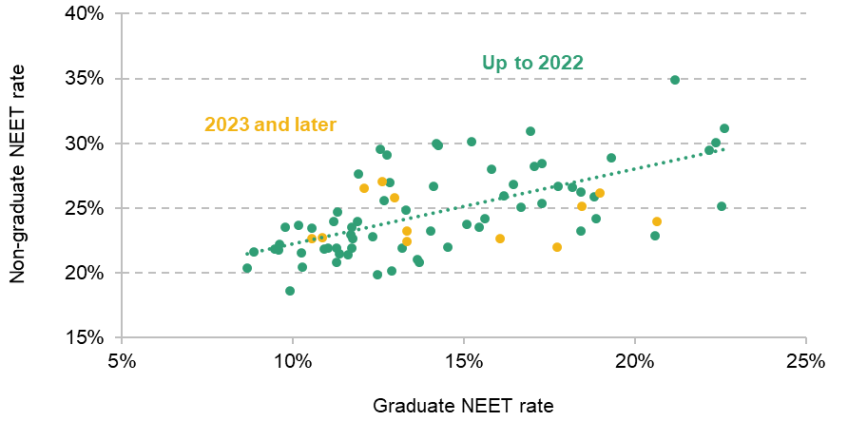
Note: Not seasonally adjusted. Points are individual quarters. Restricted to people who left education less than two years ago.
Source: LFS.
The NEET rate for recent non-graduate entrants is consistently higher than the NEET rate for recent graduate entrants. On average, the relationship implies that when the graduate NEET rate is 15%, the non-graduate NEET rate is roughly 25%. However, there is no evidence that this relationship has changed since 2022.
Summary
Taken together, the evidence in this section points to a structural component to the recent rise in NEET rates. However, it does not seem to have disproportionately affected graduates relative to non-graduates, as might be expected if AI were primarily replacing junior graduate positions. This does not rule out a role for AI: it may have affected graduate and non-graduate jobs equally (King’s Trust, 2025), or there may be offsetting effects – for example, with AI reducing jobs for graduates and minimum wages reducing jobs for non-graduates. AI may also have increased competition from graduates for typically non-graduate jobs. We turn to minimum wages in the following section.
4. The role of the rising youth minimum wages
The evidence presented in the previous section suggests that the rise in NEET rates is not purely cyclical and reflects, at least partially, structural changes in the economy that particularly affect young people. As discussed earlier, there are several potential structural factors that could reduce youth employment, including recent policy changes that increased employer costs, AI adoption and the decline in young people’s mental health. In this section, we focus on whether there is any evidence that rising minimum wages have reduced youth employment. We plan to consider the role of other factors, particularly mental health, in future work.
Recent years have seen big increases in minimum wages for young people, as the National Living Wage (NLW) was increased to reach the target set by the previous government of two-thirds of median wages, and the age threshold of the NLW was gradually lowered from 25 to 21 (HM Treasury, 2023). The current government has pledged to bring the 18–20 rate into line with the NLW, implying further large increases for this group.
Table 2 shows real-terms changes in the minimum wage in recent years for different age groups. There were particularly large increases in 2024 and 2025, across the board and especially for young people. Minimum wages for 16- and 17-year-olds increased by 18% in real terms in 2024 and a further 13% in 2025, compared with 7% and 3% respectively for those aged 23 and over. Minimum wages for 18- to 20-year-olds also increased by 12% in real terms in both years. These large increases in minimum wages, coupled with rising NEET rates, have prompted concerns about negative effects on youth employment. Box 1 discusses how increases in minimum wages could affect employment.
Table 2. Real changes to minimum wages for workers of different ages, 2020 to 2026
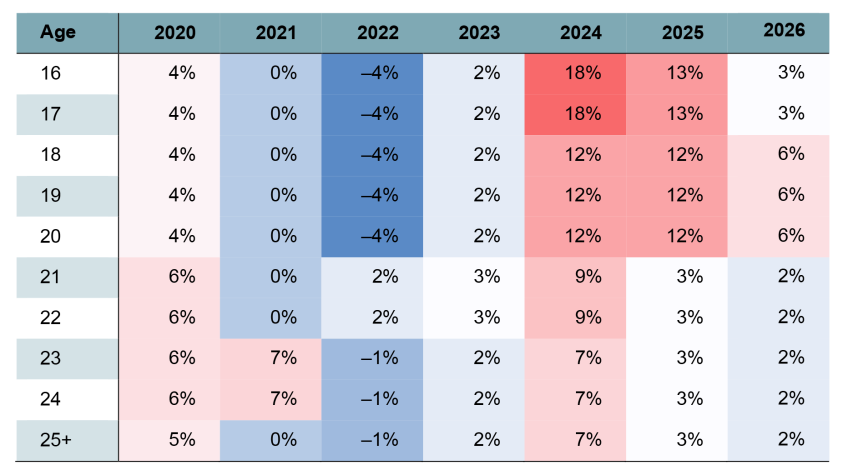
Note: Deflated using Q2 CPIH and rounded to nearest integer. The choice of deflator makes some difference to magnitudes, but not to differences across ages – for example, using the CPIH index for the entire financial year yields an increase of 15% for 16- and 17-year-olds in 2024, instead of 18% using Q2 CPIH. 2026 uses forecast Q2 CPIH.
Source: Authors’ calculations using Low Pay Commission rates and ONS CPIH.
Box 1. How would we expect youth minimum wages to affect youth employment?
In a competitive labour market in which workers’ pay equals their (marginal) productivity, we would expect a binding minimum wage to reduce employment. Young workers are likely to be less productive than older workers due to their lack of experience. On this view, raising youth minimum wage rates towards the adult rate risks pricing young people out of entry-level roles, reducing youth employment.
However, empirical evidence on minimum wages suggests that labour markets are far from perfectly competitive, with workers paid below the value they generate for their employers. Research from the UK and around the world has typically not found large impacts of negative employment effects (at least in the short run) even for significant minimum wage increases, with the median estimate of the effect very close to zero (Dube, 2019). This holds even when the focus is specifically on young workers (Dube and Linder, 2024). In the UK context, a recent study of the National Living Wage estimates small negative employment effects that are indistinguishable from zero (Giupponi et al., 2024).
There is also strong evidence, both internationally (Dube and Linder, 2024) and in the UK (Giupponi and Machin, 2026), that firms often pay younger workers more than their age-specific minimum wage, and instead pay at or closer to the adult minimum due to pay equity norms. In this case, large rises in youth minimum wages may have a limited effect on employment, because for many workers they do not in fact imply a substantial wage rise.
Ideally, we would estimate the effect of minimum wages on employment using variation both in the timing of different age-specific minimum wage changes, and in the exposure to minimum wages across regions due to differences in regional wage levels – lower-paid regions are more affected by rises in the minimum wage. However, some of the minimum wage changes occurred during COVID and the post-pandemic recovery. This creates two serious problems: it is difficult to isolate the effects of minimum wages from the much larger effects of COVID; and data on wages from this period are potentially unreliable, given the fall in sample sizes in the Annual Survey of Hours and Earnings (ASHE). We therefore adopt two different approaches to assess the effect of minimum wage increases.
For the 2021 minimum wage increase for 23- and 24-year-olds and the 2022 increase for 21- and 22-year-olds, we consider whether employment trajectories for age groups that experienced a large minimum wage increase were more negative than those for adjacent age groups. If trends diverge following these changes, this may suggest an effect of minimum wages on employment. However, this approach may not pick up effects if employers are forward-looking – and reduce employment of 20-year-olds, for example, knowing that they will have to pay a higher minimum wage when the worker turns 21 – or if there are other age-specific shocks affecting employment at different ages.
The 2024 and 2025 minimum wage increases are sufficiently far from the pandemic to enable a more robust econometric approach similar to those often adopted in the economics research literature to estimate the effects of minimum wages. In particular, we consider whether employment has fallen more in NUTS2 regions that are more exposed to the minimum wage, comparing workers of the same age. One benefit of this approach is that it mitigates against confounding effects of the employer NICs reforms in 2025, which primarily only directly affect employees aged 21 and over. In addition, we are able to control for other possible drivers of differential employment by exposure to the minimum wage, such as industry or regional trends.
However, there remain significant challenges with this approach. Estimating exposure to the minimum wage by age and region requires information on wages from ASHE, which is quite noisy when looking at workers of a specific year of age in a specific NUTS2 region. The absence of large-scale microdata on the number of employees with different wages means that we cannot focus on employment changes at the bottom of the wage distribution, where workers are likely to be affected by the minimum wage. These issues limit the precision with which it is possible to estimate the effects of minimum wages on employment. That said, our use of administrative payroll data to estimate local employment rates is in some ways an improvement on previous methods to estimate minimum wage effects in the UK, which typically rely on survey data.
Adjacent age groups that face different increases in minimum wages in 2021 and 2022 do not see divergent employment trends
The National Living Wage was extended to 23- and 24-year-olds in 2021 and to 21- and 22-year-olds in 2024. This meant that 23-year-olds saw a much bigger increase in their age-specific minimum wage than 22-year-olds in 2021 (7% in real terms compared with 0%). In anticipation of the extension of the NLW to 21-year-olds, 21-year-olds saw a much bigger increase than 20-year-olds in 2022 (2% compared with –4%).
Figure 13 plots employment rates for these two sets of adjacent age groups, to see whether their employment trends diverged after the change in minimum wages. Panel A shows that trends in employment rates for 23-year-olds tracked those for 22-year-olds both before and after the minimum wage increase in 2021. In Panel B, we do see the employment rate for 21-year-olds falling and converging to the rate for 20-year-olds; however, this convergence only happens a full year after the minimum wage increase in 2022. There is also no evidence of divergence following the differential minimum wage increases in 2024 and 2025, although we examine these increases more robustly in our econometric analysis below.
Figure 13. Employment rates by single year of age, January 2018 to December 2025
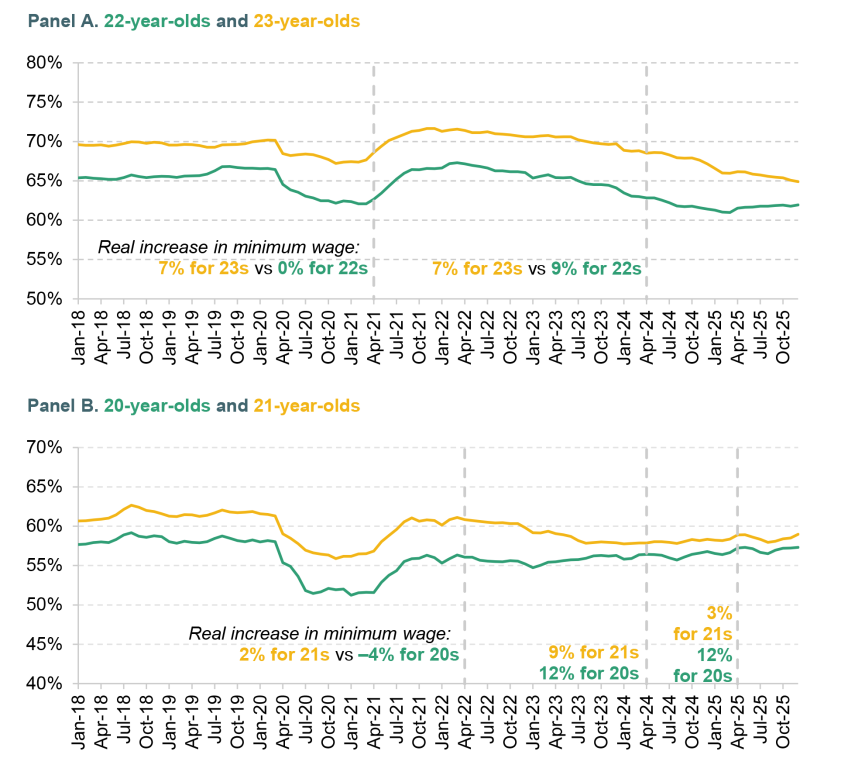
Note: Seasonally adjusted.
Source: FOI PAYE statistics and population estimates and projections.
However, it is still possible that these minimum wage changes have had a negative employment effect, just not at the level of individual ages. For example, if the minimum wage goes up for 21-year-olds but not for 20-year-olds, firms may also hold back on hiring 20-year-olds, knowing that the higher minimum wage rate will bite the following year. In this case, employment trends for 20- and 21-year-olds may not diverge, even though both are negatively affected. In our econometric analysis, we therefore use variation in the exposure to the minimum wage across regions, within a single year of age, rather than variation across age groups.
Did youth employment fall more in region–age groups that were more exposed to the 2024 minimum wage rises?
To home in on the large minimum wage rises in 2024, we start by examining whether youth employment fell by more in region-and-age groups that were more exposed to the minimum wage. We group 16- and 17-year-olds and some NUTS2 regions due to small sample sizes.12 We measure this exposure using the change in the ‘Kaitz index’ resulting from the 2024 minimum wage reforms. The Kaitz index for 2024 is defined as the 2024 minimum wage (for each single year of age) divided by the median wage in 2023 for a given region–age pair. We compare this with the counterfactual Kaitz index that would have resulted had all minimum wages been uprated with inflation. The advantage of this measure is that median wages are relatively well measured, but the disadvantage is that it does not use information on the wage distribution closer to the minimum wage. The weighted average Kaitz index in 2024 was 0.855, with some above 1, suggesting that a large fraction of young workers are paid at or just above the minimum wage. The average change in Kaitz resulting from the reform was 0.084. Figure 14 plots the change in Kaitz for each region–age pair against the percentage point change in the employment rate from 2024Q1. When looking within age groups that saw similar changes in Kaitz, there is no evidence that larger changes in Kaitz are associated with larger falls in employment. If anything, the relationship goes the other way, although the relationship is weak in each case (R2 < 0.05).
Figure 14. Relationship between the bite of 2024 minimum wage and the change in employment rate from 2024Q1 to 2025Q1
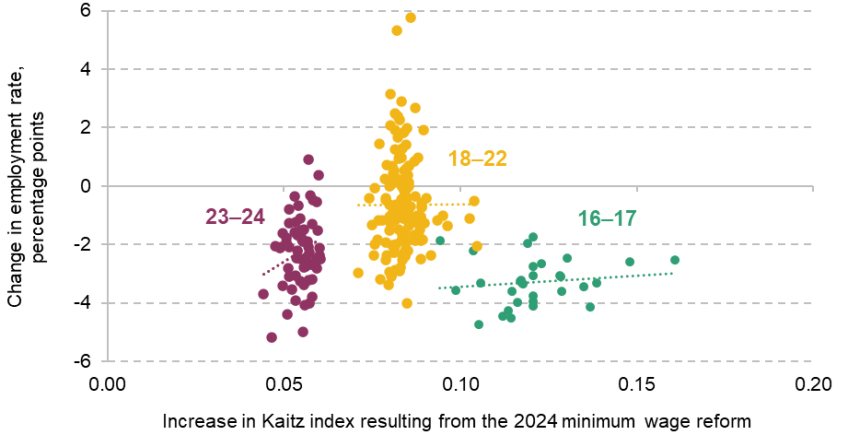
Note: Points are NUTS2 region x age cells. Some NUTS2 regions are grouped due to small sample sizes in ASHE data (see footnote 12 for details). Ages 16 and 17 are grouped.
Source: ASHE and FOI PAYE statistics and population estimates and projections.
However, it is possible that highly exposed region–age groups were previously on a more positive employment trajectory than less exposed groups and that, in the absence of the minimum wage increases, employment rates in these groups would have been even higher. Another possibility is that other confounding variables – for example, anticipation of the rise in employer NICs – obscure the relationship between minimum wages and employment. We explore both of these possibilities by conducting a more formal analysis which tracks region–age pairs over time.
We estimate the impact of the 2024 minimum wage increases on youth employment by using a ‘difference-in-differences’ approach at the region–age level, for young people aged 16–24. Intuitively, our approach compares how employment rates change for high-bite groups relative to low-bite groups. It relies on the assumption that in the absence of minimum wage changes, youth employment rates in high- and low-paid regions would have evolved in the same way. Whilst we cannot observe this directly, we can see whether there is any evidence of divergence in trends prior to the minimum wage reform. Box 2 explains our methodology in more detail.
Box 2. Empirical specification
Formally, we run an event study regression with the following specification:
where is the PAYE employment rate (on a 0–100 scale); is the change in Kaitz index for the age–region pair in 2024; are fixed effects for single year of age in NUTS2 region ; and are age-specific quarter-year fixed effects. are additional controls which are not included in the primary specification but appear in our robustness checks.
We weight our regressions by population and we cluster standard errors at the region level across all specifications. The coefficient of interest is , which is estimated separately in each period and represents the total effect of the reform to date.
We report effects up to 2025Q1, before the further minimum wage increases of April 2025, and up to the latest data in 2025Q4. The change in the Kaitz index following the 2025 minimum wage changes across region–age groups is highly correlated with the change in the Kaitz index following the 2024 minimum wage changes. Therefore, from 2025Q2 onwards, results should be interpreted as capturing any lagged effects of the 2024 reforms, alongside any effects of the 2025 reforms.
April 2025 also saw reforms to employer NICs for workers aged 21 and over (16- to 20-year-olds only face employer NICs on incomes above £50,270, so almost all were unaffected). These reforms disproportionately raised employer costs for low-paid workers, so exposure to the NICs rise is likely to be highly correlated with exposure to the minimum wage for 21- to 24-year-olds. We cannot fully separate the effect of the NICs rise from that of minimum wage increases. However, we control for age-specific time effects to deal with any effects of NICs on specific ages which could confound effects of the minimum wage. We therefore estimate the effect using variation in the bite of the minimum wage across regions within single-year-of-age groups. We also separately estimate employment effects just for 16- to 20-year-olds, who were largely not directly affected by reforms to employer NICs.
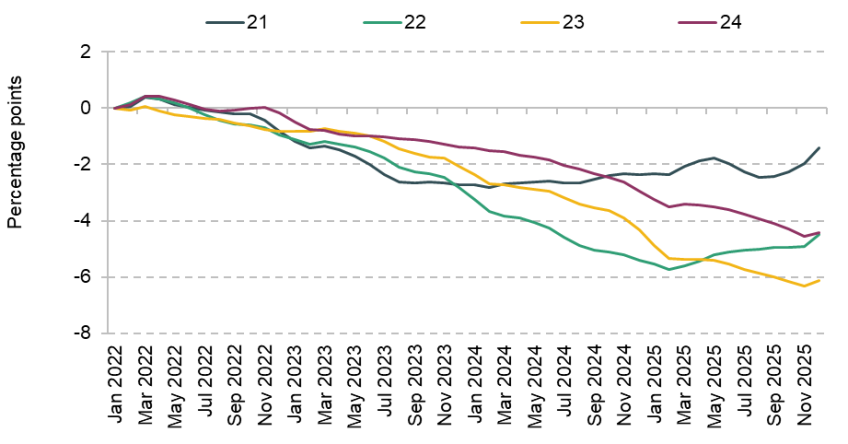
Figure 15 plots the results of our baseline event study. If minimum wage changes have had a negative effect on employment, we would expect our estimates to be below zero after the reform. There are some differential trends between 2022Q4 and 2023Q2, with lower-paid areas experiencing faster employment growth than higher-paid areas, which may reflect them catching up during the post-pandemic jobs boom. However, the trend levels off by 2023Q3 and there are no differential trends in the three or four quarters prior to the reform (the estimates are close to zero).
Figure 15. Estimated impact of minimum wage increases on employment: 16- to 24-year-olds
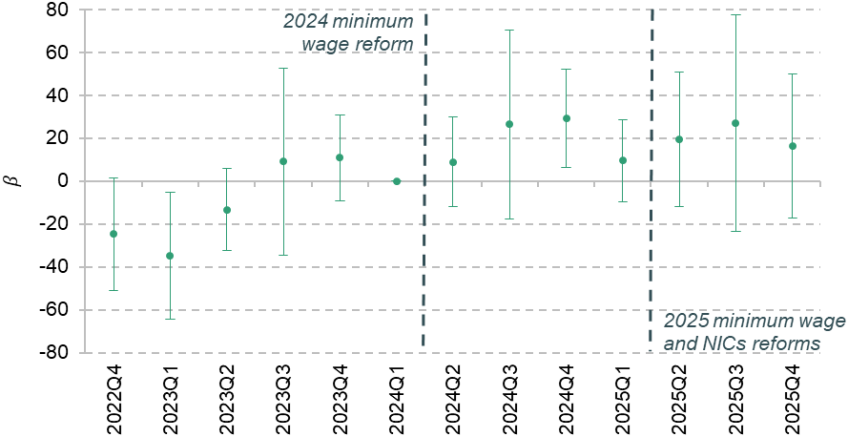
Note: Error bars show 95% confidence intervals. Each point represents coefficient on interaction between the change in the Kaitz index in 2024 and a quarter dummy. Includes time, age–region and age–time fixed effects.
Source: ASHE, FOI PAYE statistics and population estimates and projections.
The estimates in Figure 15 represent the percentage point change in the employment rate associated with a one unit increase in the Kaitz index. To aid interpretation, we convert estimates into the employment effect induced by the minimum wage increases in 2024, relative to a counterfactual in which age-specific minimum wages in 2023 were uprated with inflation, by multiplying by the average change in the Kaitz index.
These estimates are shown in Table 3. We present two sets of estimates: effects up to 2025Q1 (‘2024 only’) and up to the latest data in 2025Q4 (‘Up to 2025’). The former captures the effect of the 2024 minimum wages before further minimum wage increases in 2025 and NICs reforms. The latter captures the overall effect of the 2024 and 2025 minimum wage changes, alongside any correlated effects of the employer NICs increase. In both cases, our baseline estimates are slightly positive but not significantly different from zero. This is consistent with what we saw in the scatter plot (Figure 14). However – as discussed shortly – the confidence intervals are quite wide.
Table 3. Estimates of the percentage point effect of minimum wage reforms on the 16–24 employment rate
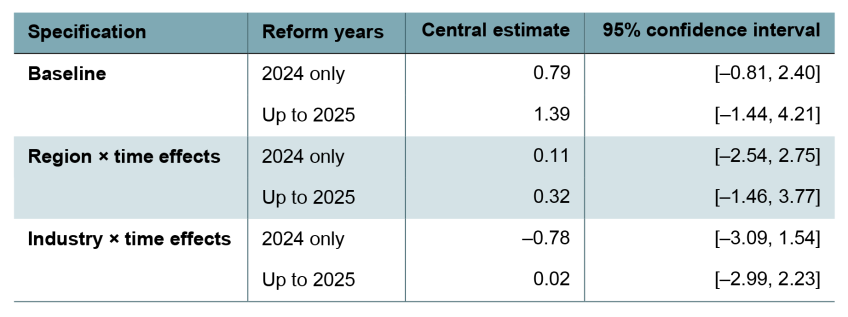
Note: Estimates refer to the change in employment rates associated with the average change in the Kaitz index resulting from the 2024 minimum wage reforms. This is calculated by multiplying from Box 2 by the average change in the Kaitz index.
Source: ASHE, FOI PAYE statistics, the Business Register and Employment Survey and population estimates and projections.
To test robustness, we further add controls for other confounding factors that could be correlated with the change in the Kaitz index in different regions. First, we add region-specific time effects, which control for region-specific shocks at the NUTS1 level. Second, we add time effects that vary based on the industrial structure13 of the NUTS2 region in 2023, which control for differential industry-specific employment trends. Estimates from these specifications are also presented in Table 3.
None of the estimates offered by the robustness checks is significantly different from those offered by the baseline specification: our central estimate in five of the six cases implies a positive impact on employment; and even in the other case, which does show a negative effect, it would only explain a minority of the decline in youth employment over the period. However, the degree of uncertainty is large – these results are not inconsistent with the minimum wage having a meaningful effect on employment rates in either direction. For three of the estimates, the 95% confidence interval includes the entire fall in youth employment seen over the relevant period since 2024Q1 (1.7 percentage points in 2024 and 2.3 percentage points up to 2025).
We further consider whether we see different results for 16- to 20-year-olds. This group saw the largest minimum wage rises but was largely unaffected by NICs reforms, and 16- and 17-year-olds have seen the most dramatic fall in employment over this period. Figure 16 plots the event study for this group. Again, there is some evidence of employment in lower-paid areas catching up with higher-paid areas in the earliest periods. However, these trends again seem to level off prior to the reform.
Figure 16. Estimated impact of minimum wage increases on employment: 16- to 20-year-olds
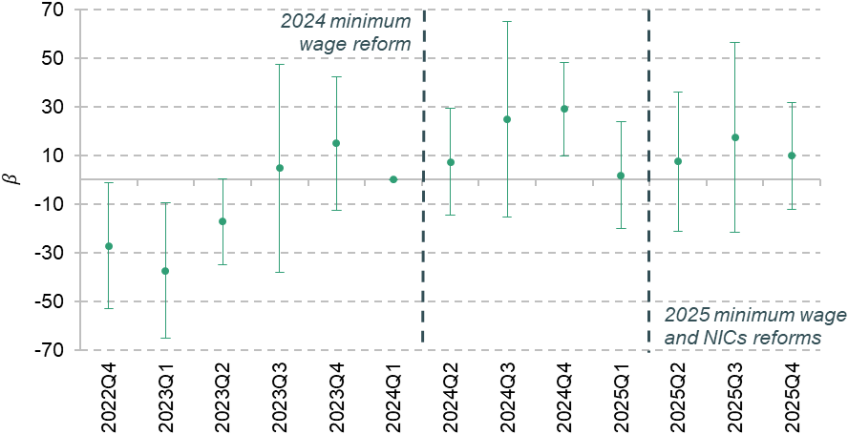
Note: Error bars show 95% confidence intervals. Each point represents coefficient on interaction between the change in the Kaitz index in 2024 and a quarter dummy. Includes time, age–region and age–time fixed effects.
Source: ASHE, FOI PAYE statistics and population estimates and projections.
Estimates of employment effects for 16- to 20-year-olds compared with the entire sample are presented in Table 4. All estimates are statistically indistinguishable from zero but remain imprecise.
Table 4. Estimates of the percentage point effect of minimum wage reforms on the employment rate, by age group
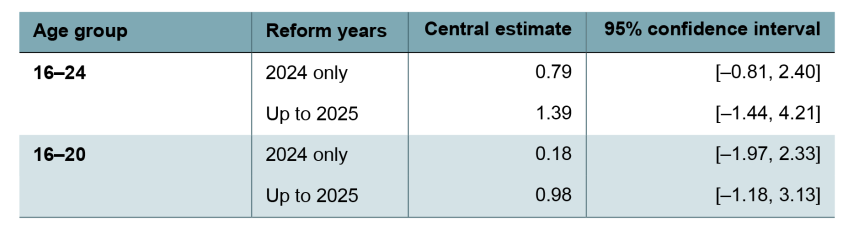
Note: Estimates refer to the change in employment rates associated with the average change in the Kaitz index resulting from the 2024 minimum wage reforms. This is calculated by multiplying from Box 2 by the average change in the Kaitz index.
Source: ASHE, FOI PAYE statistics and population estimates and projections.
Summary
The results presented here do not offer clear evidence that minimum wages have been a major driver in rising NEET rates, and taken as a whole they suggest that it is likely that other factors are at least playing a role. At the same time, the uncertainty associated with these estimates means we cannot confidently say one way or the other whether rising minimum wages have had a meaningful impact on NEETs.
5. Discussion
The share of young people who are not in education, employment or training (NEET) has risen in recent years. Administrative data on payrolled employment and out-of-work benefit claims also point to a meaningful decline in youth labour market participation. Payrolled employment rates for 16- to 24-year-olds fell 4.3 percentage points in the three years to December 2025, equivalent to 330,000 workers. For 22- to 24-year-olds – the substantial majority of whom have finished their studies – employment rates have fallen by 4.8 percentage points since 2022. This does not appear to be entirely driven by a cyclical labour market downturn – that is, it appears to at least partly reflect changes in the labour market that specifically affect young people. Possible factors that have been widely discussed in the media and elsewhere include rising youth minimum wages, increases in employer National Insurance contributions (NICs), AI and deteriorating health among young people.
We do not find clear evidence of divergent trends between age groups facing very different minimum wage increases, and places that were more exposed to minimum wage rises in 2024 and 2025 have not experienced more negative employment trends. At the same time, the data available mean that these estimates are imprecise, and do not allow us to confidently say one way or the other whether minimum wages have had a sizeable effect on employment. Taken as a whole, however, the evidence does suggest that other factors are at least playing a role.
On the face of it, the large falls in payrolled employment for older youths (especially 22- to 24-year-olds), compared with much smaller falls for 19- and 20-year-olds, could be consistent with employer NICs having a direct effect, since those under 21 are largely exempt from employer NICs. However, the employment falls began two years before the announcement of the NICs increase, suggesting that this reform cannot be the whole story.
The fall in payrolled employment for older youths is also consistent with an AI-induced decline in graduate jobs. However, when we compare graduates and non-graduates in the Labour Force Survey, we do not find that the current downturn has had a disproportionate impact on graduates. The difference between NEET rates for recent graduate and non-graduate entrants into the labour market is in line with historical norms. That said, this does not rule out the possibility of AI affecting graduate and non-graduate jobs equally, or different factors having offsetting effects.
One factor we have not studied here is the role of declining health, and potentially its interaction with the benefit system, which draws a sharp distinction between those who are able and unable to work in terms of benefit generosity, work search requirements and employment support. Recent studies have pointed to a rise in self-reported health problems – in particular, mental health conditions – that coincides with the rise in youth inactivity (Clegg et al., 2026). In future work, we will explore the relationship between mental health and NEET status using cohort studies and use newly available administrative data to study young people’s employment transitions.
Appendix
Figure A1. Share of 16- to 24-year-olds in employment, not seasonally adjusted
Note: Not seasonally adjusted. LFS series shows three-month averages. PAYE series does not include the self-employed.
Source: ONS LFS series YCVC, FOI PAYE statistics and population estimates and projections.
Figure A2. Share of 18- to 24-year-olds in receipt of different benefits
Source: DWP Stat-Xplore.
Figure A3. Change in NEET rate by age, 2022 to 2025
Note: Error bars represent 95% confidence intervals. Averages across all quarters in a year.
Source: Authors’ analysis of LFS.
Figure A4. Change in 18–24 NEET rate by region, 2022 to 2025
Note: Error bars represent 95% confidence intervals. Averages across all quarters in a year.
Source: Authors’ analysis of LFS.
Figure A5. Change in PAYE employment rate compared with January 2022, 21- to 24-year-olds
Note: Shows seasonally-adjusted three-month running averages.
Source: FOI PAYE statistics and population estimates and projections.
Figure A6. Relationship between NEET rates and adult PAYE employment, 2014–25
Source: PAYE Real Time Information and LFS.
References
Blanchflower, D., Bryson, A. and Xu, X., 2025. The declining mental health of the young and the global disappearance of the unhappiness hump shape in age. PLoS One, 20(8), e0327858, https://doi.org/10.1371/journal.pone.0327858.
Clegg, A., Cominetti, N., Diniz, J., Judge, L. and Stone, I., 2026. Lost in transition: an examination of why the UK NEET rate is high and rising. Resolution Foundation, https://www.resolutionfoundation.org/app/uploads/2026/04/Lost-in-transition.pdf.
Department for Education, 2025. Participation in education, training and employment age 16 to 18. https://explore-education-statistics.service.gov.uk/find-statistics/participation-in-education-and-training-and-employment/2024.
Department for Education, 2026a. Apprenticeship funding rules: August 2025 to July 2026. https://assets.publishing.service.gov.uk/media/69384d3b7a605b2d61cd8fc4/SOC_2526__Version_3.pdf.
Department for Education, 2026b. Participation measures in higher education. https://explore-education-statistics.service.gov.uk/find-statistics/participation-measures-in-higher-education/2023-24.
Department for Education, 2026c. Pupil absence in schools in England. https://explore-education-statistics.service.gov.uk/find-statistics/pupil-absence-in-schools-in-england/2024-25.
Department for Work and Pensions, 2025a. Almost a million young people to benefit from expanded support, new training, and work experience opportunities. https://www.gov.uk/government/news/almost-a-million-young-people-to-benefit-from-expanded-support-new-training-and-work-experience-opportunities.
Department for Work and Pensions, 2025b. Pathways to work: reforming benefits and support to get Britain working Green Paper. https://www.gov.uk/government/consultations/pathways-to-work-reforming-benefits-and-support-to-get-britain-working-green-paper/pathways-to-work-reforming-benefits-and-support-to-get-britain-working-green-paper.
Diniz, J. and Murphy, L., 2025. False starts: what the UK’s growing NEETs problem really looks like, and how to fix it. Resolution Foundation, https://www.resolutionfoundation.org/app/uploads/2025/10/False-starts.pdf.
Dube, A., 2019. Impacts of minimum wages: review of the international evidence. https://assets.publishing.service.gov.uk/media/6960e4e656321405090869aa/impacts_of_minimum_wages_review_of_the_international_evidence_Arindrajit_Dube_web.pdf.
Dube, A. and Lindner, A., 2024. Minimum wages in the 21st century. National Bureau of Economic Research, Working Paper 32878, https://doi.org/10.3386/w32878.
Eurostat, 2026. Job vacancy rate by NACE Rev. 2 activity - annual data. https://ec.europa.eu/eurostat/databrowser/view/jvs_a_rate_r2/default/table?lang=en.
Financial Times, 2025. The graduate ‘jobpocalypse’: where have all the entry-level jobs gone? https://www.ft.com/content/62e7cf87-1ebe-41fd-9d15-dd0a75ad4d86?syn-25a6b1a6=1.
Financial Times, 2026. The great graduate job drought. https://www.ft.com/content/c89496b1-bc8d-425e-b86b-ec89402410e4?syn-25a6b1a6=1.
Francis-Devine, B. and Powell, A., 2026. UK labour market statistics. House of Commons Library, Research Briefing 09366, https://commonslibrary.parliament.uk/research-briefings/cbp-9366/.
Giupponi, G., Joyce, R., Lindner, A., Waters, T., Wernham, T. and Xu, X., 2024. The employment and distributional impacts of nationwide minimum wage changes. Journal of Labour Economics, 42(S1), S293–333, https://doi.org/10.1086/728471.
Giupponi, G. and Machin, S., 2026. Company wage policy in a low-wage labor market. Centre for Economic Performance, Discussion Paper 1869, https://cep.lse.ac.uk/pubs/download/dp1869.pdf.
HM Treasury, 2023. Record wage boost for nearly 3 million workers next year. https://www.gov.uk/government/news/record-wage-boost-for-nearly-3-million-workers-next-year.
Institute for Fiscal Studies, 2025. Comparing weekly incapacity benefits and unemployment benefit levels over time. IFS Data Item, https://ifs.org.uk/data-items/comparing-weekly-incapacity-benefits-and-unemployment-benefit-levels-over-time.
King’s Trust, 2025. Gen(eration) AI. https://www.kingstrust.org.uk/about-us/news-views/gen(eration)-AI-report.
Low Pay Commission, 2026. Low Pay Commission Report 2025. https://www.gov.uk/government/publications/low-pay-commission-report-2025/low-pay-commission-report-2025-html.
OECD, 2025. Education at a glance 2025. https://www.oecd.org/en/publications/education-at-a-glance-2025_1c0d9c79-en.html.
Office for Budget Responsibility, 2026. Economic and fiscal outlook: March 2026. https://assets.publishing.service.gov.uk/media/69a6d7b62e1f4fbda4252208/economic-and-fiscal-outlook-march-2026-web-accessible.pdf.
Office for National Statistics, 2026a. Labour Force Survey performance and quality monitoring report: October to December 2025. https://www.ons.gov.uk/employmentandlabourmarket/peopleinwork/employmentandemployeetypes/methodologies/labourforcesurveyperformanceandqualitymonitoringreportoctobertodecember2025.
Office for National Statistics, 2026b. Labour Force Survey quality update: April 2026. https://www.ons.gov.uk/employmentandlabourmarket/peopleinwork/employmentandemployeetypes/articles/labourforcesurveyqualityupdate/april2026.
Office for National Statistics, 2026c. Vacancies and jobs in the UK: April 2026. https://www.ons.gov.uk/employmentandlabourmarket/peopleinwork/employmentandemployeetypes/bulletins/jobsandvacanciesintheuk/latest.
Ray-Chaudhuri, S. and Xu, X., 2025. Combined impact of minimum wage and tax increases may reduce opportunities for young people. IFS Comment, https://ifs.org.uk/articles/combined-impact-minimum-wage-and-tax-increases-may-reduce-opportunities-young-people.
Data
HM Revenue and Customs. (2025). Survey of Personal Incomes, 2022-2023: Public Use Tape. [data collection]. UK Data Service. SN: 9422, DOI: http://doi.org/10.5255/UKDA-SN-9422-1.
Office for National Statistics. (2024). Labour Force Survey. [data series]. 11th Release. UK Data Service. SN: 2000026, DOI: http://doi.org/10.5255/UKDA-Series-2000026.
Office for National Statistics. (2025). Annual Survey of Hours and Earnings, 1997-2025: Secure Access. [data collection]. 27th Edition. UK Data Service. SN: 6689, DOI: http://doi.org/10.5255/UKDA-SN-6689-27.
Foreword from The King’s Trust
As The King’s Trust marks 50 years of supporting young people to build a better future, our mission remains as urgent as ever. We have helped more than 1.3 million young people across the UK, but too many still face significant barriers to work. We remain determined in our vision of ending youth unemployment, tackling inequality, and ensuring every young person has the chance to succeed.
Today, almost one million young people are not in employment, education, or training. Behind that number are ambitions and talents. For too many young people, the transition from education into work has become harder and more uncertain, the consequences of which can last. Being out of work early in life can bring long-term consequences for overall life chances.
This report helps us look beneath the surface of this challenge. Its analysis suggests that the recent rise in young people not in employment, education, or training cannot be explained simply as a short-term consequence of the wider economy, or assumed to fall away as conditions improve. It also makes clear that there is unlikely to be a simple policy explanation for falling youth employment, pointing instead to a more complex set of pressures affecting young people’s participation in the labour market.
That matters. If the barriers facing young people are deeper and more structural, then the response must match. This includes understanding more about the role of health, especially mental health, alongside the potential impact of AI and other changes in the labour market.
The King’s Trust sees every day what young people can achieve when they are given the right support at the right time. The Trust stands ready to work with governments, employers, charities, education providers, and partners across society to create clear and accessible routes into sustainable employment.
We are grateful to the Institute for Fiscal Studies for bringing independent rigour to this important question, and to King Charles III Charitable Fund for its support. We hope this research supports a more informed and practical conversation about how we help more young people move into work.
Fifty years on, The King’s Trust remains determined to help every young person succeed.
Acknowledgements
The authors are grateful for funding from The King’s Trust, King Charles III Charitable Fund and the ESRC Centre for the Microeconomic Analysis of Public Policy (ES/Z504634/1). They thank Richard Rigby and others from The King’s Trust for their insightful comments throughout the project.
The King’s Trust is working for young people, supporting 11- to 30-year-olds who are unemployed or struggling at school to get their lives on track. The youth charity was founded in 1976 by His Majesty The King when he was HRH The Prince of Wales and has helped more than 1 million young people to date, giving them the skills and confidence to change their lives. Three in four young people on King’s Trust courses move into work, education or training.
Founded in 1979 by His Majesty King Charles III, and inspired by the values of harmony and sustainability, King Charles III Charitable Fund’s mission is to transform lives and build sustainable communities. The Fund supports His Majesty’s charitable interests through its grant making programmes and incubating charitable projects and initiatives. We are committed to helping people and communities to change the world around them, creating lasting improvements to people’s lives and a sustainable future for all.
Endnotes
Authors

Jed Michael
Jed joined the IFS in 2025 and works in the Income, Work and Welfare (IWW) sector.

Tom Waters
Tom is an Associate Director at the IFS and Head of the Income, Work and Welfare sector.

Xiaowei Xu
Xiaowei joined the IFS in 2018 and works in the Income, Work and Welfare sector.
More from IFS
Understand this issue


Policy analysis


Academic research


