
Downloads
Download report PDF
PDF | 532.26 KB
Executive summary
English councils saw big cuts to their funding during the 2010s, with spending on some services down between 40% and 70% over the decade. And although like virtually all public services, funding for local government was increased during the 2019–24 parliament, councils’ finances are still under significant pressure. This reflects increases in demands and costs for key services that have often far outpaced economy-wide inflation, and has led to a growing number of councils requiring exceptional financial support.
Despite this, the main parties’ manifestos were virtually silent on their plans for council funding post-election. This means there is significant uncertainty about exactly what to expect over the next five years. This report therefore looks at a number of scenarios for councils’ funding – and what these might mean for service delivery and financial sustainability given the spending pressures councils face. It finds that, given the current fiscal environment and overall spending plans implicit in the main parties’ manifestos, cuts to some council services are highly likely unless spending pressures abate – even with big increases in council tax, and particularly in poorer parts of the country. There is also a real risk of significantly more councils being pushed to financial breaking point, joining the likes of Birmingham, Thurrock and Woking.
How might central government funding change?
The next government will have to decide how much grant funding will be provided to local government. None of the main parties has made commitments on this, unlike in 2019.
Existing indicative spending envelopes for 2025–26 onwards imply that ‘unprotected’ spending – which in the 2010s included grant funding for councils – could see cuts averaging 2% to 3½% in real terms per year, if the next government wanted to fully fund the NHS workforce plan and meet existing childcare, defence and overseas aid commitments. However, this may not provide a good guide for how grant funding for councils will change in the next parliament.
First, overall UK government spending totals are likely to be revised more significantly than suggested in party manifestos, when detailed plans are set at a post-election Spending Review; the trend since 2015 has been for budgets to be revised upwards. Second, the extent to which councils will share in any pain imposed is uncertain; in principle, they could fare better or worse than the average unprotected area. The public finance situation and major parties’ overall tax and spending plans mean that grant funding is likely to be more constrained in the coming parliament than over the last few years though.
Will reliance on council tax increase?
There is also uncertainty about the outlook for council tax, the biggest single source of funding for English councils.
Councils have increased their council tax by an average of 4.4% per year since 2019. But this has barely been enough to keep up with inflation, leaving council tax at the same real-terms level as in 2019–20 and just 2% higher in real terms than in 2010–11. In future, 5% increases (the overall maximum allowed without a referendum over the last two years) would mean a 3% per year real-terms increase in bills over the next parliament, the fastest rate since the 2001–05 parliament (when they averaged 6% a year).
Whether 5% increases in council tax are a good guide for the future is unclear though. On the one hand, both central and local government may feel uncomfortable with such above-inflation increases. On the other hand, an incoming government could decide to remove council tax referendum limits as part of devolution plans. Experience from Wales suggests that this could see bigger increases in council tax, especially by those councils that have traditionally set low tax rates.
Scenarios for funding changes
Uncertainty about both grant funding and council tax increases means that it is not possible to predict the funding councils will receive in the next parliament with confidence. However, it is possible to look at a range of more optimistic and more pessimistic scenarios using different assumptions about how both grant funding and council tax revenues may change over the next five years. This is done in Table A, which includes three scenarios for grant funding (flat in real terms; 2.7% real-terms cuts per year; 7.0% real-terms cuts per year), reflecting uncertainty about the priority placed on council funding by the next government, as well as two scenarios for council tax increases (5% and 3% per year).
The table shows that, in any of these scenarios, overall funding will increase by less than the average over the 2019–24 parliament (2.9% per year in real terms). These scenarios also show that across the local government sector as a whole, the increases that are made to council tax will likely matter more for trends in overall funding than changes in grant funding. This reflects the much larger contribution that council tax makes to overall funding (57% in 2024–25) than grant funding (15%) (with retained business rates making up the remainder).
Table A. Scenarios for English council funding
| Real-terms change in grant funding each year | Increase in council tax bills each year | Average annual change in overall funding, 2024–25 to 2028–29 | |
Cash terms | Real terms | ||
| Freeze | 5% (3%+2%) | 4.2% | 2.5% |
| Freeze | 3% (2%+1%) | 3.1% | 1.3% |
| 2.7% cut | 5% (3%+2%) | 3.9% | 2.1% |
| 2.7% cut | 3% (2%+1%) | 2.7% | 1.0% |
| 7% cut | 5% (3%+2%) | 3.3% | 1.6% |
| 7% cut | 3% (2%+1%) | 2.1% | 0.4% |
Source: Table 2 in the main text. The first figure in parentheses relates to the increase in council tax for general services, and the second the additional increase for social care services.
Potential impacts of these scenarios
Councils in more deprived areas can raise relatively less in council tax than those in more affluent areas and in turn rely more on grant funding. This means that unless grant funding were redistributed towards deprived areas, councils in such areas may fare financially worse. For example, with cuts to grants of 7% a year and 5% council tax increases, councils in the most deprived tenth of areas in England would see overall funding increases averaging 0.6% a year, compared with 2.6% a year for councils covering the least deprived tenth of areas.
In order to offset this pattern, the government would need to redistribute grant funding from less deprived to more deprived areas. For example, under the scenario just described, councils in the most deprived tenth of areas would need to see their grant funding increase slightly in cash terms over the next four years, while those in the least deprived areas would need to see cuts averaging two-thirds, to equalise the cut in overall funding in 2028–29.
The impact of any future funding scenario on councils’ service provision and financial sustainability will depend crucially on the cost and demand pressures councils face. Recent Local Government Association analysis suggests that if recent demand and cost pressures continued, real-terms increases of 4.5% a year would be needed to maintain services – far outpacing the funding increases in even our optimistic scenario. Even with a significant slowdown in cost and demand growth, councils in more deprived areas could struggle under even our most optimistic funding scenario, given that they can raise less from council tax than those in richer areas. If grants are cut significantly and/or council tax increases are closer to 3%, councils across the country would need to cut back service provision and could potentially face severe financial stress, even if cost and demand pressures ease.
1. Introduction
Councils are at the heart of British democracy, local public service delivery and local economic development and placemaking. English councils, the subject of this report, have responsibility for adults’ and children’s social care services, public health,1 local roads and support for bus services, planning and economic development, housing advice and support, libraries and leisure centres, and refuse collection and disposable – among other things. They are funded by a combination of grant funding from central government, a share of business rates revenues, and council tax, as well as a range of sales, fees and charges (SFCs) for certain services and commercial and investment income. In 2023–24, the financial year just ended, spending by councils on non-education services was budgeted to be around £62 billion, or roughly £1,060 per English resident. This is roughly in line with the amount spent in England on schools, and around 40% of the amount spent on the NHS.
Like spending on the NHS, and schools, and indeed virtually all public services, English council spending was increased over the 2019–24 parliament, with higher funding from central government the main factor in this. Plans for council funding in the next parliament have been notable by their absence from this year’s election manifestos – in stark contrast to the 2019 election, when the Conservatives, Labour and the Liberal Democrats all set out specific plans (Phillips, 2019). But the overall spending envelopes set out in the March Budget, and which still largely underlie the main parties’ manifestos (other than for areas where they make specific commitments), imply cuts to a range of ‘unprotected’ spending. Traditionally, this has included grant funding for councils. Cuts to grants to councils could make councils’ finances – already stretched despite funding increases, due to rising demands and costs – even more precarious, and would certainly make councils even more dependent on council tax.
In this context, this report looks at the outlook for local government funding in the coming parliament. Section 2 sets out several key considerations for the two main sources of council funding – grant funding from central government, and council tax revenues. This shows that there is significant uncertainty about the future path of both, meaning that any analysis of the outlook for council funding must consider a range of scenarios. Section 3 then looks at these scenarios, based on more optimistic and more pessimistic assumptions for both main sources of funding. It first focuses on the national picture and then considers how the picture for different types of councils, in different parts of England, could differ. Section 4 concludes.
2. Fiscal and policy context
Councils receive funding from several different sources. Historically, the largest single source was grant funding from central government, but following cuts to grants in the 2010s, this source has been overtaken by local property taxes. Council tax is now the largest single source of revenue (an estimated 57% of core spending power in 2024–25), followed by retained business rates (28%), although grant funding is still a significant source (15%). Under current rules, income from retained business rates typically increases by a little more than inflation each year. The amounts of grant funding received and council tax raised are less certain though, depending on decisions taken by the government and councils in the light of the fiscal and political situations they find themselves in.
Current public spending plans imply large cuts to ‘unprotected’ services
The fiscal situation for the coming parliament is likely to be challenging. While firm plans for public spending for 2025–26 onwards will not be announced until after the election, the current Chancellor pencilled in plans to freeze capital spending in cash terms and increase day-to-day (resource) public service spending by 1% a year in real terms in each year between 2025–26 and 2028–29, most recently reaffirming these plans in the March 2024 Budget. Despite this spending restraint and a tax burden that was forecast to rise to record levels (37.1% of GDP by 2028–29, up from 36.5% in 2024–25 and an average of 33.2% in the 2010s), public debt was forecast to continue to rise as a share of GDP over the next few years and only fall very modestly in the final year of the forecast period, 2028–29. This partly reflects the impact of increased debt interest costs (an average of 3.3% of GDP over the next five years, up from an average of 2.1% during the 2010s).
The annual 1% increases in day-to-day public service spending pencilled in, if kept to, would mean difficult decisions for a range of public services. This is illustrated in Figure 1, which shows the implications for ‘protected’ and ‘unprotected’ spending, if the next government were to boost NHS funding in line with estimates of what is needed to meet the long-term NHS workforce plan, maintain spending on defence and overseas aid at 2% and 0.5% of GDP respectively, fully roll out the planned expansion of childcare services, and freeze school spending in real terms. The left-hand panel of the chart shows that this would mean increases in spending for the protected services averaging 2.0–2.9% per year, and cuts averaging 1.9–3.5% per year for other, unprotected services – that is, all other day-to-day central government public service spending, including grant funding for councils. The right-hand panel shows that, given the latest projections of population growth, spending per person would increase by 1.5–2.3% per year for protected services but fall by an average 2.4–4.0% per year for unprotected services.
Figure 1. Scenarios for average annual real-terms changes in spending on ‘protected’ and ‘unprotected’ services, 2024–25 to 2028–29
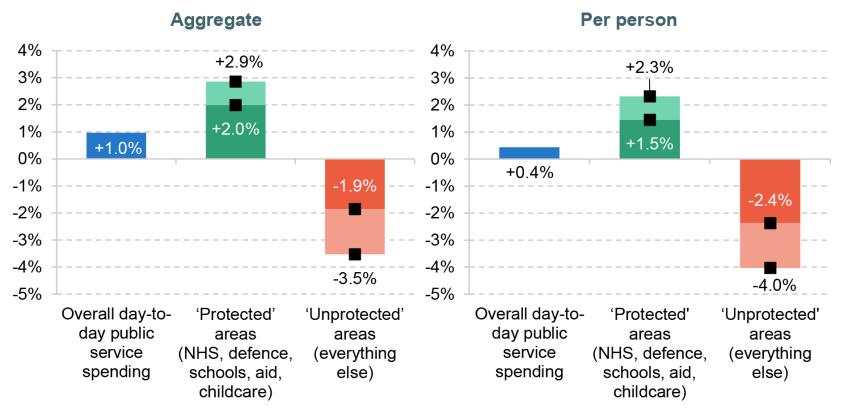
Note: Projected increases in protected and unprotected spending after 2024–25 depend on (1) what is assumed to happen to protected areas and (2) how much of HM Treasury’s £9.2 billion reserve for 2024–25 is allocated to protected and unprotected areas. The ranges provided here are not intended to cover all possible eventualities but to represent our assessment of the set of most plausible values. Per-person figures reflect the latest ONS mid-year population estimates.
Source: Boileau, Stockton and Zaranko, 2024.
Despite highlighting a range of ills in public service delivery that need to be addressed, neither the Conservative nor Labour manifesto deviated much from these existing plans. The Conservatives pledged to increase funding for defence to 2.5% of GDP by 2030, funding this by a range of ‘efficiencies’ that would likely slightly increase the overall pace of cuts to spending on unprotected areas (Adam et al., 2024). Conversely, Labour’s modest increases in funding for the NHS and schools, instead funded by small tax rises, might allow a slight easing of the pace of cuts (Boileau et al., 2024). But these differences are minor in the grand scheme of things.
Overall government spending may be topped up …
When whoever is Chancellor after the upcoming election sits down to allocate spending between departments, these pre-election plans may be revised, potentially substantially. Recent history suggests that, notwithstanding the difficult fiscal outlook, spending plans are more likely to be revised upwards than downwards, perhaps reflecting the fact that it is harder politically to implement cuts to specific services than pencil in generic unallocated cuts. The Office for Budget Responsibility found that since its foundation, spending has been revised up by an average of £14.3 billion per year at Spending Reviews, with the increase being over £30 billion for the 2021 Spending Review (Atkins and Lanskey, 2023).
Moreover, the last 14 years have also seen the spending plans set out in Spending Reviews topped up in subsequent fiscal events, by an average of £1.5 billion (Atkins and Lanskey, 2023). However, recent top-ups to the spending plans initially set in the 2021 Spending Review have not been big enough to offset the impact of higher-than-expected inflation during 2022–23 and 2023–24 on the real-terms value of overall day-to-day public service spending: initial plans of 3.1% per year real-terms increases between 2019–20 and 2024–25 are now forecast to amount to 2.3% per year instead. Local government is one exception to this though, with the cash top-ups to funding seen in the 2022 Autumn Statement, and subsequently, more than offsetting the impact of higher economy-wide inflation (Ogden and Phillips, 2024).
… but the room for manoeuvre is limited
Substantial top-ups to the spending plans implicit in the main parties’ manifestos would mean one of two things: higher borrowing, and debt, which on current economic forecasts would mean breaching the fiscal rules that the parties have committed to; or tax rises. Post-election increases in taxes would not be unexpected – it is a pattern going back decades.2 But both the Conservative and Labour parties have ruled out increases is a swathe of taxes, and it may prove tricky to raise meaningful sums of revenue without either increasing or introducing different, more economically damaging, taxes, or breaking these pledges (Adam et al., 2024; Boileau et al., 2024). Top-ups to overall spending plans of a sufficient scale to avoid cuts to at least some unprotected services should therefore not be banked upon.
Uncertainty over how councils will fare
As well as uncertainty about the total funding that will be made available for day-to-day spending on public services in the next parliament, there is also uncertainty about how this will be divided up between services. The government may choose to increase spending on the NHS and schools by less than assumed above, in order to ease any squeeze on other services. And the changes in funding for different services in the ‘other’ (or ‘unprotected’) category may differ substantially based on the spending pressures they face and the political priorities of the next government. This means for any given trajectory for overall public service spending, it is unclear exactly how councils would fare.
Recent history has seen central government grants for councils fare both much worse and much better than the average, as illustrated in Table 1. During the 2010s, for example, central government funding for councils was cut by much more than the average for ‘unprotected services’ (let alone all other services). Between 2010–11 and 2019–20, central government funding for councils was cut by 55% in real terms,3 compared with 20% for other ‘unprotected’ services and zero change for all services other than local government. In contrast, in the period between 2019–20 and 2024–25, central government funding for councils is set to increase by 26% in real terms, compared with 2% for historically ‘unprotected’ services, and 11% for all services other than local government.
Table 1. Real-terms changes in different areas of central government day-to-day (resource) spending
| 2010–11 to 2019–20 | 2019–20 to 2024–25 | |
| Funding for councils | –55% | +26% |
| Other ‘unprotected’ services | –20% | +2% |
| All services (excluding local government) | 0% | +11% |
Note: ‘Funding for councils’ includes the grants and baseline retained business rates included in ‘core spending power’. Unprotected services include the following departments: Home Office, Justice, Law Officers’ Departments, Defence, DLUHC (Levelling Up, Housing and Communities), Transport, Environment, Food and Rural Affairs, Work and Pensions, HMRC and HM Treasury. Note that not all spending has yet been allocated to departments in 2024–25. Adjusted for inflation using the GDP deflator measure.
Source: Authors’ calculations based on PESAs (various), Spring Budget 2024 and GDP deflator as of March 2024.
A number of factors may have contributed to these different degrees of prioritisation of funding for councils in the 2010s and early 2020s.
First, one of the reasons councils may have faced bigger-than-average cuts in central government funding in the 2010s is that their own council tax revenues meant that the cuts in grants translated into smaller cuts in overall funding. Indeed, councils’ overall core spending power (including council tax) fell by 26% during the 2010s, more in line with the average cut to unprotected departments. On the other hand, when funding for public services was being increased in the early 2020s, the tax bills charged by councils were barely keeping pace with inflation. This meant bigger percentage increases in central government funding were needed to generate a given percentage change in overall funding for councils than for other services (which typically rely fully on central government funding).
Second, the nature of councils’ grant funding has also changed. At the start of the 2010s, most was in the form of a general revenue support grant, making up around half of councils’ core spending power. However, by 2019–20, this unringfenced grant funding was a relatively small fraction of core spending power (5%). Instead, much of this had been replaced by retained business rates (31%), which the government had promised councils would increase in line with inflation, before considering any growth or fall in local business property space. And a growing pot was grant funding that was ringfenced or earmarked for social care services (6%), which may be politically harder to cut and more beneficial to increase given the direct link to a specific, politically salient service.
Third, and somewhat related, was a shift in the nature of council spending, with an increasing fraction going towards social care services, and either statutory duties (such as concessionary bus travel) or those with acute needs (such as the homeless or those at risk of homelessness). For example, adults’ and children’s acute social care services make up an estimated 63% of councils’ non-education spending in 2019–20, compared with 50% in 2010–11. The clear evidence that councils’ budgets are increasingly focused on high-needs residents and/or services that a high political priority was placed on could have affected decisions.
Looking to the future, there has been a further increase in the share of grant funding that is ringfenced or earmarked for social care services (accounting for a large majority of grant funding and 14% of core spending power in 2024–25), and in the fraction of spending going towards social care services (65% in 2023–24). As discussed in our previous election briefing report on local government funding and spending since 2010 (Ogden and Phillips, 2024), despite funding increases there is also strong evidence that councils are under growing financial strain. Demands and costs for a number of key services – such as children’s social care, home-to-school transport for children with special education needs and temporary accommodation – have risen substantially. Spending has outpaced increases in funding, with councils drawing down reserves built up during the COVID-19 pandemic. And a number of councils have had to take emergency financial measures, with others warning that they may need to do this in the near future.
Such factors suggest the next government may be less inclined to cut back councils’ grant funding significantly on the basis of councils’ ability to raise revenues via council tax than the coalition government of the 2010s was. However, this is far from certain, and a difficult fiscal context means that increases in grant funding of the scale seen between 2019–20 and 2024–25 are unlikely.
Council tax choices
Constrained grant funding will mean that any increases in council tax will almost certainly matter more for councils’ overall funding in the coming parliament than in the preceding one.
In both 2023–24 and 2024–25, councils with social care responsibilities have been able to increase their council tax by up to 5% without calling a local referendum, while district councils have been able to increase their council tax by 3%.4 Overall, council tax bills increased by an average of 4.4% a year in cash terms between April 2019 and April 2024, which translates into zero change in real terms given high inflation. In contrast, increases averaging 3.6% per year between 2014–15 and 2019–20 were equivalent to real-terms increases averaging 2.0%. And during the early 2010s, a freeze in council tax rates by most councils meant average cash-terms increases of 0.8% per year between 2009–10 and 2014–15 were equivalent to an average real-terms cut of 2.1% per year. Recent history has therefore seen very different real-terms changes in council tax rates, driven both by changes in central government priorities – which before 2015 were to hold council tax down, and since 2015 have been to use it as a source of funding for social care in particular – and by changes in inflation rates.
Looking ahead, inflation is currently forecast to be much lower than over the last few years – just 1.8%, on average, in the four years from 2025–26 to 2028–29 according to the CPI measure, down from 4.3% on average for the years 2019–20 to 2024–25. Recent history has shown us that inflation can be volatile though, and it could turn out to be either lower or higher than these central forecasts (probably with more upside risk).
If inflation followed this central path though, increases in council tax of 5% per year would equate to real-terms increases of 3% per year, on average. This would be the highest since the 2001–05 parliament (when the increase averaged around 6% a year in real terms). Both central government and councils may therefore wish to reduce the nominal rate of increase in council tax in the coming parliament from recent levels, if inflation does fall back as expected.
On the other hand, an incoming government could decide to abolish council tax referendum requirements as part of devolution plans. Experience from Wales suggests that council tax increases may be larger in the absence of such requirements, especially for councils that historically set low tax rates (and so where a given percentage increase raises less in cash terms). For example, the average Band D tax rate in Wales increased by 4.9% on average over the last five years and 7.7% in the current year, compared with 4.4% and 5.1% respectively in England. And the average increase over the last five years for the quarter of Welsh councils with the lowest tax rates as of 2019–20 has been 5.7% compared with 4.2% for the quarter with the highest tax rates.
As with grant funding, there is therefore significant uncertainty about the future outlook for English councils’ council tax revenues.
3. Illustrative scenarios for councils’ funding
The significant uncertainty about both grant funding and council tax increases from 2025–26 onwards means that it is not possible to say with any certainty how councils’ funding will evolve over the next parliament. However, it is possible to look at a range of plausible more optimistic and more pessimistic scenarios. We do this first for councils across England as a whole, before discussing how different types of councils may fare. The latter adds another element of uncertainty: the allocation of funding between councils. In our main scenarios, we assume that each council’s grant funding is changed at the same percentage rate. However, we discuss how much grant funding would need to be redistributed in order to equalise the overall change in funding across councils. This section concludes with a discussion of the implications of these different funding scenarios for councils’ services and financial sustainability, which will depend crucially on trends in costs and demands.
Scenarios for England as a whole
Our scenarios for overall funding are based on scenarios for both grant funding and council tax. For grant funding, we have three scenarios:
- A more optimistic scenario, where grant funding is frozen in real terms. Such a scenario could reflect top-ups to overall public service spending plans and/or a decision to prioritise council funding by more than during the 2010s given changes in the nature of council funding and spending, and evident pressure on council services.
- A middle scenario, where grant funding is cut in line with the average cut for unprotected services set out in Figure 1: the equivalent of 2.7% per year, in real terms.
- A more pessimistic scenario, where grant funding is cut at twice the rate of the upper estimate in the range for unprotected services set out in Figure 1: the equivalent of 7.0% per year, in real terms. Such a scenario could reflect a decision to cut funding for councils significantly to address spending pressures or priorities elsewhere, in the context of councils’ own revenue-raising abilities via council tax.
For council tax, we have two scenarios:
- Council tax increases by 3% for shire districts, with an additional 2% for councils with social care responsibilities (a total of 5%), in line with the referendum limits over the last two years.
- Council tax increases by 2% for shire districts, with an additional 1% for councils with social care responsibilities (a total of 3%), in line with plans set out at the time of the 2021 Spending Review (and prior to the large increase in inflation and councils’ costs that later became apparent).
Together, this means six scenarios, with more or less optimistic assumptions for both grant funding and council tax revenues. These are not designed to put bounds on the potential change in funding, but instead show plausible, illustrative scenarios.
Full information on what these scenarios would mean for cash- and real-terms changes in council funding across England, broken down by funding source, and separately by year, can be found in Figures A1–A3 in the appendix. Table 2 provides a summary, showing the average annual cash-terms and real-terms change in overall council funding (‘core spending power’) between 2024–25 and 2028–29 under each of these scenarios.
Table 2. Scenarios for English council funding (‘core spending power’)
| Real-terms change in grant funding each year | Increase in council tax bills each year | Average annual change in overall funding, 2024–25 to 2028–29 | |
Cash terms | Real terms | ||
| Freeze | 5% (3%+2%) | 4.2% | 2.5% |
| Freeze | 3% (2%+1%) | 3.1% | 1.3% |
| 2.7% cut | 5% (3%+2%) | 3.9% | 2.1% |
| 2.7% cut | 3% (2%+1%) | 2.7% | 1.0% |
| 7.0% cut | 5% (3%+2%) | 3.3% | 1.6% |
| 7.0% cut | 3% (2%+1%) | 2.1% | 0.4% |
Note: Assumes council tax base growth of 1% per annum and retained business rates in line with forecast for CPI in Q3 the previous year. Adjusted for inflation using the GDP deflator measure.
Source: Authors' calculations based on Final Local Government Finance Settlement 2024, OBR Economic and Fiscal Outlook 2024 and GDP deflator as of March 2024.
First consider the more optimistic grant funding scenario – a real-terms freeze. The table shows that with 5% council tax increases, across England as a whole, council funding would increase by around 2.5% per year, in real terms, on average between 2024–25 and 2028–29. Increases in council tax of 3% a year would instead result in increases in funding of approximately 1.3% per year, in real terms, over the same period. These changes compare with increases over the parliament just ending (2019–20 to 2024–25) averaging approximately 2.9% per year.
Under our middle scenario for grant funding, with 2.7% real-terms cuts, councils’ overall funding would increase by an average of 2.1% a year in real terms if council tax were increased by 5% (3% + 2% for social care) per year, and by 1.0% a year if council tax were increased by 3% (2% + 1% for social care) each year. Comparing the first two and second two rows of the table shows that whether grants are cut by 2.7% a year or are maintained in real terms has a relatively modest impact on overall spending power: the overall change per year differs by about 0.4 percentage points. This compares with around a 1.2-percentage-point difference depending on whether council tax is increased by 5% or 3% per year.
Finally, under our more pessimistic grant scenario, with 7% real-terms reductions in grant funding per year, council tax increases of 5% (3%+2%) would enable real-terms increases in overall funding of approximately 1.6% per year. On the other hand, council tax increases of 3% a year would see overall funding increase by just 0.4% a year in real terms. Given projections of population growth, that would mean real-terms reductions in overall funding per person.
How might different councils fare?
The funding outlook for different councils will depend not only on the overall level of funding provided to councils, but also on how it is distributed between councils. While this is not known yet, what is known is that if councils are more reliant on council tax for increases in funding in the next parliament than in the current one, as seems likely, this will have different implications for different parts of England. This is because the extent to which different councils rely on grant funding versus council tax varies. Broadly speaking, both poorer and more urban areas rely more on grant funding and can raise relatively less from council tax than more affluent, more suburban or rural areas. Similarly, councils in the North can raise relatively less from council tax than councils in the South (outside of London).
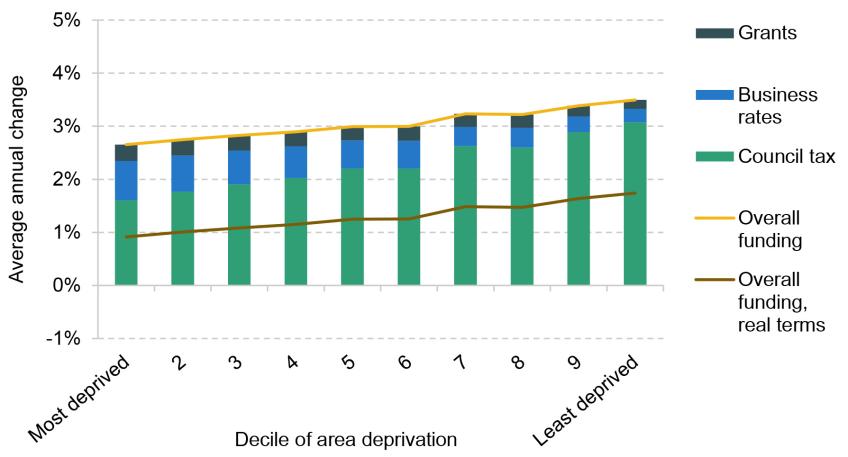
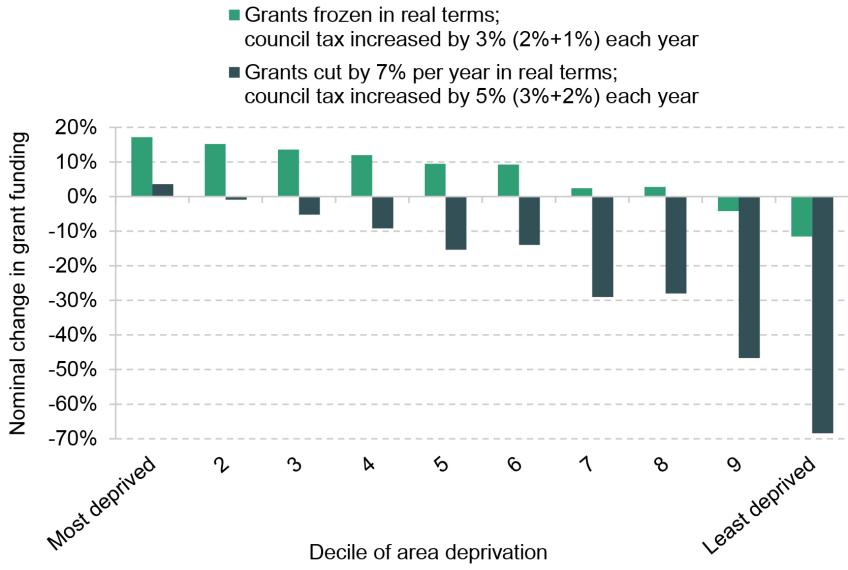
The potential implications of this are illustrated in Figure 2. This shows how the change in funding would vary across councils depending on the levels of deprivation in the areas they cover, and assuming that grant funding for all councils is changed at the same percentage rate. The top panel shows what would happen if grant funding were maintained in real terms and council tax increased by 3% (2%+1%) per year. The green bars show clearly that councils in more deprived areas could raise less from council tax increases than councils in less deprived areas – for example, the equivalent of an extra 1.6% of existing funding per year for the most deprived tenth, compared with 3.1% for the least deprived tenth. Increases in business rates revenues would partially offset this pattern. However, the most deprived tenth of councils would see their overall funding increase by an average of 0.9% a year in real terms under this scenario, compared with 1.7% a year for the least deprived tenth of councils.
Figure 2. Projected changes in funding by deprivation level of council, 2024–25 to 2028–29
Grants frozen in real terms and council tax increased by 3% (2%+1%) each year
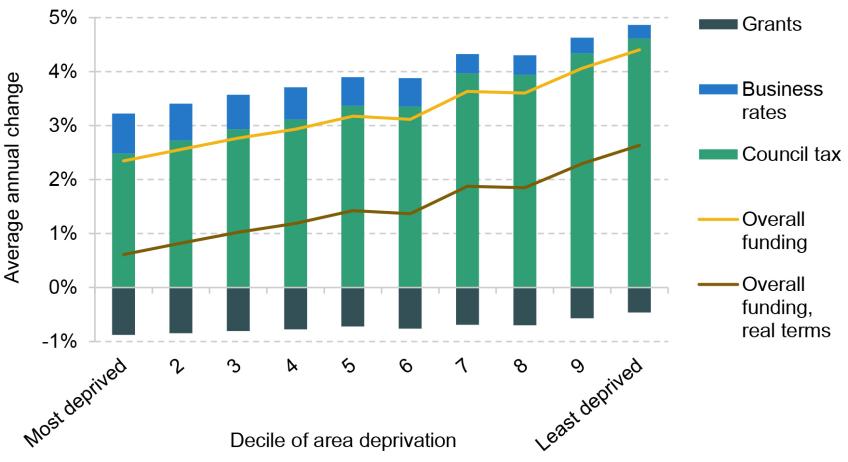
Grants cut by 7.0% per year in real terms and council tax increased by 5% (3%+2%) each year
Note and source: See note and source to Table 2. In addition, deprivation deciles are at the upper tier, based on Average Score from Index of Multiple Deprivation 2019.
The bottom panel of Figure 2 shows that if grant funding were instead reduced by 7% per year in real terms, and council tax increased by 5% (3%+2%) per year, the differences would be even more extreme. Under this scenario, the most deprived tenth of councils could see real-terms funding increases averaging just 0.6% per year, compared with 2.6% in the least deprived tenth of council areas. Figure 2 therefore clearly illustrates that unless grant funding is redistributed between councils, both bigger increases in council tax and bigger cuts in grant funding would see councils serving deprived areas lose out relative to councils serving less deprived areas. This reflects poorer areas’ smaller council tax bases and greater reliance on grant funding.
Grant funding could be redistributed, but the scale of redistribution required to equalise changes in overall funding across councils would likely be significant. Figure 3 shows the cash-terms changes in grant funding that would be needed in order to do this equalisation, for two of our scenarios. For example, if overall grant funding levels were held flat in real terms and council tax increased by 3% (2%+1%), councils serving the most deprived tenth of areas would require a cash-terms increase in grant funding of 17% by 2028–29, compared with 9% increases for councils with middling levels of deprivation and a 12% cut for those with the lowest levels of deprivation. Under our scenario with 7% real cuts in grant funding and 5% (3%+2%) council tax increases, equalising changes in overall funding would require increasing the grant funding of councils in the most deprived areas slightly in cash terms over the next four years, but cutting it by over two-thirds in the least deprived areas. Such a big redistribution of grant funding could be politically difficult; if it were undertaken, it would probably make sense to reintroduce a proper system for assessing councils’ spending needs – something which has been lacking in England for over 10 years (Ogden et al., 2022).
Figure 3. Changes in grant funding by deprivation level of council to equalise change in overall funding, 2024–25 to 2028–29
Note and source: See note and source to Table 2. In addition, deprivation deciles are at the upper tier, based on Average Score from Index of Multiple Deprivation 2019.
Implications for service provision and financial sustainability
The implications of each of these funding scenarios for councils’ service provision and financial sustainability will depend crucially on the cost and demand pressures faced by councils in the coming years. As highlighted in Ogden and Phillips (2024), a number of services have seen big increases in demand and/or substantial above-inflation increases in costs over the last five years, including: special educational needs support; children’s social care residential placements; adult social care services; and temporary accommodation for homeless households. These have contributed to growing budget overspends, drawdown of reserves (albeit following big increases during the pandemic and the 2010s) and an increasing number of councils requiring special financial flexibilities (such as using capital funding for day-to-day spending). This is despite real-terms funding increases averaging approximately 2.9% per year between 2019–20 and 2024–25.
The Local Government Association (LGA) has projected forward councils’ spending on the basis of these demand and above-inflation cost pressures continuing to increase at the same rate as in the recent past, apart from a slowdown in increases in the National Living Wage.5 On this basis, it projects that to maintain service provision, spending would need to grow by 6.1% per year, on average, in 2025–26 and 2026–27, compared with an economy-wide inflation forecast of 1.5%: approximately 4.5% in real terms. This is around 1.8 times as fast as the overall average increase in funding per year in the most optimistic scenario examined above – a real-terms freeze in grant funding plus council tax increases of up to 5% (3%+2%), which amounts to an average of just over 2.5% per year in 2025–26 and 2026–27. The LGA has used this figure for spending needs growth to project that under a cash-terms freeze in grant funding plus council tax increases of up to 5% (3%+2%), councils could face ‘funding gaps’ of £2.3 billion in 2025–26 and £3.9 billion in 2026–27 (Local Government Association, 2024), equivalent to around 3% and 5% of councils’ spending on services in those years, respectively.
Growth in demand and cost pressures is likely to moderate at some stage – but when and by how much is unclear. If pressures slowed quickly and significantly, increases in council tax of 5% (3%+2%) may be consistent with funding keeping pace with spending needs across England as a whole, even if grant funding is subject to some cuts. For example, if above-inflation demand and cost pressures were instead 2% per year, council tax increases of 5% (3%+2%) combined with 2.7% real-terms cuts in grant funding per year would just be sufficient to meet spending pressures across England as a whole (with 2.1% real-terms increases in funding per year – see Table 2). However, unless grant funding were redistributed to more deprived places with lower council tax bases as it was cut, while less deprived areas could have more than sufficient funding to address increases in spending pressures, more deprived areas would likely struggle. For example, whereas under this scenario councils in the least deprived areas would see an increase in funding of 3.0% per year, on average (outpacing spending pressures if they slow to 2% above inflation), the most deprived areas would see an increase in funding of just 1.3% per year, on average (well below these pressures).
Even if demand and cost pressures moderate, increases in council tax of 3% (2%+1%) would be unlikely to be sufficient to address spending pressures, even if grants were maintained in real terms: as shown in Table 2, this scenario would see real-terms increases in funding averaging 1.3% a year. The shortfall would again be most significant for councils in more deprived areas, unless grant funding were distributed towards them.
In the short term, many councils would likely have scope to (further) draw down their reserves if spending outpaced revenues: at the end of 2022–23, reserves averaged 51% of core spending power, which although down from their peak during the pandemic, was up from 43% in 2019–20 and 21% in 2010–11. But this would not be true of all councils: one in ten councils had reserves that were at least one-third lower than 2019–20 levels, and one in six single- or upper-tier councils with responsibility for social care services had reserves below 25% of their core spending power. In addition, any cash taken from reserves can only be used once, and it would be imprudent to draw down reserves too far, in case councils need to respond to an unexpected shock to their revenues, spending or asset position. Ultimately, councils would need to bring spending back into line with revenues, which would likely require cutbacks in service provision. With more discretionary services already often having faced cuts in spending per resident of 40–70% since 2010–11 (Ogden and Phillips, 2024),6 and evident pressures in a number of services where councils have statutory duties to residents with high needs (such as social care, special educational needs support and temporary accommodation), councils may struggle to make the cuts required. It would not be surprising if more reach the point where their chief finance officer feels the need to issue a Section 114 notice, temporarily halting non-mandatory spending, until emergency cuts or revenue-raising measures can be agreed.
4. Conclusion
This report has looked at the outlook for local government funding and finances in the coming parliament. There is uncertainty about both the grant funding that will be provided, and the council tax increases that councils will be allowed (and feel able) to implement. In turn, this reflects almost complete silence on the issue of local government funding in the main parties’ manifestos, in contrast to their 2019 manifestos (Phillips, 2019). The Conservatives, Labour and the Liberal Democrats all pledge a multi-year settlement, and a July election should mean it is possible to provide one by the time of the 2025–26 draft Local Government Finance Settlement in December. This would provide greater clarity (albeit not full certainty) over future funding levels, facilitating effective financial and service planning. But the parties have given no indication themselves yet what this multi-year settlement may look like.
This report has therefore used scenarios to examine the potential outlook for local government funding. These have illustrated three key points:
- The increases in council tax that are allowed will likely matter more for councils’ overall funding outlook than changes in grants. This reflects that council tax makes up 57% of core spending power, compared with 15% for grants from central government. In 2025–26, 1 percentage point on council tax bills would therefore be equivalent to roughly a 4% change in grant funding across England as a whole. This means that the impact on funding levels of a decision to maintain grant funding in real terms as opposed to cutting it by 2.7% is around one-third of the impact of increasing council tax bills by 5% instead of 3% per year.
- The likelihood that councils will become increasingly reliant on council tax in the coming parliament means that unless grant funding were redistributed between councils, those in more deprived areas would likely fare financially worse than those in more affluent areas. This is because those in more deprived areas have smaller tax bases and instead rely on central government grants for more of their overall funding.
- Whether changes in funding are sufficient to meet changes in councils’ spending needs will depend critically on whether recent demand and above-inflation cost pressures slow down. If they do not, even 5% increases in council tax will not be sufficient, despite inflation being expected to average just under 2% a year over the next five years. If pressures do slow down, 5% increases in council tax may be sufficient in more affluent parts of the country, but would be unlikely to be sufficient in more deprived areas, unless grant funding were redistributed towards them. Even if demand and cost pressures do slow down, 3% increases in council tax would likely be insufficient to meet spending pressures even in more affluent areas.
The coming parliament will therefore likely be financially challenging for local government – although just how much so is not yet clear.
The particular challenge facing more deprived areas if councils are reliant on council tax for more of their funding is a reminder that England lacks a proper system for assessing the spending needs and revenue-raising capacities of different councils and for distributing funding accordingly (Ogden et al., 2022). Putting in place such a system, and in particular redistributing funding in line with any updated needs assessments, would be both more important and practically and politically more difficult to implement if funding is limited. This makes reviewing arrangements and putting in place a modernised local government finance system a tricky task for the next government – and the issues and options for the design of such a system, as well as for funding local services more generally, are issues we will examine in a post-election report. Such a review could also consider whether the funding available to councils overall is sufficient for them to deliver the range and quality of services expected. Ensuring appropriate funding levels both nationally and to different councils is a key element of any plan for ‘levelling up’ and reducing geographic inequalities.
Given the evident pressures councils face in funding their existing responsibilities, the next government should also ensure plans are in place for funding any additional responsibilities councils will face. This is particularly true for adult social care services, where unlike general local government funding, the Conservative, Labour and Liberal Democrat manifestos did make commitments of varying degrees of ambition and specificity (see: Adam et al., 2024; Boileau et al., 2024; and Emmerson et al., 2024). However, neither the Conservatives nor Labour identified any specific funding to pay for their ‘cap-and-floor’ and ‘National Care Service’ proposals, respectively, and because the Liberal Democrats assumed funding was already in place for a cap-and-floor system, they have not identified sufficient funding to fully cover the costs of their proposals for free personal care and wage increases. Paying for any of these plans would require some combination of tax rises, higher borrowing or cuts to other areas of public spending. The limited tax-raising powers available to councils, who cannot borrow to cover day-to-day spending, mean that if central government did not fully cover the costs of social care reform, councils would need to cut back other spending. This could be on other services, or by further increasing the stringency of care needs tests used to determine who is ill or disabled enough to require support. That could see existing low-income/asset recipients of care lose access to care to pay for an expanded offering for middle- and higher-income/asset individuals who would be newly eligible for support.
Thus, while we have heard little about local government funding in the run-up to the election, the next government will not be able to avoid the issue.
Appendix
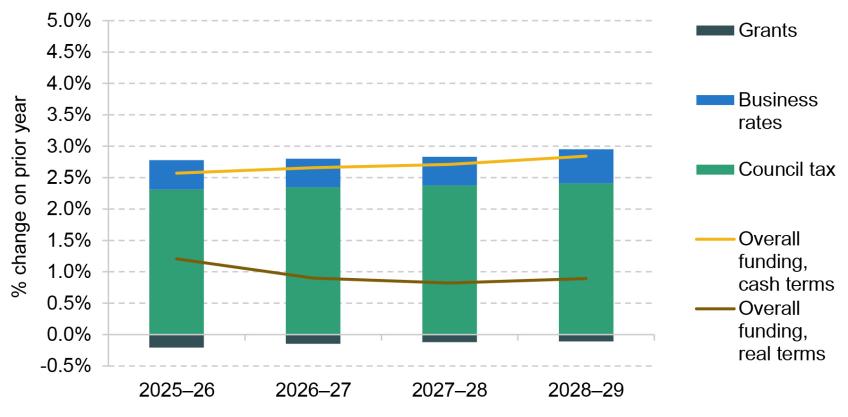
Figure A1. Funding projections under a real-terms freeze in grant funding
Council tax increases of 5% (3% + 2% for social care)
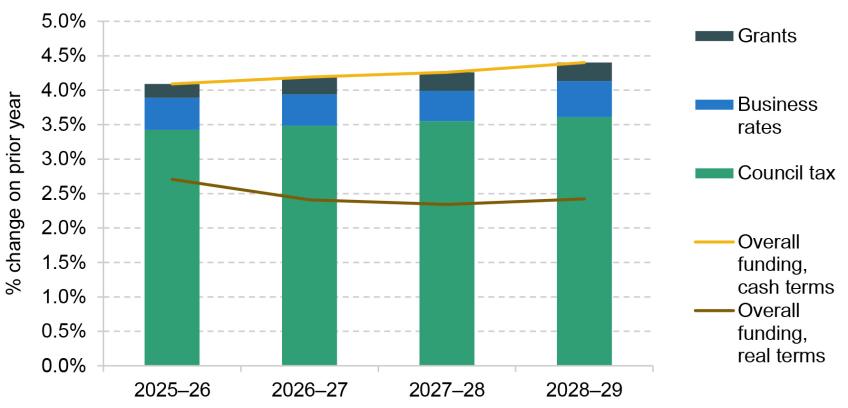
Council tax increases of 3% (2% + 1% for social care)

Note and source: See note and source to Table 2.
Figure A2. Funding projections under 2.7% real-terms cuts in grant funding
Council tax increases of 5% (3% + 2% for social care)

Council tax increases of 3% (2% + 1% for social care)
Note and source: See note and source to Table 2.
Figure A3. Funding projections under 7.0% real-terms cuts in grant funding
Council tax increases of 5% (3% + 2% for social care)
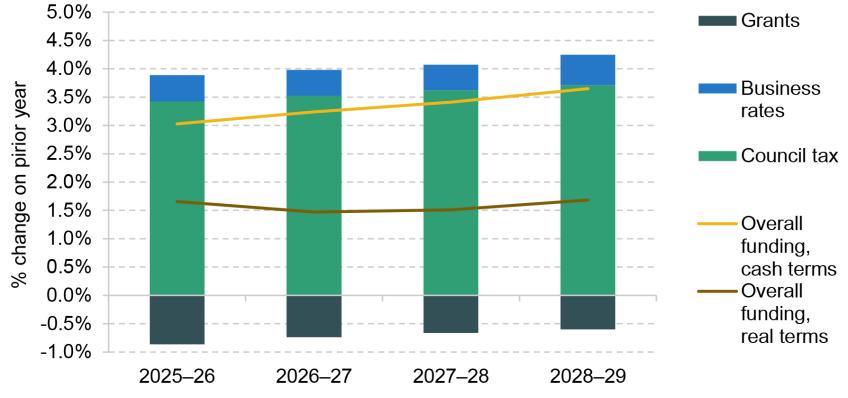
Council tax increases of 3% (2% + 1% for social care)

Note and source: See note and source to Table 2.
References
Adam, S., Boileau, B., Emmerson, C., Farquharson, C., Johnson, P., Joyce, R., Miller, H., Phillips, D., Stoye, G., Sturrock, D., Tahir, I., Warner, M., Waters, T. and Wernham, T., 2024. The Conservative manifesto: an initial response. Institute for Fiscal Studies (IFS), Comment, https://ifs.org.uk/articles/conservative-manifesto-initial-response.
Atkins, G. and Lanskey, L., 2023. The OBR’s forecast performance. Office for Budget Responsibility (OBR), Working Paper 19, https://obr.uk/working-paper-19-the-obrs-forecast-performance/.
Boileau, B., Farquharson, C., Johnson, P., Miller, H., Stockton, I., Stoye, G., Warner, M. and Waters, T., 2024. Labour Party manifesto: an initial response. Institute for Fiscal Studies (IFS), Comment, https://ifs.org.uk/articles/labour-party-manifesto-initial-response.
Emmerson, C., Farquharson, C., Johnson, P., Miller, H., Warner, M. and Waters, T., 2024. Liberal Democrat manifesto: a reaction. Institute for Fiscal Studies (IFS), Comment, https://ifs.org.uk/articles/liberal-democrat-manifesto-reaction.
Local Government Association, 2024. Local Government White Paper. https://www.local.gov.uk/publications/local-government-white-paper.
Ogden, K. and Phillips, D., 2024. How have English councils’ funding and spending changed? 2010 to 2024. Institute for Fiscal Studies (IFS), Report 318, https://ifs.org.uk/publications/how-have-english-councils-funding-and-spending-changed-2010-2024.
Ogden, K., Phillips, D., Sibieta, L., Warner, M. and Zaranko, Z., 2022. Does funding follow need? An analysis of the geographic distribution of public spending in England. Institute for Fiscal Studies (IFS), Report 224, https://ifs.org.uk/publications/does-funding-follow-need-analysis-geographic-distribution-public-spending-england.
Phillips, D., 2019. What do the election manifestos mean for local government funding? Institute for Fiscal Studies (IFS), Comment, https://ifs.org.uk/articles/what-do-election-manifestos-mean-local-government-funding.
Endnotes
Authors

Kate Ogden
Kate joined the IFS in 2020 and works on local government finance and higher education.

David Phillips
David is Head of Devolved and Local Government Finance. He also works on tax in developing countries as part of our TaxDev centre.
More from IFS
Understand this issue


Policy analysis


Academic research


