
Downloads
Download report PDF
PDF | 660.68 KB
Executive summary
Like spending on the NHS, and schools, English council funding has increased over the current parliament. But that follows a decade of austerity in the 2010s. And despite funding increases, councils are again under significant financial pressure, with increases in spending outpacing revenues and reserves being drawn down. Some, very publicly, have had to take emergency measures to bolster their budget – most notably Birmingham City Council, Europe’s largest lower-tier council. And more generally, spending continues to be increasingly concentrated on services for a relatively small number of residents with the most acute needs.
In this context, this report looks at how council funding and spending are set to have changed over the current (2019–24) parliament and puts these changes in a longer-run context back to 2010. What emerges is a picture of two interconnected challenges on the level and distribution of funding that the next government will need to grapple with – and which the worrying outlook for the overall public finances will make especially difficult to address.
Key findings
1. Taking the period 2010–11 to 2024–25 as a whole, councils’ overall core funding is set to be 9% lower in real terms and 18% lower in real terms per person this year than at the start of the 2010s. The reduction is set to be larger for councils serving deprived areas (e.g. 26% per person for the most deprived tenth) than for the less deprived areas (e.g. 11% for the least deprived tenth). This reflects the fact that the funding increases seen since 2019–20 have offset only part of the overall cuts seen in the 2010s, which fell hardest on poorer areas. Average council tax bills are around 2% higher in real terms than in 2010–11, and little changed since 2019–20, with high inflation offsetting high nominal increases over the last few years. This compares with a real-terms increase of over 60% between 1997–98 and 2010–11.
2. During the 2010s, councils’ overall core funding per person fell by 26% in real terms, on average, with higher council tax revenues only partially offsetting a 46% fall in funding from central government. But these cuts affected areas differently: in the most deprived tenth of councils, funding per person fell by 35%, compared with 15% in the least deprived areas. Councils in the North and London were also relatively harder hit. Councils responded by prioritising statutory services: while spending per person on children’s social care rose by 11% in real terms, per-person spending on culture and leisure, housing, planning and development, and transport fell by over 40%. Councils also offset some of these pressures by raising more from sales, fees and charges on service users.
3. Despite new responsibilities, increased costs and lower income from sales, fees and charges, a boost to central government funding meant councils’ financial position generally improved during the COVID-19 pandemic itself. Based on information reported by councils on in-year financial monitoring returns, the government provided approximately £9.7 billion in additional funding in 2020–21. However, we estimate that councils’ in-year financial reports overestimated the financial effects of COVID-19 by around £4 billion in 2020–21, meaning that councils were able to increase their reserves by around £5 billion (25%). A further £3.5 billion in COVID-related funding was provided in 2021–22, and enabled councils to further increase their reserves by around £2.3 billion (9%). This pattern of increased reserves was also seen in Scotland and Wales.
4. Post-pandemic funding plans have been topped up several times in the face of high inflation, but councils’ spending has still outpaced funding increases over the last two years. No further COVID-specific funding was provided after April 2022. Following a front-loaded increase in core funding in 2022–23 to partially compensate for this, grant funding for existing services was set to be frozen for the remainder of the current parliament. In response to a surge in inflation and evident pressures on councils’ budgets, central government announced several substantial top-ups to these plans, amounting to approximately £7.5 billion extra in 2024–25. Based on economy-wide inflation, this has more than offset the impact of higher-than-expected inflation, and means that on average, funding per person in 2024–25 is set to be 10% higher in real terms than in 2019–20, with bigger increases for the most deprived councils (14% per person) than for the least deprived (5% per person). Despite this, spending increased by more than funding in both 2022–23 and 2023–24, leading councils to draw down their reserves by a forecast £3 billion.
5. Acute services continue to be a major driver of spending, with user numbers growing and costs outpacing general inflation. For example, the number of children in secure units and children’s homes and the number with Education, Health and Care plans both increased by over 30% between early 2020 and early 2023, while the number of homeless households in B&Bs doubled between the end of 2019 and September 2023. The cost per placement in children’s homes increased by 20% between 2019–20 and 2022–23, while the cost of care home placements for adults aged 65 or over increased by 35% between 2019–20 and 2023–24 – in both cases almost double whole-economy inflation measured over the same periods.
6. A combination of general cost pressures and specific local issues has pushed some councils into acute financial distress. Six councils have had to issue so-called Section 114 notices, preventing any new expenditure that is not needed to satisfy a legal duty, and giving councillors three weeks to agree emergency reductions to spending or income-raising measures. In each instance, as well as general spending pressures, there have been other financial issues involved, including a major equal pay claim in the case of Birmingham, and high borrowing and issues related to investments in the other cases. Since 2020, a total of 29 councils have requested and been granted permission to make use of capital funding and proceeds from land and asset sales to help support day-to-day spending. While less drastic than Section 114 notices, the use of such ‘capitalisation directions’ provides evidence of more widespread acute pressure on councils’ finances.
7. The 2019–24 parliament has therefore not been one of austerity for local government. But it has only very partially undone the cuts seen in the previous decade. What might appear to be generous real-terms increases in funding have been absorbed by rising demands and costs for key services, placing a growing number of councils under severe financial pressure. With a highly challenging landscape for the overall public finances, the next government would struggle to boost funding for councils as much as over the last five years. As a result, real-terms cuts to spending on at least some council services are likely to resume, and unless demand and cost pressures abate, the number of councils being pushed to the financial brink will almost certainly increase.
8. The next government will also need to make a decision on whether to pursue reforms to council funding, which has become increasingly disconnected from the needs of different areas. After sensibly being postponed at the height of the pandemic, planned systematic reforms to the local government finance system were pushed back until 2025 at the earliest – nine years after work on them initially began.
1. Introduction
Councils are at the heart of British democracy, local public service delivery and local economic development and placemaking. English councils, the subject of this report, have responsibility for adults’ and children’s social care services, public health, local roads and support for bus services, planning and economic development, housing advice and support, libraries and leisure centres, and refuse collection and disposable – among other things. They are funded by a combination of grant funding from central government, a share of business rates revenues, and council tax, as well as a range of sales, fees and charges (SFCs) for certain services and commercial and investment income. In 2023–24, the financial year just ended, spending on non-education services was initially budgeted to be around £62 billion, or roughly £1,060 per English resident. This is roughly in line with the amount spent on schools, and almost 40% of the amount spent on the NHS.
Like spending on the NHS, and schools, council funding has increased over the current parliament. But that follows a decade of austerity in the 2010s. And despite funding increases, councils are again under significant financial pressure, with increases in spending outpacing increases in funding and financial reserves being drawn down in each of the last two years. The last few years have also seen a small, but still unprecedented, number of councils have to take emergency measures to stabilise their budgets by temporarily halting all new spending that is not legally required.
In this context, this report looks at how council funding and spending are set to have changed over the current (2019–24) parliament, and puts these changes in a longer-run context back to 2010. Section 2 looks at the 2010s, a period of austerity but also financial reform, for English local government. Section 3 then looks at the last four years, during which councils have seen funding increases but also faced a global pandemic and rapidly rising costs. Section 4 concludes and, in doing so, compares expected levels of funding for councils in 2024–25 with levels 14 years ago in 2010–11. This shows that while the period since 2020 cannot be characterised as one of austerity, it has far from undone the cuts seen in the prior decade. It also shows that this parliament has seen the continuing shift of council funding towards social care and other costly services used by relatively small groups of high-needs individuals at the expense of universal services. And it highlights how important updates to the local government finance system that were first promised eight years (and four prime ministers) ago have been postponed until after the upcoming election – and probably several further years more. Finally, Appendix A provides information on adjustments we make to published funding and spending data to account for changes in councils’ responsibilities and funding arrangements, in order to more meaningfully compare funding and spending over time.
2. The 2010s: austerity and financial reform
The 2010s saw significant cuts to many areas of public spending as the governments of the time sought to reduce a large and unsustainable budget deficit following the late 2000s financial crisis. Funding for local government was no exception to this, with English councils facing some of the largest cuts seen by any public services over this period.
The 2010s also saw major reforms of the local government finance system, with the aim of providing councils with stronger financial incentives to boost local economic performance and property development. Drawing on previous, more detailed, research at IFS (most notably, Amin-Smith et al. (2016) and Harris et al. (2019)), this section summarises the major changes to the local government funding environment in the 2010s. In turn, this allows us to look at areas of change and areas of continuity in the 2019–24 parliament.
Large cuts to overall funding, driven by cuts in funding from central government
Estimating the changes in councils’ funding and spending over long periods of time is not easy, at least if one wants to look at consistent measures of these variables over time. That is because councils’ responsibilities have changed over time, as has the way that they are funded. Adjustments to published funding and spending are therefore needed to make figures as consistent as possible over time. A full explanation of how we do this in this report can be found in Appendix A. To summarise, on the funding side, we use an adjusted measure of ‘core spending power’, the official measure published by the government, which we term ‘core funding’. The most significant adjustments we make relate to funding prior to 2015¬–16, social care, and retained business rates: first, we link together a series of pairwise comparisons of year-on-year changes in funding prior to 2015–16 to generate as close to a consistent time series back before that year; second, we account for the transfers councils receive from the NHS to help pay for social care, which have changed and increased over time; and third, we include real-terms growth in retained business rates revenues (not just the inflation-adjusted ‘baseline’ amounts recorded in core spending power). On the spending side, we make several adjustments, including excluding public health and some elements of children’s social care spending (which were devolved to councils in 2013–14 and 2014–15 respectively), education, and fire service spending, and adding in spending on levies paid to separate waste and transport authorities that operate in certain parts of England. These approaches differ slightly compared with the approaches we previously used to examine council funding and spending in the 2010s (e.g. Harris et al., 2019): the change in methodology was necessary to allow for a consistent analysis into the 2020s too.
Figure 1. Cash and real-terms core funding and funding per person (2010–11 = 100)
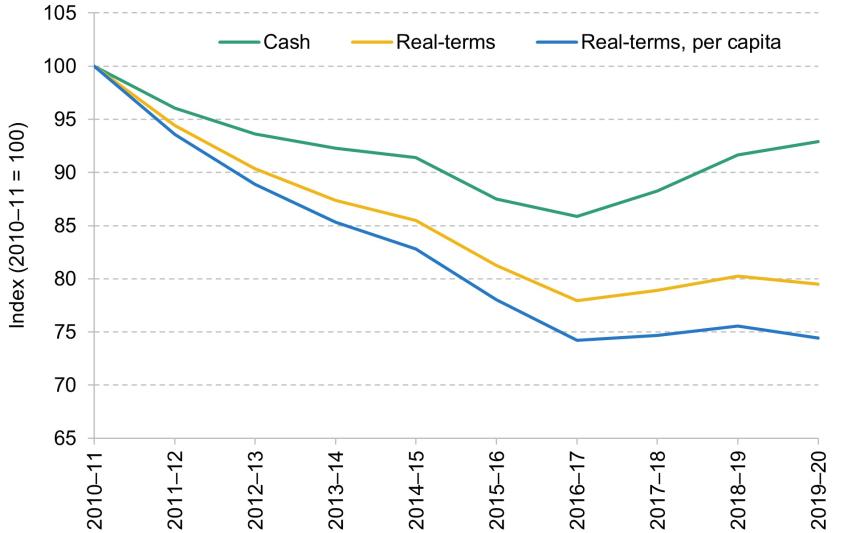
Note and source: Funding includes core spending power, above-baseline growth in business rates, and NHS transfers for social care services, and is described fully in Appendix A. Funding adjusted for inflation using GDP deflators from OBR Economic and Fiscal Outlook – March 2024. Per-person figures reflect the latest ONS mid-year population estimates.
Having made these adjustments, Figure 1 shows our estimates of councils’ funding from central government, the NHS and local taxation between 2010–11 and 2019–20. It shows that in cash terms, after falling between 2010–11 and 2016–17, subsequent increases meant that core funding in 2019–10 was approximately 7% lower than at the outset of the 2010s. However, after adjusting for inflation using the GDP deflator, funding in 2019–20 was still around 21% lower in real terms than in 2010–11. And after adjusting for population growth, core funding was approximately 26% lower per person in real terms in 2019–20 than nine years earlier.
This fall in overall core funding reflects reductions in funding from central government, which fell by 46% in real terms on as close to a like-for-like basis between 2010–11 and 2019–20 as possible.1 In contrast, council tax revenues were higher in 2019–20 than in 2010–11: approximately 25%, after adjusting for a shift in responsibility for funding means-tested support with council tax bills. This is despite a cash-terms freeze, and hence a real-terms fall, in council tax bills between 2011–12 and 2015–16 in many councils and reflects two factors. First, councils with social care responsibilities were able to increase council tax substantially in real terms between 2015–16 and 2019–20, offsetting the reduction during the first half of the 2010s.2 Second, the council tax base increased as a result of increases in the number of properties, and a reduction in the share of council tax not payable as a result of means-tested reductions in bills.
As well as seeing a big reduction in overall council funding, the 2010s therefore saw a big increase in the share of funding received from council tax: from just over a third (36%) in 2010–11, to more than half (56%) in 2019–20.
Bigger cuts in poorer places
The scale of cuts in funding faced by different councils varied significantly during the 2010s. In particular, councils that relied more on central government grant funding and less on their own council tax revenues faced bigger cuts to their overall funding as grant funding was reduced. This is because between 2010–11 and 2015–16, cuts to grants did not take much account of the extent to which councils relied on these two sources of funding for their overall funding – and in 2014–15 and 2015–16, did not account for this at all.2 Reforms to the way grant funding was cut from 2016–17 meant that from then on, differences in reliance on grants versus council tax were largely (albeit still not fully) accounted for when grants were being cut. This meant much more equal cuts to overall funding in the second half of the 2010s, but did not undo the previous pattern of spatially ‘regressive’ cuts.
Because of their high reliance on grant funding, councils in more deprived parts of the country faced much larger cuts to their funding than councils serving more affluent areas, particularly during the first half of the 2010s. Figure 2 shows that, on average, councils whose areas were among the most deprived tenth in England in 2019 faced cuts to overall core funding per person averaging around 35% between 2010–11 and 2019–20, compared with ‘just’ 15% in the most affluent tenth of councils. This meant that the gap in total funding per person between the most and least disadvantaged councils fell from a 47% premium for the most deprived, to a 13% premium.
Figure 2. Real-terms change in core funding per person, 2010–11 to 2019–20, by deprivation
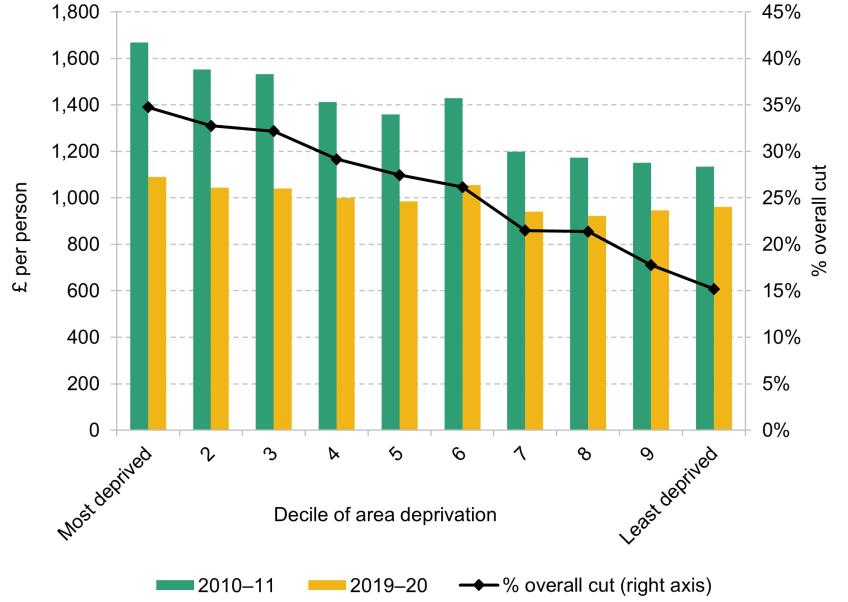
Note and source: See note and source to Figure 1. Deprivation deciles are based on IMD 2019 Average Score at the upper-tier authority level, from English Indices of Deprivation, 2019.
Because councils in the North of England and London relied on grant funding for more of their overall funding than councils in the South of England, they also faced larger per-person funding cuts during the 2010s. By region, the sharpest funding cuts were in London (33%), followed by the North West (29%) and North East (27%). Average cuts were much smaller in the South East (18%).
Spending increasingly focused on statutory duties and acute needs
As well as varying across the country, changes in council funding during the 2010s also resulted in very different changes in spending for different services as councils sought to prioritise meeting their statutory duties, and areas of rising demand and acute needs. To illustrate this, Table 1 shows real-terms spending per person in 2010–11, 2015–16 and 2019–20 for the broad service areas reported in councils’ financial returns, as well as the change in spending between the start and end of this period.
Overall, spending per person (measured on a consistent basis over time) fell by 19% between 2010–11 and 2019–20, with the bulk of cuts to spending taking place during the first half of the 2010s. This is somewhat smaller than the reduction in core funding, reflecting several factors including an increase in commercial and investment income and a drawdown of reserves in 2019–20 (whereas councils were paying into reserves in 2010–11.
Table 1. Real-terms spending per person by service area, various years (2024–25 prices)
| Service | 2010–11 | 2015–16 | 2019–20 | % change 2010–11 to 2019–20 |
| Adult social care | 418 | 385 | 409 | –2% |
| Children’s social care – excluding Services for Young People and Sure Start | 177 | 174 | 196 | +11% |
| Environment and regulation | 139 | 117 | 110 | –21% |
| Highways and transport | 101 | 72 | 56 | –45% |
| Central and other services | 84 | 66 | 60 | –28% |
| Culture and leisure | 84 | 57 | 46 | –45% |
| Housing | 66 | 38 | 37 | –44% |
| Services for Young People and Sure Start | 60 | 33 | 20 | –67% |
| Planning and development | 54 | 28 | 23 | –58% |
| Total | 1,184 | 969 | 957 | –19% |
| Memo item: public health | n/a | 75 | 69 | n/a |
Note and source: See Appendix A for details. Spending on ‘Services for Young People and Sure Start’ is taken from DfE statistics, allowing us to produce a consistent measure back to 2010–11.
Within total service spending, per-person spending on children’s social care services (excluding youth services and Sure Start centres) increased by 11% in real terms. Spending on adult social care (including estimated spending funded by transfers from the NHS) was also relatively protected, falling by only 2%. This meant much larger cuts to other services: more than 40% in the case of housing, culture and leisure, and highways and transport, and nearly 60% cuts to planning and development. Spending on Sure Start centres and services for young people was shifted from councils’ education to children’s social care budgets in 2014–15, and was particularly sharply cut (67%). A broader measure of total spending on children’s social care spending including these services fell by 9% between 2010–11 and 2019–20.
Overall, these changes meant a greater share of councils’ spending by the end of the 2010s was focused on statutory duties and/or residents with the most acute needs. Previous research at IFS has also shown this pattern holds even within these broad service headings. For example, Harris et al. (2019) showed that whereas 2019–20 budgets implied overall spending on housing services would be 52% lower per resident than in 2009–10, spending on homelessness (for those in acute housing need) would be 72% higher. Spending per resident on road maintenance and general subsidies for public transport was cut by over half, while spending on concessionary bus passes was reduced by just 6%. Such changes represented a substantial reshaping of councils’ budgets.
This period also saw an increasing reliance on income from sales, fees and charges (SFCs) to co-fund many services. Harris et al. (2019) found that the contribution of SFCs to gross service expenditure outside of education and social care increased from 22% to 32% between 2009–10 and 2018–19. This was particularly important for some services. For example, SFCs from planning and economic development services increased by 19% per person in real terms, meaning gross expenditure per resident on this service fell by 18 percentage points less (42%) than net expenditure (60%) over this period. There was little change in the contribution of SFCs income to social care spending over the same period (11% in both years, with the vast majority of this relating to adult social care).
Limited data mean that fully assessing the impact of reductions in spending on service provision and quality is impossible. The evidence that does exist suggests that performance and public satisfaction with some of the services subject to the steepest cuts fell, but perhaps not as much as may have been expected.4 For example, satisfaction with library services fell from just under 70% at the start of the 2010s to just under 60% by the end of the decade – but this was a period that saw one-in-six libraries close, a reduction in lending stock (i.e. books, DVDs, etc.) of around a quarter, and a decline in salaried librarians of almost 40%. Similarly, the share of councils collecting non-recyclable waste weekly fell from just under half to less than a quarter during the 2010s, but around three-quarters of residents were still satisfied. Evidence also suggests councils have had to ruthlessly prioritise their resources. Facing a roughly 50% cut in the numbers of food standards staff and health & safety inspectors, councils have focused on high-risk businesses and responding to complaints, significantly scaling back the proactive assessments that might provide opportunities to gather intelligence and prevent serious risks from arising.
The relative protection of social care spending from the cuts to councils’ funding does not mean that difficult choices could be avoided even for these services. As discussed in Ogden and Phillips (2023), there were large reductions in the number of older adults receiving domiciliary care in their own homes as councils focused resources on those with severe needs and the growing numbers of younger adults with learning difficulties receiving support. Measures of performance for children’s social care services show a somewhat mixed picture for the 2010s, but there was a reduction in the share of child protection plan reviews taking place on time, and a reduction in the duration of child protection plans accompanied by an increase in the share of children who were on their second or subsequent protection plan. This suggests children’s social care services were under significant pressure despite spending increases.
Financial incentives and the atrophy of fiscal equalisation
As well as changes to funding levels, the 2010s saw a number of significant changes to the local government finance system, which have continuing impacts on councils today. At a high level, these were aimed at providing councils with stronger financial incentives to support property development and improve local socio-economic conditions. Key policies include:
- The New Homes Bonus, introduced in 2011, which provides match-funding for the council tax revenues raised from new or re-occupied long-term empty homes. Initially this was for six years, but it was later cut back to four years and eventually one year, and made applicable only for properties above a baseline growth rate.5 The aim of this was to encourage councils to support the provision of new housing, but due to a lack of evidence on its effectiveness, funding has instead been allocated to other purposes (such as supporting social care funding).
- The aforementioned Business Rates Retention Scheme (BRRS), introduced in 2013, which means that councils bear a proportion of the real-terms increase or decrease in business rates revenues from changes in the amount of and use of non-domestic property in their areas.6 Under the standard version of the BRRS, the proportion was (and still is) 50%, but at various times a number of areas have piloted higher rates of retention, and the government had planned for England-wide increases in the retention rate, which were ultimately shelved.7 The combination of the design of the scheme – whereby in areas with two-tier local government, lower-tier shire districts bear 40% of any change and upper-tier counties only 9% or 10% – pilots, and differences in non-domestic property development means different councils’ revenues have been affected in very different ways by the BRRS. For example, Figure 3 shows previous IFS estimates of the cumulative gain or loss of funding under the BRRS for each council between 2013–14 and 2019–20, compared with what they would have received if the same total amount of funding had been allocated in line with assessed spending needs. It shows that there was significant variation across councils within a type, especially for districts: one-in-ten of this type of council saw an increase in funding of 7% or more over this period as a result of the scheme, whereas another one-in-seven saw a decline. The figure also shows that all bar one shire county saw less funding than if funding was allocated on the basis of assessed need, reflecting their low retention rate – although the losses were in general equivalent to 1% of funding or less, over this period.
- The localisation of responsibility for designing and funding means-tested support for low-income households’ council tax bills, also in 2013. Prior to this, central government designed and paid for this support via the Great-Britain-wide council tax benefit. From April 2013, it provided councils with extra general grant funding equivalent to 90% of what it estimated it would have had to spend on council tax benefit, with councils then responsible for designing and funding their own scheme. As well as saving the government money, the aim was to provide councils with financial incentives to help their low-income residents enter work and boost their incomes. With reduced funding, councils generally cut back the amount of support provided, often introducing minimum payments even for the lowest-income working-age adults. Adam et al. (2019) found an increase in council tax arrears and that around a quarter of the council tax owed by people who had to pay something (or pay more) following the reform was left unpaid, but found no evidence of an increase in arrears with other bills or any increase in material deprivation.
- The ending of updates to spending needs assessments, with the final update undertaken in 2013. Prior to this, spending needs assessments had been partially updated each year using new data on local area characteristics, as they became available. While the way these spending needs assessments were accounted for when determining funding allocations was flawed, this meant that funding did respond at least partially to changes in local circumstances.8 Ending these updates in 2013 was aimed at providing stronger incentives for councils to boost local economies and tackle the socio-economic drivers of spending needs. However, it also meant that funding allocations became increasingly arbitrary – based partially on past assessments of spending need and partially on ad hoc decisions on how grant funding should change in subsequent years.
Perhaps reflecting the increased financial risks from a system with greater reliance on (potentially volatile) local revenue sources, councils increased their reserves substantially during the 2010s despite large cuts to funding and spending. On average, the increase was approximately 50% in real terms (with the cash figure increasing from £10.7 billion to £18.8 billion between April 2010 and April 2019).
Recognising that the effort to provide stronger financial incentives to councils should be complemented via updated spending needs assessments and a system to periodically change funding to account for these assessments, the government announced a ‘Fair Funding Review’ in 2016, with the aim of implementing reforms to funding in April 2019. These would include new spending needs assessments, and a system for accounting for these assessments and councils’ own revenue-raising capacity via council tax, and would sit alongside a reformed and expanded BRRS.
Initial plans for local government to retain 100% of business rates were subsequently cut back to 75%, and the date of implementation was first pushed back to April 2020 and then April 2021. But while imperfect, the set of reforms the government was planning would have led to a more rational, less arbitrary system of local government funding in the 2020s.9 As the next section discusses, these plans for the current parliament were subsequently overtaken by events, and then kicked into the long grass.
3. The 2020s: funding increases and crises
The period since the last general election in December 2019 has been rather different from the preceding decade. In contrast to the 2010s, overall funding for local government will have increased by more than economy-wide inflation (as measured by both the GDP deflator and CPI): this has not been a parliament of austerity for councils.
However, like the rest of the country, councils have had to contend with the financial and other effects of a global pandemic and sharply higher costs for energy, food and housing. The combination of increases in demand for certain services and increases in costs that appear to have outpaced wider inflation means that a growing number of councils report financial difficulties – with 6 already having had to make emergency changes to their financial plans at least once since 2020 and 29 having received special permission to make use of capital funding or the proceeds of asset sales to help cover day-to-day expenses.
Pre-COVID plans
In the 2019 Spending Round, the government announced an increase in general (revenue support) grant funding in line with inflation, with an additional £1 billion increase in grant funding ring-fenced for adults’ and children’s social care services. Together with increases in council tax of up to 1.99% for district councils and 3.99% for councils with social care responsibilities, this was predicted to increase funding for councils by up to £2.8 billion or 6.6% in cash terms. With inflation at that point forecast to equal 1.8%, this would equate to a 4.7% real-terms increase – a clear end to austerity.
Or at least a pause. In its manifesto for the 2019 general election, the victorious Conservative Party committed to maintain the £1 billion increase in funding for social care, but unlike the other political parties did not propose any further increases in grant funding (Phillips, 2019a). Instead, the plan was for a further shift towards funding via local taxation. As discussed earlier, by this stage plans for 100% business rates retention had been replaced by 75% retention. This was due to take effect in April 2021, alongside the phased introduction of new assessments of councils’ spending needs following the expected completion of the so-called Fair Funding Review, and the redistribution of past growth in retained business rates (the business rates retention ‘reset’). The aim was for these reforms to be revenue-neutral at the point of introduction, with councils forgoing revenue support grant, public health grant and a number of other grants in return for the move from 50% to 75% business rates retention. Retention of 75% rather than 50% of any subsequent growth in business rates revenues would though, over time, generate some additional funding for councils.
However, as discussed in Harris et al. (2019), even if council tax were increased by 4% a year each year, the combination of council tax, business rates and frozen grant funding could have necessitated cuts in real-terms funding for services outside of adult social care given rising demand and cost for this service. Restricting increases in council tax to 2%, in line with the long-term inflation target, would almost certainly have necessitated deep cuts to a range of services. IFS researchers therefore raised the possibility that 2020–21 could prove to be just a ‘lull in the storm’ financially for councils (Phillips, 2019b).
The impact of the COVID-19 pandemic
2020–21 would prove anything but calm for councils or the rest of us, with the onset of the COVID-19 pandemic. However, councils’ finances held up much better than expected during the pandemic period itself, with financial reserves increasing by almost 40% between April 2020 and April 2022.
The COVID-19 pandemic affected councils’ finances in several ways:
- Councils took on a range of additional responsibilities to support their residents and local areas, including local ‘test and trace’ schemes, the provision of additional support for vulnerable residents (including food packages) and temporary accommodation for rough-sleepers, and the administration of financial support schemes for local businesses.
- The cost of providing some existing services, most notably adult social care, increased because of a need for infection control equipment and processes. In addition, the demand for existing services changed in sometimes complex ways, with demand often initially falling during lockdowns, and rising during periods of reopening.
- Councils’ income from SFCs and commercial sources declined as use of council-owned car parks, transport services, leisure centres and cultural facilities declined, and their customers or tenants saw falls in demand for their services.
The government sought to capture these financial effects through a series of financial monitoring returns completed monthly by councils, which asked councils to identify increases in spending and reductions in income as a result of the COVID-19 pandemic. It also provided councils with substantial additional funding through general grants, service-specific grants, and a scheme partially compensating for reductions in SFCs income. Ogden and Phillips (2021 and 2022) looked in detail at both the financial effects of the pandemic and the additional financial support provided by the government in 2020–21. Figure 4 shows the key findings in relation to councils’ reported financial impacts; our own estimates based on actual spending and income;10 and the additional funding provided to councils by the government.
The first column in Figure 4 shows that councils reported that the pandemic led to an increase in their spending on non-education services of approximately £5.7 billion in 2020–21, with adult social care services contributing the biggest single share of this (£2.2 billion).11 In addition, they estimated a reduction in SFCs income of £2.1 billion. This would imply an increase in net expenditure on non-education services of approximately £7.8 billion.
Figure 4. The effects of the COVID-19 pandemic on councils’ finances
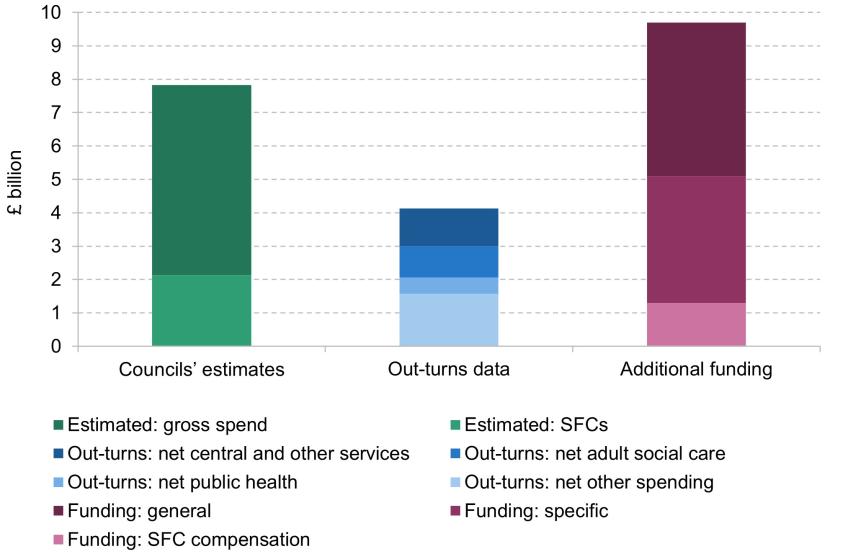
Source: Ogden and Phillips, 2021 and 2022. See notes and sources to tables 2.1, 2.2 and 2.3 in Ogden and Phillips (2022).
In contrast, the second column shows our estimate of the actual change in net expenditure on non-education services as a result of the COVID-19 pandemic of approximately £4.1 billion, with the biggest contributors to this being ‘central and other services’ (£1.1 billion) and adult social care services (£0.9 billion). Further analysis suggests that the shortfall in SFCs income was roughly in line with the £2.1 billion estimated by councils,12 meaning that it is the increases in gross spending (not the falls in income) that were smaller than councils had reported in their financial monitoring reports.
The final column of Figure 4 shows the additional financial support provided to councils by the government. This shows that the combination of general grant funding (£4.6 billion), specific grant funding (£3.8 billion) and the partial compensation of falls in SFCs income (£1.3 billion) in 2020–21 amounted to approximately £9.7 billion. As well as the increases in net expenditure on non-education services captured in the middle column, this would also have to compensate councils for increased education spending and losses in other forms of income not related to specific services (such as general commercial income, and interest on reserves). Even if we take the amounts reported for these impacts in councils’ financial monitoring returns at face value, this would mean that the funding remaining for non-education services (£8.6 billion) was approximately double our estimate of the actual increase in net spending on these services (£4.1 billion).
Table 2. English councils’ reserves (adjusted)
| Start (1 April, £ million) | End (31 March, £ million) | Change (cash, £ million) | Change (%) | End, % of core spending power | |
| 2018–19 | 17,491 | 18,764 | +1,272 | +7% | 45% |
| 2019–20 | 18,807 | 18,553 | –253 | –1% | 43% |
| 2020–21 | 19,877 | 24,815 | +4,938 | +25% | 55% |
| 2021–22 | 25,755 | 28,025 | +2,270 | +9% | 60% |
| 2022–23 | 27,640 | 25,925 | –1,715 | –6% | 51% |
| 2023–24 | N/A | N/A | –1,175 | N/A | N/A |
Note: Reserves for 31 March 2019 to 31 March 2023 have been adjusted to try to strip out the effect of temporary business rates reliefs.
Source: Authors’ calculations using revenue out-turns and budgets, available at: https://www.gov.uk/government/collections/local-authority-revenue-expenditure-and-financing.
As a result of this, English councils were able to pay approximately £5 billion into their reserves in 2020–21, increasing them by around 25%, as shown in Table 2.13 An increase in core non-COVID funding of £1.3 billion, and approximately £3.5 billion of COVID-19 funding in 2021–22 enabled a further increase in reserves of £2.3 billion (9%), as funding levels again outpaced expenditure.14 Similar trends were also seen in Scotland (where general fund reserves more than doubled from £1.3 billion to £2.7 billion between March 2020 and March 2022) and Wales (where councils’ reserves increased by approximately £0.7 billion over the same period).15
However, while in aggregate councils increased their reserves substantially over these two years, this was not true of all councils. This reflects both the differential financial effects of COVID-19 and the nature of financial compensation from local government. For example, since the SFCs compensation scheme only partially compensated councils for reductions in income,16 councils that relied more heavily on parking fees, tickets for leisure facilities and/or other income streams that fell significantly during the pandemic suffered more financially. Services particularly affected by the pandemic (such as adult social care) also make up very different shares of councils’ budgets, and their populations had different degrees of vulnerability to the health and economic effects of the pandemic.
As a result, whereas 10% of councils saw their net expenditure on non-education services increase by 50% or more in 2020–21, almost one-in-three saw a net increase of 10% or less, and 8% saw their net expenditure fall. Shire districts saw larger-than-average increases, with the median increase being 22%, compared with 9–12% for single-tier and upper-tier councils, reflecting shire districts’ typically greater reliance on parking, leisure and culture SFCs income. This means while the sector as a whole was more than compensated for the immediate financial impacts of the COVID-19 pandemic, many individual councils with particularly large increases in spending or reductions in income were not. This includes many shire districts, where our estimates of the amount of additional financial support received in 2020–21 (around £0.6 billion) was in aggregate very similar to our estimates of the COVID-related increase in net expenditure (also £0.6 billion), in contrast to single- and upper-tier councils.
Another effect of the pandemic on councils’ finances was a decision by the government to postpone any significant changes to the local government finance system until 2025 or later – including changes to business rates retention, and any updates to spending needs assessments and the distribution of funding between councils. As illustrated in Ogden et al. (2023), this means funding allocations that are increasingly arbitrary remain in place – making reform of the local government finance system an important task for the next parliament.
Post-COVID reality
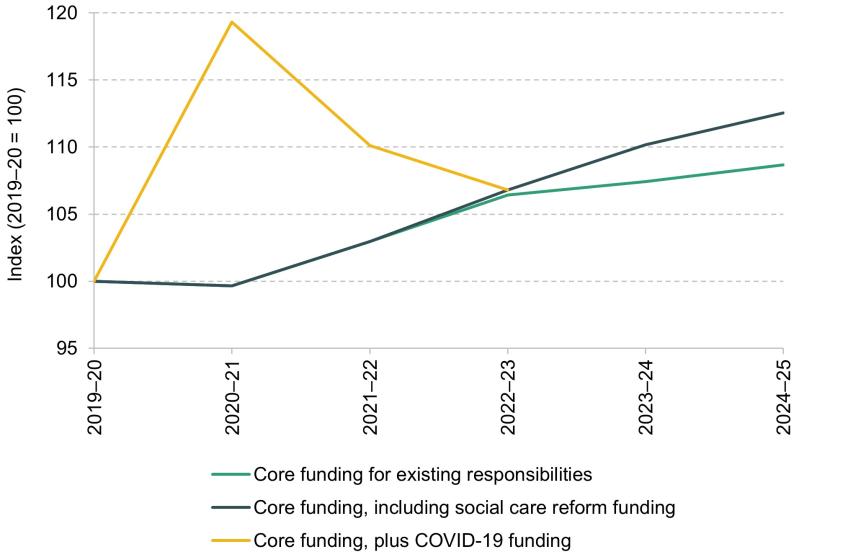
Notwithstanding these issues, the local government sector as a whole emerged from the worst of the COVID-19 pandemic in better financial health than initial data suggested it would. Financial plans for the post-pandemic period were first set out in the 2021 Spending Review. This confirmed that there would be no COVID-specific funding from April 2022 onwards, but that there would be a substantial real-terms increase in non-COVID funding in 2022–23, and additional funding from 2023–24 onwards for the relaxation of means-testing and a cap on out-of-pocket expenses for adult social care services. This is illustrated in Figure 5, which shows plans for councils’ core spending power to 2024–25 as of the 2021 Spending Review. It also includes our estimates of the COVID-19 funding provided to councils in 2020–21 and 2021–22.
Figure 5. Council funding plans, 2021 Spending Review (real terms, 2019–20 = 100)
Source: Authors’ calculations using HM Treasury (2021) and Ogden and Phillips (2021 and 2022).
The figure shows that if all councils increased their council tax by the maximum allowed (1.99% plus 1% extra for social care), overall core funding would be 12.5% higher in real terms in 2024–25 than in 2019–20. This would leave core funding (excluding that provided for social care reform) 8.7% higher in real terms in 2024–25 than at the outset of the 2020s, with most of this increase taking place between 2019–20 and 2022–23. The small increases in this like-for-like funding after 2022–23 were set to be due almost entirely to council tax, with grant funding for existing responsibilities planned to be frozen in cash terms.
Figure 5 also shows that accounting for the COVID-specific funding that was ended in April 2022, councils’ funding was set to be 3% lower in real terms in 2022–23 than in 2021–22. While a number of COVID-era responsibilities, such as Test and Trace, were ended, the potential for some ongoing financial impacts of the COVID-19 pandemic (including increased demand and costs, and reduced income from SFCs) means that frontloading increases in core grant funding, as then planned, was reasonable to avoid an even steeper year-on-year decline.
Following a surge in inflation and evident pressure on councils’ budgets (discussed in more detail later),17 the government has felt the need to top up the plans set out in the 2021 Spending Review several times. In November 2022, the government announced that:
- Planned social care reforms would be delayed until October 2025, but that councils could retain the associated funding in 2023–24 and 2024–25 to address cost pressures for existing social care provision. This provided an additional £1.3 billion of funding for existing responsibilities in 2023–24, rising to £1.9 billion in 2024–25.
- An additional £0.7 billion of grant funding for social care services would be provided in 2023–24, rising to £1.2 billion in 2024–25, and that a ‘funding guarantee’ would provide all councils with at least a 3% cash-terms increase in funding per year even if they chose to freeze their council tax.18 These measures were part-funded by reducing other grant funding by £0.8 billion.
- Councils would be able to increase council tax by up to 2.99% for general expenditure each year, and an additional 2% for adult social care services. Compared with previous plans (1.99% plus 1%), this would raise up to an additional £0.6 billion in 2023–24 and £1.2 billion in 2024–25.
Further additional funding for councils was announced in Summer 2023 and then in January 2024, with both funding for social care and the funding guarantee increased (to 4% in the latter case). This means that if all councils increased their council tax by the maximum allowed in 2024–25, funding for existing responsibilities would be £7.5 billion (13%) higher in cash terms than was initially planned in the 2021 Spending Review.
As illustrated in Figure 6, the additional funding that has been provided to councils over the last two-and-a-half years has more than offset the impact of higher economy-wide domestic inflation. As of the 2021 Spending Review (SR2021), core funding (excluding for social care reform) in 2024–25 was set to be 9% higher in real terms than in 2019–20 according to the GDP deflator measure of inflation. If councils had received the higher funding and inflation had not turned out higher than expected, core funding would have been 23% higher in real terms in 2024–25 than in 2019–20. Combined, changes in plans for funding and in forecast inflation mean councils’ core funding will be 16% higher in real terms in 2024–25 than in 2019–20.
Figure 6. Impact of changes in inflation on council core funding, 2019–20 to 2024–25 (2019–20 = 100)
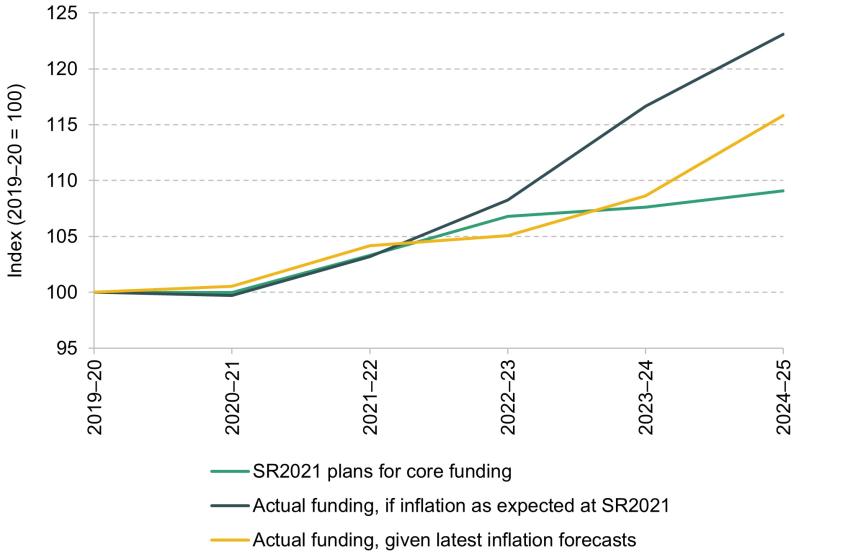
Note: Funding is core spending power for all authorities (not only main councils) and excludes above-baseline business rates growth and NHS transfers. ‘SR2021 plans for core funding’ excludes funding that was then for adult social care reforms. ‘Actual funding’ includes grants rolled in in previous years.
Source: Authors’ calculations based on HM Treasury Budget 2021, final local government finance settlement 2024–25, and forecast GDP deflators from OBR Economic and Fiscal Outlook – October 2021 and March 2024.
These figures reflect the GDP deflator, an economy-wide measure of domestic inflation typically used for calculating real-terms changes in spending on public services. However, this excludes import costs (including imported energy), which may have been particularly important in recent years, and many councils have contracts with suppliers that are linked to CPI or RPI inflation. Using CPI, real-terms core funding will be 12.5% higher in 2024–25 than in 2019–20, compared with a real-terms rise of 9.5% planned as of the 2021 Spending Review.
As we discuss further below though, some significant costs faced by councils appear to have increased by more than overall economy-wide inflation, whether measured by the GDP deflator or CPI. Combined with rising demand, this has put significant pressure on budgets.
Bigger increases in council funding in poorer places
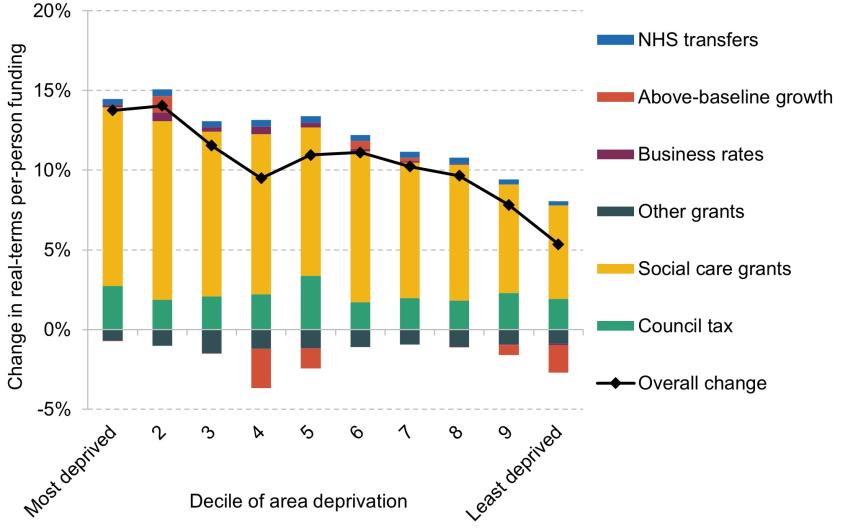
Alongside a shift from austerity to funding increases, another change in the current parliament from the 2010s is the pattern of changes in funding across England. In particular, increases in funding have been higher for councils serving more deprived communities than for those serving less deprived communities. This can be seen in Figure 7, which shows the average change in funding for 10 groups of councils ranked from the most to the least deprived, and which splits changes in funding into different sources (council tax, business rates, and different forms of grants).
The figure shows that among the least deprived tenth of councils, funding is set to be 5% higher in real terms in 2024–25 than in 2019–20, while in the most deprived tenth of councils it is set to be 14% higher. This reflects the fact that increases in grant funding and in retained business rates have provided a larger boost to funding in more deprived areas. This in turn reflects a policy of targeting increases in grant funding at poorer places, which was particularly pronounced in 2022–23 with the introduction of the so-called ‘services grant’ (which has since been cut back to help fund increases in social care grants).
More in line with the trends during the 2010s is the prioritisation of funding for councils with social care responsibilities. These have been allowed to increase council tax by 1–2 percentage points per year more than shire district councils, and they have received the lion’s share of increases in grant funding. As a result, while overall core funding per-person for all councils will be 10% higher in real terms in 2024–25 than in 2019–20, it will actually have fallen for shire district councils, which do not have responsibility for social care.
Figure 7. Real-terms per-person change in core funding, 2019–20 to 2024–25, by deprivation
Note and source: Funding measure is described fully in Appendix A. Changes in each component of spending are expressed as a share of funding in 2019–20. Funding adjusted for inflation using GDP deflators from OBR Economic and Fiscal Outlook – March 2024. Per-person figures reflect the latest ONS mid-year population estimates. Deprivation deciles are based on IMD 2019 Average Score at the upper-tier authority level, from English Indices of Deprivation, 2019.
Social care continues to take a growing share of budgets
Related to this, the 2020s have seen a continuation of one trend from the 2010s: the increasing share of spending going to adults’ and especially children’s social care services. However, unlike the 2010s, spending on other services has also increased, albeit to a much lesser extent. This can be seen in Table 3.
Total spending increased by 10% in real terms, and per-person spending by 8%, between 2019–20 and 2022–23, the last year for which out-turn data are available. Councils’ published budgets then imply that spending per person will fall by 3% in 2023–24. However, higher spending than was budgeted may be expected given that some additional funding was made available to councils after these budgets were set, and over-spending relative to budgets has been a common occurrence in recent years. As shown in the final column of the table, if spending on each service differed between budgets and out-turns in the same way as in 2022–23, total per-person spending might instead be expected to be around 4% higher in 2023–24 than in 2022–23, and 12% higher than in 2019–20.
Table 3. Spending per person by service, 2019–20, 2022–23 and 2023–24 (£, 2024–25 prices)
| Service | 2019–20 | 2022–23 | 2023–24 (budget) | 2023–24 (adjusted) |
| Adult social care | 409 | 438 | 439 | 455 |
| Children’s social care – excluding Services for Young People and Sure Start | 196 | 227 | 206 | 240 |
| Environment and regulation | 110 | 109 | 109 | 110 |
| Highways and transport | 56 | 52 | 54 | 54 |
| Central and other services | 60 | 73 | 71 | 75 |
| Culture and leisure | 46 | 48 | 41 | 46 |
| Housing | 37 | 41 | 37 | 44 |
| Services for Young People and Sure Start | 20 | 18 | 20 | 18 |
| Planning and development | 23 | 29 | 22 | 31 |
| Total excluding public health | 957 | 1,035 | 999 | 1.072 |
| Public health | 69 | 72 | 66 | 69 |
| Overall total | 1,026 | 1,107 | 1,064 | 1,141 |
Notes and sources: See Appendix A for details. Spending on ‘Services for Young People and Sure Start’ is taken from DfE statistics. ‘2023–24 (adjusted)’ takes spending from 2023–24 budgets and adjusts this in proportion to the average over- (or under-) spend between budgets and out-turns in 2022–23 by service area.
By broad service area, and using our ‘adjusted’ measure, the largest cash increases in per-person spending are expected to be in adult social care (£46 per capita, 11%) and children’s social care (£44, 22%), although the largest proportionate increase (£8 or 35%) has been for planning and development. Spending per person on many other broad service areas was little changed in real terms over the last four years, although as in the 2010s, this sometimes hides big changes for specific sub-services. For example, spending on street lighting increased by 14% in real terms between 2019–20 and 2022–23, with comparisons of budgets and out-turns implying a near 20% increase between 2022–23 and 2023–24. Spending on recreation and sport has also increased notably – by 43% in real terms since 2019–20. These increases may in part reflect increased energy costs, which will already be abating. Increased spending on social care is likely to prove more persistent, and has further increased the extent to which councils’ budgets are focused on a subset of the population with acute needs.
Growth in demand and costs is putting councils under pressure …
Underlying the increases in spending are increases in both the demand for and cost of providing council services. Unfortunately, data on both demand and costs are not as comprehensive as we would like and are often available only with a lag. But both objective data and surveys of councils suggest increases in demand for many key services, as well as increases in costs that have often outpaced wider inflation. Thus, while councils’ funding has increased substantially in real terms over the course of this parliament (in contrast to the 2010s), council budgets are under pressure.
Looking at demand first, statistics suggest rising demand for adult social care, children’s social care, specialist home-to-school transport, and homelessness services. For example, the number of requests for support for care needs for working-age adults increased by just over 50,000 (9%) between 2019–20 and 2022–23, although the number actually in receipt of care was little changed (up 1%).19 Despite a fall in the child population, the number of children subject to statutory investigations of their safety increased by 16,000 (9%) and the number of children defined as ‘in need’ increased by 14,000 (4%) between 2019–20 and 2022–23.20 In addition, the number of children under the care of local authorities increased by 4,000 (5%) between March 2020 and March 2023, with virtually all of this accounted for by an increase in the number in secure units and children’s homes (a 3,500 or over 30% increase), the most expensive form of support.21
The number of homelessness assessments between April and September 2023 was 16,000 (11%) higher than in the equivalent period of 2019, with the number of households found to actually be homeless up 13,500 (19%).22 The number of households in temporary accommodation increased from 88,000 at the end of 2019 to 109,000 in September 2023 (a 23% increase), with a doubling of those housed in B&B hotels, which are particularly expensive forms of accommodation, accounting for roughly a third of the overall increase.23
The number of children with special educational needs recognised by Education, Health and Care plans increased by almost 130,000 (over 30%) between January 2020 and January 2023.24
Related to this, councils also report big increases in the numbers receiving special home-to-school transport provision, expenditure on which increased by almost £500 million (52%) between 2019–20 and 2022–23, with a further sizeable increase expected in 2023–24.25
Up-to-date information on the cost inflation faced by councils is not available for most services, but is available for adult social care. Unit costs data for adult social care services show that the cost per hour of home care increased by 29% between 2019–20 and 2023–24, while the cost of residential care placements increased by 25% for working-age adults and 35% for adults aged 65 and over.26 This compares with the latest estimate of whole-economy inflation as measured by the GDP deflator of 19% over the same period.
Recent unit costs data are not available for children’s social care services, but it is possible to proxy unit costs using data on expenditure and care recipients. This shows that between 2019–20 and 2022–23, expenditure on fostering services per child in a foster placement increased by 11% to an average of £650 per week, roughly in line with whole-economy inflation as measured by the GDP deflator.27 Expenditure per child in a residential placement increased by 20% to an average of almost £3,100 per week (or more than £160,000 a year) – almost double the rate of whole-economy inflation over this period. A survey of councils by the Local Government Association (2023) estimated that the number of children in placements costing over £10,000 a week increased over tenfold between 2018–19 and 2022–23, from 120 to 1,510 across England. Of these, 190 were costing over £20,000 a week – or more than £1 million per year. A Competition & Markets Authority investigation published in March 2022 suggested a lack of competition was contributing to high costs, with ‘the largest private providers of placements … making materially higher profits, and charging materially higher prices, than we would expect if this market were functioning effectively’. The investigation recommended joint commissioning by councils, increased in-house provision of care, and efforts to reduce barriers to entry into the children’s care market to help address this.
Increases in wages have increased costs, particularly for adult social care services, where many workers are paid at or just above the National Living Wage: in 2024–25, this will be 28% higher than in 2021–22 and 39% higher than in 2019–20. As of March 2023, for instance, over 60% of care workers not employed directly by local authorities or care recipients were paid less than the higher National Living Wage kicking in on 1 April 2024 (Skills for Care, 2023).
However, unlike the NHS where there appears to have been a significant fall in measured productivity (Phillips and Warner, 2024), that does not appear to be the case for adult social care services. The total number of full-time-equivalent roles in the adult social care sector was roughly the same in 2022–23 as in 2019–20, according to Skills for Care (2020 and 2023), which is in line with the change in the number of adults in receipt of publicly funded care. This would imply broadly flat labour productivity unless there was a decline in the number of adults paying for care privately and hence a shift in the fraction of care workers’ time spent on serving publicly funded care recipients. The number of full-time-equivalent children’s social workers was 8% higher in September 2023 than in September 2019, broadly in line with changes in safeguarding activity.
Increases in demand and costs mean that growth in councils’ non-education service spending outpaced the change in their funding in 2022–23, which led to councils collectively drawing down £1.7 billion in reserves, on an adjusted basis. Councils’ spending on non-education services also exceeded budgeted spending by almost £3.9 billion, with the biggest contributors to this overspend being children’s social care services (£1.7 billion, or a 17% overspend relative to budget), central services (£0.8 billion, or a 28% overspend relative to budget) and adult social care services (£0.8 billion, or a 4% overspend relative to budget). Children’s social care in particular has long been subject to overspends, but the overspend in 2022–23 was around twice as large as in 2019–20 (£0.8 billion, or a 9% overspend relative to budget). The overspend for adult social care in 2022–23 was also significantly higher than seen pre-COVID – for example, the 2019–20 overspend was just £0.1 billion, or less than 1% relative to budget.
Councils’ budgets for 2023–24 also implied a further drawdown in reserves of £1.2 billion (with 70% of all councils budgeting for drawdown of reserves). With core funding increasing by approximately 10% in 2023–24, this implies a substantial fall in reserves as a share of core funding.
… and some councils have already faced financial crisis
The financial situation does vary significantly across councils though. As of March 2023, while two-thirds of councils had higher reserves than at the start of 2019–20, almost 10% had reserves levels that were at least a third lower. This need not indicate financial stress – councils can build up and then draw down reserves to pay for capital investments and/or other major known liabilities. But reduced reserves levels do affect councils’ ability to weather current and future financial challenges.
A number of councils have also faced acute financial difficulties. Since 2020, six have seen their chief financial officer issue at least one so-called Section 114 notice, which prevents any new expenditure that is not needed to satisfy a legal duty, and gives councillors three weeks to agree reductions in spending or income-raising measures to address the issues raised in the notice.28 As well as general spending pressures, in each instance so far, there have been other financial issues underlying the issuing of Section 114 notices. This includes general concerns about financial management, as well as the impact of a major equal pay claim (Birmingham), high borrowing and issues related to property investments (Croydon, Slough and Woking), and issues related to investments in energy production or supply (Nottingham and Thurrock). It is also worth noting that chief financial officers need not wait until a council is about to run out of money before issuing a Section 114 notice: they can also issue one pre-emptively, to avoid such an issue arising in future. This was the case in Nottingham’s latest Section 114 notice, which notes a desire to tackle financial problems while the council still has significant financial reserves, given past financial management challenges (Nottingham City Council, 2023).
A key question for the future is whether the chief financial officers of councils that do not face ‘special’ financial circumstances also feel the need to issue Section 114 notices and make emergency cuts to their spending. In turn, this will depend on future funding levels and spending pressures. This is an issue we will consider in our next report on the outlook for local government funding.
In addition to those issuing Section 114 notices, a broader group of councils have requested exceptional financial support or flexibilities, which has been provided in the form of ‘capitalisation directions’. These allow councils to use capital funding (including from selling land and assets) to fund day-to-day expenditures, which is not normally allowed. Between 2020–21 and 2023–24, 17 councils were granted and utilised such permission for at least one year (and Croydon each from 2019–20 onwards).29 As of the time of writing, 19 have been granted such permission for 2024–25, with 12 of these making requests for the first time. The use of capital funding and land and asset sales to support day-to-day spending can provide time to reduce day-to-day spending or generate recurrent income in a sustainable way, but is not in itself sustainable in the long term.
4. Conclusion
The 2019–24 parliament will have been rather different for local government from the parliaments of the 2010s. Funding is up in real terms, with councils with more deprived populations seeing larger increases in funding than average, in stark contrast to the picture between 2010–11 and 2019–20. Moreover, grant funding has increased by far more, proportionately, than local tax revenues.
However, councils – like the rest of us – have also had to deal with the short- and longer-term effects of the COVID-19 pandemic. And they have faced significant increases in the demand for and costs of providing key services such as adults’ and children’s social care, homelessness prevention temporary accommodation, and specialist home-to-school transport. This has put many councils under significant financial pressure, despite real-terms increases in funding.
Figure 8 shows that recent real-terms increases in core funding have only very partially undone the cuts councils saw during the 2010s.
It shows that funding per person fell by an average of 22% between 2010–11 and 2015–16, and a further 5% between 2015–16 and 2019–20, adjusting for inflation using the GDP deflator measure: a total fall of 26% over the 2010s, as discussed in Section 2. Increases over this parliament (10%) are set to more than undo the cuts in the second half of the 2010s: core funding per person in 2024–25 is set to be 5% higher in real terms than in 2015–16. However, funding per person is set to remain 18% lower in real terms than in 2010–11.
In addition, recent bigger increases in funding for councils serving more deprived communities remain far outweighed by previous bigger cuts. For the most deprived tenth of council areas (based on 2019 levels of deprivation), funding per person is estimated to be 26% lower in real terms in 2024–25 than in 2010–11, compared with 11% lower for the least deprived tenth of councils.
The share of councils’ spending allocated to social care services has continued to rise. In 2023–24, adults’ and acute children’s social care services are likely to account for 65% of councils’ non-education spending, up from 63% in 2019–20, 58% in 2015–16 and 50% in 2010–11.30 Indeed, total per-person spending on social care services could be around 17% higher in 2023–24 than in 2010–11. In contrast, spending on those service areas that faced the largest cuts during the first half of the 2010s will not have recovered: spending on housing is still down by a third; spending on highways and transport, culture and leisure, and planning all down by more than 40%; and spending on youth services and Sure Start down by 70% since 2010–11.
Substantial increases in grant funding ring-fenced for adult social care services mean that, in contrast to the 2010s, the 2019–24 parliament is set to see the share of funding provided by council tax fall, from 56% in 2019–20 to 53% in 2024–25. However, this will still be much higher than its level in 2015–16 (47%) and particularly 2010–11 (36%31).
The current parliament has therefore been one of both change and continuity for local government – a change from austerity to funding increases and in how increases in funding are distributed across councils, but a continued rise in the share of spending going to social care services as well as continuing and indeed intensifying financial challenges for many councils. There has been a change in the main factor driving these financial challenges (rising costs rather than reduced funding), but a continued need to make difficult decisions on service provision.
Looking ahead, the plans for spending pencilled in by the current Chancellor imply cuts to funding for many unprotected departments – which in the 2010s included funding for local government (Boileau, 2024). By adopting the same fiscal targets and ruling out increases to major taxes such as income tax, National Insurance and VAT, both the Labour and the Conservative parties have made it extremely difficult to substantially move the dial on these spending plans. Once the election has passed and a new government takes office, it would not be surprising if something had to give and taxes or borrowing rise to top up spending plans, but the difficult fiscal inheritance means the funding taps seem unlikely to gush. Funding may therefore be tighter and more dependent on council tax increases in the next parliament than in this parliament – an issue we will explore when the main parties have published their manifestos. This could easily mean an increase in the number of councils being pushed to the financial brink and having to issue Section 114 notices.
After a temporary, sensible pause at the height of the COVID-19 pandemic, the current government chose to kick long-promised and long-planned reforms of the local government finance system into the long grass. The issues and options for the future design of a system that is currently not fit-for-purpose will be a key issue for the next government and will be discussed in a post-election report from IFS researchers.
Appendix A. Methodology
In order to make figures for English councils’ funding and spending over time and across the country as consistent as possible, we adjust published data in several ways.
Funding
The largest component of our main measure of council funding is ‘core spending power’. To this we add above-baseline growth in retained business rates revenues and transfers from the NHS to help pay for social care via the Better Care Fund and its predecessors. We term our measure ‘core funding’.
Core spending power
Core spending power is an official measure of councils’ funding published by government alongside the Local Government Finance Settlement. It includes:Core spending power is an official measure of councils’ funding published by government alongside the Local Government Finance Settlement. It includes:
- council tax;
- the ‘baseline funding’ councils receive as part of the Business Rates Retention Scheme (ignoring any grants rolled in as parts of pilots of more than 50% retention), plus compensation for below-inflation indexation of this funding over time;
- revenue support grant and several other general-purpose grants;
- a range of grants specifically for social care services;
- New Homes Bonus;
- a ‘funding guarantee’ grant, designed to provide minimum funding increases to every council in 2023–24 and 2024–25.
This measure excludes grants for schools, public health and a number of other areas (such as homelessness), which for our purposes is not a major drawback: there have been changes in councils’ responsibilities in relation to these activities since 2010–11 and so excluding funding for these services helps make things more consistent over time.
We use figures published by government alongside the final Local Government Finance Settlement 2024–25, which cover the period 2015–16 to 2024–25. These published figures have already been adjusted where grants have been consolidated into the settlement to ensure a consistent measure of local authority funding over time. We make one further adjustment to these figures: in 2024–25, we take council tax revenues from separate published statistics, reflecting the actual council tax levels set by each authority.
For years before 2015–16, core spending power was measured somewhat differently. To construct estimates of core spending power for these years, we use figures published alongside each Local Government Finance Settlement between 2011–12 and 2015–16 that provide consistent pairwise comparisons of funding (e.g. for 2014–15 and 2015–16 in the 2015–16 Local Government Finance Settlement). In particular, starting in 2015–16 and working backwards, we use the percentage changes in funding in these pairwise comparisons for each council to estimate core spending power in each prior year in turn. For example, our estimate of core spending power in 2014–15 is based on the published figure for 2015–16 and the percentage change in funding between 2014–15 and 2015–16 published alongside the 2015–16 Local Government Finance Settlement. Our estimate of core spending power in 2013–14 is then based on our estimate for 2014–15 and the percentage change in funding between 2013–14 and 2014–15 published alongside the 2014–15 Local Government Finance Settlement. And so on.
This chain-link approach is based on the approach used by the National Audit Office (2021) to construct its measure of local government funding over time. It is subject to some margins of error because the definitions of funding used in Local Government Finance Settlements in 2015–16 and earlier differ from today’s definition of core spending power; the percentage changes in funding calculated in the pairwise comparisons may therefore not exactly match how the elements now in core spending power were changing. However, for both core spending power and the figures used in the pairwise comparisons, council tax, business rates baseline funding levels, and revenue support grant make up a large majority of overall funding. This means we do not expect errors to be large.
Our approach is not exactly the same as the National Audit Office’s. We make a number of adjustments to the data in the Local Government Finance Settlements before 2015–16 to account for actual (rather than assumed) changes in council tax revenues (and any council tax freeze grant payments), and to better account for the introduction of the New Homes Bonus in 2011–12.
Business rates growth and NHS transfers
Core spending power omits two important sources of funding that help pay for responsibilities councils have had since 2010–11:
- Above-baseline growth in retained business rates revenues. The construction and improvement of properties since the Business Rates Retention Scheme was introduced in April 2013 mean that the revenues councils receive from the scheme exceed the initial baseline funding levels. We calculate this above-baseline growth as each council’s reported income from the BRRS from its revenue expenditure out-turns data, minus its baseline funding level (adjusted to reflect any increased business rates retention arrangement) and any compensation for under-indexation of baseline funding levels.
- NHS social care transfers. From 2011–12 onwards, the NHS has been required to provide funding to councils for adult social care services that help address health needs. Council-level figures for these transfers were provided as part of the Local Government Finance Settlements for 2011–12 to 2014–15. From 2015–16 onwards, these transfers became part of the Better Care Fund – pooled budgets for social care and health between the NHS and councils. For these years, we estimate transfers for social care using the NHS’s total mandatory contribution to the Fund for each local authority, plus national estimates of the share of these contributions that go towards social care (as opposed to health) services.
We add each of these to core spending power to obtain our measure of ‘core funding’. This differs from the measure we used previously to examine trends in funding over time during the 2010s – ‘fiscal revenue’ (see Harris et al. (2019)). That measure included a wider set of grants for specific purposes, but changes in how grant funding is recorded over time mean it was not possible to use this measure consistently pre- and post-COVID.
Spending
When examining spending, we exclude education, police, and fire and rescue services because responsibilities for these differ across the country. For example, the free schools and academies programmes mean many schools are now funded directly by central government – but the proportion varies by council. And while in some areas councils have responsibility for fire services, in other areas they are handled by separate fire authorities. When looking at changes in revenue and spending over time, we also exclude spending on public health, which was devolved to local government between 2013–14 and 2015–16.
Our main spending measures are based on net service expenditure. This is after any income from sales, fees and charges (SFCs) has been netted off, and is spending councils have to fund from their grant and local tax revenues. We take figures as reported in councils’ revenue out-turns, and from their budgets for 2023–24. Where out-turn data are missing, we use figures from councils’ budgets, and we estimate spending in a small number of remaining cases.
The published adult social care spending figures also net off any transfers of funding from the NHS. Therefore to make spending consistent over time (and consistent with our core funding figures), we add on estimated NHS transfers, calculating these in the same way as we do for our core funding figures. In 2010–11, we also add on the value of funding from the Learning Disabilities and Health Reform Grant. It is important to note that our figures do not cover spending on social care services that are directly commissioned by the NHS (such as district nursing and spending on the ‘continuing healthcare’ programme).
We also add on the levies that some councils pay to separate waste authorities, transport authorities or combined authorities to cover the costs of waste disposable and bus services that are undertaken directly by councils in most of the country. This ensures that we capture spending on these services consistently across the country.
Local government structure
The structure of local government differs across England and in some parts of the country has changed over time. For example, in most urban parts and an increasing number of rural parts of the country, local government operates on a single-tier structure: one council (a borough, metropolitan district or unitary authority) is responsible for the vast majority of local government services. In many, typically more rural parts of the country though, local government operates on a two-tier structure: a lower-tier shire district is responsible for some services, while an upper-tier shire county is responsible for the biggest services such as adults’ and children’s social care services. To make meaningful comparisons across the country – for example, how changes in funding vary according to how deprived an area is – we need to compare funding for councils with the same set of responsibilities. We therefore aggregate funding and spending in two-tier areas to the upper-tier shire county level so that we can make comparison with funding and spending in single-tier areas.
Where the structure of local government has changed over time, we use the structure in place in the current financial year (2024–25). Where the new structure has involved merging former councils together, in years prior to the merger we sum the funding and spending of the relevant former councils. Where the new structure has involved splitting some former councils (for example, Cumbria and Northamptonshire have both been split into two unitary authorities), we use population to split the former councils’ funding and spending into estimates for their new successor councils.
References
Adam, S., Joyce, R. and Pope, T. (2019), ‘The impact of localised council tax support schemes’, https://ifs.org.uk/publications/impacts-localised-council-tax-support-schemes.
Amin-Smith, N., Eiser, D., Phillips, D., Simpson, P. and Trickey, M. (2016), ‘A time of revolution? British local government finance in the 2010s’, https://ifs.org.uk/publications/time-revolution-british-local-government-finance-2010s.
Amin-Smith, N., Harris, T. and Phillips, D. (2019), ‘Needs and resources: response to the Ministry of Housing, Communities and Local Government’s consultation’, https://ifs.org.uk/publications/response-ministry-housing-communities-and-local-governments-consultation.
Amin-Smith, N., Phillips, D. and Simpson, P. (2018), ‘100% business rate retention pilots: what can be learnt and at what cost?’, https://ifs.org.uk/publications/100-business-rate-retention-pilots-what-can-be-learnt-and-what-cost.
Amin-Smith, N. and Phillips, D. (2019), ‘Response to the Ministry of Housing, Communities and Local Government’s consultation on the reform of the business rates retention system’, https://ifs.org.uk/publications/response-ministry-housing-communities-and-local-governments-consultation-reform.
Audit Scotland (2024), ‘Local government in Scotland: financial bulletin 2022/23’, https://audit.scot/uploads/docs/report/2024/nr_240116_local_government_finance.pdf.
Boileau, B. (2024), ‘Spring Budget 2024: public service spending’, https://ifs.org.uk/sites/default/files/2024-03/Public-service-spending-Bee-Boileau.pdf.
Competition & Markets Authority (2022), ‘Children’s social care market study final report’, https://www.gov.uk/government/publications/childrens-social-care-market-study-final-report.
Gibson, A. and Asthana, S. (2011), ‘Resource allocation for English local government: a critique of the four-block model’, Journal of the Royal Statistical Society Series A: Statistics in Society, 174(3), 529–46.
Harris, T., Hodge, L. and Phillips, D. (2019), ‘English local government funding: trends and challenges in 2019 and beyond’, https://ifs.org.uk/publications/english-local-government-funding-trends-and-challenges-2019-and-beyond-0.
HM Treasury (2021), ‘Autumn Budget and Spending Review 2021’, https://www.gov.uk/government/publications/autumn-budget-and-spending-review-2021-documents.
Institute for Government (2019), ‘Performance Tracker 2019: a data-driven analysis of the performance of public services’, https://www.instituteforgovernment.org.uk/publication/report/performance-tracker-2019.
Local Government Association (2023), ‘High cost children’s social care placements survey’, https://www.local.gov.uk/publications/high-cost-childrens-social-care-placements-survey.
National Audit Office (2021), ‘The local government finance system in England: overview and challenges’, https://www.nao.org.uk/reports/the-local-government-finance-system-in-england-overview-and-challenges/.
Nottingham City Council (2023), ‘Report made under part VIII s.114(3) of the Local Government Finance Act 1988 (“The Act”)’, https://www.nottinghamcity.gov.uk/section-114-report-updates/.
Ogden, K. and Phillips, D. (2021), ‘The government has addressed most of the short-term COVID-19 financial pressures facing English councils, but problems loom in 2022–23 and beyond’, https://ifs.org.uk/articles/government-has-addressed-most-short-term-covid-19-financial-pressures-facing-english.
Ogden, K. and Phillips, D. (2022), ‘Looking back to look forwards: what can we learn from data on the impacts of COVID-19 on councils in 2020–21?’, https://ifs.org.uk/publications/looking-back-look-forwards-what-can-we-learn-data-impacts-covid-19-councils-2020-21.
Ogden, K. and Phillips, D. (2023), ‘The distribution of public service spending’, IFS Deaton Review of Inequalities, https://ifs.org.uk/inequality/the-distribution-of-public-service-spending/.
Ogden, K., Phillips, D. and Warner, M. (2023), ‘How much public spending does each area receive? Local authority level estimates of health, police, school and local government spending’, https://ifs.org.uk/publications/how-much-public-spending-does-each-area-receive-local-authority-level-estimates-health.
Phillips, D. (2019a), ‘What do the election manifestos mean for local government funding?’, https://election2019.ifs.org.uk/article/what-do-the-election-manifestos-mean-for-local-government-funding.
Phillips, D. (2019b), ‘Will next year be just a lull in the storm?’, https://ifs.org.uk/articles/will-next-year-be-just-lull-storm.
Phillips, D. and Warner, M. (2024), ‘Healthcare spending, staffing and activity: Scottish Budget 2024–25’, https://ifs.org.uk/publications/scottish-budget-healthcare-spending-staffing-and-activity.
Skills for Care (2020), ‘The state of the adult social care sector and workforce in England, 2021’, accessible at https://www.careengland.org.uk/state-adult-social-care-sector-and-workforce-england/.
Skills for Care (2023), ‘The state of the adult social care sector and workforce in England’, https://www.skillsforcare.org.uk/Adult-Social-Care-Workforce-Data/Workforce-intelligence/publications/national-information/The-state-of-the-adult-social-care-sector-and-workforce-in-England.aspx.
Endnotes
Authors

Kate Ogden
Kate joined the IFS in 2020 and works on local government finance and higher education.

David Phillips
David is Head of Devolved and Local Government Finance. He also works on tax in developing countries as part of our TaxDev centre.
More from IFS
Understand this issue


Policy analysis


Academic research


