
Downloads
Download the report as a PDF
PDF | 6.8 MB
In 2022–23, more than £245 billion was spent on delivering five key public services across England: the NHS, schools, local government, the police and public health. This funding was used to deliver services to people in specific places. The scale of this spending and the important contribution these public services can make to individuals’ life chances make it vital that funding for public services is allocated in an effective and fair manner.
Systems for allocating funding between different local areas must trade off several objectives. One important aim is to account for variation in the needs of different populations and places across the country. Local areas differ in their geographical and socio-economic characteristics, which may affect both the demand for and the cost of providing public services. For the same level of public services to be delivered across the country, helping to narrow geographical inequalities, different places will need different amounts of funding.
In this report, we estimate the total funding available for five services in each local authority area in England in 2022–23. Indeed, we find per capita funding does vary significantly between areas. Typically, areas that receive more per capita funding for one service also receive above-average funding for other services. More-deprived and more densely populated (typically more urban) places receive more funding per capita on average across all the services we examine.
To determine whether these different levels of funding allow for the same level of services to be provided across the country, we also need to understand the relative needs of different areas. We cannot directly observe these, and any estimates will be somewhat subjective, reflecting choices over which area characteristics to include. We take the latest available government estimates of the relative spending needs of different places, which capture the priority that government placed historically on different drivers of needs and on narrowing inequalities between places. As these are often out of date, we update them with more recent data – as best we can – to reflect changes in the populations and socio-economic characteristics of each area.
We compare the funding that each area received in 2022–23 with the funding it would have received if the total funding available for each service nationally was allocated to areas in proportion to these estimated relative spending needs. We find that there are significant discrepancies between relative levels of funding and estimated needs across the country. For instance, while more-deprived areas receive more funding, for local government and police services, they do not receive as high a share of the national funding pot as the formulae used in official spending needs assessments suggest they should. This echoes the findings of our earlier work (Ogden et al., 2022) that the funding systems for local government, public health and the police did not properly reflect differences in assessed needs across places and were unresponsive to changes in the relative needs of different parts of the country.
However, there are few areas that appear to be systematically advantaged or disadvantaged in terms of funding across multiple services. Those areas that receive a lower share of funding than their share of estimated needs for one service typically receive a higher share of funding than their share of needs for other services. These differences do not ‘balance out’ as, under current arrangements, funding cannot be easily shifted between services at a local level.
We also highlight how sensitive our results are to a range of assumptions – including different methods for allocating funding between areas (particularly within broader areas to which police and NHS funding are allocated), different assumptions about population levels, and whether to adjust for differences in the council tax levels that different councils and police forces levy. This allows us to be confident that patterns are robust to different choices of methodology.
Key findings
1. Funding for the NHS, schools, local government, the police and public health in England totalled more than £245 billion in 2022–23, and accounted for more than 40% of total current government spending. This scale, together with the importance of public services for health, well-being and life chances, makes how funding for public services is allocated between places very important.
2. Funding for delivering these services in specific places averaged £4,310 per capita across England, but this varied widely – from an estimated £3,642 in York, to £5,648 in Blackpool (55% more). Funding per capita was highest in inner London boroughs and relatively deprived, urban areas in the North, including parts of Greater Manchester, Liverpool and Teesside. It was typically below average across much of the South of England, and was £271 (6%) below average in the South East. More-deprived and more-urban areas receive more funding per capita across all services, although this is starkest for public health and least strong for local government. Areas with higher funding for one service also typically received higher funding for all other services.
3. Relative funding levels are particularly sensitive to choices around which set of population estimates to use. The latest figures from the Office for National Statistics (ONS), based on the 2021 Census, suggest that far fewer people lived in some parts of London (a quarter in Camden and Westminster) than expected when funding allocations were determined using population estimates that in part were based on the 2011 Census. These figures move Camden from the least-funded third of places (using the earlier population estimates) to the second highest funded per capita in England.
4. The amount that needs to be spent in different parts of the country to deliver the same level of services also varies widely, due to differences in both the demand for services and the costs of providing these. Based on the government’s needs assessments, updated to reflect the most up-to-date publicly available data, we estimate that Blackpool has the highest need for funding across the NHS, local government, police and public health – 74% higher than in Wokingham, which has the lowest estimated need.
5. NHS funding appears to be relatively well-targeted to estimated needs. For example, using ONS population estimates, two-thirds of areas receive a share of funding that is within 5% of their share of estimated spending needs. Using GP registered populations, which are the population estimates actually used in the NHS funding allocation process, this rises to nine in ten areas. This reflects that NHS funding is allocated to areas predominantly based on needs assessments, which are themselves fairly up to date.
6. Local government funding is much less well-targeted towards estimated needs, with only 39 areas out of 150 receiving a share of funding that is within 5% of their share of estimated spending needs. For instance, Wokingham received a share of local government funding that was 45% higher than its share of estimated needs, while Hounslow received 31% less. These large differences only partly reflect local choices around revenue-raising, and are largely due to the government prioritising other objectives in the local government funding system.
7. Similar issues affect allocations of police funding. Shares of police funding were furthest below shares of estimated needs for areas in the West Midlands (−19%) and Greater Manchester (−8%), while rural areas with older populations tended to receive higher shares of funding than they were estimated to need. These differences are only partially explained by differences in police council tax precept.
8. Public health funding is particularly poorly aligned with estimated needs, with some of the widest gaps in percentage terms. Slough received a share of public health funding that was 35% lower than its share of estimated needs in 2022–23, and Kensington and Chelsea received 116% more. While these differences are relatively small in cash terms (public health spending is just over 1% of overall spending on the services we examine), this reflects a clear failure of the government to ensure public health funding accounts for estimates of the relative spending needs of different populations and places.
9. While there are large gaps between funding and need for different services, it is not the case that some areas appear to be systematically disadvantaged across all services. In particular, areas that receive lower shares of NHS funding than their share of estimated need typically receive more funding than their share of estimated need for local government services. For example, while Cornwall’s share of NHS funding equates to £138 per capita less than its share of estimated needs, its share of local government funding equates to £156 more. The reverse is typically true in London. This still represents a significant misallocation of funding as it is not possible in practice to shift funding between NHS and local government services within areas.
10. Only a small number of areas are significantly underfunded across multiple services. Coventry and Dudley each receive a share of funding that is at least 5% less than they are assessed to need for three of four services. Expressed in cash terms (based on the nationwide funding for these services), Dudley receives £127 per capita less for the NHS, £122 less for local government and £47 less for police services than if funding was allocated in line with estimated relative needs.
11. Overall, the most-deprived fifth of areas receive a share of funding that is 3% lower than their share of estimated needs, and the least-deprived fifth of areas 3% more. This pattern is driven almost entirely by local government, where the gaps are much starker (−9% and +15%).
12. The broad patterns of funding, the estimated relative spending needs and the gap between the two across different types of places are robust to different choices around which population figures to use and how to allocate NHS funding within Integrated Care System areas and police funding within Police Force Areas. However, figures for certain individual areas do vary substantially (such as the example of Camden, above). This matters because funding allocation processes need to allocate funding to specific places, not just broad types of places – and uncertainty about key drivers of spending needs, such as population, is therefore problematic.
Lessons for policy
These findings have a number of important implications for policy.
First, it is the local government, police and public health funding allocation systems that are most in need of reform, especially if the government is serious about tackling geographical inequalities and ‘levelling up’. In doing so, it may actually want to go beyond aligning relative levels of funding more closely with estimates of relative spending needs. It could, as with the NHS, provide explicit ‘top ups’ to areas with high needs so that these areas can offer better quality public services, in order to go further in narrowing inequalities going forwards.
Based on the current formulae used to estimate needs, this would redistribute funding from more-affluent to more-deprived places for local government and police funding, and from more-urban (often deprived) to more-suburban and rural (often more affluent) areas for public health.
At the very least, the government should update the data used in these formulae – it will be able to do this more comprehensively than we have. Efforts to improve population data being undertaken by the ONS are important given the big discrepancies between pre- and post-2021 Census figures, and the big gaps between ONS estimates and GP rolls used in NHS funding allocations. Indeed, while the NHS funding allocation system functions much better than those used for the other services we consider, the big gap between the population figures it uses and those used elsewhere in the public sector is concerning, and could result in significant misallocations of funding in certain parts of the country.
Simply updating data is not enough. Changes to the activities that public service providers spend their money on, and changes in the technology and processes by which they carry out their work, mean that the relationship between local characteristics and spending needs will have changed. For example, children’s social care services take up a larger share of local government spending than historically, and the costs of foster and residential care and support make up a bigger share of this budget line too. The government should update the formulae themselves to reflect these changes.
Given updated estimates of spending needs, the government then needs to ensure they are used as part of funding systems that are transparent, in particular about how they trade off spending needs against other objectives – such as providing financial incentives for growth, local discretion on spending levels, and stability and certainty in funding levels from year to year. The gaps between estimated needs and funding (at least under current spending needs formulae) are so large that it will likely take several years to move to new ‘target’ funding allocations, but providing clarity on the direction of travel will help local service providers plan effectively.
The fact that areas which are relatively underfunded for some services (e.g. local government) typically do relatively well for other services (e.g. the NHS) also suggests that there may be benefits in providing greater flexibility to local leaders to move spending between service areas.
Providing such flexibility is not without its challenges, not least because different services are delivered by different organisations covering different geographies. But there are examples of such arrangements already – such as the Better Care Fund, where NHS bodies and councils pool funding for adult social care services. And while local areas could also use such flexibility to de-prioritise some services in ways central government deems undesirable, the government can reduce that risk by ensuring there are clear minimum standards that are expected for different services.
For local service providers to meet these minimum standards, it is not just their relative funding levels that matter – it is their absolute funding levels. We currently have a very poor understanding of the links between absolute funding levels, service provision, quality and outcomes. Obtaining a better understanding of these links, and the funding required to deliver particular outcomes, is key to improving future public service funding decisions. This would not only allow for a greater alignment between funding policy and expectations of service quality and outcomes at a national level. It would also help inform decisions about how changes in public service spending could help narrow geographical inequalities in health, well-being and life chances across places.
1. Introduction
In 2022–23, the government provided £168 billion to the Department of Health and Social Care – or almost £3,000 per person in England. This funding is allocated across the country via a system that aims to account for differences in the healthcare needs of local populations and in the costs of providing services in places with different property and labour costs, and also has the explicit objective of reducing the large observed health inequalities across people and places.
Ensuring that this system is working effectively is vital, as there is increasingly robust evidence that the level of funding available matters for health outcomes. For example, Martin, Rice and Smith (2008) find that higher health spending helps reduce deaths from circulatory and respiratory problems, cancer, gastro-intestinal problems and diabetes, albeit with impacts differing by disease. Martin et al. (2021), exploiting changes in formulae for allocating spend across local areas, estimated that between 2003–04 and 2012–13, an additional £5,000 to £10,000 of NHS spending generated an improvement of one quality-adjusted life year (QALY). Moreover, several studies find that use of healthcare services by poorer, less-educated people is particularly sensitive to spending levels – perhaps because they lack the ‘hard elbows’ needed to navigate the system when spending is constrained (Ogden and Phillips, 2023). Therefore, if the funding system is not allocating funding effectively in line with needs, health outcomes could be suffering in those areas that are relatively underfunded – particularly outcomes among disadvantaged people.
But healthy lives require much more than access to healthcare, and many other public services play an important role in creating the conditions people need to thrive physically and mentally.
The services local government provides are likely to be particularly important. Adults’ and children’s social services are vital for the well-being and safety of some of the most vulnerable members of society. Evidence also shows that such services have wider health impacts, including reducing the use of emergency health services (Cattan et al., 2021; Crawford, Stoye and Zaranko, 2021). Having a home that is safe and suitable in terms of size and accessibility is important for health and well-being (Marsh et al., 2000). Recreation, leisure and cultural services provide opportunities for people to exercise and socialise, and enhance the natural environment, all of which are beneficial for health (Valtorta et al., 2016; World Health Organization, 2016). Local transport and planning services play a vital role in allowing people to access other services, as well as enabling people to access employment opportunities and generally supporting the economic prosperity of areas, all of which play an important role in health and well-being (Janke et al., 2020; Venkataramani et al., 2020).
Police services also play a role in tackling not only crime, but the harm to health caused by crime, and also help prevent those suffering mental health crises from harming themselves and others. Crime and fear of crime have been shown to have significant effects on the health and well-being of both victims of crime and the wider population (Ludwig et al., 2012; Cornaglia, Feldman and Leigh, 2014). Indeed, evidence for England and Wales suggests that differences in local crime rates have between two and four times the impact on mental well-being that differences in local employment rates do (Dustmann and Fasani, 2014). Crime also has more immediate and direct effects on health, including through injuries and even death, and creates significant workloads for the health service (Robinson and Keithley, 2010).
While the causal direct effects of education on health are generally modest and complex (Galama, Lleras-Muney and van Kippersluis, 2018; Hamad et al., 2018), education is important for income and broader life chances, which themselves are strong determinants of health outcomes. Moreover, a growing body of evidence shows clearly how the amount spent on schools matters for educational attainment and later labour market performance, particularly for poorer children (Ogden and Phillips, 2023).
It is therefore vital to look at how funding is allocated across the country for public services outside the health system in order to understand whether government spending is being allocated in a way that can help tackle health (and other) geographical inequalities – or at least not exacerbate them. Indeed, reforms to how public spending is allocated across places are one of the most direct levers the government has for tackling geographical inequalities and affecting its ‘levelling up’ agenda.
In earlier work (Ogden et al., 2022), we explained and assessed the current approaches to allocating funding for a number of key public services (health, local government, police, housing and schools), and looked at the resulting funding allocations for 2019–20. We found that the funding systems for councils, public health and the police were not fit for purpose; they did not properly reflect differences in assessed needs across places and they were unresponsive to changes in the relative needs of different parts of the country over time. In addition, we showed how funding for councils, the police and schools became significantly less targeted at more-deprived places during the course of the 2010s, although the reasons for this differed somewhat between these services.
In this second report, we update and extend in our analysis in four main ways.
- First, we update our year of analysis from 2019–20 to 2022–23. In doing so, we also update spending needs assessments for local government, police and public health services using more recent data, where available; previously, we had been able to update for changes in population up to 2019–20, but not changes in other socio-economic characteristics of areas.
- Second, we estimate the funding available for each of these services for a common geographical level: upper-tier local authorities, which in shire areas with two-tier local government means the county council area. This allows us to look at the total funding that different places receive for the NHS, schools, local government, public health and police services, but requires us to apportion spending within Police Force Areas (PFAs) and NHS Integrated Care System (ICS) areas down to that level. We explain how we do this in Chapter 2 and in the separate methodology appendix (Appendix A).
- Third, we bring together our estimates of funding for health, local government, police and schools to obtain the total estimated budgets available across these services for each area in England.
- Fourth, we examine the overall discrepancy between funding and assessed spending needs by local authority for NHS, local government, public health and police services,1 and examine whether there are areas that are systematically advantaged or disadvantaged in terms of funding across multiple service areas.
Importantly, we only have measures of the relative spending needs of different areas, and not the absolute level of funding an area would need to deliver a particular level of services. Our measures of assessed spending needs reflect the funding each area would receive if the total funding for a service England-wide in 2022–23 was allocated to areas in proportion to their estimated relative spending needs. This means we avoid describing places as being overfunded or underfunded, but instead describe them as receiving a higher or lower share of funding than their share of estimated spending needs.
The rest of the report proceeds as follows. In Chapter 2, we look at how funding for health services, local government, the police and schools varies across upper-tier local authority areas. We first explain how we allocate funding within PFAs and ICS areas to local authority areas. We then show how estimated funding allocations for each service, and the combined total, vary geographically, and according to local area characteristics. In doing this, we highlight how sensitive our results are to a range of assumptions – including different methods for allocating funding within PFAs and ICS areas, different assumptions about population levels, and whether to adjust for differences in the council tax levels that different authorities levy.
Chapter 3 then turns to variation in assessed spending needs. This again begins with a discussion of how we assess spending needs, including for the local authority areas that make up PFAs and ICS areas. We then look at how assessed spending needs vary, as well as gaps between funding and assessed spending needs. Chapter 4 draws on our findings to provide policy suggestions.
Finally, in two separate appendices, we provide details of our methodology and additional results (including analysis by other area characteristics), setting out in maps and graphs the results of the sensitivity analyses cited in the main report.
Note that in order to keep this report to a manageable length, both the main chapters and the two appendices focus on key results and patterns. For information on individual local authority areas, please use the online interactive tool provided on the IFS website.2 Maps allow users to click on a given local authority and see estimates of funding for each service area covered (and the total for these service areas). For services other than schools, users can also see estimated needs, and the gap between the share of funding an area received and its share of estimated needs. Users can also choose to look at how funding, needs and these gaps vary according to a wider range of local socio-economic characteristics, or using different alternative methods, and can download spreadsheets of all results.
2. Total place-based funding for key public services
In this chapter, we examine the distribution of funding for key public services to upper-tier local authority areas across England. In the first section, we discuss the relative size of the five public services we examine, and the share each makes up of total government expenditure. In the second section, we illustrate the geographical distribution of funding for each of the five services we examine, as well as total funding for the five services. We analyse the impact of key assumptions of the estimated total funding in each area and illustrate the relationships between per capita funding across the five services under examination. Finally, in the third section, we examine how per capita funding varies based on the characteristics of local areas, including by region, population density, socio-economic deprivation, and demographic structure.
2.1 What funding do we include?
Throughout this chapter, we focus on five key public services. In order of size, they are the NHS, primary and secondary schools, local government, the police and public health services. Funding for these services that we are able to allocate between local areas in England amounted to £245 billion in 2022–23, or £4,310 per capita. For local government, we include revenue from council tax and business rates that is retained locally, as well as core central government grants. For public health, we include only the public health grant. For more detail of which revenue streams are included in funding for each service and why, see Appendix A.
We focus on these services as they are the largest areas of day-to-day spending on public services, which are likely to affect individuals’ life chances, and for which we can identify how funding has been allocated to local areas. Together, our measure of funding across these five services accounts for around 37% of total current government spending, as shown in Figure 2.1. For services other than schools, we also have some way to assess relative spending needs of different areas. When comparing funding to needs, we are able to include £192 billion of funding, around 29% of total current government spending.
Figure 2.1. Total government identifiable current spending in England, 2022–23 (estimated)
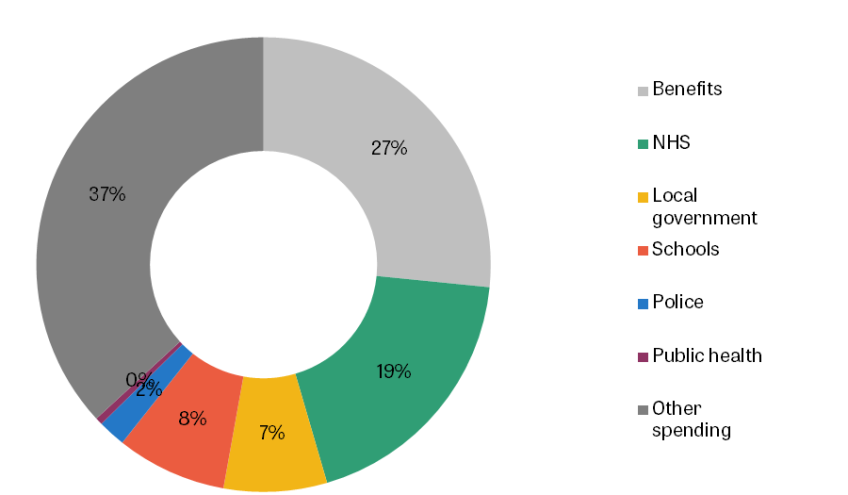
Note: Excludes public sector net investment, depreciation, debt interest payments and non-identifiable spending that cannot be allocated to a region. Other spending includes some parts of local government, health, education and police spending that are not included in our analysis (see Appendix A), and all spending in the City of London and Isles of Scilly. We estimate total identifiable current spending in England in 2022–23 as the total identifiable current spending in England in 2021–22 (the latest available) scaled by the increase in total current expenditure between 2021–22 and 2022–23 in the 2023 Spring Budget. We estimate total benefits spending in England in 2022–23 as the total benefit expenditure in 2019–20, scaled by the increase in UK-wide total benefit expenditure between 2019–20 and 2022–23.
Source: HM Treasury (2023a, 2023b), Benefit Expenditure by Country and Region 2019/20 (Department for Work and Pensions, 2020) and Spring Budget 2023 expenditure and caseload forecasts (Department for Work and Pensions, 2023).
This funding for core public services vastly outweighs funding through the government’s flagship ‘levelling up’ investment programmes. For instance, areas in England will have received a total of £1.6 billion from the UK Shared Prosperity Fund over three years, equivalent to around £9 per capita per year. Successful bids from areas in England for funding from the Levelling Up Fund (rounds 1 and 2) came to £3.0 billion over four years, or around £13 per capita per year. Even small changes in the way funding for public services is allocated between areas have the potential to have more substantial impacts on the total amount of public spending in particular areas.
As well as these specific ‘levelling up’ funds, we also exclude all other capital spending, including, for instance, investments in transport infrastructure. While these investments are potentially important for the prosperity of different places, we lack sufficient data on how capital spending is allocated geographically. For large infrastructure projects, it is not clear how to apportion the funding between different local areas. We also do not have a good concept of the ‘needs’ of particular places or communities for capital spending – are needs higher in areas with higher populations, or those which have experienced faster recent population growth, or where public infrastructure is less developed or where it is deteriorating more quickly? Similarly, we exclude housing, as we do not have comprehensive information on funding allocations to specific places or assessments of the ‘needs’ of particular places. Issues around the allocation of funding for housing improvement and construction are discussed in Ogden et al. (2022).
We also exclude spending on social security. While it would be possible to estimate spending on working-age and pensioner benefits in each local area, our focus in this report is specifically the allocation of funding to different places for the delivery of public services. We might expect social security spending to be relatively well-targeted and responsive to the needs of people living in different areas. Indeed, for both capital and social security spending, there are big differences in per capita spending across regions. For instance, as highlighted in Ogden et al. (2022), per-person capital spend is 50% higher in London than the English average, driven by much higher public investment in transport in the capital. In contrast, per capita social security spending is lower in London than in any other region and highest in the North East and North West, reflecting the relative youth of the capital and differential patterns of disability and unemployment.
2.2 Funding allocations
How we estimate funding in each local area
Funding for public services is allocated at different levels of geography, which makes it difficult to compare the funding that each local area receives for different public services. In this report, we harmonise the funding for each of our five public services to the level of upper-tier local authorities, of which there were 152 in England in 2022–23.3 In this section, we summarise how we move funding allocations for each public service to the local authority level. Appendix A contains more details.
Funding for public health is allocated by central government to upper-tier local authorities, and so we can directly use these funding allocations in our analysis. For local government, some shire areas have two levels of local government, with a county council and several district councils. In these, we sum up funding across both levels to the upper tier. For schools, we calculate total funding as the sum of funding to all the schools located within each local authority area.4
Allocating funding for the NHS and the police to local authority areas is more complex because funding for these services is allocated to different geographical areas.
NHS funding is currently allocated to Integrated Care Systems (ICSs).5 In 2022–23, there were 42 of these systems, far fewer than the 152 upper-tier local authorities in England. Each ICS contains at least one local authority, and the average ICS overlaps with seven different local authorities. However, local authority areas do not fit neatly within ICS borders and 10 local authorities overlap with two or more ICSs. Figure 2.2 shows the borders of each ICS compared with the borders of local authorities. The black solid lines show the borders of each ICS while the blue dashed lines show each local authority border that does not overlap with an ICS border.
Figure 2.2. Map of Integrated Care Systems and upper-tier local authorities

Police funding is instead allocated to PFAs, of which there were 39 in 2022–23.6 Unlike ICSs, local authorities do fit neatly fit within PFA borders. PFAs range from containing a single local authority (such as in Surrey and Lincolnshire) to the Metropolitan Police, which contains 32 local authorities. Figure A.2 in Appendix A shows the borders of PFAs and upper-tier local authority boundaries.
To measure funding in a local authority area, we must make some assumptions about how NHS funding and police funding are allocated between places within these larger areas.7 The simplest assumption is that funding is allocated equally per capita. However, PFAs and ICSs often contain local authorities with very different characteristics, which makes it unlikely that funding is in practice allocated only on the basis of population. For example, the Nottinghamshire PFA contains the rural local authority Nottinghamshire and the urban local authority Nottingham, which may have very different per capita needs for NHS and police services.
Instead, our baseline assumption is that NHS and police funding is spent in local authorities based on their relative needs for spending, calculated using the formulae that the government uses to allocate funding to the larger geographies. In our example of Nottinghamshire’s PFA, we estimate that Nottingham local authority ‘needed’ 80% more police spending per capita than Nottinghamshire local authority (which covers all of Nottinghamshire except for Nottingham itself) in 2022–23. Using this method, we take the £214 per capita that is allocated to Nottinghamshire police and assign £175 per capita to Nottinghamshire local authority and £314 per capita (80% more) to Nottingham local authority.
We discuss how we calculate these spending needs in Chapter 3, where we focus on differences in need and the gap between funding and need. Importantly, this assumption – that funding is allocated within areas based on assessed needs – means that our main estimates of gaps between funding and need will be driven only by misallocations of funding across PFAs and ICSs, rather than within them. This is because we allocate funding and assessed needs in the same way between authorities within each PFA and ICS.
In Appendix A, we validate this assumption for in-patient hospital spending using detailed administrative hospital records. These data allow us to estimate spending for small local areas within ICSs so we can compare actual spending on this subset of NHS services between local authorities within the same ICS. Figure A.1 shows that our assumption that funding is allocated within ICSs based on relative need is much closer to what actually occurs for in-patient hospital spending than assuming it is allocated equally per capita within each ICS.
Throughout our analysis, we focus on per capita funding and needs. Given that local authority areas vary widely in size (from 42,000 people in Rutland, to 1,592,000 in Kent County), this allows for more useful comparisons of funding between areas than absolute cash amounts. Our main analysis uses 2021-based ONS population estimates (Office for National Statistics, 2022a), adjusted to mid-2022, with more details in Appendix A. We also discuss how sensitive our results are to using different population estimates.
The distribution of funding
In this section, we examine the distribution of funding to local authority areas for each of the five services we consider (see Table 2.1). As shown in Figure 2.3, in every area, the public service that receives the most funding is the NHS. Average NHS funding is £2,227 per capita, ranging from £1,777 in Wokingham to £3,144 in Blackpool (77% more).
Table 2.1. Funding included for each service across England in 2022–23
Service | Total funding, £bn | £ per capita |
NHS | 126.5 | £2,227 |
Schools | 52.6 | £926 |
Local government | 49.2 | £865 |
Police | 13.2 | £232 |
Public health | 3.4 | £60 |
Total (all services) | 244.9 | £4,310 |
Note: Excludes City of London and Isles of Scilly. Average per capita is population-weighted.
Figure 2.3. Distribution of estimated funding for each service, 2022–23

Note: Upper-tier local authority areas in England, excluding City of London and Isles of Scilly.
Source: Authors’ calculations.
The next two largest areas of spending are schools and local government. The distributions of funding overlap, with two-thirds of areas receiving more funding per capita for schools than local government, and a third receiving more funding per capita for local government than schools. The average funding per capita is £926 for schools and £865 for local government. They both have similar ranges: the highest funding per capita for schools is £1,438 in Barking and Dagenham and the highest funding per capita for local government is £1,332 in Camden. The lowest funding per capita for schools is £727 in Brighton and Hove and for local government is £631 in Trafford.
The two smallest services of the five we consider are the police and public health. The average funding for police services is £232 per capita, ranging from £135 in Rutland to £666 in Westminster. The average funding for public health services is £60 per capita, ranging from £32 in Wokingham to £161 in Westminster.
As well as comparing the minimum and maximum levels of funding for each service – the range – another measure of the variation in funding across areas is the interquartile range. This compares the funding received by the 75th percentile and 25th percentile of areas. This range is twice as large in percentage terms for public health (81%) than for the next service (police funding, 38%) and is narrowest for NHS funding (15%). In cash terms, the interquartile range is widest for the NHS (£310 per capita) and narrowest for public health (£36 per capita).
We then sum funding across these services to produce a measure of total place-based funding. This averages £4,310 across England and, as shown in Figure 2.4, ranges from £3,642 in York, to £5,648 in Blackpool (55% more).
Figure 2.4. Distribution of total place-based funding, 2022–23

Note: Upper-tier local authority areas in England, excluding City of London and Isles of Scilly.
Source: Authors’ calculations.
Figure 2.5 shows the geographical distribution of our estimated measures of funding per capita – separately for each service, and for the total. Areas highlighted in yellow receive the highest level of funding per capita, and dark blue the lowest. Interactive versions of these maps are also available online at the IFS website.
Figure 2.5. Estimated funding per capita for each service area 2022–23
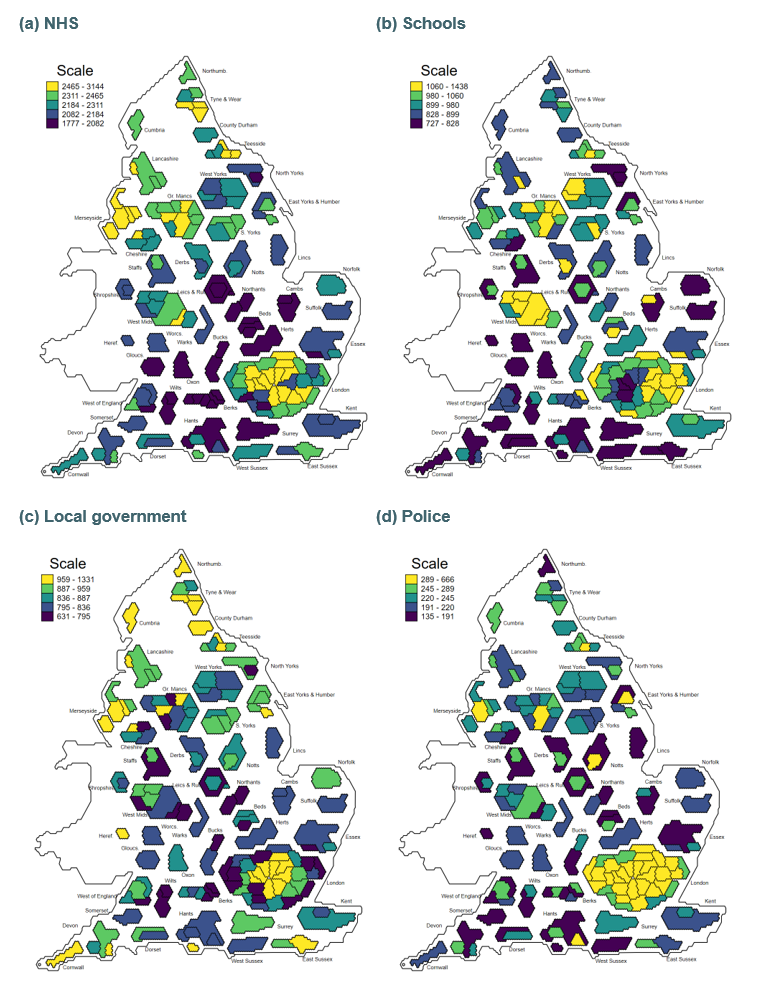
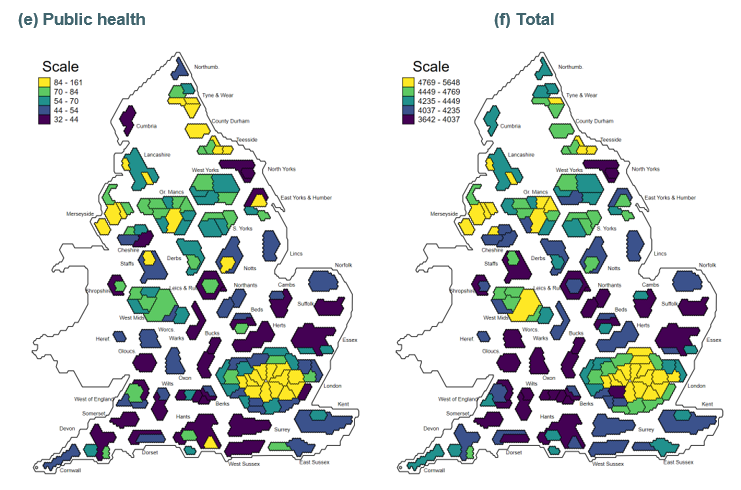
Note: Map design is based on non-contiguous hexagon-based cartograms of the UK (see House of Commons Library, 2022).
How robust are these patterns to our choice of methodology?
In this section, we examine the sensitivity of our estimates to four alternative choices of methodology: based on notional rather than actual council tax revenues; distributing funding within ICSs and PFAs equally per capita rather than using relative need; using GP practice registrations instead of ONS populations for NHS funding; and using 2020-based population estimates rather than 2021-based population estimates for all services.
We first consider council tax revenues. For services where there is some local discretion over revenue-raising (local government and police), our estimated distributions of funding reflect the actual council tax levels set by local policymakers. We might expect the government, when allocating grant funding to areas, to account for differences in each area’s capacity to raise revenues, rather than their actual revenues. For instance, government could consider the notional funding each area would receive if they all set the same council tax rates. As we described in our earlier report (Ogden et al., 2022), this was a feature of the local government funding system before 2006–07, and would avoid penalising areas which choose to set above-average council tax rates with lower grant funding, and rewarding areas which set below-average council tax rates.
We therefore consider what funding each area would receive if residents were charged the national average band D council tax level for council services in each area, and the national average council tax precept for police services. Figure 2.6(a) shows the percentage change in total place-based funding per capita if we include areas’ notional council tax revenues, rather than their actual revenues, with areas in yellow receiving more funding and those in dark blue receiving less. Figures B.1 and B.2 in Appendix B show our alternative estimates of the geographical distribution of local government and police funding, and how total place-based funding differs between our main estimates and those using notional council tax revenues.
Using average council tax rates affects our total place-based funding measure by very little in the vast majority of areas, as most authorities set council tax rates relatively near to the national average. In 20 areas, total per capita funding would be more than £50 lower, and in another 23, more than £50 higher. A small minority of areas (Westminster, Wandsworth, Kensington and Chelsea, and Hammersmith and Fulham) would have more than £300 more total funding per capita. As we discussed in our first report, these areas set council tax levels far below the national average, and so the level of funding they receive is despite raising relatively low property taxes from residents.
We next consider how our estimated funding depends on how we distribute funding within ICSs and PFAs. In our main estimates, we distribute funding for NHS and police services within these broader areas based on the relative per capita need of each local authority area. As an alternative, we could instead distribute funding equally per capita to all local authorities within the same ICS or PFA. Figure 2.6(b) shows the percentage change in total place-based funding under this alternative assumption, compared to our main estimates. Figures B.3 and B.4 in Appendix B show our estimates of the geographical distribution of NHS and police funding using equal per capita allocations within ICSs and PFAs, and how total place-based funding differs between our main estimates and these alternative estimates.
Under this alternative assumption, the distribution of total funding per capita would be slightly narrower, as funding for NHS and police services would be less targeted towards the apparently neediest local authority areas within wider geographies. This would generally reduce funding per capita in areas covering city centres, and increase it in neighbouring areas that are assessed to have lower spending needs. This can be seen in Figure 2.6(b), with funding per capita lower in Manchester and higher in Trafford, lower in Exeter and Plymouth and higher in Devon, and lower in Stoke-on-Trent and higher in the rest of Staffordshire.
Figure 2.6. Estimated percentage point difference in total funding per capita using alternative methods, compared to main estimates
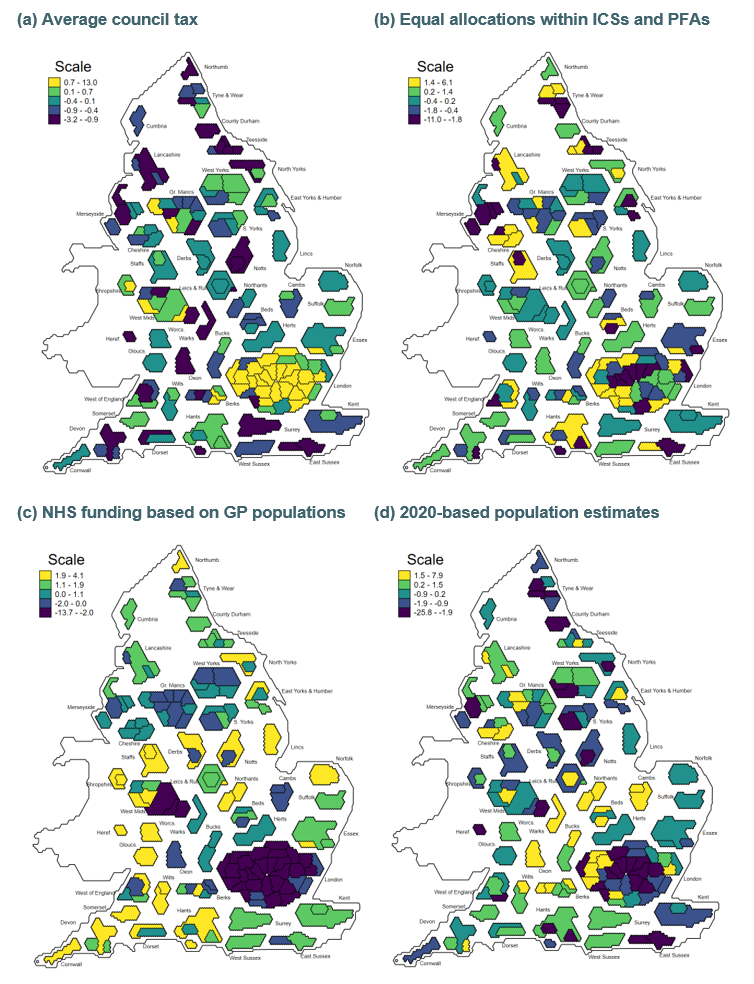
Note: Positive differences are areas which would have higher estimated funding under the alternative methodology than using our main estimation method.
Our third sensitivity check relates to the populations used for NHS funding. In our primary analysis, we use population estimates for 2022 based on ONS 2021-based population estimates for all services. However, in practice, NHS funding is allocated using GP registered populations. These differ from ONS populations in two ways. First, the total number of GP registrations in England is much higher than ONS population estimates: the NHS estimates there were 61.5 million GP registrations in 2022–23, compared to our ONS-based estimate of a resident population of 56.8 million. Second, the gap between GP registrations and ONS-based population estimates differs substantially between areas, with particularly large differences for some London local authorities. At the extreme, Hammersmith and Fulham had a GP registered population 83% higher than our ONS population estimates. In this alternative, we base the relative populations of different local areas on patterns in GP registrations, but rescale these so that the total population of England matches the ONS-based estimate. This means that average NHS funding per capita is the same as in our main estimates, but that the funding received by a specific area may be higher or lower, depending on the gap between their GP registrations and ONS-based population estimates.
Figure 2.6(c) shows the percentage change in funding per capita if we use these rescaled GP registered populations for per capita estimates of NHS funding, rather than ONS populations. We do not change the population estimates used for estimates of funding for other services. Figure B.5 in Appendix B shows the geographical distribution of NHS funding using GP registered populations, and Figure B.6 shows the relationship between these and our main estimates. This impact is typically greatest for areas of London, with Hammersmith and Fulham having 14% less NHS funding per capita based on GP registrations, and another 11 areas of London more than 5% less.
Finally, we examine the sensitivity of our results to our ONS population measures. Our primary analysis uses 2021-based population estimates, which reflect the 2021 Census. These are very different for some local authorities than the ONS’s 2020-based population estimates that were based on the 2011 Census. This likely reflects real changes in where people live over time, with the 2011 Census being nine years out of date by 2020, but may also have been influenced by the COVID-19 pandemic, which was ongoing when the 2021 Census was conducted. If the 2021-based figures underestimate the true population in an area, we will overestimate funding per capita in that area in 2022–23. Importantly, the funding allocations for areas in 2022–23 were determined before the government could have factored in these 2021-based estimates.
Figure 2.7 shows the distribution of the change in our measures of the resident population of areas when we use our main 2021-based rather than 2020-based estimates. For two-thirds of areas, the difference is between −2% and +2%. However, for a small minority of areas, the differences are substantial. Reading and Ealing are estimated to have populations which are 7.7% and 7.9% higher using our 2021-based estimates, meaning funding will stretch less far than the government might have planned based on earlier population estimates. At the other extreme, a small minority of areas, predominantly in London, have seen large falls in their estimated populations including Camden (−24%); Westminster (−25%) and Islington (−13%). This will make their funding per capita figures appear higher under our main estimates than if we used earlier estimates.
Figure 2.7. Difference in estimated total resident population in 2022–23, between 2020-based and 2021-based estimates
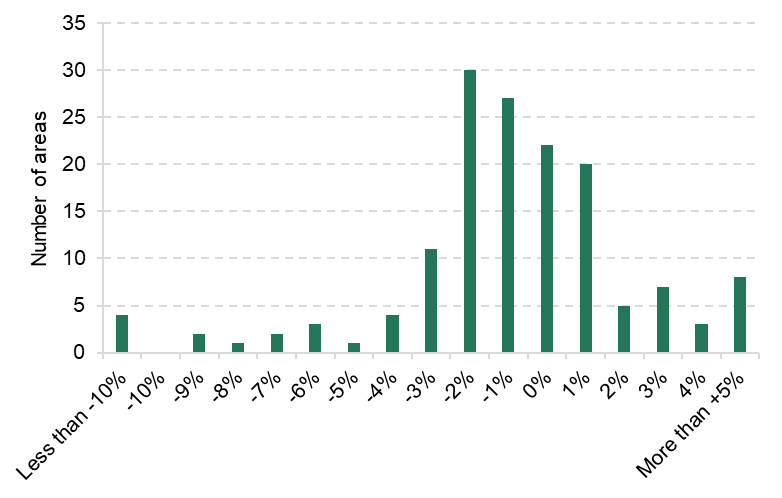
Source: Authors’ calculations using Office for National Statistics (2020a, 2022a).
As shown in Figure 2.6(d), and in Figure B.7, using 2020-based populations makes little difference to the overall distribution of funding, but it does significantly reduce our measure of total place-based funding for some of the areas we otherwise measure as being the highest funded per capita. In particular, Camden and Westminster move from being the second- and third highest funded areas to, respectively, 107th and 103rd out of 150 areas. At the other extreme, Reading moves from 147th under our main estimates to 102nd using 2020-based populations. This highlights the importance of population estimates for funding allocations to specific areas, and of ongoing ONS work to ensure its estimates of local authority populations are not distorted by temporary population movements associated with the COVID-19 pandemic and to improve the estimation of population changes at a local level between censuses. More timely data will allow funding systems to be more responsive to demographic changes.
Relationship between funding for different services
In this section, we examine the relationship between funding for each public service – do areas that receive more funding for one service typically also receive more funding for other services? In principle, we might expect funding for different services to be negatively or positively related or completely unrelated. Areas with younger populations may have higher school funding and lower NHS funding, and vice versa for areas with older populations – this would drive a negative relationship. And it may be that areas with higher socio-economic deprivation or higher costs of providing a service receive higher funding for all services – this would drive a positive relationship.
In practice, the relationship between funding across services is positive – areas with high funding for one service tend to also have high funding for other services. The correlation coefficient (a measure of the relationship between two variables) is positive for each pairwise combination of funding, as reported in Table 2.2. This means that if an area has higher than average NHS funding, it is also likely to have higher than average school, local government, police and public health funding. Note, though, that the correlations are not perfect – there are some areas with relatively high funding for one service and relatively low funding for another service. Per capita funding for schools and local government in particular is only weakly positively correlated, and this relationship is not statistically significant.
Table 2.2. Correlation between estimated funding per capita for different services
| NHS | Local government | Schools | Police |
Local government | +0.59 | – | – | – |
Schools | +0.37 | +0.07# | – | – |
Police | +0.56 | +0.48 | +0.49 | – |
Public health | +0.68 | +0.60 | +0.52 | +0.77 |
Note: Correlations are population weighted. All correlation coefficients are significant at the 1% level, except that between schools and local government funding (#), which is not statistically significant
(p = 0.37).
As an example, Figure 2.8 shows the relationship between NHS and local government funding per capita for each area. There is a clear positive relationship between the two levels of funding. For example, Camden has the highest local government funding (£1,331 per capita) and the fifth highest NHS funding (£2,696 per capita). At the other end, Milton Keynes has the third lowest local government funding (£666 per capita) and eighth lowest NHS funding (£1,915 per capita). Some areas do have relatively high funding for one service and relatively low funding for another. For instance, Solihull has the 27th highest NHS funding (£2,479 per capita) and the 12th lowest local government funding (£742 per capita).
Additional charts comparing funding for any two pairs of services are available on the online interactive tool provided on the IFS website.
Figure 2.8. Relationship between NHS and local government funding per capita
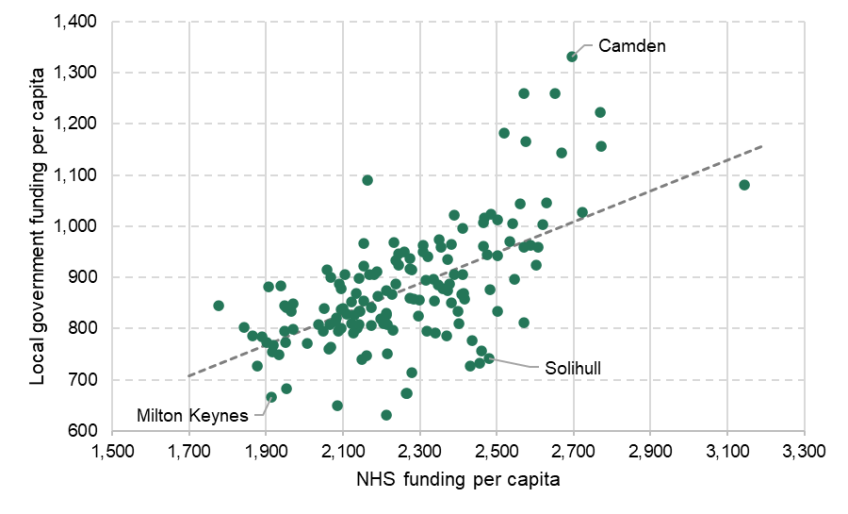
Note: Trend line is population weighted.
2.3 Which types of area receive more or less funding?
In this section, we examine which types of areas receive more or less funding, and focus on funding for each group relative to the national average for each service. Additional results on per capita funding are provided in Figures B.8 to B.20 in Appendix B.
Regional funding
We first examine regional differences in funding. Figure 2.9 shows the estimated funding per capita for each service relative to the national average. There are clear regional differences: London, the North West and the North East receive greater than average funding for all five services. Using our main estimates, London receives the highest total place-based funding, £4,734 per head, 9.9% above the national average. The South East, East Midlands and East of England all receive below-average funding for all five services. The South East receives the lowest total place-based funding, £4,038 per head, 6.3% below the national average. In the middle are the West Midlands and Yorkshire and the Humber, that receive above and below average funding for different services. For the West Midlands and Yorkshire and the Humber, the total place-based funding is 0.3% and 0.1% above the national average, respectively, while for the South West it is 6.1% below the national average.
Figure 2.9. Estimated funding per capita for each service by region, compared to the national average, 2022–23

As shown in Figure 2.10, some of these patterns by region are sensitive to the assumptions we make. In particular, using average councils tax rates increases total funding per capita in London from 10% to 12% above average, and reduces funding in all other regions. (The impact on local government funding is starker, as London moves from being funded at 3% above average to 16% above.) Allocating funding equally within ICSs and PFAs makes no difference to the regional patterns, as this reallocates funding between areas within regions. Using GP registrations increases average NHS funding slightly in the North East, reduces it in the South West and East Midlands, and moves London from receiving 8% above average to 1% below. Using 2020-based population estimates also reduces the extent to which London appears to receive more total place-based funding per capita than other regions, from 10% to 7% above average.
Figure 2.10. Estimated total funding per capita compared to the national average, by region, using different methods
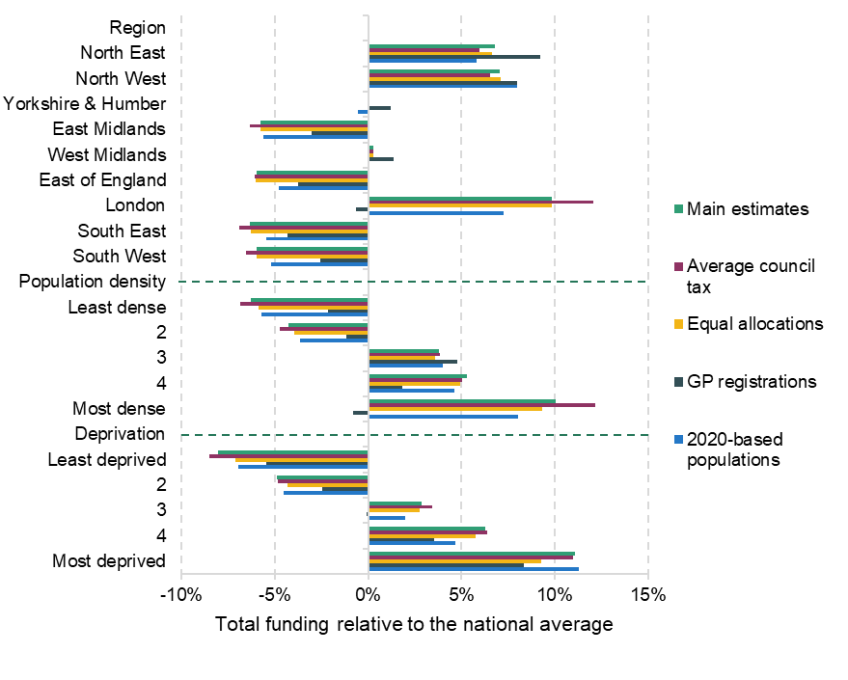
Note: Turquoise bars show our main estimates for average per capita funding in each region relative to the national per capita average. Other bars show estimates using alternative methods to estimate per capita funding in each local authority area.
Source: Authors’ calculations using Ministry of Housing, Communities and Local Government (2019) and Office for National Statistics (2022a) and ONS Standard Area Measurements (latest).
Funding by local area characteristics
We now examine funding by the characteristics of local areas. Figure 2.11 shows funding by population density quintiles. For each service, the green bar shows the average funding for the fifth of areas which are the least densely populated, while the orange bar shows the average funding for the fifth which are the most densely populated. Population density is here being used as a proxy for how rural or urban an area is.
Figure 2.11. Estimated funding for each service by population density quintile, compared to the national average, 2022–23

Note: Values are population weighted, but quantiles are constructed without population weighting, so that a fifth of areas (rather than a fifth of the population) are in each quintile.
Source: Authors’ calculations using Office for National Statistics (2022a) and ONS Standard Area Measurements (latest).
Funding for each of the five services increases with population density. This relationship is strongest in percentage terms for public health, where the lowest density quintile of local authorities on average receive 26% below the national average, compared with 44% above the national average for the highest density quintile. The weakest relationship is for local government, where the lowest density quintile on average receive 1% less funding than the national average, compared with 5% above the national average for the highest density quintile. Taken together, this means that total place-based funding is 6% below the national average in the lowest density quintile and 10% above the national average in the highest density quintile.
Figure 2.12 repeats this analysis for quintiles of socio-economic deprivation. This is measured using the government’s 2019 index of multiple deprivation (IMD). This captures deprivation across seven domains, including income, employment, health and education.
Figure 2.12. Estimated funding for each service by socio-economic deprivation, compared to the national average, 2022–23
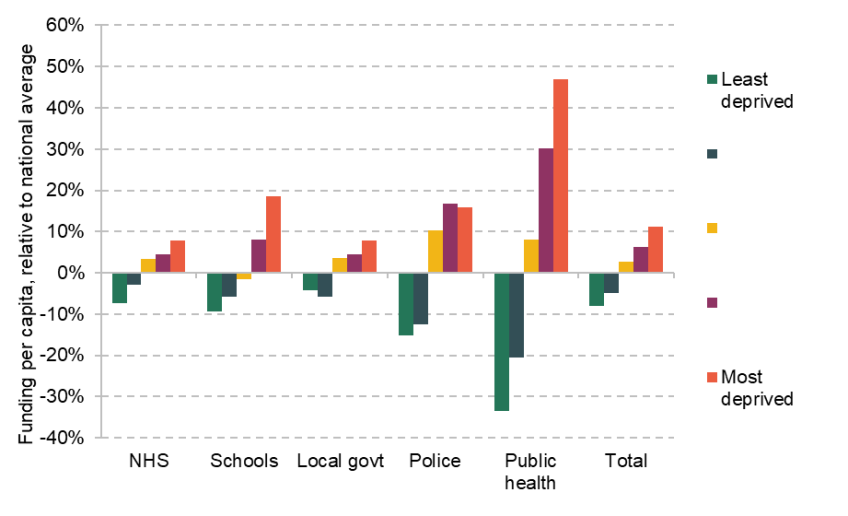
Note: Values are population weighted, but quantiles are constructed without population weighting, so that a fifth of areas are in each quintile.
Source: Authors’ calculations using Ministry of Housing, Communities and Local Government (2019).
As with population density, there is a strong positive relationship: areas with higher socio-economic deprivation tend to receive more funding for all five public services. The relationship is again strongest for public health and weakest for local government. Overall, the least-deprived fifth of areas receive 8% less total place-based funding than the national average, compared with those in the most-deprived fifth, which receive 9% more than the national average. Figure 2.13 also shows the clear positive relationship between socio-economic deprivation and total funding per capita. For example, Blackpool has the highest total funding (£5,648 per capita) and is the most-deprived local authority area on this measure. At the other end, Wokingham is the least-deprived area, and receives the third lowest funding (£3,703).
Deprivation is one important driver of spending needs, but is not the only determinant. We directly compare funding allocations to assessments of the relative spending needs of different areas in Section 3.2.
Figure 2.13. Total funding per capita by socio-economic deprivation
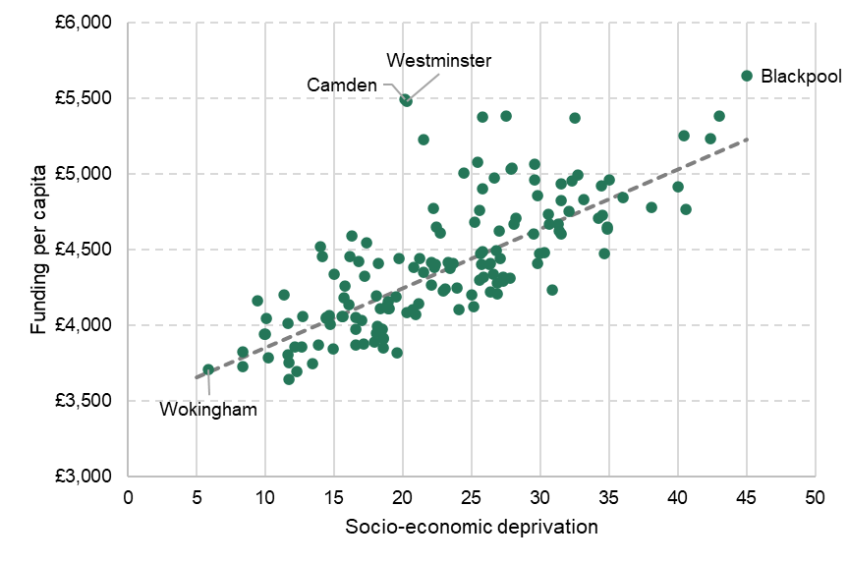
Note: Socio-economic deprivation is IMD 2019 average score, where higher scores are associated with greater deprivation. Trend line is population-weighted.
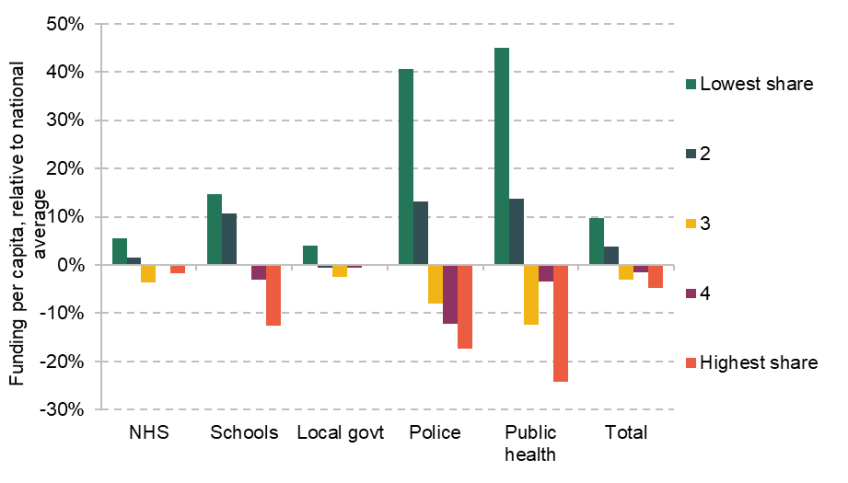
Figures 2.14 and 2.15 repeat this analysis for areas based on their age structure. The clearest relationship between funding and the share of the population aged 18 and under is for schools, with the highest per capita funding in areas with the highest proportion of the population aged 18 and under. This is fairly mechanical, reflecting higher school spending in areas with more school pupils, and there is no clear trend for any other services.Similarly, there is a negative relationship between school funding per capita and the share of the population aged 65 and over. This is expected given the strong negative correlation between the share of the population who are aged 65 and over and the share who are school age. Per capita funding for police and public health are both lower on average in areas with older populations.
Interestingly, NHS funding per capita is 2% lower on average in the fifth of areas where the greatest share of the population is aged 65 and over. This is despite the fact that more is typically spent on health services for older people, and the importance of age in determining NHS funding allocations to different areas. This may be explained by several factors. As shown in Figure B.13and Table B.1 in Appendix B, there is a weak negative correlation between the share of the population aged 65 and over and socio-economic deprivation. Areas with a higher share of older people are also typically less affected by differences between ONS populations and GP registrations, as shown in Figure B.14, and also tend to have below-average costs of delivering services.
Figure 2.14. Estimated funding for each service by share aged 18 and under, compared to the national average, 2022–23

Note: Figures are population weighted, but quantiles are constructed without population weighting, so that a fifth of areas are in each quintile.
Figure 2.15. Estimated funding for each service by share aged 65 and over, compared to the national average, 2022–23
Note: Figures are population weighted, but quantiles are constructed without population weighting, so that a fifth of areas are in each quintile.
Results for an additional range of characteristics are available in Appendix B. These show:
- Areas with lower healthy male life expectancy have higher per capita funding across all services, with the lowest fifth of areas receiving 7% more total funding per capita than the national average, and the fifth of areas with the highest life expectancy receiving 7% below average. This amounts to a difference in average per capita funding of £703.
- This is particularly pronounced in percentage terms for public health funding, where the figures are +46% and −29%, a difference of £45 per capita. Measures of mortality rates adjusted for the age and gender composition of the population factored heavily in the formulae that allocated public health funding between areas in 2014–15, although these have not been subsequently updated.
- In cash terms, the greatest difference is seen in NHS funding, which is £285 per capita higher on average in the fifth of areas with the lowest male life expectancy than the highest.
- Very similar patterns are seen for healthy female life expectancy, the ONS Health Index (which aims to capture a broad definition of health; Office for National Statistics, 2020) and a survey-based measure of average life satisfaction. This is as expected, given the very high positive correlation between these different measures of well-being, and their strong negative correlation with area deprivation.
- The fifth of areas with the lowest school attainment – measured as the average Attainment 8 score of KS4 pupils – on average receive £310 (7%) more total per capita funding than the national average. This is largely driven by high NHS funding (£160 per capita above average), although these areas do also receive above-average school funding (by £65 per capita, or 8%). The exception to this pattern is police funding, which is 16% above average in the fifth of areas with the highest KS4 attainment; this reflects high average police funding and high school attainment in London.
- Per capita funding for schools, police and public health are negatively correlated with the share of the population reporting their ethnic group as White at the 2021 Census, and these are notably highest in the fifth of areas with the lowest proportion (with funding 19%, 37% and 34% above average, respectively). Of the areas in this most ethnically diverse group, 22 of 30 are in London, and the others are the most densely populated areas outside London, notably in the West Midlands. There is a less clear pattern by ethnicity for NHS and local government funding; the latter is highest (5% above average) in the fifth of areas where the highest share of people report that their ethnicity is White.
3. How does funding compare to estimated needs?
In the previous chapter, we examined place-based funding for five public services and showed that there were substantial differences in funding across services, regions and by characteristics of local areas. However, it is difficult to assess whether these differences are ‘fair’ without understanding the patterns of need for services. In this chapter, we examine the distribution of estimated spending needs and compare these to relative funding levels. In the first section, we explain how we assess spending needs and show the resulting distribution of relative needs. In the second section, we examine how funding and need compare across places. In particular, we compare the share of total national funding an area received for a service with the funding it would have received had funding for that service been allocated to areas in line with their relative estimated spending needs. In the third section, we examine which types of areas receive higher or lower shares of funding than their shares of estimated need across multiple services, to answer the question: do some areas appear systematically disadvantaged by funding allocations across multiple public services?
Throughout this section, we only examine NHS, local government, police and public health funding. This is because the government does not produce needs assessments for school funding that we can update and use for comparisons of funding to needs.
3.1 Patterns of estimated spending needs
How do we estimate need?
In estimating relative spending needs for each public service, we start with the government’s own latest needs assessments. These are typically based on estimated relationships between the characteristics of areas and their populations and demand for specific services, and also factor in estimated differences in the costs of delivering services in different places. They are intended to measure the relative differences in funding required to deliver the same range and quality of services across areas or (in the case of health) to reduce inequalities between areas.
The needs assessments for the different services do this in different ways, as described in
Table 3.1. All then make some adjustment for differences in the costs of delivering services in different areas. Our earlier report contains a fuller description of the approaches taken to estimating needs, and the issues with these (Ogden et al., 2022).
Table 3.1. Summary of approaches to needs assessments for different services
Service | Approach | Example needs drivers | Geographical level | When produced |
NHS | Estimated relationship between past healthcare usage and individual and local characteristics (‘utilisation models’); explicit adjustment for reducing unmet need and inequalities | Age-gender groups; avoidable mortality; deprivation; benefit receipt; prevalence of severe mental illness; proportion of those aged 70+ claiming disability living allowance | Integrated Care System | December 2021 |
Local government | Formulae based on estimated and assumed relationships between needs and local characteristics | Children in out-of-work families; benefit receipt; over-65s in rented accommodation; road lengths; daytime population; population density; population sparsity | Upper- and lower-tier local authority | 2013–14 |
Police | Formulae based on estimated and assumed relationships between crime and local characteristics | Bars per hectare; population density; students; unemployment amongst males aged under 25; overcrowded housing | Police Force Area | 2013–14 |
Public health | Formulae based on estimated relationships between demographics (age and sex), local area characteristics and service usage | Age–gender groups; children in poverty; standardised mortality rate under 75; sparsity | Upper-tier local authority | 2016–17 (although never used) |
However, as we discussed in detail in that earlier report, these needs assessments are often significantly out of date – as is the case for local government, police and public health. For the NHS and police, these assessments were produced for geographies other than local authorities. This means that we must update some needs assessments, and for some services we must change the geography of the assessments. In this section, we describe this process briefly. Appendix A contains a full description of our methodology and the data used.
In the case of local government and public health, needs assessments are produced at the local authority level, but are now significantly out of date. For local government, the latest official needs estimates are for 2013–14, although much of the data used are older, from the 2011 or even 2001 censuses. For public health, the latest official needs estimates are for 2016–17, although these were never used in practice. Instead, funding allocations have been largely rolled over from year-to-year since 2014–15, when funding was based partly on needs assessments updated in that year. In both cases, we update the most recent available official needs assessments to reflect the latest publicly available data on the characteristics of local areas, and where we cannot update data, we use the values used in the original assessments. We do not change the weights on each characteristic, or the weights placed on different parts of the formulae.
For local government, we are often able to use data from the 2021 Census or measures of benefit receipt from 2022, although some updates are from Census 2001 to Census 2011. Full details of the variables included in each part of the local government needs formulae, which we have been able to update, and resulting changes in needs assessments are presented in Table A.4 in Appendix A. Overall, estimated relative local government spending needs change significantly in many areas, but this does not seem to relate to existing per capita needs; it is not that areas previously assessed to have higher per capita needs have become more or less ‘needy’ on average. In particular, estimated relative needs increase as a result of the updates in most outer London boroughs, and fall in many areas in the North East and South West of England. These changes will reflect a combination of differences in population growth (including for subgroups of the population, such as those aged 18 and under) and other socio-economic characteristics. Reweighting needs formulae to reflect the change in the shares of councils’ spending on different service areas between 2013–14 and 2022–23 would typically increase estimated relative needs in outer London boroughs and further reduce them in the North East and South West, although we do not make this adjustment in our main analysis.
For public health, we are only able to update information on the size of the local population, and their age and gender mix, and we update these from 2016 to 2022. Together, these explain around 60% of the total variation in per capita need. Our estimates of relative needs for public health funding change relatively little as a result of these updates, with the largest increases for Havering (5%), Knowsley (3%) and Central Bedfordshire (3%), and the largest decreases for Richmond upon Thames (−5%) and Herefordshire (−4%).
For the NHS, needs assessments are up to date, and we use the needs assessments produced for 2022–23 funding allocations. However, these needs assessments are at the ICS level, rather than the local authority level. These needs are primarily estimated using GP practice and lower-tier local authority coefficients multiplied by the ICS population structure. We instead apply these coefficients to local authority populations. Where necessary, we take ICS-wide estimates of need or characteristics and apply them equally to all local authorities within each ICS.
For police, needs assessments were last produced for 2013–14 for PFAs, and these are similar to local government formulae. We apply the formula to more up-to-date local authority data, using values from the original assessments where we cannot update data. We do not change the weights on each characteristic, or the basic funding per head amounts. A few areas do see relatively large changes in their estimated per capita need as a result of updating the data – such as Merseyside (−7.5%) and Surrey (+6.5%) – although these changes are typically smaller than for local government. This reflects the fact that most area characteristics we update are strongly positively correlated with their 2013–14 values.
For all services, estimates of relative needs also reflect differences in the costs of delivering services in different parts of the country. Where these ‘area cost adjustments’ are applied separately, we have not adjusted these, as we do not have good data to estimate changes in labour and property costs at a local level. Some area characteristics in the local government needs formulae are related to the costs of service delivery, rather than demand. For instance, this includes population sparsity, which increases travel time between adult social care home visits. We have updated these where possible.
The distribution of estimated spending needs
We now examine the distribution of estimated spending needs. We express spending needs in pounds per capita terms, but caution should be used when interpreting these needs estimates. The official needs assessments only estimate relative need – for example, one area needs 10% more NHS funding than another area. We calculate the per capita need figures as the funding each area would receive if the existing total national funding for each service was allocated between areas based only on their shares of estimated needs.
Further, like our estimates of funding, these per capita figures use our estimates of the resident population of each area in 2022. The daytime population of each area – reflecting commuting flows across local authority boundaries and the numbers of tourist visitors – is also relevant for police and some local government services, and enters into these needs formulae. This will increase needs (and funding levels) per head of resident population in areas with many inward commuters, such as Westminster, Manchester, Nottingham and Newcastle.
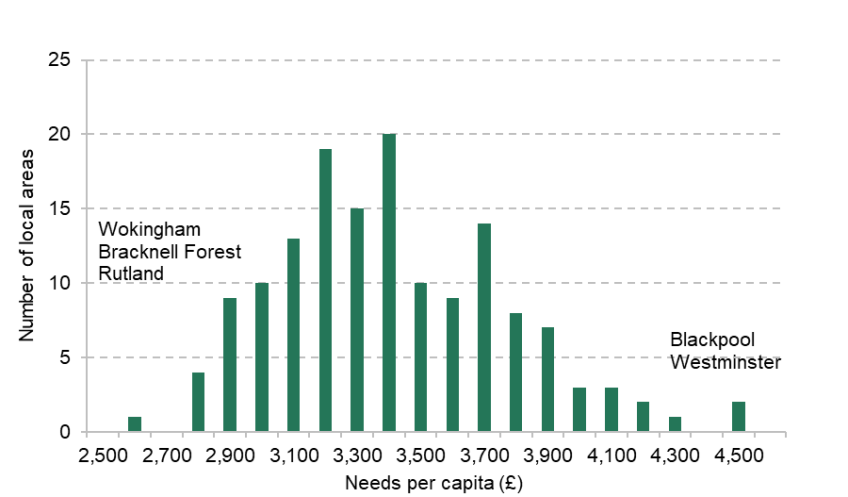
Figure 3.1 shows the distribution of estimated spending needs per capita for each service. Reflecting the total funding levels for different services in 2022–23, our estimated NHS needs are highest, ranging from £3,094 per capita in Blackpool to £1,860 in Wokingham. Next is local government, ranging from £1,671 per capita in Westminster to £583 in Wokingham. Needs for police funding range from £671 in Westminster to £138 in Rutland, while public health needs range from £117 in Middlesbrough to £32 in Rutland. These ranges can be understood as the variation in per capita funding across areas that would be expected if funded was allocated to areas based only on their relative estimated needs. The figure also shows the estimated levels of funding in each spending area. The range of estimated NHS funding levels is wider than the range of needs, and the reverse is true for local government.
Figure 3.1. Distribution of estimated needs per capita for each service area in 2022–23
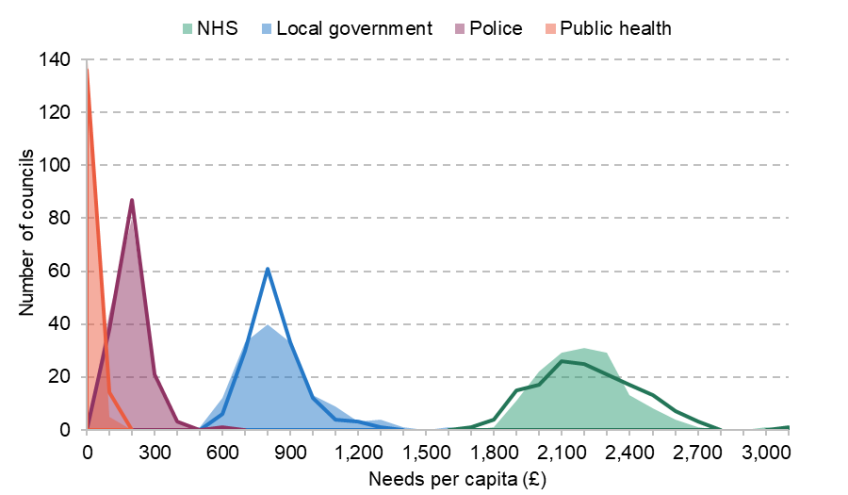
Note: Shaded areas show the distribution of estimated needs. Lines show the distribution of funding levels for the same services, as shown in Figure 2.3.
Figure 3.2 shows the distribution of total estimated spending needs per capita, summing up across the four services where we have needs assessments. This ranges from £2,643 per capita in Wokingham to £4,599 per capita in Blackpool (74% more).
Figure 3.2. Distribution of total per capita place-based estimated needs in 2022–23
Note: Funding each area would receive if the existing total national funding for each service (except schools) was allocated between areas based only on their shares of estimated needs.
Figure 3.3 shows the geographical distribution of estimated need for each service. Estimated needs for NHS funding are highest in the North East and North West of England, and lowest in the commuter belt around London. Geographical patterns for local government, police and public health are fairly similar to each other, with the highest estimated per capita needs in inner London and urban areas in the Midlands and north of England, and the lowest in more rural areas. This can also be seen in Table B.2 in Appendix B, which shows that needs for all four services are positively correlated. However, per capita relative needs for police funding are highly correlated with relative needs for local government funding (+0.91) but only weakly correlated with relative needs for NHS funding (+0.13).
Across all services, there is a strong and highly significant positive correlation (+0.80) between estimated needs and the socio-economic deprivation of an area, as shown in Figure 3.4. Deprivation explains around two-thirds of the variation in estimated per capita needs, suggesting other factors are also important. These factors vary by service area. For instance, there is little relationship between population density and estimated need for NHS funding, whereas there is a strong positive correlation for other services. Further analysis of per capita needs for different services by area characteristics is possible using the online tool.
Figure 3.3. Estimated need per capita for each service area, 2022–23
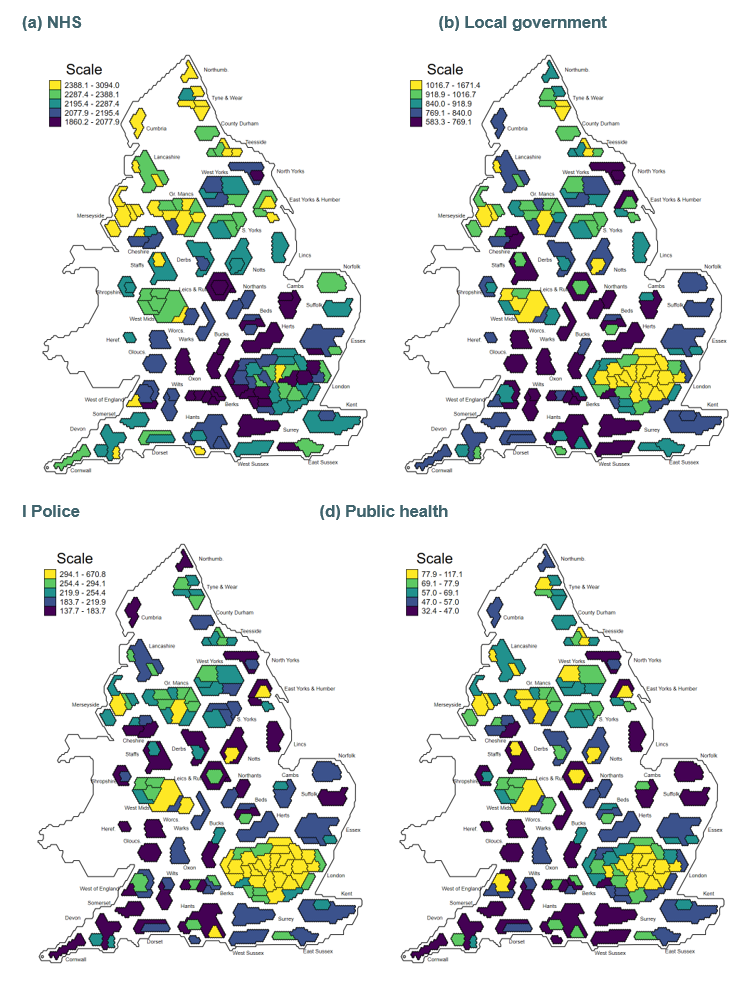
Figure 3.4. Estimated per capita need for all services (except schools) and deprivation

Note: Trend line is population weighted. Socio-economic deprivation is measured by the average score from IMD 2019. A higher score indicates a more-deprived area.
3.2 Comparison of funding with relative needs
In this section, we compare the shares of funding we estimate each area receives with its share of total assessed needs. We refer to this as the ‘gap’ between shares of funding and shares of needs. Our focus is on how far geographical allocations of funding matched relative patterns of needs in 2022–23, based on the latest published government assessments and the most up-to-date public information on how drivers of needs may have changed since those assessments were made. As we reflect in the discussion below, these patterns reflect decisions made by governments during the 2010s over how funding should be allocated between areas.
It is not necessarily the case that all areas should receive the exact share of funding they are assessed to need. There are many other legitimate objectives of funding systems, and trade-offs between these, as discussed more fully in our earlier report (Ogden et al., 2022). For instance, funding systems may be designed to provide local policymakers with discretion over how much is spent on different services, or with financial incentives to deliver particular outcomes, or to minimise year-on-year changes in funding to aid more efficient service provision. However, if there are large differences between the shares of funding and shares of estimated needs across areas, we would expect these to contribute to inconsistencies in the level and quality of public services that can be provided to people in different areas. If public services are important for shaping life outcomes, these gaps could contribute to geographical inequalities.
There are two ways of expressing gaps between shares of funding and estimate needs. The first is in percentage terms. An area that has a +5% gap receives 5% more funding than if total funding were allocated between areas in line with relative assessed needs, while an area that has −5% gap receives 5% less funding than its share of needs. We can also express these in absolute or cash terms per head of population. An area with a +£100 gap receives £100 more funding per capita than based on its share of assessed needs, while an area with a −£100 gap receives £100 less funding per capita than it would based on its share of assessed needs.
The distribution of funding relative to need
We first examine the distribution of funding relative to need. We begin by plotting per capita funding and estimated needs for each service, as shown in Figure 3.5. If every area received the same share of funding as its share of estimate needs, all the points would lie on the 45 line. In practice, many areas receive very different shares of funding to their share of estimated needs, and this appears starkest for local government and public health.
Figure 3.6 shows the distribution of the gaps between shares of funding and needs in percentage terms for each of the four public services where we have assessments of areas’ relative spending needs.
There are large differences in distributions between services. For the NHS, the range of gaps between shares of funding and needs is the smallest, ranging from −9% in Swindon to +19% in Westminster. NHS funding therefore appears relatively well targeted, with 103 out of 150 local authorities having shares of NHS funding within 5% of their shares of estimated spending needs. This reflects that NHS funding is allocated to areas based on relatively up-to-date needs assessments. Remaining gaps reflect the impact of pace-of-change rules which restrict year-on-year changes in funding, and that funding is allocated based on GP registered populations, which differ from the ONS’s latest population estimates – an issue we discuss further below.
Figure 3.5. Funding and estimated needs, £ per capita, by service
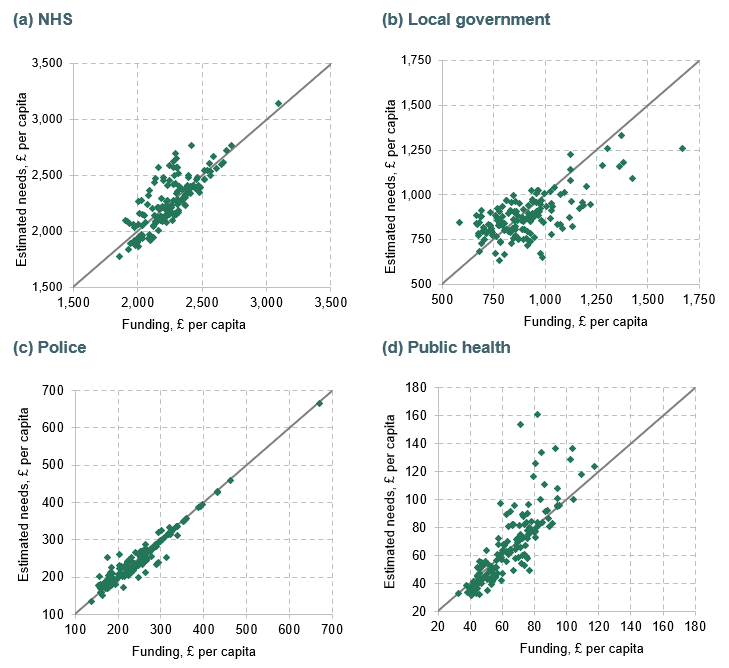
For local government, the distribution of gaps is much wider, ranging from −34% for Wandsworth to +45% for Wokingham. Only 39 out of 150 local authority areas received shares of local government funding within 5% of their shares of estimated needs. This is largely because the funding system for local government has largely broken down, with estimates of relative needs now only playing a relatively small part in how local government funding is allocated. As explored in our earlier report, choices made around grant funding during the 2010s meant larger relative cuts in local government funding in areas with higher estimated spending needs. Other objectives – such as creating financial incentives for councils to deliver particular outcomes – also play a larger role in how local government is funded than for other services.
Figure 3.6. Distribution of gap between shares of funding and estimated needs for each service area, 2022–23

For police, the range is somewhat smaller than local government, ranging from −19% for all West Midlands local authorities to +43% for Cumbria. 88 out of 150 local authorities received shares of police funding within 5% of their share of estimated needs. Finally, for public health, the distribution is widest, ranging from −35% for Slough to +116% for Kensington. Only 40 out of 150 local authorities received shares of public health funding within 5% of their share of estimated needs. These substantial gaps reflect that the 2016–17 needs assessments that we compare funding to have never been used to allocate public health funding. Instead, relative funding allocations have been largely frozen since 2015–16, with all areas seeing equal year-on-year percentage changes in their public health grant. The government has prioritised funding stability, rather than closing existing gaps between shares of funding and needs, and has chosen not to reallocate public health funding away from areas which have for many years been receiving much more than their share of estimated needs.
The different sizes of the services mean the distribution of gaps between shares of funding and needs is quite different when expressed in cash terms. Because the NHS and local government receive much more funding than police and public health, smaller percentage gaps for the NHS and local government result in much larger cash gaps. Figure 3.7 shows the distribution of gaps in cash terms. The largest ranges are for the NHS and local government, while police and public health have relatively small ranges. 99 out of 150 local authorities received NHS funding within £100 per capita of their share based on estimated spending needs, as do 99 local authorities for local government. No local authority received funding more than £100 per capita away from their share based on needs for either police or public health.
Figure 3.7. Distribution of cash gaps between shares of funding and estimated needs for each service area
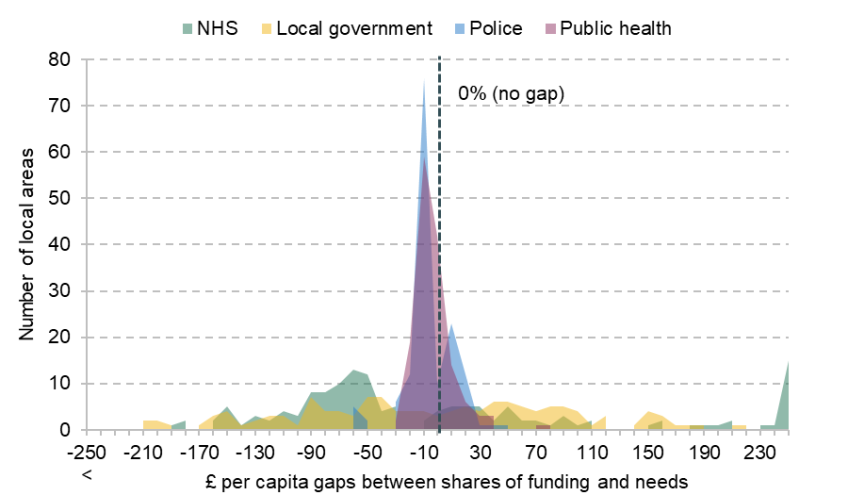
Figure 3.8 shows the geographical distribution of gaps in percentage terms for each of the four public services with needs assessments. Areas in yellow received a greater share of funding in 2022–23 than their share of estimated needs, and areas in dark blue received less. Again, these differences between funding and need are relative rather than absolute. We do not take a view on whether the overall level of funding for a service is appropriate, only whether, based on their estimated relative spending needs, areas are funded so as to deliver comparable levels of service to other areas.
For the NHS, areas in London receive much more funding than their share of needs, typically more than 5% more, with areas across swathes of the South West and the Midlands receiving more than 4% less. As discussed below, this largely reflects differences between ONS and GP registered population estimates. For local government, these patterns are reversed, with London, the West Midlands and Manchester receiving much less funding than their share of estimated needs, and areas in the London commuter belt receiving more. Police funding is furthest below estimated needs for the West Midlands (−19%) and Greater Manchester (−8%) PFAs, with the most positive gaps in rural areas with relatively old populations. Geographical patterns for public health funding are less immediately obvious.
Figure 3.8. Estimated percentage gaps between shares of funding and shares of needs for each service area 2022–23

How robust are these patterns to our choice of methodology?
In this section, we examine the sensitivity of our estimates to some key assumptions we have made. This helps to explain some of the reasons for gaps between shares of funding and needs.
In particular, the fact that London receives smaller shares of local government and police funding than its shares of need may be less concerning if these gaps reflect choices local policymakers have made to set lower council tax levels than in other parts of the country, reducing both funding for services and residents’ council tax bills. Figure 3.9 shows the gaps if we instead estimate funding based on each area’s notional council tax revenues, if their council tax levels were equal to the national average. This makes little difference to overall geographical patterns for local government, except for some inner London boroughs which set council tax levels far below the national average. In particular, Hammersmith and Fulham, Wandsworth and Westminster are all estimated to receive more than 20% less funding than their share of needs in our main estimates but would receive respectively 5%, 13% and 19% more than their share of needs if their council tax levels were set at the national average. On average, using notional council revenues shifts areas in London from a gap of −17% to −7%, and means all other regions receive less funding, with areas in the North East receiving 5% less than their share of needs on average.
Figure 3.9. Estimated percentage gaps between shares of funding and need in 2022–23, if all set the average council tax level
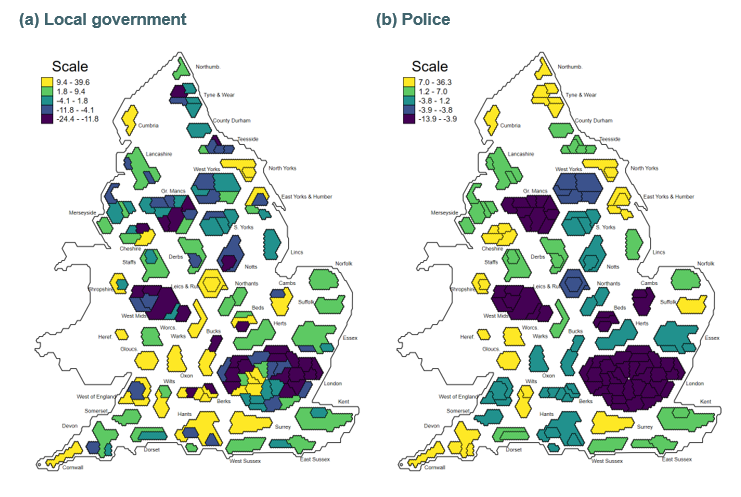
In contrast, low average council tax levels do not fully explain the low police funding relative to needs for the West Midlands and Greater Manchester, which would still have gaps of −14% and −7% if they set their council tax levels to the average.
We also consider an alternative way of distributing NHS and police funding between areas within the same ICSs or PFAs. By construction, the gaps in our main estimates are being driven only by ‘misallocations’ of funding relative to needs at these higher-level geographies, as we assume funding is distributed within them in proportion to our estimates of relative needs. Even if local policymakers allocated funding within their areas on an equal per capita basis – without any respect to the differences in per capita relative needs within their areas – this would do very little to overall patterns, as shown in Figure B.21.
NHS funding is allocated between areas based on GP registered populations, rather than the ONS population estimates we use to form our main per capita funding estimates. If we instead estimate per capita NHS funding using GP registered populations rescaled to match our ONS-based total population, gaps between shares of funding and need narrow considerably, and range between −5% and +11%, compared to −9% to 19% in our main estimates. The number of areas receiving funding within 5% of their share of needs increases from 103 to 139 out of 150. This narrowing of gaps is shown in Figure 3.10, and in Figure B.6. This suggests much of the apparent ‘misallocation’ of NHS funding relative to needs can be explained by the use of population estimates to allocate funding which differ substantially from official population estimates. Biases in GP registered populations are particularly important for areas in London, which receive 3% more funding than their share of needs on average using this alternative measure of funding, compared to 11% in our main estimates.
We also consider the impact of using 2020-based population figures, instead of those based on Census 2021, to estimate per capita funding and needs levels. Using the 2020-based estimates perhaps provides a fairer test, given that estimates based on Census 2021 had not yet been published when the government determined 2022–23 funding allocations.
Figure 3.10. Relationship between NHS funding and share of estimated needs, if using GP practice registrations or ONS populations
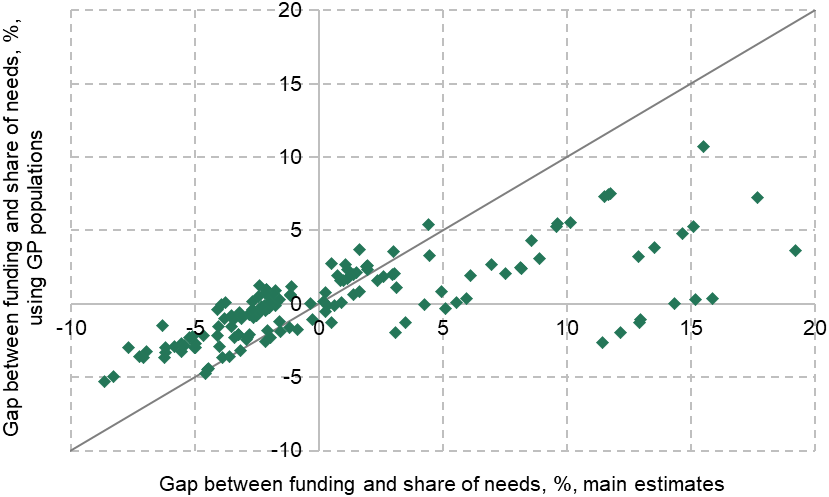
As shown in Figure B.7, overall geographical patterns are robust to this choice. However, as discussed in Section 2.2, using these older population estimates reduces per capita funding in areas which had larger estimated populations before than after the census. Again, this has a particularly stark impact on some specific areas in London. The region moves from receiving 11% more than its share of needs for NHS funding to 8% more on average, and from receiving 17% less local government funding to 19% less. The reverse happens for Ealing, which had a smaller estimated population in 2020, and moves from receiving 14% more than its share of needs for NHS funding to 23%, and from receiving 25% less than its share of needs for local government to 18% less.
For further analysis of the gaps for different services, under each method, and how this varies with local areas characteristics, see the online tool. This allows you to compare directly patterns and results for specific areas across different services and alternative approaches.
Relationship between funding gaps for different services
In Chapter 2, we showed that there was a positive relationship between levels of funding across services. This meant that areas with higher funding for one service also on average received higher funding for all other services. But another important question is whether areas that receive less funding than their share of estimated needs for one service area also receive less for other services. This could suggest that certain areas are disadvantaged across a range of public services.
In general, it is not the case that the same areas receive funding above or below estimated needs for all services. For some pairs of services (e.g. police and local government), there is a positive relationship between gaps – so areas that receive more funding than their share of estimated needs for police also tend to receive relatively more for local government. But for some other pairs of services (e.g. the NHS and local government) there is a negative relationship. A full correlation table is available in Table B.3.
Figure 3.11 illustrates this negative relationship between gaps between funding and estimated needs for the NHS and local government – the two largest services we are able to look at. Other services can be compared using the online tool. Westminster receives the largest amount more than its share of estimated needs for the NHS (£414 per capita) but also receives the least relative to its share of estimated needs for local government (£411 less per capita) – although note that figures for Westminster are particularly sensitive to our assumptions around council tax and population estimates. At the opposite extreme, East Riding of Yorkshire receives £144 per capita less than its share of estimated spending needs for the NHS but £155 more for local government.
Some areas have positive or negative gaps for both services. For example, Dudley receives £127 per capita less than its share of estimated needs for the NHS and £122 less for local government.
Figure 3.11. Gaps between shares of funding and needs for NHS and local government, £ per capita

However, there are a few important points to note here. First, cash figures are based on total national funding for the services in question. A cash gap for local government services will be a larger percentage gap than the same cash gap for the NHS, for which overall funding is higher. Secondly, a positive difference for one service does not ‘balance out’ a negative gap for another service as, under current funding arrangements, funding cannot be easily transferred between services at a local level. East Riding of Yorkshire council could not easily top up funding for NHS services for its residents even if it wanted to. There may be some spillovers if, for instance, better-funded adult social care services are able to reduce pressures on the NHS, but gaps for individual services are likely to have the most direct impact on the delivery of local services. Thirdly, these figures are predicated on existing government estimates of relative needs, updated with new data, although these may not reflect the true underlying patterns of needs across the country.
We can also examine more directly to what extent areas have gaps between their funding and their share of needs across multiple services. Table 3.2 shows the number of local areas which receive less or more funding than their share of needs across a certain number of services. Again, these services differ in size, so that a given percentage gap for public health will equate to a much smaller gap in per capita terms than the same percentage gap for the NHS.
Table 3.2. Number of areas which receive funding a given distance from their share of estimated needs across a certain number of services
Number of services | Has a negative gap (funding less than share of needs) | Funding at least 2% below share of needs | Funding at least 5% below share of needs | Funding at least 5% above share of needs |
0 | 7 | 10 | 35 | 35 |
1 | 22 | 50 | 72 | 66 |
2 | 50 | 62 | 41 | 43 |
3 | 59 | 23 | 2 | 6 |
4 | 12 | 5 | 0 | 0 |
The second column shows that seven local authorities did not have funding below their share of needs for any services. At the other end, 12 local authorities received less funding than their share of needs for all four services. The third column shows that five areas received more than 2% less than their share of funding for all four services. These are Kirklees, Leicester, Luton, Southend-on-Sea and Walsall. The fourth column shows that no area received more than 5% less than its share of needs across all four services. However, two areas are in this position for three out of four services: Coventry (all services except the NHS) and Dudley (all services except public health).
The fifth column shows that no areas receive significantly more funding than their share of needs across all four public services. However, six local areas receive at least 5% more funding than their share of needs for three out of four services. These are Darlington (all services except the NHS), Herefordshire (all services except local government), Kingston upon Thames (all services except the police), Richmond upon Thames (all services except the police), Torbay (all services except the NHS) and Worcestershire (all services except the NHS).
Another measure of overall misallocation would be the sum of per capita gaps across multiple services. Summing up funding and assessed spending needs across services produces a single figure for the gap between total place-based funding and the funding an area would receive if the total funding for each service nationally was allocated in line with relative estimated needs. This measure has an important limitation. As funding is not transferrable between services within a local area but gaps for the two largest services are negatively related, this measure will understate the total misallocation of funding because positive and negative gaps for different services will appear to offset in many areas. It also gives more weight to larger services (i.e. the NHS), whereas the previous approach of using counts gave each service equal weight.
Nonetheless, this measure may highlight areas which have sizeable gaps across several services. It also provides an indication of how much total funding would need to be reallocated between areas (as opposed to across services within local areas) if funding for all services was to be allocated in line with relative needs. This may be particularly interesting from the perspective of levelling up.
Figure 3.12 shows the distribution of this total place-based gap between funding and needs in percentage terms. Overall, 128 out of 150 local authorities receive total place-based funding within 5% of their share of total needs, and no areas have a total gap of more than 11% in either direction. At the extremes, Richmond upon Thames receives 10.2% more total place-based funding than its estimated share of total needs, while Dudley receives 8.2% less. Figure 3.13 repeats this analysis in cash terms. At the extremes, Camden receives £408 per capita more funding than its share of estimated needs, while Dudley receives £286 per capita less. Figure 3.14 shows the geographical distribution of this total place-based funding gap measure.
Figure 3.12. Distribution of gap between total place-based funding and total funding if allocated based on estimated needs, %
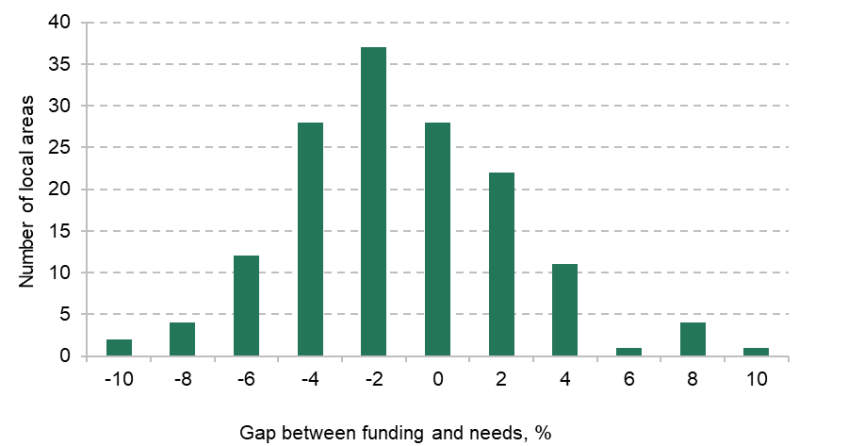
Note: Includes NHS, local government, police and public health.
Figure 3.13. Distribution of gap between total place-based funding and total funding if allocated based on estimated needs, £ per capita

Note: Includes NHS, local government, police and public health.
Figure 3.14. Percentage gap between total place-based funding and total funding if allocated based on estimated needs
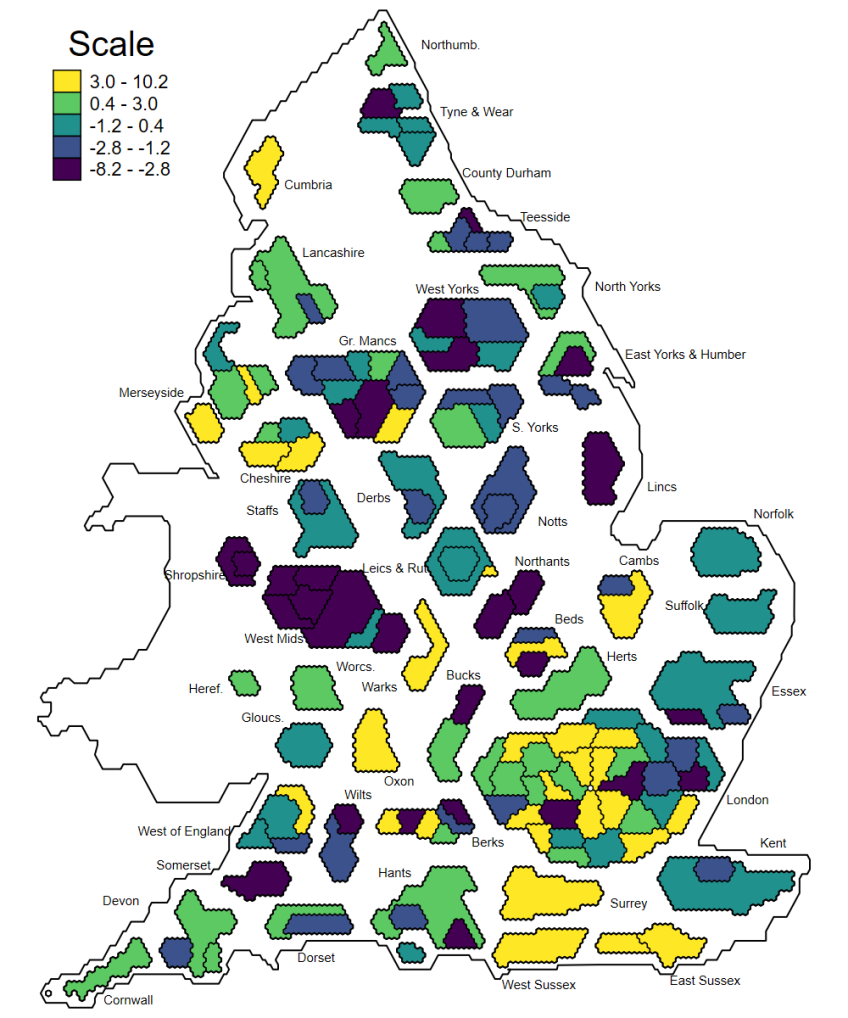
3.3 Which types of area face relative funding gaps across many services?
In this section, we examine how gaps between funding and shares of estimated needs for each service differ by local area characteristics. Throughout this section, we focus on gaps in percentage terms, as this allows a clearer comparison between services.
Figure 3.15 shows the average gap between shares of funding and needs for each service by region. Regional patterns are quite different across services. For example, London receives 11% more NHS funding than its share of estimated needs, and 6% more for public health, but 17% less for local government and 1% less for police. The opposite patterns hold in the South East. On average, areas in the West Midlands receive less funding than their share of estimated needs for all services other than public health, meaning the region receives 3% less total place-based funding than if funding for each service was allocated to reflect relative estimated needs. On average, areas in the North West receive slightly more funding than their share of estimated needs for all services (by 1% overall). This is despite some areas in the North West receiving significantly less than their share of estimated needs for some services, such as Manchester receiving 23% less local government funding and Cumbria 26% less public health funding than their share of estimated needs.
Figure 3.15. Difference between funding and share of estimated needs, by region
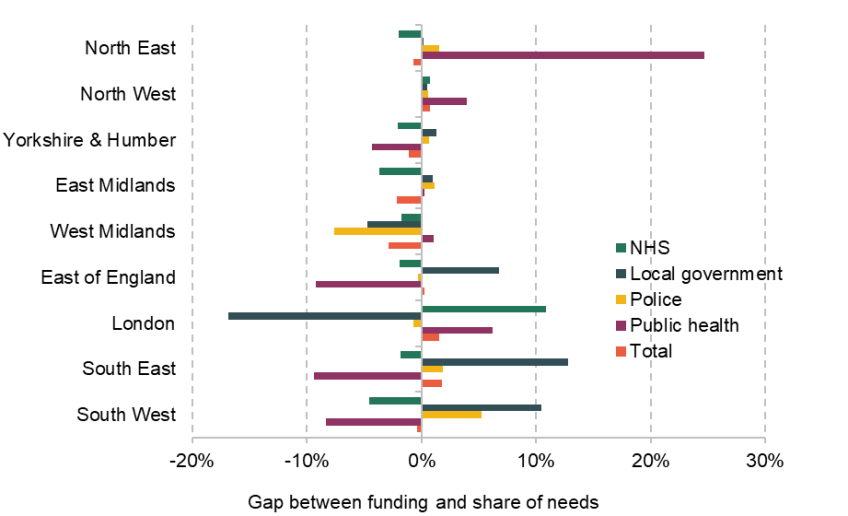
Note: An area with a positive value has a higher share of funding than their share of assessed need.
Overall, areas in the South East receive 2% more total funding and those in the West Midlands 3% less than if funding for each service was allocated in line with estimated needs. As shown in Figure B.25, some of these regional patterns are robust to alternative methods. The West Midlands in particular receives at least 2.4% less funding than its share of needs across all our alternative estimates. In contrast, estimates for London are particularly sensitive to the assumptions we make. Under our main assumptions, London receives 1.5% more total funding than its share of estimated needs, but 4% more if we use notional council tax revenues, and 3% less if we use GP registrations to estimate NHS funding per capita, and 1% less if we use 2020-based population estimates. The latter two results suggest that the apparent relative overfunding of London’s public services relative its share of estimated needs is due to differences in the population figures used to allocate funding and the ONS’s latest figures.
Figure 3.16 shows the average gap between shares of funding and estimated needs for each service by quintile of socio-economic deprivation. For local government and police services, there is a clear relationship between relative funding gaps and deprivation, with the most-deprived fifth of areas on average receiving 9% (£92 per capita) less local government funding than their share of needs and 6% (£17 per capita) less police funding. The least-deprived fifth of areas received on average 15% (£108 per capita) more local government funding than their share of needs.
Figure 3.16. Difference between funding and share of estimated needs, by deprivation

Note: Figures are population weighted, but quantiles are constructed without population weighting, so that a fifth of areas are in each quintile. Socio-economic deprivation is measured by the average score from IMD 2019.
As described in our earlier report, these gaps reflect the breakdown of the local government and police funding systems since 2013–14, as well as the failure to update spending needs assessments for nearly a decade. This means the relative needs and revenue-raising capacities of different areas are no longer reflected in any systematic way in funding allocations. For both these services, grant funding was cut during the 2010s and these cuts did not account for the higher reliance of more-deprived areas on government grants relative to locally raised revenues. This meant more-deprived areas saw the largest overall funding cuts.
Importantly, unlike those for the NHS, local government needs assessments do not account for any explicit aim of reducing unmet need or inequalities between areas. If policymakers aimed to do more than provide funding for consistent council services nationally, and instead aimed to go further and provide better services in more disadvantaged areas, then these figures may understate the degree of relative underfunding of deprived areas.
This pattern is reversed for public health where the most-deprived fifth of areas receive 6% more funding than their share of estimated needs, and the least-deprived fifth of areas 12% less. Given the small size of overall public health budgets, these are very small in cash terms: £5 more and £5 less per capita, respectively. There is little pattern for NHS funding, with the most-deprived fifth of areas receiving 0.3% more on average than their share of estimated needs.
Together, this means that the most-deprived fifth of areas receive 3% less total place-based funding than their share of estimated needs, and the most-deprived fifth 3% more. This suggests that aligning funding to estimated relative needs across all services would result in an overall reallocation of funding from the least-deprived areas, towards the most-deprived. As shown in Figure 3.17, this result is robust to different methodological choices. There are greater changes in the middle three quintiles of deprivation, as, for instance, the areas which set below-average tax rates are concentrated in the third quintile of deprivation. However, under all variations, the most-deprived fifth of areas receive at least 2% less funding than their share of estimated needs and the least-deprived fifth more than 2% more funding.
Figure 3.17. Difference between total funding and share of estimated needs under different assumptions, by deprivation

Note: As for Figure 3.16.
Figure 3.18 shows the average gap between shares of funding and needs for each service by quintile of population density. The fifth most densely populated areas receive 9% (£187 per capita) more NHS funding than their share of estimated needs, and 18% (£198 per capita) less local government funding. Police funding gaps again appear to be similar but smaller than those for local government, while there is no clear pattern by quintile of population density for public health funding compared to estimated needs. If funding for each service was allocated in line with relative needs, a greater share of NHS funding would be allocated to the most rural areas, and a greater share of local government funding to the most urban areas, but there would be little total funding shifted between rural and urban areas. Patterns by population density are slightly more sensitive to the assumptions we make, largely because 24 of the most densely populated 30 areas are in London. This includes the four areas which set the lowest average council tax rates, as well as those with the largest differences between their estimated populations in 2020 and after Census 2021.
Figure 3.18. Difference between funding and share of estimated needs, by population density
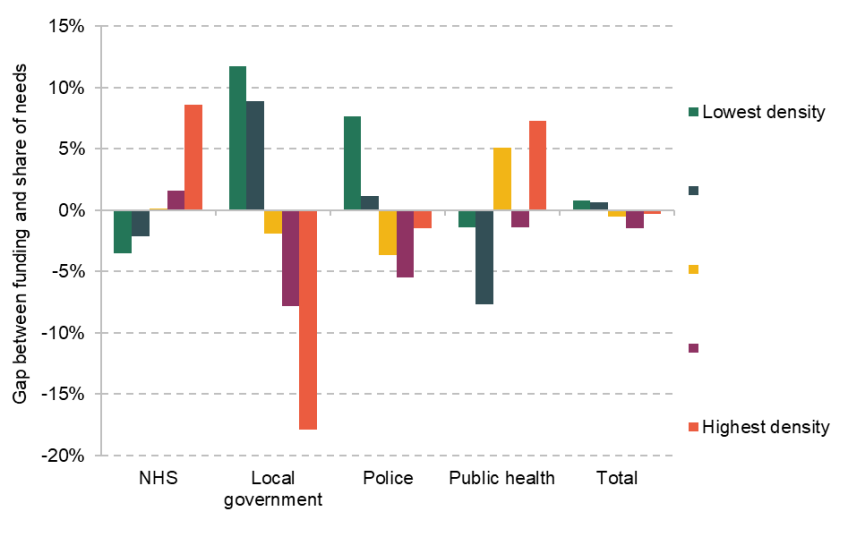
Note: Figures are population weighted, but quantiles are constructed without population weighting, so that a fifth of areas are in each quintile.
Figures 3.19 and 3.20 repeat this analysis for areas based on their age structure. The fifth of areas with the highest share of people aged 18 and under receive 3% more NHS funding than their share of estimated need on average, but receive less funding than their share of estimated needs for all other services. This gap is particularly pronounced for local government at 14% (£140 per capita), but is still not small in percentage terms for police (7%) and public health (6%). Largely due to local government, allocating funding for all services in line with relative estimated needs would increase funding in the youngest fifth of areas by £103 per capita.
These patterns are reversed for areas where the highest share of people is aged 65 and over. The fifth of areas with the oldest populations on average receive 3% less NHS funding than their share of estimated needs, and 10% more local government funding. The latter gap remains at 8% if we use notional council tax revenues, suggesting this is not because older areas set above-average council tax levels. Allocating funding for all services in line with relative estimated needs would not redistribute significant amounts of funding between areas with high and low shares of their population aged 65 and over.
Figure 3.19. Difference between funding and share of estimated needs, by share aged 18 and under
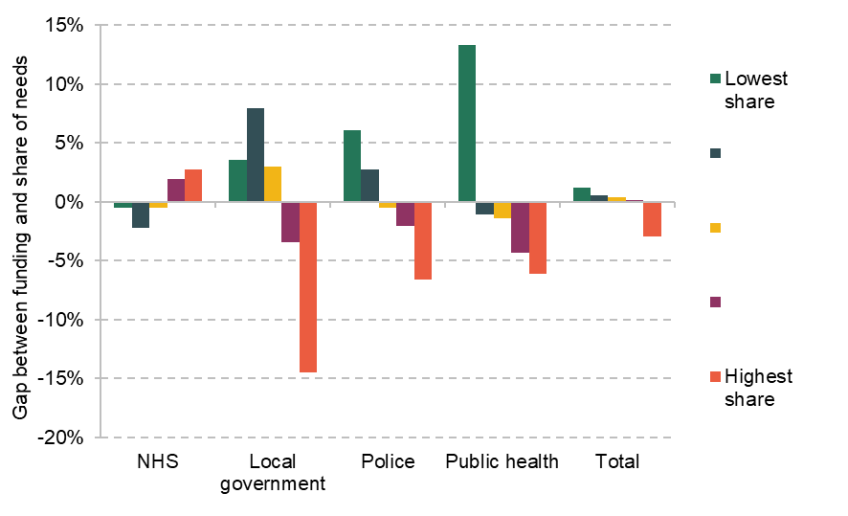
Note: Figures are population weighted, but quantiles are constructed without population weighting, so that a fifth of areas are in each quintile.
Figure 3.20. Difference between funding and share of estimated needs, by share aged 65 and over
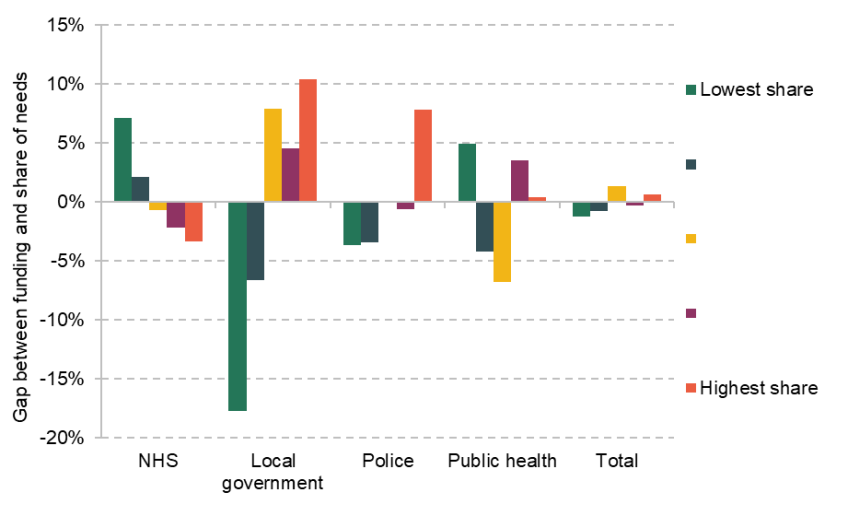
Note: Figures are population weighted, but quantiles are constructed without population weighting, so that a fifth of areas are in each quintile.
Results for an additional range of characteristics are available in Appendix B. These show:
- The fifth of areas with the highest healthy male life expectancy receive 11% more local government funding than their share of estimated needs, and the fifth with the lowest life expectancy 10% less. Similarly, the fifth with the highest healthy male life expectancy receive 4% more police funding than their share of estimated needs, and the fifth of areas with the lowest life expectancy 6% less. This is in stark contrast with public health funding, where those areas with the highest healthy male life expectancy receive 9% less than their share of estimated needs. Patterns are similar by quintile of female life expectancy and by the ONS Health Index (which aims to capture a broad definition of health). There is no significant relationship between funding gaps for NHS services and any of these measures.
- When areas are grouped based on a survey-based measure of average life satisfaction, those with the lowest life satisfaction receive 3% more NHS funding than their share of estimated needs, and 6% less local government and police funding. This analysis is not causal. These relationships are likely to reflect the strong negative correlation between life satisfaction and deprivation.
- Finally, there are stark patterns in the gaps between funding and shares of need by ethnicity. The fifth of areas where the lowest proportion of people reported their ethnic group as White at the 2021 Census receive significantly (18%) less local government funding than their share of estimated needs, 5% less police funding and 8% more NHS funding. This is likely to be because these areas are concentrated in London.
4. Conclusions
This report has analysed how spending in five key areas for health, well-being and life chances – the NHS, schools, local government, public health and police spending – varies across England, as well as how funding compares to updated estimates of the relative spending needs of different places. What have we found, and what are the implications?
Focusing first on funding levels, it is notable that funding per capita varies significantly between different parts of the country. While across England as a whole, funding for these services averaged £4,310 per capita in 2022–23, it ranged from £3,642 in York to £5,648 in Blackpool – 55% more – under our main estimation approach. Differences in funding are biggest in cash terms for the NHS, reflecting its bigger budget, but are largest in proportional terms for public health, where funding for the tenth of areas with the highest funding per capita is at least 2.6 times that of the tenth of areas with the lowest funding.
Funding is positively correlated with deprivation for each of these service areas – with the gradient being steepest for public health and shallowest for general local government funding. For example, in 2022–23 the most-deprived fifth of areas received an estimated 47% more public health funding per capita, 8% more local government funding per capita, and 11% more funding for these five public service areas combined, than the all-England average. In turn, funding is higher in areas with less healthy populations, poorer school attainment and higher population densities. Perhaps surprisingly, funding is lower in areas with a higher fraction of the population aged 65 or older, despite them making the greatest use of the costliest public service: the NHS. This reflects the fact that the older population is concentrated in suburban and rural places, where deprivation is generally lower and health better than more-urban places.
Turning to the relationship between funding levels and estimated needs, while more-deprived areas receive more funding, for local government and police services, they do not receive as high a share of the national funding pot as the formulae used in official spending needs assessments suggest they should. In particular, as of 2022–23, we estimate that the least-deprived fifth of areas receive a share of funding that is 15% higher than their share of estimated spending needs, on average, while the most-deprived fifth receive a share than is 9% lower. For police, the pattern is less stark (4% more and 6% less for these two groups, respectively) but still notable. The key reason for this pattern, as discussed in more detail in our previous report (Ogden et al., 2022), is that cuts to grant funding for local government and police services in the 2010s did not properly account for the fact that these cuts had different impacts on different places depending on how reliant on grant funding they were. In particular, the grant cuts translated into much smaller cuts in overall funding in less-deprived areas that could raise more themselves via council tax, than in more-deprived areas, which typically have less-valuable properties, and hence lower council tax revenues. As we also have discussed previously, this issue has been compounded by the fact that spending needs estimates for local government, the police and public health have not been updated for many years – an exercise that we have done for the production of this report.
The relative underfunding of deprived areas for local government and police services means that we see the same pattern, albeit to a lesser extent, when we look at overall spending on the four public services for which we have spending needs estimates: the NHS, local government, police and public health. For example, the least-deprived fifth of areas received a share of overall funding that was 3% higher than their share of estimated needs in 2022–23, while the most-deprived fifth of areas received a share that was 3% lower.
However, it is important to note that few places (including deprived places) are systematically and significantly underfunded relative to their estimated share of needs across multiple service areas. Instead, it is more typical for areas doing relatively poorly in some services to do relatively well in others. There is a fairly strong pattern, for instance, whereby areas that receive a lower share of local government funding than they are estimated to need receive a higher share of health funding than they are estimated to need, and vice versa. Given the way public services are currently funded though, while receiving a share of funding that your area is estimated to need for one service area may allow you to improve that service, it does not directly offset or address underfunding for other services, as these are funded separately and delivered by different organisations.
These findings have a number of implications for policy.
First, it is the local government, police and public health funding allocation systems that are most in need of reform, especially if the government is serious about tackling geographical inequalities and ‘levelling up’. In doing so, it may actually want to go beyond aligning relative levels of funding more closely with estimates of relative spending needs. It could, as with the NHS, provide explicit ‘top ups’ to areas with high needs so that they can offer better quality public services, as part of an explicit strategy to further reduce needs and narrow inequalities going forwards.
In this context, the importance of reliable and up-to-date data should not be underestimated. During the course of this project, we have updated the data that feed into the formulae used in official needs assessments where possible, and this does have an important impact on estimates of the relative needs of different places, especially for local government services. Our analysis has also shown that even for something as basic as the population of areas, using different data – such as pre- and post-Census ONS population estimates, and GP patient rolls – can make a big difference to estimates of funding and relative needs for specific areas. The ONS is currently working to ensure its estimates of local authority populations in mid-2022 (and beyond) are not distorted by temporary population movements associated with the COVID-19 pandemic, which may have affected the 2021 Census. It also plans to make more use of administrative data to estimate population changes at a local level over time. Given the fundamental importance of population as a driver of spending needs for many public services (as well as investment in new infrastructure and facilities), understanding the reasons for differences between various sources of population data and improving population estimates is a worthy priority.
As well as updating and improving the data used to estimate spending needs, the government should also update the formulae these data are plugged into. The existing formulae reflect estimated or assumed relationships between local area characteristics and spending needs, and are based on the types of services, and the technology and processes used to deliver them, many years ago. A decade of austerity in the 2010s, which necessitated focusing budgets on statutory duties and the neediest service users, and changes in how public services are delivered, means that the relationship between local area characteristics and spending needs will most likely have changed. The NHS has a process by which spending needs formulae as well as the data plugged into them are updated on a frequent and regular basis – other services would benefit from this too. Delivering the long-delayed Fair Funding Review – which should result in new spending needs estimates for local government services and a process to keep these up-to-date in future years – should be a priority for government.
The second implication relates to local discretion to reallocate funding between service areas. It may prove difficult for central government to redistribute funding for particular services between places, particularly given the tight fiscal outlook: when overall funding cannot be increased, boosting funding for relatively underfunded areas requires actually cutting funding for other areas. Even if the government is able to update spending needs estimates and redistribute funding accordingly, as highlighted in our previous report (Ogden et al., 2022), estimating spending needs is difficult and the resulting estimates will be imperfect. In this context, providing local areas with more discretion to move funding between service areas may actually be beneficial in achieving a better match between funding levels and spending needs across services. This is particularly true given that, as highlighted, areas that are relatively underfunded for some services typically do relatively well for other services – if they could move funding between services, they may be able to match funding better with needs.
Providing such flexibility is not without its challenges, not least because different services are delivered by different organisations covering different geographies. But there are examples of such arrangements already – such as the Better Care Fund, where NHS bodies and councils pool funding for adult social care services. And while local areas could also use such flexibility to de-prioritise some services in ways central government deems undesirable, the government can reduce that risk by ensuring there are clear minimum standards that are expected for different services.
Of course, the government cannot just set out minimum standards and expect service providers to achieve them. It also has to ensure that the funding it provides to different places is sufficient to achieve those minimum standards. This brings us to a key area for future research: developing a better evidence base on the links between funding, service provision, quality and outcomes.
This report has focused on comparing how the relative spending needs of different places compare to the relative amounts of funding they receive. But an area that receives a higher share of funding than it is assessed to need may still not receive enough in absolute terms to meet the expectations of the government and the population for public services in that area. Working out how much an area needs to achieve those expected standards – or any minimum standard set by the government – is challenging. But, as we discussed in the introduction to this report, progress has been made on better understanding the links between funding, service quality and outcomes for the NHS and schools. Much less is known about these links for local government services, making this a priority for future research.
References
Cattan, S., Conti, G., Farquharson, C., Ginja, R., and Pecher, M. (2021), ‘The Health Impacts of Universal Early Childhood Interventions: Evidence from Sure Start’, Institute for Fiscal Studies Working Paper 2021/25, https://ifs.org.uk/publications/health-impacts-universal-early-childhood-interventions-evidence-sure-start.
Cornaglia, F., Feldman, N. E., and Leigh, A. (2014), ‘Crime and Mental Wellbeing’, Journal of Human Resources, 49, 110–140, https://doi.org/10.3368/jhr.49.1.110.
Crawford, R., Stoye, G., and Zaranko, B. (2021), ‘Long-Term Care Spending and Hospital Use among the Older Population in England’, Journal of Health Economics, 78, 102477, https://doi.org/10.1016/j.jhealeco.2021.102477.
Department for Work and Pensions (2020), ‘Benefit Expenditure by Country and Region, 1996/97 to 2019/20’, https://www.gov.uk/government/publications/benefit-expenditure-and-caseload-tables-2020.
Department for Work and Pensions (2023), ‘Outturn and Forecast Tables: Spring Budget 2023’, https://www.gov.uk/government/publications/benefit-expenditure-and-caseload-tables-2023.
Dustmann, C., and Fasani, F. (2014), ‘The Effect of Local Area Crime on Mental Health’, Economic Journal, 126, 978–1017, https://doi.org/10.1111/ecoj.12205.
Galama, T., Lleras-Muney, A., and van Kippersluis, H. (2018), ‘The Effect of Education on Health and Mortality: A Review of Experimental and Quasi-Experimental Evidence’, National Bureau of Economic Research (NBER) Working Paper 24225, https://doi.org/10.3386/w24225.
Hamad, R., Elser, H., Tran, D. C., Rehkopf, D. H., and Goodman, S. N. (2018), ‘How and Why Studies Disagree about the Effects of Education on Health: A Systematic Review and Meta-Analysis of Studies of Compulsory Schooling Laws’, Social Science and Medicine, 212, 168–178, https://doi.org/10.1016/j.socscimed.2018.07.016.
HM Treasury (2023a), ‘Public Expenditure Statistical Analyses 2023’, https://www.gov.uk/government/statistics/public-expenditure-statistical-analyses-2023.
HM Treasury (2023b), ‘Spring Budget 2023’, https://www.gov.uk/government/publications/spring-budget-2023.
House of Commons Library (2022), ‘UK Hex Cartograms Non-Contiguous’, https://github.com/houseofcommonslibrary/uk-hex-cartograms-noncontiguous.
Janke, K., Lee, K., Propper, C., Shields, K., and Shields M. (eds) (2020), ‘Macroeconomic Conditions and Health in Britain: Aggregation, Dynamics and Local Area Heterogeneity’, CEPR Discussion Paper No. 14507, https://cepr.org/publications/dp14507.
Ludwig, J., Duncan, G. J., Gennetian, L. A., Katz, L. F., Kessler, R. C., Kling, J. R., and Sanbonmatsu, L. (2012), ‘Neighborhood Effects on the Long-Term Well-Being of Low-Income Adults’, Science, 337, 1505–1510, https://doi.org/10.1126/science.1224648.
Marsh, A., Gordon, D., Pantazis, C., and Heslop, P. (2000), Home Sweet Home? The Impact of Poor Housing on Health, Bristol: Policy Press, https://doi.org/10.1136/bmj.320.7232.453.
Martin, S., Rice, N., and Smith, P. C. (2008), ‘Does Health Care Spending Improve Health Outcomes? Evidence from English Programme Budgeting Data’, Journal of Health Economics, 27, 826–42, https://doi.org/10.1016/j.jhealeco.2007.12.002.
Martin, S., Lomas, J., Claxton, K., and Longo, F. (2021), ‘How Effective Is Marginal Healthcare Expenditure? New Evidence from England for 2003/04 to 2012/13’, Applied Health Economics and Health Policy, 19, 885–903, https://doi.org/10.1007/s40258-021-00663-3.
Ministry of Housing, Communities and Local Government (2019), ‘English Indices of Deprivation 2019’, https://www.gov.uk/government/statistics/english-indices-of-deprivation-2019.
Office for National Statistics (2020a), ‘Population Projections – Local Authority Based by Single Year of Age (PPSYOALA)’, https://www.nomisweb.co.uk/datasets/ppsyoala.
Office for National Statistics (2020b), ‘Health Index: England’, https://www.ons.gov.uk/people populationandcommunity/healthandsocialcare/healthandwellbeing/datasets/healthindexengland.
Office for National Statistics (2022a), ‘Population Estimates – Local Authority Based by Single Year of Age (PESTSYOALA), https://www.nomisweb.co.uk/datasets/pestsyoala.
ONS Standard Area Measurements (Latest) for Administrative Areas in the United Kingdom (V2), https://geoportal.statistics.gov.uk/datasets/standard-area-measurements-latest-for-administrative-areas-in-the-united-kingdom-v2/about.
Ogden, K., and Phillips, D. (2023), ‘The Distribution of Public Service Spending’, IFS Deaton Review of Inequalities commentary, https://ifs.org.uk/publications/distribution-public-service-spending.
Ogden, K., Phillips, D., Sibieta, L., Warner, M., and Zaranko, B. (2022), ‘Does Funding Follow Need? An Analysis of the Geographic Distribution of Public Spending in England’, https://ifs.org.uk/publications/does-funding-follow-need-analysis-geographic-distribution-public-spending-england.
Robinson, F., and Keithley, J. (2010), ‘The Impacts of Crime on Health and Health Services: A Literature Review’, Health, Risk & Society, 2, 253–266, https://doi.org/10.1080/713670168.
Valtorta, N. K., Kanaan, M., Gilbody, S., Ronzi, S., and Hanratty, B. (2016), ‘Loneliness and Social Isolation as Risk Factors for Coronary Heart Disease and Stroke: Systematic Review and Meta-Analysis of Longitudinal Observational Studies’, Heart, 102, 1009–1016, http://dx.doi.org/10.1136/heartjnl-2015-308790.
Venkataramani, A. S., O’Brien, R., Whitehorn, G. L., and Tsai, A. C. (2020), ‘Economic Influences on Population Health in the United States: Toward Policymaking Driven by Data and Evidence’, PloS Medicine, 17, e1003319, https://doi.org/10.1371/journal.pmed.1003319.
World Health Organization (2016), ‘Urban Green Space and Health: Intervention Impacts and Effectiveness’, World Health Organization, Regional Office for Europe, https://www.who.int/ europe/publications/m/item/urban-green-space-and-health—intervention-impacts-and-effectiveness.
Data sources
Department for Communities and Local Government (2013), ‘Local Government Finance Settlement 2013/14: Calculation of 2013/14 Formula Funding’, https://webarchive.nationalarchives.gov.uk/ukgwa/20140505104701/ http://www.local.communities.gov.uk/finance/1314/settle.htm.
Department for Education (2022), ‘Key Stage 4 Performance, Academic Year 2021/22’, https://explore-education-statistics.service.gov.uk/find-statistics/key-stage-4-performance-revised.
Department for Education (2022), ‘Planned LA and School Expenditure, Financial Year 2022–23 [National Statistics]’, https://explore-education-statistics.service.gov.uk/find-statistics/planned-la-and-school-expenditure.
Department for Education (2022), ‘Schools, Pupils and their Characteristics, Academic Year 2021/22’, https://explore-education-statistics.service.gov.uk/find-statistics/school-pupils-and-their-characteristics/2021-22.
Department for Levelling Up, Housing and Communities (2022), ‘2021 Area Cost Adjustment’, https://www.gov.uk/government/publications/2021-area-cost-adjustment.
Department for Levelling Up, Housing and Communities (2022), ‘Council Tax Levels Set by Local Authorities in England 2022 to 2023’, https://www.gov.uk/government/statistics/council-tax-levels-set-by-local-authorities-in-england-2022-to-2023.
Department for Levelling Up, Housing and Communities (2022), ‘Key Information for Local Authorities: Final Local Government Finance Settlement 2022 to 2023’, https://www.gov.uk/government/publications/key-information-for-local-authorities-final-local-government-finance-settlement-2022-to-2023.
Department for Levelling Up, Housing and Communities (2022), ‘Revenue Account (RA) Budget 2022 to 2023’, https://www.gov.uk/government/statistics/local-authority-revenue-expenditure-and-financing-england-2022-to-2023-budget-individual-local-authority-data.
Department for Levelling Up, Housing and Communities (2023), ‘Core Spending Power: Final Local Government Finance Settlement 2023 to 2024’, https://www.gov.uk/government/publications/core-spending-power-final-local-government-finance-settlement-2023-to-2024.
Department for Levelling Up, Housing and Communities (2023), ‘Levelling Up Round 2: Thematic and Geographic Analysis’, https://www.gov.uk/government/publications/levelling-up-round-2-thematic-and-geographic-analysis.
Department for Levelling Up, Housing and Communities (2023), ‘Revenue Outturn Summary (RS) 2021 to 2022, Revised’, https://www.gov.uk/government/statistics/local-authority-revenue-expenditure-and-financing-england-2021-to-2022-individual-local-authority-data-outturn.
Department for Transport (2022), ‘Passenger Journeys on Local Buses, BUS01g: Elderly and Disabled Concessionary Passenger Journeys on Local Bus Services by Local Authority’, https://www.gov.uk/government/statistical-data-sets/bus-statistics-data-tables [accessed 12-04-2023].
Department for Transport (2022), ‘RDL0202: Road Length (Kilometres) by Road Type and Local Authority in Great Britain 2021’, https://www.gov.uk/government/statistical-data-sets/road-length-statistics-rdl.
Department for Transport (2022), ‘TRA8906: Motor Vehicle Traffic (Vehicle Kilometres) Excluding Trunk Roads by Local Authority in England,, https://www.gov.uk/government/statistical-data-sets/road-traffic-statistics-tra [accessed 12-04-2023].
Department for Work and Pensions (2023), Benefit statistics (various), accessed from Stat-Xplore at https://stat-xplore.dwp.gov.uk/.
Department of Health (2015), ‘Exposition Book: Calculation of Weighted Populations Using Proposed Target Formula’, https://www.gov.uk/government/consultations/public-health-formula-for-local-authorities-from-april-2016.
Department of Health (2015), ‘Public Health Grant: Exposition Book for Proposed Formula for 2016–17 Target Allocations – Technical Guide’, https://www.gov.uk/government/ consultations/public-health-formula-for-local-authorities-from-april-2016.
Department of Health and Social Care (2022), ‘Public Health Grants to Local Authorities: 2022 to 2023’, https://www.gov.uk/government/publications/public-health-grants-to-local-authorities-2022-to-2023.
Education and Skills Funding Agency (2021), ‘Dedicated Schools Grant (DSG): 2022 to 2023’, https://www.gov.uk/government/publications/dedicated-schools-grant-dsg-2022-to-2023.
Education and Skills Funding Agency (2021), ‘Schools Supplementary Grant 2022 to 2023’, https://www.gov.uk/government/publications/schools-supplementary-grant-2022-to-2023.
Education and Skills Funding Agency (2022), ‘Pupil Premium: Allocations and Conditions of Grant 2022 to 2023’, https://www.gov.uk/government/publications/pupil-premium-allocations-and-conditions-of-grant-2022-to-2023.
Greater London Authority (2022), ‘The Greater London Authority Consolidated Budget and Component Budgets for 2022–23’, https://www.london.gov.uk/sites/default/files/final_budget_2022-23.pdf.
HM Treasury (2022), ‘Country and Regional Analysis: 2022’, https://www.gov.uk/government/statistics/country-and-regional-analysis-2022.
Home Office (2022), ‘Police Grant Report (England and Wales) 2022/23’, https://www.gov.uk/government/publications/police-grants-in-england-and-wales-2022-to-2023.
Met Office, Hollis, D., McCarthy, M., Kendon, M., and Legg, T. (2022), ‘HadUK-Grid Climate Observations by Administrative Regions over the UK, v1.1.0.0 (1836–2021)’, NERC EDS Centre for Environmental Data Analysis, 26 May 2022, https://dx.doi.org/10.5285/7edd216fcf794b1f9a5889d496d50e54.
Ministry of Housing, Communities and Local Government (2018), ‘Review of Local Authorities’ Relative Needs and Resources: Technical Paper’, https://www.gov.uk/government/ consultations/review-of-local-authorities-relative-needs-and-resources.
Ministry of Housing, Communities and Local Government (2021), ‘Revenue Account (RA) Budget 2021 to 2022’, https://www.gov.uk/government/statistics/local-authority-revenue-expenditure-and-financing-england-2021-to-2022-budget-individual-local-authority-data.
NHS Digital (2022), ‘Adult Social Care Activity and Finance Report: England 2021–22’, https://digital.nhs.uk/data-and-information/publications/statistical/adult-social-care-activity-and-finance-report/2021-22.
NHS England (2019), ‘CCG Allocations 2019/20 to 2023/24 (Specialised Services)’, https://www.england.nhs.uk/publication/ccg-allocations-2019-20-to-2023-24-specialised-services/.
NHS England (2022), ‘2022/23 Priorities and Operational Planning Guidance’, https://www.england.nhs.uk/publication/2022-23-priorities-and-operational-planning-guidance/.
NHS England (2022), ‘Allocation of Resources 2022/23’, https://www.england.nhs.uk/publication/allocation-of-resources-2022-23/.
Office for National Statistics (2013), 2011 Census data, accessed at https://www.nomisweb.co.uk/sources/census_2011.
Office for National Statistics (2019), ‘Health State Life Expectancy at Birth and at Age 65 Years By Local Areas, UK’, https://www.ons.gov.uk/peoplepopulationandcommunity/ healthandsocialcare/healthandlifeexpectancies/datasets/healthstatelifeexpectancyatbirthandatage65bylocalareasuk/current.
Office for National Statistics (2021), ‘Population Estimates – Small Area Based by Single Year of Age – England and Wales (PESTSYOAOA)’, https://www.nomisweb.co.uk/datasets/pestsyoaoa.
Office for National Statistics (2022), ‘Personal Well-Being Estimates by Local Authority’, https://www.ons.gov.uk/datasets/wellbeing-local-authority/editions/time-series/versions/3.
Office for National Statistics (2022), ‘Ethnic Group, England and Wales: Census 2021’, https://www.ons.gov.uk/peoplepopulationandcommunity/culturalidentity/ethnicity/bulletins/ethnicgroupenglandandwales/census2021.
Office for National Statistics (2023), 2021 Census data, accessed at https://www.nomisweb.co.uk/sources/census_2021.
Visit Britain, Local Authorities combined analysis (domestic overnight and day visits), https://www.visitbritain.org/destination-specific-research.
Acknowledgements
The authors gratefully acknowledge funding from the Health Foundation as part of their work on understanding the broader determinants of health and the role of the state in addressing these. The authors gratefully acknowledge the support of the ESRC Centre for the Microeconomic Analysis of Public Policy (ES/T014334/1).
In addition, the authors would like to thank Katherine Merrifield, Gwen Nightingale, Jo Bibby and Mai Stafford from the Health Foundation, and Ben Zaranko and Carl Emmerson from the Institute for Fiscal Studies, for helpful comments and suggestions. Any errors or omissions are the responsibility of the authors only.
Endnotes
Authors

Kate Ogden
Kate joined the IFS in 2020 and works on local government finance and higher education.

David Phillips
David is Head of Devolved and Local Government Finance. He also works on tax in developing countries as part of our TaxDev centre.

Max Warner
Max joined the IFS in 2020. His work covers health and social care, public spending and public sector productivity.
More from IFS
Understand this issue


Policy analysis


Academic research


