
Downloads
Download report PDF
PDF | 605.68 KB
1Health is the largest single area of Scottish Government spending, making up 35% of the Scottish Government’s total discretionary budget in 2024–25 and 39% of its non-benefit budget.2 Its share of spending has grown significantly over time, driven by large increases in health spending in the 2000s and cutbacks to other areas of spending in the 2010s. This trend is set to continue with the Scottish Fiscal Commission (SFC) projecting that to keep up with the demands of an ageing, less healthy population, and medical advancements, Scottish health spending would need to grow by around 3% in real terms per year in the late 2020s and 2030s, compared with around 2% for all Scottish Government spending. More urgently, there is clear evidence that the NHS in Scotland, as in the rest of the UK, is struggling to recover from the COVID-19 pandemic, despite record levels of spending and staffing.
In this chapter of our second Scottish Budget Report, we therefore look at long-run trends in healthcare spending in Scotland and how these compare with trends in England and Wales, before examining recent trends in NHS staffing, activity, productivity and performance in Scotland. We conclude with a discussion about future funding and staffing.
Key findings
1. Scottish health spending per person has grown considerably in real terms over time, from £1,659 per person in 1999–2000 to £3,073 in 2022–23 (in 2022–23 prices). Spending grew rapidly in the first decade after devolution, with average real growth of 5.0% per year between 1999–2000 and 2009–10, but at a much slower rate of 0.4% per year between 2009–10 and 2019–20. Spending rose rapidly during the COVID-19 pandemic, and although it has since fallen, spending per person remained 10% higher in 2022–23 than in 2019–20.
2. Spending per person on health was higher in Scotland than in either England or Wales at the start of devolution, but this gap has fallen over time. In 1999–2000, Scotland spent 22% more per person on health than England, but by 2019–20 this had fallen to 3% more per person. Under current plans, Scotland will spend around 3% more than England per person in 2024–25. In both 2018–19 and 2019–20, Wales spent more on health per person than Scotland, a trend that is set to continue under the current budgets of the devolved governments of both countries.
3. The number of staff working in the Scottish NHS has increased substantially since the start of the pandemic. In July–September 2023, the NHS employed 11% more consultants, 16% more junior doctors and 8% more nurses than pre-pandemic.
4. Measured hospital activity fell rapidly during the COVID-19 pandemic and has still failed to recover fully. In April–June 2023, the Scottish NHS treated 8% fewer elective day-case patients, handled 8% fewer emergency admissions and 8% fewer outpatient appointments and treated 21% fewer elective inpatient admissions than pre-pandemic.
5. Higher funding and staffing than pre-pandemic but lower hospital activity points to a large fall in measured NHS hospital productivity in Scotland. This fall is particularly concerning given the challenging fiscal situation the Scottish Government continues to face.
6. The number of patients on the elective waiting list in Scotland has grown by 87% since the start of the pandemic. The percentages of patients waiting less than 18 weeks for elective treatment and less than four hours in A&E departments have also fallen substantially since the start of the pandemic. Until the NHS can deliver more hospital activity than pre-pandemic, it is likely waiting lists and waiting times will continue to rise.
7. The apparent fall in hospital productivity in Scotland is similar in magnitude to that observed in the English NHS. But England has increased staff by more than Scotland, so the recovery in hospital activity has been much greater.
8. The elective waiting list has grown by less in England than in Scotland since the start of the pandemic, although definitions of included activity differ. Elective and A&E waiting times performance has been worse in England post-pandemic than in Scotland. By these measures of performance, neither country’s system is performing better across the board.
9. Demographic and cost pressures mean that health spending would need to increase in Scotland over time to provide the same level of service. The Scottish Fiscal Commission projects that Scottish health spending will need to grow by around 3% in real terms per year in the late 2020s and 2030s, compared with around 2% for all Scottish Government spending.
10. Much of this increase in spending will go towards increased staffing. However, the Scottish Government’s health and social care workforce plan only aims to increase NHS staffing by 1% over the five years from 2022. The English NHS workforce plan implies a 20–21% growth in NHS staff in England over the same period. This suggests that Scotland is likely to need to either increase staffing numbers and spending by more than planned increases, find ways to boost productivity significantly faster than is being planned in England, or live with a relative deterioration in NHS service quality.
4.1 Long-run trends in health spending
Health spending and policy has been devolved to Scotland since the advent of devolution in 1999. The basic principles of the healthcare system remain similar in Scotland to those in the rest of the UK, with (most) medical care and treatment provided free at the point of use, and funding allocated between localities within Scotland on the basis of assessed population healthcare needs. However, some different decisions on how much to spend and on how to organise and deliver healthcare services can and have been made. For example, prescription medication is free for all in Scotland (as well as in Northern Ireland and Wales), in contrast to England, where the majority of the working-age population is subject to prescription charges. And there has generally been lower use of private providers and less emphasis on patient choice in the Scottish healthcare system, and a greater emphasis on the integration of different parts of the health and social care system (although recent changes in England have also promoted integration).
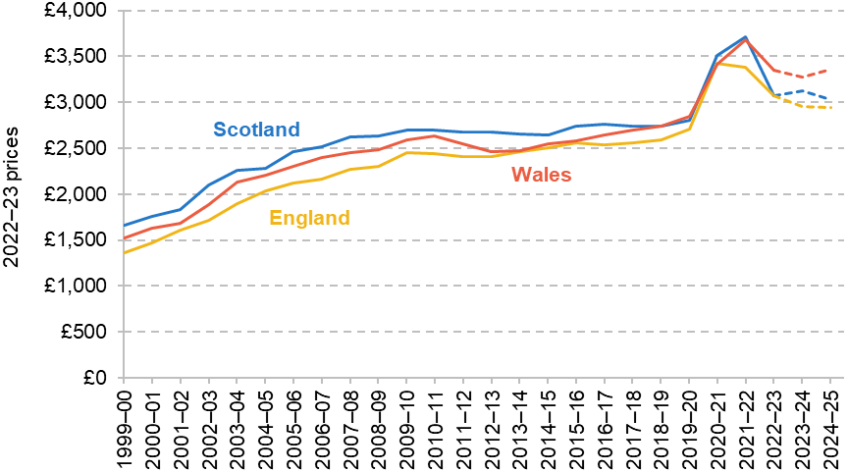
Focusing first on long-run trends in health spending, Figure 4.1 shows real-terms spending per person on health in Scotland (the blue line), England (the yellow line) and Wales (the red line) between 1999–2000 and 2022–23 as estimated in HM Treasury’s Country and Regional Analysis data series. The dashed lines then show our estimates of the planned levels of spending for 2023–24 and 2024–25 based on the Scottish, UK and Welsh budgets. These planned levels of spending should not be taken as final, since in all parts of the UK NHS funding is often topped up.
Figure 4.1. Real spending per person on health in Scotland, England and Wales
Note: Populations from 2022–23 onwards estimated using ONS population growth rate projections applied to 2021–22 population estimates. Planned funding for 2023–24 and 2024–25 estimated using the planned growth rates in the NHS Recovery, Health and Social Care portfolio for Scotland, the Department of Health and Social Care (DHSC) budget for England, and the health and social care main expenditure group for Wales.
Source: HM Treasury, Country and Regional Analysis (various), https://www.gov.uk/government/collections/country-and-regional-analysis; Office for National Statistics, Estimates of the population for the UK, England, Wales, Scotland and Northern Ireland (various), https://www.ons.gov.uk/peoplepopulationandcommunity/populationandmigration/populationestimates/datasets/populationestimatesforukenglandandwalesscotlandandnorthernireland; Office for National Statistics, 2020-based interim national population projections: year ending June 2022 estimated international migration variant, https://www.ons.gov.uk/peoplepopulationandcommunity/populationandmigration/populationprojections/datasets/2020basedinterimnationalpopulationprojectionsyearendingjune2022estimatedinternationalmigrationvariant; HM Treasury, Autumn Statement 2023, https://www.gov.uk/government/publications/autumn-statement-2023; Welsh Government, Draft Budget 2024 to 2025, https://www.gov.wales/draft-budget-2024-2025; Welsh Government, Update on 2023–2024 financial position: summary of main changes, https://www.gov.wales/update-on-2023-2024-financial-position-summary-of-main-changes; Scottish Government, Scottish Budget: 2024 to 2025, https://www.gov.scot/publications/scottish-budget-2024-25/; Scottish Government, Scottish Budget 2023 to 2024: Spring Budget Revision, https://www.gov.scot/publications/spring-budget-revision-2023-24/.
We first consider the trends in Scotland. Health spending per person has risen considerably over time in Scotland, from £1,659 per person in 1999–2000 to £2,801 per person in 2019–20 (in 2022–23 prices). Most of the increase took place in the 2000s, with spending per person growing by an average of 5.0% per year in real terms between 1999–2000 and 2009–10. But from 2010–11, health spending per person fell in real terms for some years (2010–11 to 2014–15 and 2017–18 to 2018–19). Between 2009–10 and 2019–20, health spending per person overall therefore grew on average by just 0.4% per year in real terms, far slower than during the previous decade. The Scottish Government has long committed to pass on NHS Barnett consequentials to the Scottish NHS. However, the data do not allow us to assess this, as the definition of health spending differs from the NHS spending that this commitment is based on.
During the COVID-19 pandemic, health spending rose substantially in Scotland and peaked at £3,710 per person in 2021–22 before falling to £3,073 in 2022–23.3 This includes specific pandemic spending, such as vaccination and contact tracing (Test & Protect). Although much lower than during the peak of the COVID-19 pandemic, real health spending per person was still 10% higher in 2022–23 than in 2019–20.
We estimate that the Scottish Budget implies that health spending per person will reach around £3,026 in 2024–25, still below its peak level in 2021–22, and lower than in 2022–23 and 2023–24. It is also possible, indeed probable, that the Scottish Government will announce top-ups to Scottish health spending in 2024–25: as discussed in Chapter 2, following in-year top-ups to the 2023–24 health budget, spending is now set to fall in real terms next year.
Comparisons with England and Wales
At the outset of devolution, Scottish health spending per person was approximately 22% higher than health spending in England (Figure 4.2), equivalent to an extra £297 per person in Scotland. In the 25 years since, Scotland has continued to spend more on health per person than England, but this gap has fallen over time, and by 2022–23 England and Scotland spent almost the same on health per person.
Between 1999–2000 and 2009–10, health spending per person grew by 6.0% in England, compared with 5.0% per year in Scotland. This 1 percentage point faster annual growth in England meant that by 2009–10, Scotland spent 10% more per person on health than England, compared with 22% a decade before. Between 2009–10 and 2019–20, health spending per person grew at a slower rate in both countries, but was still faster in England, at 1.0% per year compared with 0.4% per year in Scotland. This meant that by 2019–20, Scotland spent just 3% more per person on health than England.
Figure 4.2. Difference between health spending per person in Scotland and other nations

Source: See source to Figure 4.1.
During the COVID-19 pandemic, the gap between Scotland and England’s health spending oscillated, falling in 2020–21 and growing in 2021–22. But the sharpest change was in 2022–23, when health spending per person fell by 9% in England and 17% in Scotland relative to the previous year. As a result, official estimates from HM Treasury suggest both countries spent a very similar amount on health per person in 2022–23. Although consistent with the long-run trend of a declining gap in health spending, this near-equality of spending in 2022–23 appears to be driven by fluctuations in health spending during the pandemic, rather than by a permanent shift in health spending patterns.4
Under Scottish and UK government plans, we estimate that the gap in spending will reopen a little, with Scotland spending 3% more than England per person on health in 2024–25. However, this should be treated with caution. It is likely that NHS funding plans in both countries will be topped up – as is almost always the case in England (Zaranko, 2021) – and so this gap may end up rather different.
Scotland has also tended to spend more on health per person than Wales, but this pattern has reversed in recent years. At the outset of Scottish devolution, Scotland spent 9% (£132) more per person on health than Wales. But by 2009–10, this had fallen to 4% (£106) more. In 2018–19 and 2019–20, Wales slightly overtook Scotland, with Scotland spending 1% less per person than Wales in 2019–20. During the first two years of the COVID-19 pandemic, Scotland once again spent more than Wales, but this reversed in 2022–23, with Scotland spending an estimated 8% (£273) less than Wales per person. Under the current plans of the two devolved governments, we estimate that Scotland will continue to spend less than Wales in 2023–24 and 2024–25, spending 10% less per person than Wales in 2024–25.
Smaller increases in health spending in Scotland than in England in the 2000s may have reflected, to some extent, smaller overall increases in funding as a result of the ‘Barnett squeeze’ (whereby Scotland’s higher starting level of funding means the Barnett formula provides smaller percentage increases). However, during the 2010s, the Scottish Government’s overall funding was cut by less than funding for comparable services in England (Phillips, 2021). The smaller increases in health spending therefore allowed the Scottish Government to cut other areas by less (or increase them by more) than the UK government. For example, education spending per person was reduced by 5% in real terms during the 2010s in Scotland, compared with 22% in England (Farquharson, Phillips and Zaranko, 2021).
Scotland spends substantially more on adult social care than England. In 2022–23, Scotland spent £591 per person on adult social care compared with £403 per person in England (and £582 in Wales). This greater spending on adult social care in Scotland is at least in part due to the introduction of free personal care for the elderly in Scotland in 2002 and its extension to working-age adults in 2019. The gap in social care spending per person between England and Scotland has fluctuated over time, but Scotland has consistently spent more per person than England since the start of devolution. In 1999–2000, Scotland spent 27% more per person than England, rising to 34% more in 2019–20 and 47% more in 2022–23.
Although Scotland spent more than England in 2022–23 on adult social care, and this gap has been growing over time, this does not offset the large decline in Scottish health spending relative to England. Scotland spent 23% more per person on health and adult social care together than England in 1999–2000 and 13% more in 2009–10. In 2022–23, total spending on health and adult social care was an estimated 6% higher in Scotland than in England (£3,664 per person in Scotland versus £3,472 per person in England) according to official HM Treasury estimates. As with health spending, Wales still spends more than both Scotland and England when we include adult social care spending (£3,928 per person).
4.2 Trends in staffing, activity and performance
The last section showed that there has been a convergence in Scottish and English health funding since the advent of devolution. The last four years have seen healthcare systems across the UK (and indeed the world) first have to respond to an unprecedented pandemic, and then attempt to recover and deliver services to a population that is growing older and less healthy. As a result, health spending in Scotland (and England) rose rapidly during the worst of the pandemic, and although spending has since fallen, it is planned to remain substantially above pre-pandemic levels.
Funding is important, but on its own it does not tell us how well a healthcare system is performing. In this section, we therefore examine trends in NHS staffing, activity and performance in Scotland. We consider how the NHS has changed since the start of the pandemic and, where data allow, we examine trends since the early 2010s. Where possible, we draw tentative comparisons with England, although these should always be treated with caution due to differences in data collection and definitions.
Staffing
Staff – both clinical and non-clinical – are the largest area of NHS spending in Scotland. In 2019, 46% of its NHS Recovery, Health and Social Care budget was spent on staff costs, rising to 56% in 2023 (Scottish Government, 2023b). In this subsection, we examine how the number of staff working in the NHS has changed over time.
Figure 4.3. Full-time-equivalent staff employed relative to 2019Q4: Scotland
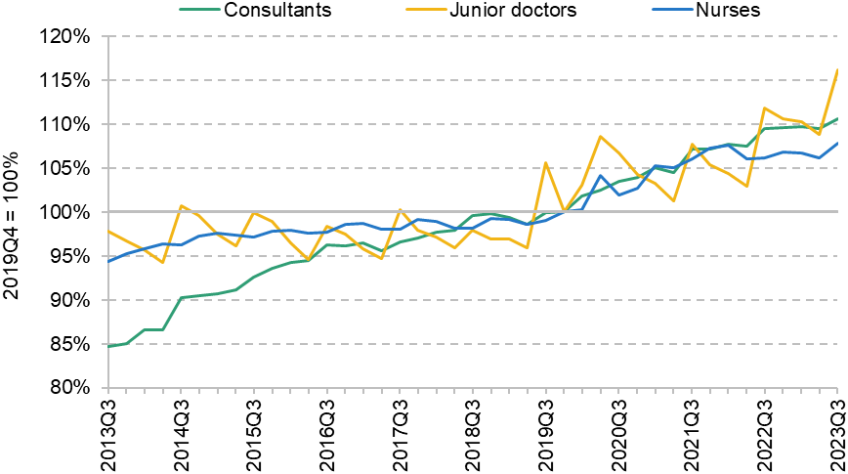
Note: ‘Nurses’ includes health visitors.
Source: TURAS Data Intelligence, 2023.
Figure 4.3 shows the number of full-time-equivalent (FTE) staff employed by NHS Scotland in three key staff groups relative to October–December 2019, the final quarter before the start of the COVID-19 pandemic. These data cover staff directly employed by the NHS – such as those working in NHS hospitals – but do not include many staff working in GP practices.
The number of consultants – the most senior doctors working in the NHS – has grown consistently since 2013. The NHS employed 4,670 full-time-equivalent consultants in July–September 2013 and 5,510 in October–December 2019 on the eve of the COVID-19 pandemic. In the latest available data, for July–September 2023, the NHS employed 6,100 consultants. This is 590 more than pre-pandemic, an increase of 11%.
The number of junior doctors – doctors who are still in training – has had a very different trajectory from the number of consultants, remaining approximately constant between 2013 and 2019 at an average of around 5,760. The number of junior doctors rose rapidly from July–September 2019, reaching 6,890 in July–September 2023, 16% higher than the pre-pandemic level. This increase in junior doctor numbers was likely driven by changes in the number of medical school places funded by the Scottish Government in the preceding years (Lewis, 2023).
The number of nurses has also risen consistently since 2013, though at a slower rate than the number of consultants. The NHS employed 54,390 nurses in July–September 2013 and 57,640 in October–December 2019. As with doctors, the number of nurses rose rapidly during the COVID-19 pandemic. In July–September 2023, the NHS employed 62,120 nurses, 8% more than pre-pandemic.
The NHS in Scotland therefore employs substantially more consultants, junior doctors and nurses than it did either in 2013 or prior to the COVID-19 pandemic in 2019. For nurses and junior doctors, the rate of growth in staff numbers has been much faster since the start of the pandemic. Some of this reflects that the NHS has substantially higher funding than it did pre-pandemic. But some of this is also driven by an increased share of the NHS budget going towards staffing – from 46% in 2019 to 56% in 2023 (Scottish Government, 2023b).
Although the number of staff has substantially increased since the start of the pandemic, there is still evidence of substantial workforce challenges. The turnover rate for all NHS staff has increased from 6.3% in 2019–20 to 9.4% in 2022–23. Over the same period, agency spending for medical and dental staff has risen by 16% and bank and agency spending for nurses and midwives has more than doubled (a rise of 111%, from £212 million to £447 million; TURAS Data Intelligence, 2023). In part because of these challenges, in 2022 the Scottish Government published National Workforce Strategy for Health and Social Care, which we will discuss in Section 4.3.
Activity
With higher levels of funding and a larger number of staff, we would normally expect the NHS to deliver more and higher-quality care. But these increases in funding and staffing have occurred in the context of the COVID-19 pandemic, which put huge pressure on healthcare systems during 2020 and 2021, and continues to exert a large impact. We therefore now examine how NHS activity has changed over time, both pre- and post-pandemic. We focus on hospital activity as this is an important part of NHS activity and has the best recorded data.
Figure 4.4. Treatment volumes relative to 2019Q4: Scotland
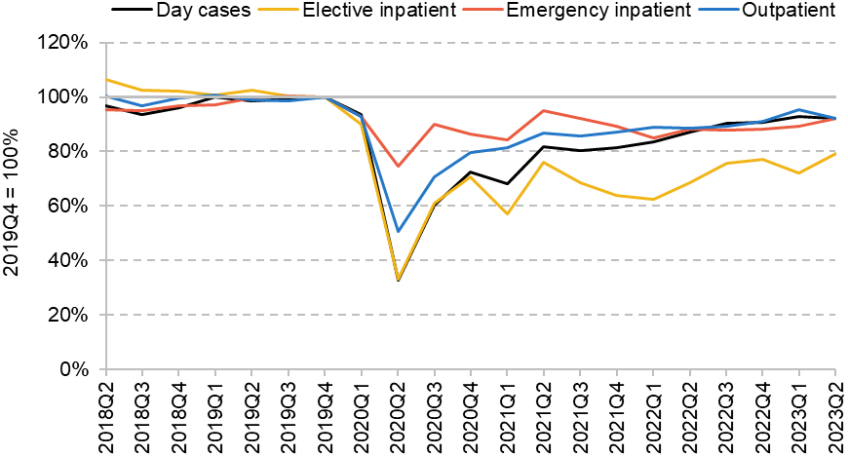
Source: Public Health Scotland, 2023a.
Figure 4.4 shows how the number of patients treated in different types of care have changed relative to October–December 2019, the final data period before the start of the COVID-19 pandemic. The black line shows the number of day cases, pre-planned hospital treatment that does not require an overnight stay. The yellow line shows the number of elective inpatient admissions, pre-planned treatment that requires a stay in hospital. Together, these two categories make up elective, or pre-planned, hospital care. The red line shows the number of emergency inpatient admissions, emergency treatment that requires a stay in hospital. The blue line shows the number of outpatient appointments, treatment or consultation that is delivered without a stay in hospital.
Although we only have one-and-a-half years of pre-pandemic data, they suggest that the number of emergency admissions and day cases was rising, the number of outpatient appointments was approximately flat, and the number of elective admissions was falling. A falling number of elective admissions is not necessarily a bad thing – it may reflect improvements that mean the same care can now be delivered as day cases.
At the start of the pandemic, all forms of hospital activity fell rapidly, particularly elective day cases and inpatient admissions. Although patient volumes for all four types of care have risen from their 2020 levels, they remained substantially below their pre-pandemic levels in 2023. In April–June 2023 (the latest available data), day cases, emergency inpatient admissions and outpatient appointments were all 8% below their pre-pandemic levels. Elective inpatient admissions were even lower, at 21% below their pre-pandemic levels.
Although data collection is still in development, the data that are available suggest that activity in primary care has also not returned to pre-pandemic levels. Between January and October 2023, there were 6% fewer direct interactions with GPs than over the same period in 2019, and 3% fewer direct interactions with other primary care professionals (Public Health Scotland, 2023b).
The NHS has therefore not yet managed to recover its activity to pre-pandemic levels. This is already a low baseline to compare activity with, because without the pandemic we would have expected most types of activity to have grown over time – in particular given the big increase in the number of consultants, junior doctors and nurses since the pandemic. Although hospital activity has increased over the last year of data, this has been slow. At the current rate of recovery, it would take several more years for the NHS just to return to pre-pandemic activity levels.
Productivity
In the previous sections, we have shown three key trends: NHS funding and hospital staffing are substantially above their pre-pandemic levels, but hospital activity remains substantially below pre-pandemic levels. We now explore this potential fall in hospital productivity, how it compares with that in England, and potential explanations.
To summarise the changes, Figure 4.5 shows how the number of staff and hospital activity have changed between 2019 and 2023 separately for Scotland (the green bars) and England (the yellow bars). The data for each country are collected and defined in slightly different ways, so caution should be taken when comparing exact numbers, but the broad trends are illustrative.
Starting first with Scotland, as we showed earlier, staff in all three major clinical groups – consultants, junior doctors and nurses – are substantially above their 2019 levels. Over the same period, the numbers of elective admissions (day cases and elective inpatient admissions combined), emergency admissions and outpatient appointments are lower than their 2019 levels.
Figure 4.5. NHS inputs and outputs in January–June 2023 relative to 2019
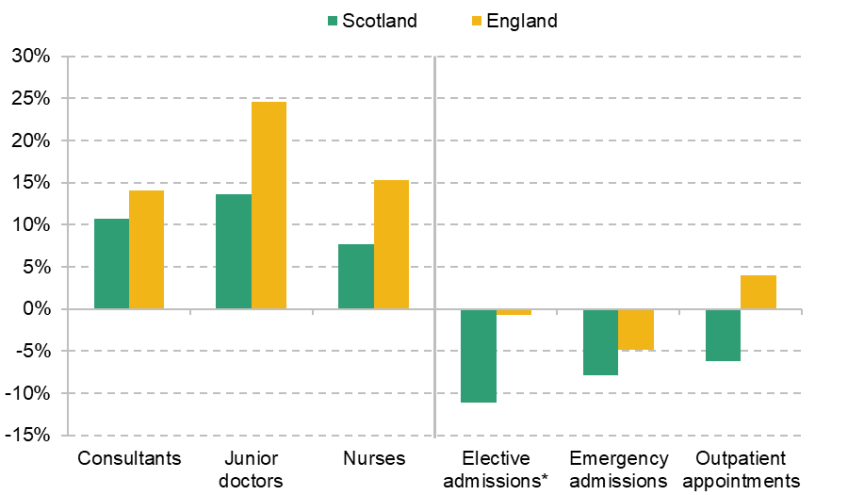
Note: These are not the latest data for England, but chosen to be comparable to the data for Scotland. For closer comparability to England, elective admissions combine day cases and elective inpatient admissions for Scotland. * Elective admissions for England also include maternity and other admissions.
Source: TURAS Data Intelligence, 2023; Public Health Scotland, 2023a.
This points to a large reduction in hospital productivity in Scotland, in the sense that more staff are treating fewer patients – a crude measure of labour productivity.5 Lower productivity means the NHS can deliver less care for the same level of funding, or requires larger increases in funding to achieve increases in activity. When productivity appears to be going down in a public service that is as large and as important as the NHS, it is particularly concerning and especially so given the challenging fiscal situation the Scottish Government faces, as discussed in Chapter 3 of this report.
Turning to England, there was a much larger increase in NHS staffing over the same period. For example, the number of full-time-equivalent nurses was 8% higher than pre-pandemic levels in Scotland but 15% higher in England. The English NHS also had a smaller reduction in admitted patient volumes over this period, and outpatient volumes were above pre-pandemic levels. Note that this is not the most up-to-date data for England, since Scottish data are produced with a greater lag. More recent English data on patient activity are even higher (Warner and Zaranko, 2023a).
Taken together, the data suggest that NHS productivity has fallen by broadly the same amount in both Scotland and England. England has increased staffing by more than Scotland, but also has correspondingly higher treatment volumes – consistent with broadly the same reduction in activity per staff member.
NHS productivity has been widely discussed in England (Warner and Zaranko, 2022 and 2023a; Freedman and Wolf, 2023). This has in part led the Chancellor, Jeremy Hunt, to launch a review of public sector productivity more broadly. Many potential explanations for the observed fall in productivity have been proposed, but as yet there is no conclusive evidence of what the primary reasons are.
One likely explanation for part of the fall in productivity is that although staffing has increased substantially, other inputs have not increased to the same extent. In both Scotland and England, staffing has increased by far more than the number of hospital beds. In April–June 2023, NHS Scotland had 1.9% fewer hospital beds than pre-pandemic (Public Health Scotland, 2023a), compared with 8–14% more staff in the three key clinical staff groups. It seems plausible that additional staff are less effective at increasing activity if there are not additional hospital beds and other inputs for them to use, particularly if there is little spare capacity. This suggests that other inputs should be prioritised rather than just increasing staffing further.
Another potential explanation is that patients now have more severe and complex health conditions than pre-pandemic. If each hospital admission or outpatient appointment requires more healthcare to be delivered, this could explain why more staff are delivering a smaller number of admissions and appointments. In this case, productivity may not have fallen, because the actual level of healthcare being delivered may not have fallen, even though measured activity has. However, the change in severity would have to be substantial to fully explain the fall in measured NHS productivity in either Scotland or England. Evidence from England suggests that although there has been an increase in severity, the increase is in line with pre-pandemic trends (Mooney et al., 2023).
Hospitals are also still treating a non-trivial number of patients with COVID-19, and this may reduce hospital productivity. Evidence from England finds that COVID patients on average spent 8.6 more days in hospital than non-COVID emergency admissions in 2022, adjusting for age and clinical complexity (Mooney et al., 2023). These longer stays reduce the number of other patients that can be treated. Indirectly, measures to prevent the spread of COVID-19 within hospitals, such as the use of PPE and testing those with COVID-like symptoms, may also hinder the ability of staff to treat non-COVID patients.
Difficulties in discharging patients, and more generally issues in patient flow, may also be reducing NHS productivity. If beds are occupied by patients who no longer need to be in hospital, this will reduce the number of patients that the NHS is able to treat. In November 2023, there were 1,910 people delayed in Scottish hospitals, 28% more than in November 2019 (Public Health Scotland, 2023c).
Overall, the available evidence suggests that NHS hospital productivity in Scotland has fallen: despite large increases in staffing and funding, the NHS is treating fewer patients than pre-pandemic. This fall is similar to the observed fall in hospital productivity in England. There are many potential explanations, but as yet little conclusive evidence for the relative importance of each factor. Nonetheless, improving hospital productivity should be a major policy focus. Unless the causes can be diagnosed and effectively treated, the risk is that the NHS will go on providing less care with the same (or additional) resources.
Waiting times and waiting lists
In the previous subsections, we have focused on hospital activity, i.e. the quantity of care provided. But the quality of hospital activity also matters.6 There are a number of different aspects of quality, including clinical effectiveness and patient experience. Here, we focus on another relevant aspect of quality, the length of time that people must wait for treatment. This is another way of measuring how well the NHS in Scotland is performing.
We first consider waiting lists for pre-planned (elective) treatment from NHS hospitals. Figure 4.6 shows the size of the waiting list for NHS treatment since December 2012, separately for inpatient admissions / day cases and new outpatient appointments.
Both the inpatient and outpatient waiting lists had risen substantially pre-pandemic. In December 2012, there were 45,500 waiting for inpatient treatment and 209,100 waiting for outpatient appointments. In December 2019, this had risen to 80,000 waiting for inpatient treatment and 281,700 waiting for outpatient appointments, increases of 76% and 35% respectively. The inpatient waiting list had risen consistently between 2012 and 2019, while the outpatient waiting list had remained relatively constant after its peak in 2017.
Waiting lists fell slightly at the start of the COVID-19 pandemic, as the number of referrals fell rapidly in the first half of 2020. Waiting lists then started to grow much faster than before the pandemic as referrals overtook treatment volumes. In September 2023, the latest available data, there were 151,100 waiting for inpatient treatment and 525,700 waiting for outpatient appointments. These are both up by almost 90% compared with pre-pandemic levels. Although not directly comparable because different definitions are used for which activity is included, the elective waiting list in England grew by 70% over the same period.
Waiting lists therefore grew rapidly from the middle of 2020, and likely by more in Scotland than in England. This is perhaps not surprising given that funding and staffing are further above pre-pandemic levels in England than in Scotland, and Scotland has had a slower recovery in hospital activity. While elective hospital activity continues to be below pre-pandemic levels (Figure 4.4), waiting lists are likely to continue rising. And even returning to pre-pandemic levels of activity will likely not be enough, because waiting lists were already rising before the pandemic.
As waiting lists have risen, so has the average length of time that people wait for pre-planned treatment. For example, in September 2023, the median wait of someone on the waiting list for day-case or inpatient treatment was 166 days, compared with 54 days in December 2019.
The Scottish NHS has a target that 90% of patients should be treated within 18 weeks of referral. Figure 4.7 shows the percentage of treated patients waiting less than 18 weeks in both Scotland and England. Note again that Scotland’s and England’s data are not perfectly comparable, but the trends are still informative about relative performance of the two healthcare systems.
Figure 4.6. Waiting lists for NHS treatment in Scotland
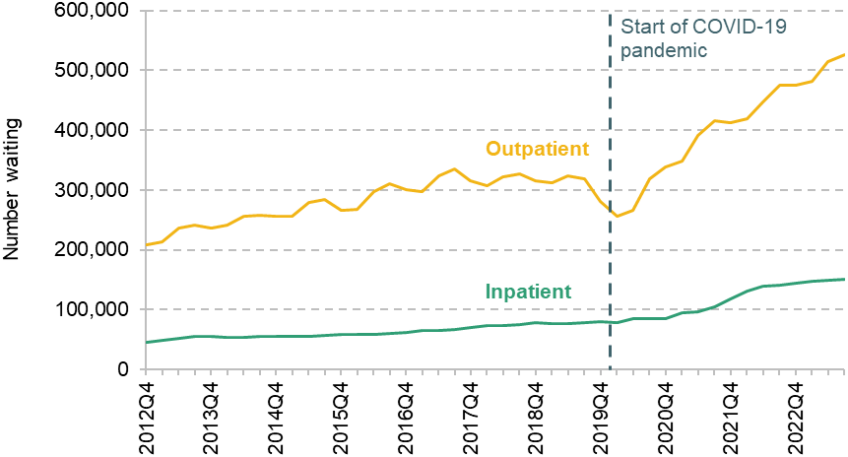
Source: Public Health Scotland, 2023d.
Figure 4.7. Percentage of patients waiting less than 18 weeks

Note: Scottish figures exclude NHS Tayside July to December 2017 and NHS Grampian March 2020 to June 2022. English figures are adjusted for missing data.
Source: Public Health Scotland, 2023e; NHS England, 2023a.
For both Scotland and England, waiting time performance was declining pre-pandemic. In Scotland, 92% of patients were treated within 18 weeks in December 2011, falling to 79% in December 2019. Performance declined steeply during the pandemic, before partially but not fully recovering. In the latest available data, for September 2023, 68% of patients were treated within 18 weeks in Scotland.
Waiting time performance has therefore declined substantially in Scotland since the start of the COVID-19 pandemic. As with the total size of the waiting list, this is unlikely to improve until hospital activity increases significantly above pre-pandemic levels. Although the total waiting list has grown by a smaller amount in England and elective treatment volumes are higher, Figure 4.7 suggests that waiting time performance has declined by more in England than in Scotland.
It may seem surprising that waiting times have worsened more in England, despite Scotland having a slower recovery in elective activity and, if anything, a larger increase in the total size of the waiting list. However, the relationship between the size of the waiting list and the distribution of waiting times is complex. It is possible for the waiting list to rise and the share waiting less than 18 weeks to either rise, fall or stay the same. Much depends on which types of patients are prioritised to receive treatment. Both health systems have introduced targets to eliminate the longest waits first. This is an important objective, but on its own will not improve performance against the 18-week target.
Figure 4.8. Percentage of patients waiting less than four hours in A&E departments
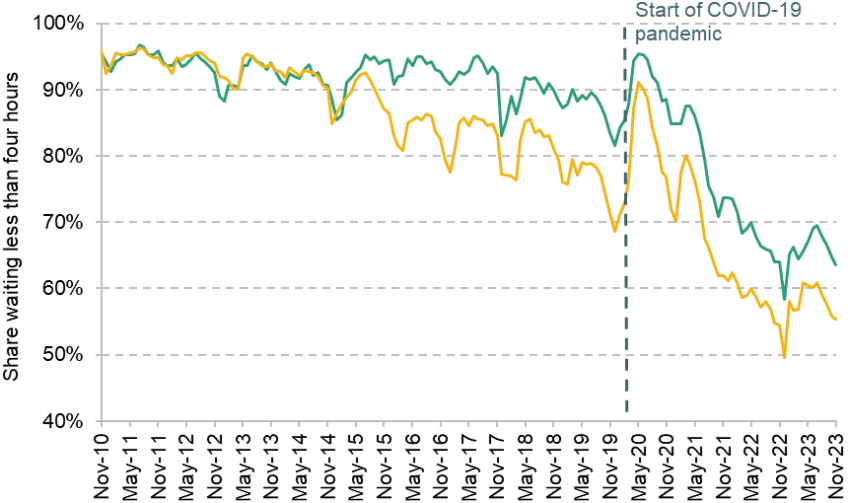
Note: Only includes major ‘type 1’ A&E departments.
Source: Public Health Scotland, 2023f; NHS England, 2023b.
Finally, we consider the times that individuals have to wait to receive emergency healthcare in Accident and Emergency (A&E) departments. The Scottish NHS has a target that 95% of people attending A&E should be treated within four hours. Figure 4.8 shows the percentage of patients waiting less than four hours in major A&E departments in both Scotland and England.
As with elective waiting times, A&E waiting time performance was declining in both Scotland and England pre-pandemic, but by more in England. In February 2020, 85% of A&E attendances in Scotland waited less than four hours, while the figure was 73% in England.
Since the start of the COVID-19 pandemic, A&E waiting time performance has decreased further in both countries. In November 2023, 64% of patients waited less than four hours in Scotland, and 55% waited less than four hours in England. A&E waiting time performance was therefore worse in England than in Scotland. But Scotland started from a much higher pre-pandemic baseline, and so the decline in performance since the start of the pandemic was substantially greater in Scotland.
This section has shown that NHS performance, as measured by waiting times and waiting lists, has declined substantially in Scotland since the start of the pandemic. While hospital treatment volumes remain below pre-pandemic levels, it is likely that the elective waiting list will continue to grow. England has seen a smaller increase in the elective waiting list than Scotland since the start of the COVID-19 pandemic, but elective and A&E waiting times are somewhat better in Scotland than in England. This suggests that neither healthcare system is obviously performing better than the other, while all indicators consistently point to both healthcare systems doing much worse than pre-pandemic despite an increase in resources.
4.3 The outlook
In this section, we consider the outlook for Scottish healthcare spending and workforce in the coming years. We have long known that an ageing population, as well as pressures on the costs of providing services, will mean health spending would have to increase over time to maintain the same service provision. Our medium-term analysis of the funding outlook for Scotland contained in Chapter 3 of this report shows that health is set to squeeze the funding available for other services, even under relatively modest assumptions about growth in healthcare spending over the next four years.
Over the very long term, the Scottish Fiscal Commission (2023) projects that health spending will grow from 35% of the Scottish Government budget in 2027–28 to 50% by 2072–73. This is equivalent to an average 2.6% a year real-terms growth in funding. These increases are mainly driven by higher real wages paid to healthcare staff and other cost pressures, although demographic pressures are also projected to increase costs in the 2030s and 2040s.
Last year, the UK government set outs its NHS long-term workforce plan for England, covering 2021–22 to 2036–37. For the first time, this set out official estimates of how large the government thinks the NHS should be over time (as opposed to fiscal watchdogs’ estimated spending pressures). The plan aims to increase the number of staff employed by the English NHS from 1.5 million in 2021–22 to between 2.3 and 2.4 million in 2036–37. This is a 58–64% total increase in staffing, equivalent to an annual increase of between 3.1% and 3.4% per year. Warner and Zaranko (2023b) estimate that under a central set of assumptions, this implies an average real-terms spending increase of 3.6% per year.
The Scottish Government set out its own National Workforce Strategy for Health and Social Care in Scotland in 2022. This included far less modelling than the English plan, but set out an objective to grow the NHS workforce in Scotland by 1% over five years. Over the same period, the English plan implies a workforce growth of 20–21%. Recently, the Scottish Cabinet Secretary for NHS Recovery, Health and Social Care said that he did ‘not anticipate any significant workforce growth over the medium term’, in part given the large increases in workforce since the start of the pandemic (Scottish Government, 2023b).
There is therefore a striking difference in NHS workforce plans between the Scottish and UK governments – the English plan wants to increase the NHS workforce by around 20% over five years, while the Scottish plan wants to increase it by 1%. Some of this may be explained by the English NHS having larger unmet need for staffing than Scotland, but the Scottish workforce also has rising agency and bank staffing costs.
It is likely that the Scottish Government will face pressure to increase NHS staffing in the coming years. On the available metrics, the post-pandemic performance of the Scottish NHS is close to England’s, and the post-pandemic recovery of hospital activity is still lagging behind England. This suggests that Scotland is likely to need to either up its planned increases in staffing and spending, find ways to boost productivity significantly faster than is being planned in England, or live with a relative deterioration in NHS service quality. But lower hospital productivity since the start of the pandemic also suggests that Scotland should ensure there is sufficient investment in capital and other inputs, alongside additional staffing.
References
Farquharson, C., Phillips, D. and Zaranko, B., 2021. Public service spending in Scotland: trends and key issues. IFS Report BN323, https://ifs.org.uk/publications/public-service-spending-scotland-trends-and-key-issues.
Freedman, S. and Wolf, R., 2023. The NHS productivity puzzle: why has hospital activity not increased in line with funding and staffing? Institute for Government, https://www.instituteforgovernment.org.uk/publication/nhs-productivity.
Lewis, J., 2023. The cap on medical and dental student numbers in the UK. House of Commons Library, Research Briefing 9735, https://researchbriefings.files.parliament.uk/documents/CBP-9735/CBP-9735.pdf.
Mooney, A., Keith, J., Marszalek, K., Stafford, M., Gardner, T. and Tallack, C., 2023. What’s driving increasing length of stay in hospitals since 2019? Health Foundation, https://www.health.org.uk/publications/long-reads/what-s-driving-increasing-length-of-stay-in-hospitals-since-2019.
NHS England, 2023a. Consultant-led referral to treatment waiting times data 2023–24: November 2023. https://www.england.nhs.uk/statistics/statistical-work-areas/rtt-waiting-times/rtt-data-2023-24/.
NHS England, 2023b. A&E attendances and emergency admissions: December 2023. https://www.england.nhs.uk/statistics/statistical-work-areas/ae-waiting-times-and-activity/.
Phillips, D., 2021. How and why has the Scottish Government’s funding changed in recent years?, IFS Report BN321, https://ifs.org.uk/publications/how-and-why-has-scottish-governments-funding-changed-recent-years.
Public Health Scotland, 2023a. Acute hospital activity and NHS beds information (quarterly). https://publichealthscotland.scot/publications/acute-hospital-activity-and-nhs-beds-information-quarterly/acute-hospital-activity-and-nhs-beds-information-quarterly-quarter-ending-30-june-2023/data-explorer/.
Public Health Scotland, 2023b. Primary care in-hours general practice activity visualisation. https://www.publichealthscotland.scot/publications/primary-care-in-hours-general-practice-activity-visualisation/primary-care-in-hours-general-practice-activity-visualisation-as-at-31-october-2023/.
Public Health Scotland, 2023c. Delayed discharges in NHS Scotland monthly. https://www.publichealthscotland.scot/publications/delayed-discharges-in-nhsscotland-monthly/delayed-discharges-in-nhsscotland-monthly-figures-for-november-2023/.
Public Health Scotland, 2023d. NHS waiting times – stage of treatment. https://publichealthscotland.scot/publications/nhs-waiting-times-stage-of-treatment/stage-of-treatment-waiting-times-inpatients-day-cases-and-new-outpatients-5-september-2023/.
Public Health Scotland, 2023e. NHS waiting times – 18 weeks referral to treatment: quarter ending September 2023. https://publichealthscotland.scot/publications/nhs-waiting-times-18-weeks-referral-to-treatment/nhs-waiting-times-18-weeks-referral-to-treatment-quarter-ending-30-september-2023/.
Public Health Scotland, 2023f. Accident and emergency – November 2023. https://publichealthscotland.scot/our-areas-of-work/acute-and-emergency-services/urgent-and-unscheduled-care/accident-and-emergency/#section-1.
Scottish Fiscal Commission, 2023. Fiscal Sustainability Report – March 2023. https://www.fiscalcommission.scot/publications/fiscal-sustainability-report-march-2023/.
Scottish Government, 2022. Health and social care: national workforce strategy. https://www.gov.scot/publications/national-workforce-strategy-health-social-care/.
Scottish Government, 2023a. Government Expenditure and Revenue Scotland 2022–23. https://www.gov.scot/publications/government-expenditure-revenue-scotland-2022-23/.
Scottish Government, 2023b. Health, Social Care and Sport Committee: pre-budget scrutiny 2024-25. Letter from Cabinet Secretary for NHS Recovery, Health and Social Care to Convenor of Health, Social Care and Sport Committee, https://www.parliament.scot/-/media/files/committees/health-social-care-and-sport-committee/correspondence/2023/pre-budget-scrutiny-202425-response.pdf.
TURAS Data Intelligence, 2023. NHS Scotland workforce. https://turasdata.nes.nhs.scot/data-and-reports/official-workforce-statistics/all-official-statistics-publications/05-december-2023-workforce/dashboards/nhs-scotland-workforce/.
Warner, M. and Zaranko, B., 2022. NHS funding, resources and treatment volumes. IFS Report R236, https://ifs.org.uk/publications/nhs-funding-resources-and-treatment-volumes.
Warner, M. and Zaranko, B. 2023a. Is there really an NHS productivity crisis? IFS Comment, https://ifs.org.uk/articles/there-really-nhs-productivity-crisis.
Warner, M. and Zaranko, B. 2023b. Implications of the NHS workforce plan. In C. Emmerson, P. Johnson and B. Zaranko (eds), The IFS Green Budget: October 2023. https://ifs.org.uk/publications/implications-nhs-workforce-plan.
Zaranko, B., 2021. An ever-growing NHS budget could swallow up all of this week’s tax rise, leaving little for social care. IFS Comment, https://ifs.org.uk/articles/ever-growing-nhs-budget-could-swallow-all-weeks-tax-rise-leaving-little-social-care.
Endnotes
Authors

David Phillips
David is Head of Devolved and Local Government Finance. He also works on tax in developing countries as part of our TaxDev centre.

Max Warner
Max joined the IFS in 2020. His work covers health and social care, public spending and public sector productivity.
More from IFS
Understand this issue


Policy analysis


Academic research


