
Downloads

Download report PDF
PDF | 799.81 KB
Key findings
1. The new Chancellor, Rachel Reeves, has inherited an unenviable public finance situation. Taxes are at a historic high by UK standards and yet debt is high, rising and only barely forecast to decline in five years’ time, while many public services are showing obvious signs of strain.
2. This is due to an unwelcome combination of factors that were largely apparent prior to the election. In the March 2024 Budget, annual debt interest spending was forecast to be around 1.4% of national income (£39 billion in today’s terms) higher over the next few years than the period running up to the pandemic. At the same time, annual spending on state pensions and social security benefits was forecast to run 1.1% of national income (£32 billion in today’s terms) higher than in 2019–20. The increase in spending on benefits to support those with disabilities and health-related conditions was particularly big – and worrying. Meanwhile, spending on the NHS continues to rise and, for the first time in many decades, the defence budget seems more likely to be increased than cut.
3. There is likely scope for additional, well-directed, growth-enhancing public sector investment. There is widespread speculation that Ms Reeves will redefine the scope of her debt rule to allow more borrowing to fund this additional investment. Many options are available, with principled arguments for and against each. Of course, redefining targets does not change the fiscal reality and, whatever the headline target, public sector net debt cannot be allowed to rise indefinitely.
4. The specific measure chosen matters less than making a coherent case for why the government should be borrowing to pay for more investment, rather than prioritising investment within a framework that has debt falling (as Ms Reeves declared was her intention before the general election). Perhaps most importantly, the government should then focus on ensuring that the increased investment budget is – and is seen to be – spent effectively.
5. While choosing an easier-to-meet target for the public sector balance sheet would allow Ms Reeves to finance additional investment spending with higher borrowing, she would still find herself constrained by her commendable commitment to aim to meet all day-to-day spending out of revenues, i.e. to aim for current budget balance over the medium term.
6. Under Citi’s baseline economic scenario and assuming most pressures identified at July’s spending audit prove transitory, and after accounting for specific tax and spending measures in Labour’s manifesto, the forecast current budget surplus in 2028–29 could be £17 billion, or 0.5% of national income. But these restrictive assumptions on spending would still leave spending on some public services falling – even though they already include a £14 billion top-up to plans from the March Budget to fund public sector pay deals and deliver specific manifesto commitments.
7. This would leave the Chancellor with little room for manoeuvre, but the uncertainty around this is illustrated by what happens under different assumptions about the economy. Under Citi’s optimistic scenario, that £17 billion surplus turns into a £40 billion surplus. Under Citi’s pessimistic scenario, it turns into a deficit of £16 billion. All of these incorporate the same, restrictive assumptions on public spending and include tax rises of £9 billion from the manifesto.
8. If the government wishes to avoid real-terms cuts to day-to-day budgets for all public services, an additional top-up of £16 billion in 2028–29 would be required (on top of the £14 billion to pay for public sector pay deals and specific manifesto commitments). In the economic environment of Citi’s baseline scenario, this would wholly consume the current budget surplus, and leave debt on a rising path – with or without a top-up to investment budgets to allow them to escape cuts as well.
9. But this ‘stand-still’ solution may well prove incompatible with ambitious targets for service performance. Ensuring all departments see their day-to-day budgets rise at least in line with national income would require a further top-up of £17 billion (i.e. a total top-up of £47 billion relative to March spending plans, or £14 billion plus £16 billion plus £17 billion). Combining this with a fresh £16 billion (0.5% of national income) tax rise would restore the forecast current budget to balance in 2028–29. This would, of course, need to come on top of the £9 billion of specific tax rises set out in Labour’s manifesto, so would be a tax rise of around £25 billion in total. A net tax rise of this scale would be bigger than in the July 1997 (£14 billion) and October 2010 (£13 billion) Budgets, both of which took place early in the parliament of a new government.
10. A longer-term focus beyond the five-year forecast horizon might promote better policymaking. By the end of the parliament, the target year of the fiscal rules will have moved forwards to 2033–34. Based on projections from the Office for Budget Responsibility (OBR), the current budget could by then be in deficit by 1.6%, reflecting spending pressures on areas such as healthcare, and the predictable disappearance of tax bases for fuel duties (as electric vehicles become increasingly common) and tobacco duties. In other words, further tax rises or spending cuts could be required before the end of the parliament to meet the government’s current budget rule and address known, long-term fiscal pressures.
11. Well-designed policies can promote higher economic growth, and more growth would ease some of the sharpest fiscal trade-offs we face. A ‘Budget for investment’ could undoubtedly find some opportunities for productivity-enhancing projects in the UK. But not all investment is growth-enhancing, and the OBR’s model suggests the growth-promoting effect of the average public investment project is neither huge nor swift to materialise. It estimates that a sustained boost to public sector investment of 1% of national income would add less than 0.08% to the sustainable annual growth rate over the next five years and less than 0.05% over the next fifty. As a result, the average public investment project would take a long time to be self-financing.
12. Policymakers have often chosen to prioritise other objectives over growth – for example, accepting barriers to trade in return for more regulatory sovereignty when it comes to the EU single market and customs union. The new government’s manifesto commitments on industrial strategy suggest it will balance a whole host of objectives alongside growth, including lower-carbon production processes, reduced geographical inequality, and improved resilience in crises. These are all entirely valid objectives, but government should acknowledge the very real trade-offs involved.
2.1 The fiscal inheritance
At the start of a new parliament, we find ourselves with elevated public spending, debt only just forecast to stabilise over the five-year forecast horizon, taxes at historic highs and yet the public realm seems to be creaking. To understand why the new government finds itself with such an unenviable fiscal inheritance, it is instructive to trace out briefly how these trends arose, and some of the drivers behind them.
Despite falling from its peak during the COVID-19 pandemic, total public spending – a measure of the size of the state, shown in Figure 2.1 – remained elevated at 44.7% of national income in 2023–24. This is substantially higher than in 2019–20 on the eve of the pandemic and after a decade of austerity (39.6%) and in 2007–08 on the eve of the global financial crisis (40.3%). At the March 2024 Budget, the previous government was planning to cut the size of the state through a combination of planned real-terms cuts to the day-to-day budgets of unprotected departments and a cash-terms freeze in net investment spending that would see it falling as a share of national income. However, total government spending in 2028–29 was still forecast to be almost 3% higher as a share of national income than before the global financial crisis or before the COVID-19 pandemic.
Figure 2.1. Spending, non-debt-interest spending, revenues and taxes: out-turn and March 2024 forecast

Note: ‘Taxes’ refers to the National Accounts definition and includes National Insurance contributions and other compulsory payments to the government that do not directly correspond to a service.
Source: Office for Budget Responsibility, public finances databank (July 2024), https://obr.uk/data/.
One major factor behind this increase in government spending is higher spending on debt interest. Over the first 20 years of this century, we were spending on average just 2% of national income on debt interest, even as the stock of debt increased massively. That changed in 2022–23 when debt interest spending spiked to levels last seen just after the end of the Second World War, in part reflecting high inflation pushing up debt servicing costs for the approximately one-quarter of UK government debt linked to growth in the Retail Prices Index. Even after this spike had passed, debt interest spending was forecast to remain above 3% of national income at least through to 2028–29, as shown in Figure 2.2.
Figure 2.2. Public spending on benefits (split into working-age and pensioner from 1978–79) and debt interest, as a share of national income

Source: Office for Budget Responsibility, public finances databank (July 2024), https://obr.uk/data/; Department for Work and Pensions, benefit expenditure and caseload tables 2024 (May 2024), https://www.gov.uk/government/publications/benefit-expenditure-and-caseload-tables-2024.
But even if we set aside the rising costs of servicing debt, non-debt-interest spending was forecast to be 3.5% of national income higher in 2024–25 than on the eve of the pandemic or on the eve of the global financial crisis (as shown in Figure 2.1). Figure 2.2 also shows the level of public spending on social security benefits and state pensions (split, where possible, into payments to working-age households and payments to pensioner households) over time. As a share of national income, a very sharp increase in benefit spending in the late 2000s was reversed over the 2010s. Over this period, there were substantial reductions to the generosity of the working-age benefits system through several years of below-inflation uprating of many benefits and thresholds and through specific reforms, such as reductions in the amount of support some families could receive for their rents and the gradual roll-out of the two-child limit and the removal of the family element (see Chapter 6). In total, reforms implemented between 2010 and 2019 reduced the annual generosity of the benefit system by £987 per household, or £28 billion (in 2024 prices).1 Since the eve of the pandemic, this fall has reversed and the share of national income spent on social security benefits and state pensions has increased by more than 1% and is now running at around 11.0% of national income, compared with 9.9% of national income in 2019–20.
In addition, spending on the NHS continues to grow and is now around 1% of national income above the level in 2018–19. Unlike in the two decades following the end of the Cold War, spending on defence has gone up somewhat as well in recent years. Pressure to spend more on the NHS and defence does not seem likely to go away any time soon. However, the previous government was planning to cut total spending further and reduce the increase relative to 2018–19 to around 1% of national income by 2028–29 – despite ongoing pressures from spending on debt interest and benefits. Delivering these cuts through cuts to unprotected departments – while keeping to stated commitments such as the NHS workforce plan and international agreements in areas such as defence and overseas aid – could prove extremely challenging, given that many services already seem to range from creaking to full-blown crisis (Institute for Government, 2024).
Taxes also rose sharply over the previous parliament to help meet the growing financing demands of higher public spending, as shown in Figure 2.1. The total tax take stood at 36% of national income in the year ending in March, which is 3% of national income higher than the level in 2019–20. Despite a series of high-profile tax cuts implemented by the previous Chancellor, Jeremy Hunt, tax revenues were forecast to continue increasing further through to 2028–29. More broadly, while the UK’s appetite for public spending has increased substantially over the course of the 21st century and is now in line with the average of other advanced economies, so far this has not been fully matched by a willingness to meet other countries’ average tax take. As a result, public debt has increased by over 60% of national income since the turn of the century – the second-highest increase among 37 comparator advanced economies (Emmerson, Mikloš and Stockton, 2024a).
Going forward, public sector net debt is only forecast to stabilise by 2028–29, rather than to be on a decisively downward path (see Figure 2.3 later). This is despite Mr Hunt’s plans for borrowing to fall (as shown by the narrowing of the gap between total spending and total revenues in Figure 2.1, and shown directly in Figure 2.4). A combination of low forecast economic growth and high interest rates means much tighter fiscal policy is required to get debt falling. Since these forecasts, the new Chancellor’s ‘spending audit’ has quantified additional spending pressures, including higher public sector pay awards and (yet again) much-higher-than-budgeted spending by the Home Office (Warner and Zaranko, 2024). The fiscal situation already looked challenging at the time of the March 2024 Budget, but additional spending pressures have, if anything, added to the difficulties.
In the following sections, we set out some of those challenges, and Ms Reeves’s options for addressing them, in more detail. Section 2.2 describes what we know about her fiscal rules, how they compare with Mr Hunt’s, and what changes she might consider. Section 2.3 sets out some of the risks and pressures on different areas of spending and tax. Section 2.4 then analyses the impact that each of Citi’s three economic scenarios (set out in Chapter 1) might have on the public finances and characterises some of the options that might plausibly be available to Ms Reeves in her first Budget. Section 2.5 considers a longer-term horizon, with a particular focus on growth-enhancing policies and how they might ease some of the most difficult fiscal trade-offs. Section 2.6 concludes with some recommendations for the new Chancellor.
2.2 The Chancellor’s new fiscal rules
The Labour manifesto commits the new government to two ‘non-negotiable’ fiscal rules, which have since been reaffirmed in Ms Reeves’s speech alongside her spending audit:
- to get debt falling as a share of national income by year 5 of the forecast (the debt rule); and
- to bring the current budget into balance (the borrowing rule).
The debt rule looks similar to the ‘fiscal mandate’ that the previous government was committed to – indeed, at first glance it looks identical. However, the government has so far declined to confirm technical details, and they could make a considerable difference to the ease with which the rule might be met. Most of the content of the next subsection has been pre-released as a standalone piece (Emmerson et al., 2024).
Targeting a different measure of debt
One possible such technical change – and one that has received a lot of attention recently – would be to target a different measure of debt. In practice, this could mean a number of different things. The previous government’s fiscal rule targeted public sector net debt excluding the contribution of the Bank of England’s balance sheet (PSND ex BoE, often called ‘underlying debt’). The largest component of this contribution that is excluded from the measure is loans made by the Bank to large companies under the Term Funding Scheme.
Previous governments have targeted ‘headline’ public sector net debt (PSND; see Stockton and Zaranko (2024) for a detailed explanation of the difference between PSND and PSND ex BoE). Alternatively, the government could decide to strip out further components from the measure of debt used in its fiscal rule. Examples of debt the government may want to exclude from consideration include any debt taken on by publicly owned or underwritten banks such as the new ‘National Wealth Fund’, or any valuation losses associated with the Bank of England’s quantitative easing programme.
Or, if the government is keen to recognise better the benefits of investment as well as the costs – as Ms Reeves indicated in her recent Labour Party conference speech2 – it could target a broader measure of the government balance sheet. One option would be to target public sector net financial liabilities (PSNFL). Another would be to target public sector net worth (PSNW). PSND nets off the value of liquid financial assets (those that can readily be converted into cash, such as foreign exchange reserves) from the value of the national debt (defined as the public sector’s loan liabilities, debt securities, currency and deposit holdings). PSNFL provides a slightly broader picture, by also netting off illiquid financial assets (such as the student loan book, and the assets held by funded public sector pension schemes, which are less easy to convert into cash) and a broader range of financial liabilities (such as the liabilities associated with funded pension schemes). PSNW provides a broader picture still, by also netting off the estimated value of non-financial assets (such as buildings, roads and other transport infrastructure). The evolution of these three different measures of the balance sheet, along with the March 2024 forecasts from the Office for Budget Responsibility (OBR), are shown in Figure 2.3.
Figure 2.3. Different measures of the public sector balance sheet: out-turn and March 2024 forecast

Source: Office for Budget Responsibility, public finances databank (July 2024), https://obr.uk/data/.
There is a debate to be had about the merits of targeting each of these measures (we consider some of the most important ones below). Notably, a commitment to have regard for all of them is already legislated – although it tends to garner far less attention than the main fiscal rules.
But the government will presumably also have (at least) one eye on the impact that adopting each of these measures for the main fiscal rule might have on the government’s ability to borrow to invest. To that end, Table 2.1 shows how the government would have been performing against a range of fiscal rules in March 2024 (had it replaced PSND ex BoE with an alternative measure without making any other changes to the structure of the rule). A switch to headline PSND would have added around £16 billion of so-called ‘headroom’ in March 2024; a switch to PSNFL would have added £53 billion; and a switch to PSNW would have added £58 billion.
Table 2.1. Performance against various fiscal rules, as of March 2024 Budget
Fiscal rule | Margin (‘headroom’) against rule in March 2024 Budget | Difference in ‘headroom’ relative to previous debt target |
PSND ex BoE falling as a share of GDP | 0.3% of GDP | - |
PSND falling as a share of GDP in year 5 of the forecast (2028–29) | 0.8% of GDP | +0.5% of GDP |
PSNFL falling as a share of GDP in year 5 of the forecast (2028–29) | 1.9% of GDP | +1.6% of GDP |
PSNW rising as a share of GDP in year 5 of the forecast (2028–29) | 2.0% of GDP | +1.8% of GDP |
Memo: current budget balance in year 5 | 0.4% of GDP | +0.1% of GDP |
Note: Figures may not sum due to rounding.
Source: OBR public finances databank (September 2024), https://obr.uk/data.
There are three things to note. First, any increase in ‘headroom’ against these targets would not allow for a large increase in borrowing to fund tax cuts or day-to-day spending, because the government would still be bound by its promise to bring the current budget into balance (a target against which the government would have had just £14 billion of ‘headroom’ in March 2024). Second, just as a target that requires PSND ex BoE to be falling between year 4 and year 5 of the forecast suffers from major design flaws (flaws which have been extensively discussed elsewhere3), so too would a target for PSNFL to be falling, or PSNW to be rising, between year 4 and year 5. Third, just because a change to targeting PSNFL or PSNW might add as much as £50 billion to the government’s measured ‘headroom’, this does not mean that the government should increase borrowing by anything like that amount. Indeed, always aiming to have a stock measure (such as debt) falling by the finest possible margin (to ‘max out’ any ‘headroom’) breeds an environment where policy flip-flops in response to highly uncertain changes in the forecast.
Relatedly, there is no reason to think that the relative magnitude of the fall in these different measures of debt would look similar in future forecasts. Just because it is easier to meet a PSNFL target today does not mean that will always be the case. There is a danger in choosing a fiscal target opportunistically because it gives the desired answer on ‘headroom’ at a particular moment in time. There are costs to frequently changing the fiscal rules, and the new government should use this opportunity to choose a fiscal target it is willing and able to stick to in the longer term.
Reducing the impact of Bank of England operations on the targeted measure
The government may wish to switch to headline debt as the target measure and hence reverse a change made only in 2021. IFS researchers welcomed this change at the time and described debt excluding the Bank of England as a ‘better measure’ (Emmerson, 2021). The change was justified in the 2021 Budget document by saying ‘the government has chosen to focus on PSND ex BoE because excluding the Bank of England’s contributions to public sector net debt through valuations effects associated with its quantitative easing programme and term funding schemes better reflects the impact of government decisions’ and citing the 2021 IFS Green Budget, in which we said that ‘it is often appropriate to focus on debt excluding the Bank of England when evaluating the fiscal situation’ (HM Treasury, 2021; Emmerson and Stockton, 2021b).
The key reason for a switch to ‘headline’ debt as a target (beyond the simple one that it might allow the government to borrow a bit more) would be to reduce the impact of Bank of England operations on performance against the fiscal rule for the next few years. The Bank of England is making losses on its quantitative easing programme, and is therefore making claims on the indemnity provided by the Treasury which underwrites those losses. The recognition of these losses is expected to push up PSND ex BoE over the coming years (including in year 5 of the forecast, the only one relevant for the fiscal rule) but to have a much smaller impact on headline PSND in those years (because a bigger chunk of these losses have already been recognised in PSND in the past – see Stockton and Zaranko (2024) for more detail on the specifics). In other words, targeting PSND ex BoE does not actually succeed in taking losses from quantitative easing out of the equation altogether – as the 2021 Budget document quoted above, and indeed the term ‘excluding the Bank of England’, suggest. Instead, it means the losses are included at a different point in time.
The principled argument for a switch to PSND (or stripping out the impact of Bank of England operations in some other way) rests on the argument that the interaction between these losses and the current debt rule is leading to overly tight fiscal policy. This is where the poor design of the existing debt rule is important. It targets only the change in debt between two years (years 4 and 5 of the rolling forecast period). Losses from the indemnity are lumpy, and if losses are particularly concentrated in the fifth year of the forecast (due to the timing of Bank of England asset sales under quantitative tightening – or more precisely, and even more ridiculously, what the OBR judges the timing of the Bank of England’s asset sales under quantitative tightening might be4), then this would lead to a temporary overstatement of the need for a fiscal tightening. In that case, targeting PSND (or stripping out Bank operations in some other way) might be judged an improvement.
But it is hard to argue that the size or profile of lending under the Term Funding Scheme, which the Chancellor has no control over and which carries little risk of default, should be used to determine constraints on borrowing.
As well as the Bank of England, the government could choose to exclude other parts of the public sector from its fiscal rule. In particular, publicly owned or underwritten banks (including the new National Wealth Fund) are included in the public sector for accounting and statistical purposes, and so their debt counts towards the total. The idea behind the National Wealth Fund is that, with its initial capital injection of £7.3 billion, it will seek to take on more debt (leverage its balance sheet) and undertake speculative investments on government priorities such as the net zero transition – much like any other bank, though with different objectives. But if these public investment banks are constrained by the government’s overall debt target, they may be limited in their ability to take on more debt. Of course, we would not want these banks to become over-leveraged, or to take on too many risks. The question here is whether they are better constrained through other means (such as banking regulation). Other countries – such as Germany – exclude debt taken on by publicly owned or underwritten development banks from their fiscal targets; see King and Jameson (2024) for the argument that the UK should do the same.
Instead of starting from PSND (whether ‘headline’ or ‘underlying’) and excluding some aspects, one might take a different approach and target a broader measure than PSND. We turn now to consider two options.
Target public sector net worth (PSNW)?
Changing the measure of debt used in the fiscal target might allow the government to do more borrowing for investment, but would not in itself change the degree to which the benefits of that investment are recognised.
One option, therefore, would be to target PSNW rather than PSND. The arguments for and against doing so are discussed in detail by Zaranko (2023). The key attraction of a PSNW target is that, by capturing a more comprehensive range of liabilities and assets, it can provide a more complete picture of the impacts of government action (or inaction). So, if the government were to borrow to invest in transport infrastructure, the additional debt taken on would show up in the government’s liabilities, but the value of the assets created (e.g. new roads or railway tunnels) would also be reflected as a non-financial asset within PSNW. It could also give the government greater incentives to invest in higher-quality projects and to manage and maintain its assets better.
There are, however, considerable downsides to a formal, numerical target for PSNW. Interested readers should consult Zaranko (2023), but the key issue is that changes in PSNW might tell us little about the government’s ability to access capital markets or service its debt. Non-financial public sector assets – such as the UK road network, school buildings, prisons, and army barracks – are either extremely difficult to sell, extremely difficult to value, or both. The problem with them being difficult to sell is that they are little use in a fiscal crisis if they cannot be sold off to meet financing needs. The problem with them being difficult to value is that a Chancellor might be more tempted to cut taxes or increase spending in the face of a favourable revaluation (say, if a change in statistical methodology led to the conclusion that the best estimate of the monetary value of the road network is higher than previously thought) than to carry out a fiscal tightening in the light of an unfavourable one.
One option to lessen some of these concerns (previously proposed by Tetlow, Bartrum and Pope (2024)) would be to introduce a target defined in terms of the impact of policy on PSNW, rather than the level of PSNW itself. That would limit the degree to which changes in PSNW unrelated to policy (such as methodological changes in how the road network is valued) induce a fiscal policy response. The problem is, the recorded value of many assets created by government investment (the ‘replacement cost’) bears little relevance to the economic or social value of the asset, or to assessments of fiscal sustainability. In other words, in practice, the measured impact of policy on PSNW might bear little relation to its ‘benefits’.
These are very good reasons why more traditional measures of debt, debt interest and borrowing will remain important for fiscal policy, and ought to be considered alongside any target for PSNW.
Target public sector net financial liabilities (PSNFL)?
Another option would be to target PSNFL, a less comprehensive measure of the balance sheet than PSNW. The key difference between a target for debt (PSND) and a target for PSNFL is that PSNFL also includes illiquid financial assets (such as the student loan book) and a broader range of financial liabilities (such as the liabilities associated with funded pension schemes – but not the much larger liabilities from pay-as-you-go pension schemes or the state pension). Notably, it does not include the kinds of assets that an increase in investment spending is likely to buy – such as energy pylons or hospitals.
Instead, the main theoretical attraction of a PSNFL target is that in capturing a broader range of government assets and liabilities, it provides a more complete picture of the government’s financial position, while removing some of the perverse incentives associated with a narrow focus on PSND (such as the incentive to sell off long-term financial assets for less than their market value, since PSND is reduced by the money raised through the sale but is unaffected by the loss of the asset). In other words, a fiscal rule targeting PSNFL would encourage the government to have greater regard for its financial assets as well as its liabilities.
Table 2.1 shows that in March 2024, a target for PSNFL to be falling in year 5 would have provided the government with more than £50 billion of additional ‘headroom’ relative to the previous government’s target for PSND ex BoE. The difference is largely driven by the differential treatment of student loans. Where student loans are not expected to be repaid, this now (sensibly) scores immediately against public sector net borrowing. But PSND still increases by the full amount loaned out – i.e. even including the amount that is expected to be repaid subsequently. The difference is that the portion of student loans that are expected to be repaid in future are added to the illiquid financial assets captured by PSNFL. So, the same liability appears in both, but in PSNFL this is partially offset by an asset. So when the size of the student loan book increases (e.g. due to growing student numbers or an increase in the amount that students can borrow), PSND will increase by more than PSNFL (or, equivalently, PSND will fall by less than PSNFL).
There are, inevitably, some notable downsides to a PSNFL target. One issue is that, as with PSNW, performance against a PSNFL target would not necessarily be informative about the government’s ability to access capital markets or service its debts. The financial assets included in PSNFL but not PSND are illiquid (like student loans, assets held by the local government pension scheme, or mortgage books acquired during the financial crisis). In a financing crisis, where the government is seeking to sell off assets, these are likely to be less useful than liquid assets such as foreign currency holdings, but more useful than non-financial assets (such as the prisons estate or aircraft carriers, which cannot realistically be sold). For that reason, the concerns raised above about PSNW are less acute for PSNFL, but remain concerns all the same. A situation where PSND were on a permanently rising path, even if counterbalanced by the accumulation of financial assets in the public sector (so, if PSNFL were stable or falling), may still be risky.
Another issue is that departments may also face new incentives to design policies that create financial assets (e.g. student loans rather than a graduate tax to finance higher education) purely because of differences in how the accounting treatment affects ease of compliance with a PSNFL target. There are also methodological challenges to estimating PSNFL (Office for Budget Responsibility, 2016 and 2018). Revisions to PSNFL estimates for past years can be large – for example, in September 2023, estimated PSNFL in 2021–22 and 2022–23 fell by £38 billion and £26 billion, respectively, due to methodological improvements and the incorporation of data on public sector funded pensions that become available with a lag. Forecasts for the future may be even more volatile. This means that measured ‘headroom’ against a PSNFL target – especially one for PSNFL to be falling (since it then matters where you start from) – could be even more prone to wild revisions without a material change in the fiscal situation.
But there is a broader point here. No single measure is a perfect indicator of the health of the public finances, and there is no unambiguously ‘right’ answer. There are principled arguments for and against each of these changes. If the Chancellor really wants her fiscal target to reflect the benefits of investment, that might suggest a target for PSNW. But a formal target for PSNW would come with considerable problems, and we would strongly advise against. Switching to a target for PSNFL would come with fewer problems, and would allow much more space for borrowing for investment (perhaps as much as £50 billion more), but would not meaningfully reflect the benefits of that investment. None of these changes would be costless. Frequent changes to targeted measures risk damaging the transparency and credibility of the fiscal rules, especially if those changes seem opportunistic in the sense that they prevent a bigger fiscal tightening from being enforced. This highlights the importance of ‘future-proofing’ the fiscal rules, and not making a decision based on the very specific set of circumstances faced at one particular fiscal event. Whatever formal fiscal rule the Chancellor chooses, the impact of additional borrowing on debt and debt servicing costs cannot be defined out of existence, or disregarded entirely.
If the government believes it is appropriate to borrow more to spend on some policy priority, then it should not hide behind a ‘technical’ change. If it believes more borrowing is the best – or perhaps only – way to get to net zero emissions and that failure to do so would be more costly than a rising debt path, it should make the case for this. If the government is confident that extra borrowing for investment would be sufficiently growth-enhancing to improve long-term fiscal sustainability, it should make that case (to citizens, as well as to gilt market participants). This could be accompanied by a change in the debt rule to give space for that borrowing and signal the logic behind it, but the crucial thing would be to ensure that the investment funded by that borrowing is – and is widely seen to be – spent well. And regardless of the precise fiscal rules, debt and debt servicing costs cannot be disregarded entirely.
More generally, the government may rightly be concerned that the current debt rule’s conclusions about fiscal ‘headroom’ can swing wildly from one fiscal event to the next even in the absence of significant revisions to economic and fiscal fundamentals. We very much share this concern. But it should then consider the root of this issue: not the measure of debt chosen, but the narrow targeting of the change in debt relative to the change in nominal national income over a 12-month period several years in the future. Put differently, many of the problems identified with the current fiscal framework are downstream of the original mistake – aiming to have debt forecast to fall over the course of one year in five years’ time, and by the finest possible margin relative to the inherent uncertainty.
When might the current budget rule start to bind?
The new government’s debt rule, based on what we know so far, looks similar to the previous government’s rule – although this is not to say yet-to-be-confirmed details could not turn out to be important, as discussed above. In contrast, the rule for borrowing represents a material and certain change. The previous government’s rule (known as the ‘supplementary target’) targeted overall borrowing, whereas the new government’s proposed rule targets the current budget deficit – that is, borrowing excluding government investment. Figure 2.4 shows overall borrowing and the current budget deficit over time, as well as the March 2024 Budget forecast. Both the old and new rules are forward-looking. In other words, they target the forecast level of their preferred measure of borrowing (including or excluding borrowing that can be explained by investment), rather than the out-turn in the current year.
Figure 2.4. Public sector net borrowing and current budget deficit: out-turn and March 2024 forecast

Source: Office for Budget Responsibility, public finances databank (July 2024), https://obr.uk/data/.
In principle, a target on the current budget deficit need not be more or less constraining than a target for overall borrowing. This will depend on the limits chosen for each of the measures. In the present case, the switch from the old government’s rule to the new government’s rule makes the rule more constraining under typical circumstances.
Specifically, the previous government’s rule capped borrowing at 3% of national income in the fifth and last year of the rolling forecast period. This was an extremely loose rule by historical UK standards. Only on four occasions, out of 57 official UK forecasts that reach five years out (going back to Spring 1984), was a Chancellor planning to borrow more than 3% of national income five years out, and all were in the immediate aftermath of a major economic crisis: Black Wednesday when the UK crashed out of the European Exchange Rate Mechanism, the global financial crisis and the COVID-19 pandemic.
The green bars in Figure 2.5 show that in most OBR forecasts since the 2010 Autumn Statement, the previous government’s target to have borrowing forecast to be less than 3% of national income in five years’ time would have been far from constraining. The new government is instead targeting current budget balance in the fifth forecast year – in other words, it aims to cover day-to-day spending with revenues and borrow no more than it spends on investment, bringing the current budget deficit to zero or running a surplus. Such a rule has much to commend it (Emmerson and Stockton, 2021a): its rolling nature allows a Chancellor to ‘look through’ disturbances that are expected to be temporary, and targeting the current budget instead of overall borrowing means that Chancellors are not incentivised to cut investment spending to meet the rule.
Figure 2.5. Margin against the former and new government’s borrowing rules at past fiscal events since November 2010

Note: Margin is forecast year-5 public sector net borrowing minus 3% (for the borrowing rule) and forecast year-5 current budget deficit (for the current budget balance rule). A positive margin indicates a rule would have been met.
Source: Office for Budget Responsibility, historical official forecasts database, https://obr.uk/data/.
Since investment spending typically amounts to less than 3% of national income, current budget balance is a more challenging rule to meet than a 3% cap on borrowing. The yellow bars in Figure 2.5 show the margin against the new government’s current budget balance rule. The rule would on average have been met by a margin of only 0.8% of national income (£23 billion in 2024–25 terms).
In contrast, the previous government’s rule to be on course to borrow less than 3% of national income in five years’ time would, over the period since 2010, have been met by an average of 2.0% of national income (£55 billion in 2024–25 terms). Switching from the old rule to the new rule would, on average, have reduced ‘headroom’ by 1.2% of national income, £32 billion in today’s terms or more than 7% of total day-to-day spending on public services.
At the March Budget, the forecast current budget surplus in 2028–29 – or ‘headroom’ against a current budget balance rule for the fifth forecast year, had it been in place – was £14 billion, or 0.4% of national income (as shown by the very right-hand bar in Figure 2.5). In contrast, overall borrowing was forecast to be 1.8% of national income, meaning that Mr Hunt had ‘headroom’ of 1.2% of national income against his target to be on course to borrow less than 3% of national income five years out – three times as much as against a current budget balance rule. At the time, the borrowing rule was far from binding, as the debt rule was so much more constraining, leaving ‘headroom’ of just £9 billion. It is still true that the debt rule would have been more constraining than a current budget balance rule, had such a rule been in place. But only just – ‘headroom’ against a current budget balance rule would have been just £5 billion higher than against the debt rule in place at the time. A small change in forecast day-to-day spending or revenues would be enough to flip this relationship, meaning that a current budget rule could easily be more binding than the debt rule in its existing form.
In other words, a government willing to amend the debt rule could borrow substantially more to increase investment spending, while keeping to the current budget rule. What changing the debt rule will not do is permit big top-ups to planned day-to-day spending or reductions in the size of future tax increases, as the government’s target for current budget balance would quickly become the binding constraint. As long as the current budget rule remains in place, day-to-day spending increases will have to be funded through tax rises or cuts to other areas – an option that, of course, is also open to those looking to fund additional investment spending.
2.3 Risks and uncertainties
Regardless of their exact definition, the new Chancellor will presumably be meeting her own fiscal rules at the Budget based on the latest official OBR forecast. These forecasts are meant to be a central estimate of the outlook for the public finances over the next five years, but can never perfectly foretell the future. Public services might need top-ups to their budgets to keep them afloat. New policy changes may affect spending on social security benefits and state pensions, and revenues from taxes. Economic growth might surprise us. We could be lucky, and the growth rate could exceed current expectations. However, given that the OBR has been more optimistic than the Bank of England or the average of independent forecasters, it is also at least possible that growth will be a lot slower than the OBR currently forecasts, which would make the fiscal situation even more challenging. Even if expected growth did materialise, revenues could still come in stronger or weaker than forecast depending the composition of that economic growth, and how tax-rich it is. Overall, these uncertainties unfortunately appear asymmetric and will more likely increase spending and reduce revenues than vice versa. Working out which trade-offs to make and how best to navigate an uncertain environment are among the key challenges facing any Chancellor, and this is particularly true in the present climate.
Spending risks
Spending on public services
The March 2024 Budget forecast implied extremely tight spending plans for public services, as we and others have pointed out again and again. Since March, the government has made substantial new commitments on public sector pay. In addition, the July 2024 spending audit highlighted spending pressures in areas such as the asylum system and arising from the previous year’s pay round. Consistent with the findings of the spending audit, in-year out-turn data for government spending are running ahead of the March 2024 forecast. While still provisional, these data indicate that day-to-day central government spending on goods and services over the first five months of the financial year is running £8.5 billion (or 5.1%) ahead of the March 2024 Budget forecast.
Chapter 3 sets out a number of scenarios for spending on day-to-day running costs and investment in public services. Compared with the March 2024 forecasts, it concludes that top-ups of £20 billion by 2028–29 would be required just to cover manifesto commitments and maintain the previous government’s plans to grow spending by 1% in real terms from a new, higher baseline that accounts for recent public sector pay settlements (a ‘status quo’ scenario). This would still sign the government up to sharp cuts to spending plans for ‘unprotected’ areas (outside of health, education, childcare, defence and overseas aid) inherited from the previous government. Delivering these cuts would be painful, and not easy to reconcile with lofty ambitions for performance across a wide range of public services.
As Chapter 3 further sets out, avoiding real-terms cuts to the day-to-day budgets of ‘unprotected’ departments could require another £16 billion of top-ups in addition to the ‘status quo’ scenario. An additional £4 billion would be needed to avoid real-terms cuts to investment spending, which under inherited plans is frozen in cash terms and hence falling in real terms. In other words, an overall top-up to spending plans of £40 billion could be required, just to allow spending to keep pace with inflation after this year.
But it is not hard to make a case that simply maintaining funding in real terms in areas such as further education, courts and prisons will not be enough to deliver significant improvements in service quality envisioned by the government. Similarly, pressures on the public estate – such as the maintenance backlog in the NHS and a need to modernise the prisons estate – may require above-inflation growth in investment budgets. Another benchmark scenario discussed in Chapter 3 is topping up both day-to-day and investment budgets to be constant as a share of national income, which would require an additional top-up of £17 billion for day-to-day budgets and £9 billion for investment budgets (i.e. a total increase of £66 billion over and above the March 2024 estimate of spending in 2028–29).
In other words, assumptions for growth in spending that look quite plausible, and indeed modest compared with the increases under the last Labour government in the 2000s, can easily require large top-ups to spending plans.
Welfare spending
Benefit spending to support people with disabilities and long-term health conditions has been rising since the financial crisis, and rising sharply since the pandemic. Under the OBR’s March forecast, this category of spending is set to continue rising in real terms, albeit not quite as fast as it has done since 2020 (see Figure 2.6). Spending in 2024–25 is now forecast to be £87.2 billion, some £20.8 billion, or 31%, bigger than was forecast just three years earlier in Spring 2021. By the end of the forecast period in 2028–29, spending in today’s prices is forecast to be £100.2 billion, which would be an increase of £36.8 billion, or 58%, relative to what was spent in 2019–20. This extraordinary rise would put substantial pressure on the public finances.
FIgure 2.6. Benefit expenditure to support disabled people and people with health conditions: out-turn and successive forecasts

Source: Department for Work and Pensions, expenditure and caseload forecasts, successive vintages.
The reasons behind the rise are not fully known (Latimer, Pflanz and Waters, 2024). To the extent that it reflects a persistent worsening of population health, it is clearly worrying above and beyond the fiscal implications. Because the rise is so sharp, historically unusual and incompletely understood, the uncertainty around the forecasts for claims and spending is also elevated. For example, if temporary after-effects of the pandemic are an important driver, or if policies aiming to support health and work capability prove very effective, the rise may abate sooner. But conversely, if the underlying drivers are intractable and persistent, the rise may continue at a similar pace to that in the last few years, which would lead to spending being even higher than is currently forecast.
Beyond benefits to support disabled people and those with health conditions, there are other areas of welfare spending where it may prove difficult to stick to current spending plans. One area of pressure comes from cash-terms freezes: currently, both local housing allowance rates (which cap the support claimants can get to help with housing costs) and the benefit cap (which limits the overall amount working-age adults can receive in most benefits each month) are frozen. Such freezes make benefits progressively less generous over time as their value gets eroded by inflation. Pressure to end these freezes will therefore grow.
More broadly, the government has established a child poverty taskforce, in accordance with its manifesto commitment. The strategy that this taskforce publishes in the spring may recommend using a variety of possible tools to reduce or alleviate child poverty – Chapter 6 outlines some of the options, including various options for making the working-age benefits system more generous. Calls to remove the household benefit cap entirely, as well as the two-child limit5 and what is widely referred to as the ‘bedroom tax’, do not represent government policy at the moment, but do provide an indication of the pressure on current welfare spending plans. As shown in Chapter 6, abolishing these policies could come at an annual cost of £0.5 billion for the household benefit cap, £2.5 billion for the two-child limit (or £3.3 billion for the combination of the household benefit cap and the two-child limit), and £0.5 billion for the so-called ‘bedroom tax’. The spending impact will depend entirely on which options are eventually implemented – but it seems unlikely that an effective strategy would only reshuffle spending, and not put any additional money on the table.
Tax risks
Fuel duties: will the uprating charade continue?
The OBR’s March forecast was for revenues from fuel duties to rise from £24.7 billion in 2024–25 to £28.2 billion in 2028–29. Crucially, this assumes that the supposedly temporary 5p cut in main rates of petrol and diesel duties that was first introduced in 2022–23 and twice extended by the previous government, is allowed to expire in March 2025. On top of this, it assumes rates of fuel duties will be increased each April in line with forecast growth in the Retail Prices Index (RPI). This is stated government policy – and hence what the OBR assumes for its central forecast. However, since 2011, it has been traditional for Chancellors to cancel the forthcoming year’s previously planned increase while continuing to accept forecasts that assume rates of fuel duties will rise in future years. The result of the cumulation of these ‘one-year’ freezes is that revenues from fuel duties in 2024–25 are forecast to be an astonishing £19 billion lower than they would have been, had fuel duties been increased in line with growth in the RPI since 2011. In that case, the rate on standard petrol and diesel would have been 101p per litre instead of its current rate of 52.95p (Waters and Wernham, 2024).
In the March 2024 Budget, the OBR pointed out that if it instead assumed that rates of fuel duties continued to be frozen in cash terms, forecast revenues in 2028–29 would be £23.5 billion. This is £4.8 billion lower than currently forecast and would imply receipts from fuel duties falling slightly in cash terms (unsurprising given the ongoing shift towards electric vehicles). Remarkably – as shown in Figure 2.7 – this would mean that revenues from fuel duties would be no higher in cash terms in 2028–29 than they were 22 years earlier in 2006–07. As a share of national income, revenues from fuel duties would be 0.7% of national income, which would be 1.0% of national income – or £32 billion in 2028–29 – below the 1.7% of national income seen on average during the first decade of the 2000s.
Figure 2.7. Outlook for revenues from fuel duties
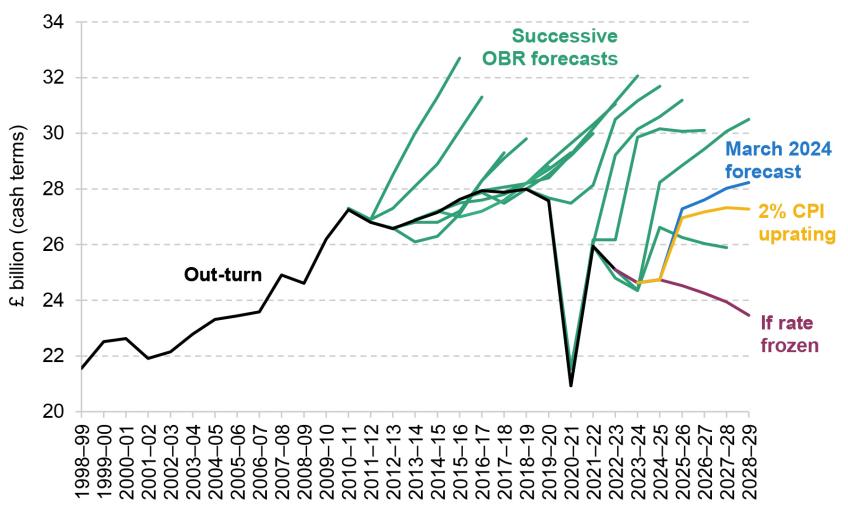
Note: ‘If rate frozen’ refers to a forecast if rates are kept constant in cash terms from their current level – so the ‘temporary’ 5p cut becomes permanent. ‘2% CPI uprating’ refers to the suggestion, described in the text, that rates could be increased by the target rate of CPI (2%).
Source: Chart 4.5 of Office for Budget Responsibility, economic and fiscal outlook (March 2024); authors’ calculations.
Ms Reeves should bring to an end the charade around the future rates of fuel duties. If she plans to freeze fuel duty rates in cash terms going forward, she should announce that and acknowledge that tax revenues will be lower as a result. If she wants to end the temporary 5p cut to rates of fuel duties and to see them increase in line with the RPI in future, she should say that and then stick to it. Choosing either option could provide greater certainty to motorists and businesses around the likely path for rates of fuel duties, and improve the transparency and predictability of the outlook for the public finances.
Allowing the 5p rate cut to expire and increasing rates in line with the RPI would mean that this April would see a sizeable 6.2p increase in the standard rate of fuel duty from 52.95p to 59.15p (or 7.4p after accounting for 20% VAT on fuel duty). But it should also be noted that the average price of a litre of petrol is now 135.2p compared with 145.6p at the start of 20226, prior to Russia’s invasion of Ukraine and the then Chancellor Rishi Sunak’s decision to implement the 5p cut as part of a package of measures to help households and businesses with rising energy prices and the cost-of-living crisis.
Alongside allowing the 5p rate cut to expire, the new Chancellor could take a new approach to how inflation uprating of rates of fuel duties is implemented. The RPI is a discredited measure of inflation7. A better measure – and one that is typically lower – is the Consumer Prices Index (CPI). Furthermore, given that petrol prices change frequently, it is also far from clear why rates of fuel duties should be increased by forecast annual inflation in April and then left fixed in cash terms for the rest of the financial year.
A more modern system could entail fuel duties being increased by monthly inflation each month. This would benefit motorists who prefer a more gradual increase in fuel prices through the year than a one-off bigger increase in April, and this uprating method might make it politically easier for the Chancellor to actually implement inflation increases as there would be less scope for a high-profile campaign against annual uprating in the run-up to a fiscal event. A potential oddity with using the monthly inflation rate is that fuel prices do not increase gradually through the year – for example, they are typically lower in January than in December. This could be smoothed out. Or – even simpler for refineries which remit fuel duties to HMRC – given the target for CPI inflation to be 2% a year, fuel duties could be increased by one-twelfth of 2% on the first of each month (or more precisely by 1.02(1/12) each month). This means that, in the longer term and in expectation, fuel duties would increase in line with CPI inflation, while avoiding sharp increases in times of temporarily elevated inflation, and associated concerns around the cost of living.
Our forecast for fuel duties under this policy option is shown by the yellow ‘2% CPI uprating’ line in Figure 2.7. It would reduce revenues from fuel duties, relative to what is currently forecast, by £1 billion in 2028–29. This would be (roughly) the figure that would appear on the Budget scorecard, signed off by the OBR, and the Chancellor could choose to frame the measure as a £1 billion tax cut for motorists. But relative to the implicit inherited policy position of continuing to announce yet another one-year freeze to rates of fuel duties every year, while continuing to pretend that increases will take place in later years, it would actually lead to a £3.8 billion increase in revenues from fuel duties in 2028–29. Even under this policy, a medium-term strategy to replace revenues from fuel duties – and help manage the cost of congestion – would still be urgently needed as electric vehicles become increasingly prevalent.
Direct tax thresholds
The current forecast is predicated on an unprecedented length of cash-terms freezes to income tax and National Insurance thresholds. Having been announced by then Chancellor Rishi Sunak, these first started in April 2021 (with some additional thresholds being frozen from later points), have been kept in place through the recent period of high inflation and are scheduled to run until 2027–28. These freezes will bring a record number of people into the income tax system or into higher tax brackets. Two-thirds of the adult population are expected to pay income tax in 2027–28, compared with 58% before the series of freezes was introduced. The change has been even starker for higher- and additional-rate income tax payers. The number of people paying the higher or additional rate of income tax has more than doubled, from 6% of the adult population in 2010–11 to 13% now, and is expected to reach 15% by 2028–29. These changes will also affect many pensioners. In fact, due to above-average growth in pensioners’ income and a real-terms fall in the value of their personal allowance, people aged 65 or over were more likely to pay income tax than those aged 16–64 for the first time ever in 2023–24 (Adam, Miller and Upton, 2024). All this may create pressure on the new government to end the planned six-year freeze early. On the other hand, this has been a very big tax rise – the OBR estimates that threshold changes since 2021 raised £26.7 billion more revenue this year, rising to £39.5 billion in 2027–288 – which has encountered very little evident public resistance, and the temptation to continue with it, and perhaps even extend it, will be considerable.
Manifesto commitments
When we go on to describe scenarios for the public finances below, we include Labour’s manifesto commitments on tax (see Table 2.2). In total, these were said to raise £7.4 billion. Recent reports have indicated that the government may have changed its thinking on reforms to ‘non-domiciled’ tax status, and concluded that this may not, in fact, raise any additional revenue. IFS researchers analysed potential reforms in the summer (Adam and Miller, 2024) and stressed that estimates of the potential revenue impacts were highly uncertain and depend on the detail of the policy. But the biggest purported revenue-raiser in the manifesto was a crackdown on avoidance and evasion. This is a perennially popular measure for parties to include in their manifestos, but an uncertain source of revenue. In addition, an extension of the energy profits levy (‘windfall tax’) on energy firms was said to raise an average of £1.2 billion annually, still nominally on a temporary basis. Given that under the OBR’s March forecast, revenues from the levy were already set to decline to £1.4 billion by 2028–29 and the changes (including an increase in the rate from 35% to 38%, and an extension from March 2029 to March 2030) look relatively modest, the policy may be expected to raise less than that amount, especially in later forecast years.
Table 2.2. Tax and spend measures included in the scenarios
Labour manifesto tax rises | Impact on annual borrowing (average) |
VAT and business rates on private school fees | –£1.5 billion |
Reforms to non-domiciled status and reduction in tax avoidance | –£5.2 billion |
Other | –£1.8 billion |
Day-to-day spending increases | 2028–29 direct impact on borrowing |
Manifesto commitments | +£4.8 billion |
Public sector pay deals | +£9.4 billion |
Investment spending increases | 2028–29 direct impact on borrowing |
Manifesto commitments | +£5.6 billion |
Note: Details on costings for spending commitments in Chapter 3. Figures rounded to one decimal place. ‘Other’ includes windfall tax on oil and gas firms.
Source: Labour Party (2024); authors’ calculations.
While precise costings are uncertain, we take the manifesto numbers at face value for the purposes of modelling fiscal scenarios later on in the chapter. One risk to keep in mind, then, is that commitments either will not be implemented (e.g. if the additional reforms to non-domiciled tax status are dropped) or may raise less than estimated in the manifesto. However, these commitments, in aggregate, are modest in scale – so, in quantitative terms, this is unlikely to have major implications for the fiscal outlook.
How much would a stroke of economic luck help?
A key factor determining the government’s room for manoeuvre on tax and spend at the Budget will be the OBR’s updated forecast for growth in the economy, earnings, and other underlying drivers of borrowing. In Citi’s baseline scenario (see Chapter 1), the average economic growth rate between this year and 2028 is forecast to be 1.4%, slightly below the OBR’s March forecast (1.5%) and the same as the consensus of independent forecasters when polled by the Treasury in August (HM Treasury, 2024). In the middle of the forecast period, Citi is much more pessimistic than the OBR. But the difference is much less stark by 2028 when, under Citi’s forecast, economic output would be just 0.6% below the OBR’s March forecast (see Figure 2.8).
Figure 2.8. Forecasts for economic output

Note: Dashed grey line is the average of independent medium-term forecasts from August 2024; grey diamonds are minimum and maximum independent forecasts for 2024 and 2025 from September 2024.
Source: HM Treasury, survey of independent forecasters (August and September 2024); Office for Budget Responsibility, economic and fiscal outlook (March 2024); authors’ calculations.
This would be a disappointing growth performance, to say the least. It would fall well short not just of the longer-term average of 2.7% seen before the financial crisis, but even the 1.9% seen between 2010 and 2019, when poor productivity growth was partly compensated for by strong growth in the size of the working-age population and in average hours worked.
For the public finances, it is not just economic output that matters, but economy-wide inflation, which determines the cash size of the economy for a given amount of output. Since taxes are generally levied on cash amounts, higher growth in cash terms can shield tax revenues from the impact of lower real-terms growth. This is the case when comparing Citi’s baseline scenario with the OBR’s March forecast: the cash economy is forecast to be 0.4% bigger in 2028 than under the OBR’s March forecast.
Citi has also constructed two plausible alternative economic scenarios. In the optimistic scenario, real-terms growth between now and 2029 averages 1.8% per year. This would take us back to growth rates close to those seen over the 2010s, even without the tailwind of strong growth in the size of the workforce. By 2029, real-terms economic output would be 2.3% greater under this scenario than under Citi’s baseline scenario. The pessimistic scenario mirrors this, with economic output 2.3% below the baseline scenario by 2029, and real-terms annual growth rates that, on a sustained basis, would be so weak as to be unprecedented in post-industrial times. This would be the result of there being hardly any growth under this scenario in 2025 or 2026 and with subsequent years not then seeing any ‘bouncing back’ in the form of stronger growth than in the baseline scenario.
In the baseline scenario, we forecast that overall government revenues would be £13 billion higher in 2028–29 than under the March Budget forecast (see Figure 2.9). Of this, £9 billion is due to the inclusion of Labour’s manifesto commitments. The remainder reflects multiple countervailing effects: income tax and National Insurance contributions (NICs) are reduced by £3 billion relative to the OBR March forecast, driven by a lower forecast for employment growth. However, the stock market is forecast by Citi to grow faster than under the OBR March forecast (despite slightly lower real growth and slightly higher cash-terms growth), helping to shore up revenues from capital taxes. While in the long run, growth in the economy and in the stock market tend to align, it is not unusual for the stock market to grow much faster for a period (only to contract sharply later when a recession comes along). In this case, revenues from capital gains tax, stamp taxes and business rates are £4 billion higher in the baseline scenario than under the March Budget forecast. Higher RPI inflation also raises revenues from student loan interest payments.
Figure 2.9. Revenues including manifesto commitment on tax: out-turn and three scenarios

Note: Public sector current receipts shown.
Source: Office for Budget Responsibility, economic and fiscal outlook (March 2024); authors’ calculations.
In the pessimistic scenario, lower growth and the lower earnings, profits and spending associated with it depress revenues by £19 billion relative to the March Budget forecast (despite the inclusion of £9 billion of tax rises from Labour’s manifesto). A weaker economy reduces revenues from income tax, NICs and VAT by £28 billion, before accounting for manifesto commitments. Effects on other taxes largely cancel each other out, in particular since the stock market in this scenario, while weaker than in the baseline scenario, still performs more strongly than under the OBR’s March forecast.
In contrast, in the optimistic scenario, stronger economic performance raises revenues from the three big taxes (income tax, NICs and VAT) by £15 billion compared with the OBR’s March forecast. In total, including the £9 billion impact of revenue-raising manifesto commitments, revenues in the optimistic scenario are £31 billion higher than in the OBR’s March forecast.
2.4 What does this mean for borrowing, debt and the fiscal targets?
Citi’s baseline economic scenario, on its own, does not paint a substantively worse picture for the public finances. But as shown in Table 2.2, the tax rises in the Labour manifesto are forecast to be more than enough to cover the party’s specific manifesto commitments on day-to-day spending, but the increase to investment borrowing pushes up borrowing. Add to this even just the mechanical consequences of public sector pay deals from this year and last that the new government signed up to in July, and debt9 as a share of national income would be higher over the next few years and could still be rising in 2028–29. This means that, had these policies and forecasts been in place back in March, the fiscal mandate would have been missed – recall that the fiscal mandate aims to have debt as a share of national income forecast to be falling between the fourth and fifth years of the forecast. The forecast rise of 0.1% of national income (from 94.3% to 94.4%; see Figure 2.10) is very small relative to the uncertainty around the forecast, and the difference between it and the decline of 0.3% of national income (from 93.2% to 92.9%) in the March Budget forecast is not economically meaningful – even though the latter meant that Mr Hunt was at that time complying with the letter of his fiscal target.
Figure 2.10. Debt under three economic scenarios

Note: Debt excluding the Bank of England (‘underlying debt’) shown. At the Autumn 2024 Budget, the target year of the fiscal rules is set to roll forward to 2029–30.
Source: Office for Budget Responsibility, economic and fiscal outlook (March 2024); authors’ calculations.
At the upcoming Autumn Budget – the first in the fiscal year 2024–25 – the fiscal targets will ‘roll over’ a year: another year will be added to the forecast, and the fiscal mandate will move to targeting the change in the debt-to-national-income ratio between 2028–29 and 2029–30. This rolling-over in itself may be enough for the new government to meet the letter of the fiscal mandate in its existing form. It will depend on many factors, including the OBR’s forecast for nominal growth in that year and the real rate of growth in public service spending that the new Chancellor tells the OBR to assume in that year.
In addition, as discussed in Section 2.2, Ms Reeves may yet choose to change the way debt is measured for the purposes of the fiscal target and, of course, the Budget will contain a package of tax and spending measures that will also affect the outlook for borrowing and debt.
The conclusion that debt would be rising in 2028–29 under Citi’s baseline forecast when it was forecast to fall under the March Budget forecast is partly driven by the forecast profile of growth. In Citi’s baseline forecast, growth in the cash size of the economy in 2028–29 is just 3.4% – roughly the same as the average over the period, but substantially less than in the previous two years. In contrast, under the OBR’s March forecast, cash-terms growth in 2028–29 is 3.7%, the same as or very close to the previous two years, and above the average (which is 3.3%, just as in Citi’s baseline scenario). More cash-terms growth in the target year makes the fiscal mandate easier to meet, because any given increase in debt in £ billion terms will represent a bigger fall (or a smaller rise) in the ratio of debt to cash-terms national income.
This sensitivity of the fiscal mandate to small changes in particular parameters of highly uncertain forecasts means it is not a sensible guide for fiscal policy, as discussed extensively by Emmerson, Mikloš and Stockton (2023 and 2024b) and Johnson (2024). The tendency of the fiscal mandate to ‘flip-flop’ in response to small forecast changes is exacerbated by Chancellors running fiscal policy in an attempt to meet the target almost exactly in recent years, rather than maintain any significant buffer. The fact that a poorly designed fiscal target may flip from ‘just met’ to ‘just missed’ – and may flip back to ‘just met’ through the mechanical consequences of the forecast horizon rolling forward – is not a reliable indicator of the health of the public finances. However, the fact that, under all these forecasts, debt is at best stable over the medium term, with a tight spending settlement and taxes at historically high levels, is another reminder of the difficult fiscal environment that any Chancellor who is serious about reducing debt as a share of national income would find themselves in.
During the general election campaign, Labour committed to a second, much more sensible, fiscal rule requiring that the current budget be forecast to be at least in balance by the end of the forecast – in other words, for the government to be borrowing no more than it is spending on investment. This rule is harder to meet as long as government investment five years out is forecast to be less than 3% of national income, as set out in Section 2.2 above.
Under Citi’s baseline scenario and assuming tight public service spending plans are maintained (the ‘status quo’ scenario from Chapter 3), there would be a small current budget surplus in 2028–29 – similar to the March Budget forecast (Figure 2.11 and Table 2.3). Keeping the ‘status quo’ spending scenario but assuming the economy evolves along the lines of Citi’s pessimistic scenario leaves the current budget in deficit by £16 billion, or 0.5% of national income. In turn, the optimistic scenario might deliver a surplus of some £40 billion when combined with the ‘status quo’ spending scenario.
Figure 2.11. Current budget deficit under three economic scenarios

Note: Citi economic scenarios combined with ‘status quo’ spending assumptions. At the Autumn Budget, the target year of the fiscal rules will roll forward to 2029–30.
Source: Office for Budget Responsibility, economic and fiscal outlook (March 2024); authors’ calculations.
Table 2.3. Borrowing in 2028–29 in three economic scenarios, combined with ‘status quo’ spending scenario
| Borrowing | Current budget deficit |
Memo: |
|
|
Baseline | £42bn (1.3% of GDP) deficit | £17bn (0.5% of GDP) surplus |
Optimistic | £19bn (0.6% of GDP) deficit | £40bn (1.2% of GDP) surplus |
Pessimistic | £76bn (2.4% of GDP) deficit | £16bn (0.5% of GDP) deficit |
Note: Citi economic scenarios combined with ‘status quo’ spending assumptions.
Source: Office for Budget Responsibility, economic and fiscal outlook (March 2024); authors’ calculations.
We stress, however, that this spending scenario assumes that none of the pressures identified at the July 2024 spending audit persists into the medium term, except agreed public sector pay deals.10 If some of the spending risks outlined in Section 2.3 materialise and tax rises are limited to the relatively small commitments made in the manifesto, this forecast current budget surplus could easily evaporate.
Switching to the ‘avoid real cuts’ scenario from Chapter 3 would be one, arguably rather restrictive, interpretation of the commitment of ‘no return to austerity’, restated in Ms Reeves’s speech at Labour Conference 2024.11 This would require additional top-ups to spending of £20 billion, £16 billion of which are on current spending and the remaining £4 billion on investment spending. In other words, the current budget rule would be binding if Ms Reeves wanted to avoid real-terms cuts, as the entire current budget surplus is effectively the same as the top-up required to achieve this. Debt (on the measure used in the existing fiscal target) would be rising throughout the forecast, by about 1% of national income in 2028–29, meaning that, had these forecasts and spending plans been in place in March, the debt rule would also have been missed, and missed by some margin.
Under the optimistic scenario, there would be more scope to top up spending plans within the fiscal rules. Chapter 3 calculates that to avoid cuts in day-to-day budgets as a share of national income as forecast at the March Budget, a top-up of £33 billion would be required. Debt is falling by a margin of £20 billion (0.6% of national income) in 2028–29 under this scenario. However, the forecast surplus of £40 billion would be sufficient to allow such a top-up while still being compliant with the target for (at least) current budget balance. Of course, higher growth in this scenario would mean that budgets would not, ex post, be constant as a share of (now-higher) national income. Nevertheless, this is still an important benchmark. It highlights how stronger economic performance would make the trade-offs easier to manage. Conversely, the pessimistic scenario would require even tighter spending plans to be delivered – or fresh tax rises to be announced – just to remain on course for current budget balance in 2028–29.
A plausible range of fiscal options
Ms Reeves faces a difficult set of choices at this Budget. But we should not understate the choices she does have, and the material differences between them. If she were willing to bet on a favourable scenario for growth materialising – akin to Citi’s upside scenario – then the £9 billion of tax rises included in this year’s Labour manifesto would be enough to fund the public sector pay deals agreed this year and last, as well as avoid real-terms cuts to ‘unprotected’ departmental budgets while still delivering a current budget surplus and falling debt in five years’ time. But the Chancellor’s fiscal rule is couched in terms of the OBR forecast – its test is not whether she runs a current budget surplus in unforeseen lucky circumstances, but whether the OBR forecasts one in the Budget. So to meet the fiscal rule, it matters less what the Chancellor believes is the most likely scenario, but what the OBR deems ‘central’. Citi’s optimistic scenario would see the economy being 1.7% bigger in cash terms in 2028–29 and interest rates falling more steeply than the OBR forecast in March. Come 30 October, the new forecast is unlikely to move anywhere near as far in the optimistic direction as this.
But it is delivering actual current budget surpluses, or actually falling debt, that is more likely to contribute to fiscal sustainability in the longer term than having the OBR sign off on compliance with a fiscal rule. So it is worth noting that, even if this optimistic scenario were to materialise and ignoring the constraints of the forward-looking fiscal rules, difficult choices would remain: ambitious productivity improvements baked into the NHS workforce plan would still have to be delivered, and departments would still have to prioritise among competing demands. But it would allow the government to claim ‘no return to austerity’, while ending up with a current budget surplus.
Whichever fiscal rule they choose, a prudent Chancellor is going to want their plan to be sustainable in more than an optimistic scenario. The OBR’s new forecast for the Autumn Budget may in fact be gloomier than the previous one in some respects – over the medium term, economic output would be 1.1% greater under the OBR’s March forecast than the average of independent forecasters when they were surveyed by the Treasury in August.
We may think it more likely that the OBR’s October Budget forecast will be closer to the baseline scenario. Under that baseline scenario, the manifesto tax rises could be just about enough to avoid planned cuts to unprotected areas such as local government, justice and home affairs while seeing (just) the current budget not moving into deficit in 2028–29. However, debt (on the measure targeted by the existing fiscal mandate, ‘underlying’ net debt excluding the Bank of England) would still be on a rising trajectory at the end of the forecast period. If, instead, Ms Reeves is willing to sign up to sharp spending cuts to those departments inherited from the March Budget, and only fund the mechanical consequences of the public sector pay deals agreed this year and last, this could deliver a current budget surplus of £17 billion in 2028–29 in the economic environment of the baseline scenario (see Table 2.4).
Table 2.4. Illustrative tax measures needed to eliminate the current budget deficit in 2028–29 under different economic and spending assumptions
| Tax measure to get to current budget balance in 2028–29 |
Memo: |
|
| No change (0% of national income) |
| £16 billion tax rise (0.5% of national income) |
| £33 billion tax rise (1.0% of national income) |
Citi baseline economic scenario |
|
| £17 billion tax cut (0.5% of national income) |
| £1 billion tax cut (0.0% of national income) |
| £16 billion tax rise (0.5% of national income) |
Citi optimistic scenario |
|
| £40 billion tax cut (1.2% of national income) |
| £24 billion tax cut (0.7% of national income) |
| £7 billion tax cut (0.2% of national income) |
Citi pessimistic scenario |
|
| £16 billion tax rise (0.5% of national income) |
| £32 billion tax rise (1.0% of national income) |
| £49 billion tax rise (1.6% of national income) |
Note: Does not include debt interest consequentials of spending top-ups in earlier years.
Source: Authors’ calculations.
Of course, meeting the letter of the fiscal rule in terms of the OBR forecast is only part of a fiscal strategy. Problems will all but inevitably arise over the forecast horizon. If policymakers are meeting the rule with no room to spare, this may mean that (very small) current budget surpluses are forecast, but no current budget surpluses materialise when the time comes. This is especially true if policymakers’ willingness to spend any ‘windfall’ from improvements in the forecast is not matched by a similar willingness to respond to deteriorations in the forecast with tax rises or spending cuts (Emmerson et al., 2023). Ultimately, this may pose a risk to fiscal sustainability. If Ms Reeves wanted to ensure that a balanced current budget could be delivered even with the headwinds of Citi’s pessimistic scenario, even under the restrictive spending assumptions of the ‘status quo’ scenario, a tax rise of £16 billion – on top of those set out in Labour’s manifesto – would be required to maintain current budget balance in 2028–29.
But is there a way to open up more palatable fiscal options? During the election campaign and since it has been in office, Labour has emphasised the potential of policy to increase productivity, and subsequently take the sharper edges off the fiscal trade-offs. Even in a best-case scenario, policy takes time to make a positive difference to the growth outlook. In the recent past, the OBR has increasingly incorporated policy impacts on growth into its forecast (through ‘dynamic scoring’) – for example, the (modest but not trivial) expected impact of the expansion to childcare on parents of young children joining the workforce. An OBR discussion paper published in the summer (Suresh et al., 2024) sets out its approach to incorporating impacts of growth from additional public sector investment. Two points are worth drawing out from this. First, the OBR’s estimated effects are not huge, and are not large enough for investments to be self-financing in fiscal terms. Second, many of the supply-side benefits are expected to materialise only in the longer term, beyond the government’s current five-year forecast horizon. We discuss the potential role of growth-focused policies to ease fiscal trade-offs, and the sorts of delays involved, in more detail in Section 2.5. But as a simple summary, the OBR paper estimated that a permanent, sustained 1% of GDP increase in government investment would increase potential output by 0.4% after five years and by 2.4% after fifty years. The return to the exchequer would be smaller, given that the government would recoup less than half of this in additional tax revenues.
In the case of other growth-promoting policies – for example, the potential boost to growth through a less restrictive planning regime – past performance suggests the OBR might want to wait for clear evidence of an impact before reflecting them in its forecasts. It is one thing to say that planning rules will be liberalised, it is another thing actually to legislate the changes, and yet another to see developments happening that would not otherwise have occurred. Long-term growth-oriented policies are highly unlikely to ride to the rescue at this fiscal event and spare the Chancellor from difficult decisions to cut spending, raise taxes or allow debt to rise by more over this parliament. However, that does not mean such policies are not worth pursuing – far from it. In the following section, we discuss longer-term challenges and opportunities, and particularly consider the conditions under which higher growth brought about by a concerted policy effort could help keep the public finances on a sustainable path.
2.5 Looking ahead
Short-termism is a common, and justifiable, criticism of the UK’s fiscal policymaking. Several external commentators have suggested pushing the horizon of the full economic and fiscal forecast or at least some part of it, and/or the target year of the fiscal rules, further into the future. Upon taking office, the new government has emphasised a long-term policymaking horizon as a key aspect of its approach to fiscal and economic policy. For example, it has committed to setting 10-year R&D budgets. In this section, we discuss the fiscal outlook over a longer time frame than the usual five years, touching on demographics, climate change and the net zero transition, the decline of smoking, and how much a long-term focus on growth might be relied upon to ease the government’s fiscal conundrum.
At the Budget this March, the target year for the fiscal rules was 2028–29, and the forecast current budget surplus was 0.4% of national income in that year. Each year, the target year for the fiscal rules rolls forward a year. So if the last fiscal event of the parliament were to take place in March 2029 (with a general election due no later than August 2029), the target year would have moved on to 2033–34. While, at present, the medium-term forecasts published alongside fiscal events only cover five years, the OBR does produce a longer-term projection as part of its annual Fiscal Risks and Sustainability Report. Based on the latest long-term projections, and an assumed path for net investment spending, the current budget might be in deficit by 1.6% in 2033–34.12
In other words, based on this calculation, the margin against the current budget target would deteriorate over the parliament. By the end of it, tax rises or spending cuts would be required to continue to meet the target. So on this measure, the slightly more distant future looks no less challenging – if anything, more so. This is despite an improving current budget balance over time within the five-year medium-term forecast horizon, and runs counter to the conventional wisdom that more time always makes a target easier to meet.
Part of the reason for this is that different approaches are taken to forecasting spending on public services for different periods:
- For the period covered by the current Spending Review, planned spending totals for each department are used. Normally (with the notable recent exception of areas such as spending on the asylum system in the current year – see Warner and Zaranko (2024)), these plans are quite accurate.
- For the period within the five-year forecast horizon but outside the Spending Review, the Chancellor gives a single envelope for spending on public services, or provides a number for total public spending from which the OBR can derive what would be left for public services given its forecasts for spending on areas such as social security benefits and pensions and debt interest. In the past, this has not been a good guide to eventual out-turns. When the time comes to divide the overall allocation up between departments, substantial top-ups have typically been granted (see Section 3.5 in Chapter 3).
- To construct the long-term forecast, the OBR models spending on broad areas including health, adult social care, and education based on forecasts and assumptions for some of the underlying drivers of spending, including changes in incomes, demography and productivity.
Comparing the implied paths for spending on different areas (Figure 2.12) highlights how the two methodologies used for the period after the current Spending Review can come to different conclusions. Using the ‘single spending envelope’ methodology – which at the time of the March 2024 Budget forecast was the case for four out of the five forecast years – is not a credible central forecast of what is likely to happen.
Figure 2.12. Projected growth in spending by area as a share of national income based on OBR’s ‘single spending envelope’ and ‘area-by-area’ methodologies

Note: ‘Other day-to-day’ excludes health, adult social care, education and welfare including pensions.
Source: Office for Budget Responsibility, Fiscal Risks and Sustainability Report (September 2024).
The OBR’s medium-term projection (framed as ‘consistent with the March 2024 Economic and fiscal outlook’) is based on the assumption that the overall envelope for day-to-day public service spending will grow by an average of 1.0% per year in real terms. With average forecast real growth in the economy of 1.7%, this implies a reduction in spending as a share of national income. In the absence of department-level spending plans, the OBR projection appears to have assumed a largely proportional sharing of this cut in public spending as a share of national income, with a decrease in health spending of 0.3%, education spending of 0.2% and spending on ‘other’ public services of 0.2%.13
In contrast, over the following five years, the area-by-area methodology concludes that spending on health as a share of national income is likely to grow by 1.3%. This reflects pressures from a growing and ageing population and cost-increasing (rather than cost-saving) technological innovation.14 But these pressures are not purely a matter for the future – they are operating at all times, and past experience strongly suggests that they are accommodated.
Moreover, commitments in the previous government’s NHS Long Term Workforce Plan – which Labour has also signed up to – will require increases in NHS funding well above the overall real-terms annual growth rate of 1.0%. Workforce costs are by far the largest component of public spending on health. So in the case of health, the long-term bottom-up forecast gives a much more realistic picture than the ‘stated policy’ methodology. The same applies to other areas of spending; Chapter 3 sets out plausible top-ups to currently stated spending plans.
In July’s spending audit, the Chancellor announced a series of reforms to spending planning. Those include a commitment to holding Spending Reviews covering at least a three-year period at least every two years and giving the OBR additional powers to question ministers about spending plans. While modest in scale, these changes are sensible as they may help make stated spending plans somewhat more realistic. Very likely, this would lead to medium-term spending plans looking more like the bottom-up longer-term projection, since past governments have generally chosen to accommodate the demographic and other spending pressures it reflects and, at present, we see no reason to expect different from the new government.15
We discuss pressures on spending and revenues from demographics, the net zero transition and climate change, and other long-term changes in more detail in the following subsections. Perhaps amending fiscal rules to target a longer time horizon could encourage more focus on these challenges. But this is far from clear-cut: calling them ‘long-term’ fiscal challenges should not distract from the – already known – fact that in order to achieve the best feasible outcomes, policy action is required within the current forecast horizon of five years. Early and gradual action, in advance of known challenges, is often better than sharp policy adjustments only made once an emergency has become impossible to ignore.
Some may be comfortable with allowing debt to rise in the next five years if they expect the government’s policies to lead to higher growth and, hence, contribute to lower debt as a share of the economy over a longer time horizon. But these benefits are uncertain and may only accrue after a very long time, as we also discuss below. There is nothing special about a five-year horizon for a fiscal rule, but there is a trade-off: rules with longer time horizons allow Chancellors more time to adjust gradually to new information and for longer-term investments to bear fruit. But the commitment implied by them is also weaker, as there is a (real or perceived) temptation to let uncomfortable fiscal realities, or unpopular policies, be the problem of the next Chancellor (or even the one after that).
Demographics
Changes to the size and composition of the population are key underlying drivers of spending pressures. Put simply, much public service and welfare spending disproportionately goes to support people at the beginning and towards the end of their life: providing healthcare and education when they are children, and pensions, healthcare and social care when they are at older ages. At the same time, less tax revenue is raised from these groups. The reverse is true of the working-age population, who on average pay more tax and typically receive less support from public services and the benefit system. Therefore, a simple way of summarising the demographic pressures on the public finances is the dependency ratio: the number of children and pensioners per 1,000 people of working age. Under the ONS’s most recent population projection, published earlier this year, the dependency ratio rises steadily from 2027–28 onwards. This means that the further we look into the future, the more forecast demographic pressures on spending grow.
Of course, population projections are themselves uncertain and based on assumptions. One of them is that the fertility rate16 rises slightly over the next decade. Given a large and continuous fall in the fertility rate since its recent peak of 1.9 children per woman in 2010 to under 1.5 in 2022 – with only a small uptick during the pandemic – it would not be too surprising if it instead were to continue its trend and fall further. With fewer children born, this might lead to some savings being scored relative to the current projection in the near term. However, these savings – chiefly on education – could be difficult to achieve in practice: there may be large practical and political obstacles to cutting school funding in line with falling pupil numbers while maintaining quality of provision. And of course, in the longer term, fewer children eventually means fewer working-age people, reversing the positive public finance impact.
On the other hand, the latest projection assumes that net migration will have dropped from recent peaks to its equilibrium level of just under 360,000 people annually. However, every ONS projection since 2000 has underestimated eventual net migration – with the exception of 2020, when immigration collapsed during the initial phase of the COVID-19 pandemic (Sumption, Walsh and Brindle, 2024, figure 6). Total net migration averaged around 250,000 people a year over the course of this century and peaked at 764,000 in 2022. This means that the UK has gained almost 6 million people as a net effect of emigration and immigration over the past 20 years. Recent immigrants are somewhat more likely to participate in the labour market than the incumbent population (Office for Budget Responsibility, 2024a, box 2.3), in part for the simple reason that they are more likely to be of working age and less likely to be pensioners. Like the resident working-age population, they tend to pay more in taxes than they receive in benefits and spending on public services. If net migration were to once again overshoot the projection, and other past trends continued (e.g. employment rates among international students continued to rise), this would have a positive impact on the public finances. This would be especially true – at least on paper – if public service budgets were not increased to help accommodate such an ‘unexpected’ rise in net migration, and public services were left to absorb demand from a faster-growing population from within their existing budgets. Similarly, as the OBR discussed in its recent Fiscal Risks and Sustainability Report (September 2024), some potential changes in the composition of immigrants – for example, if for a given level of immigration, the average migrant were higher-earning or stayed for a shorter period of time – would have a favourable fiscal impact.
State pension age
A key policy parameter mediating the impact of population ageing on spending on the state pension and pensioner benefits is the state pension age. Over the next few years, the public finances will be helped by the increase of the state pension age from 66 to 67 for men and women, due between 2026 and 2028. This will reduce borrowing by about £6 billion a year, mostly due to reduced state pension spending but also with a rise in tax revenues from those who delay their retirement and an increase in National Insurance contributions paid by those in work at age 66, offset by an increase in spending on working-age benefits.
Under current legislation – passed by the last Labour government in 2007 – the state pension age will rise from 67 to 68 between 2044 and 2046. The first independent review of the state pension age – led by John Cridland – in 2017 recommended bringing this forward by seven years (to 2037–2039). While the government at the time accepted this recommendation, it did not legislate for it. The subsequent independent review – led by Baroness Neville-Rolfe – in 2023 suggested that the timetable be pushed back to 2041–2043 in the face of longevity at older ages not increasing as quickly as previously projected. The government at the time ‘noted’ this recommendation, but pointed to uncertainties caused by recent shocks – most obviously the COVID-19 pandemic – and said that the state pension age should be reviewed again in the first two years of this parliament. This now needs to happen urgently. Both independent reviews have recommended that individuals should be given at least 10 years’ notice of any increase in their state pension age. That should be kept to, which could only be consistent with an increase in the state pension age in the 2030s (if so desired) if the next review concluded and the government legislated in the next few years.
The net zero transition and climate change
The public finances will be impacted by three climate-change-related processes:
- the cost of mitigating climate change and the transition to net zero (e.g. subsidising households to switch from gas boilers to heat pumps and losing revenue from fuel duties as drivers transition to electric vehicles);
- the cost of adaptation to climate change (e.g. installing air conditioning in hospitals, investing in flood defences and temporarily losing revenue from businesses that have to relocate from flood-prone areas);
- the cost of physical damage caused by climate change (e.g. repairing flood damage to infrastructure and losing tax revenue due to lower output in heatwaves).
The OBR analysed the fiscal cost of the net zero transition itself in 2021 and added analysis on climate-change-related damage this September (Office for Budget Responsibility, 2021 and 2024b).
The range of uncertainty, both over the way climate change will unfold and over future policy decisions, is wide. In a central scenario in 2021, the OBR assumed that the government would have to spend £12–18 billion in today’s prices or around 0.4% of national income a year to subsidise the decarbonisation of the economy. At the same time, fuel duty, vehicle excise duty, and other aviation and waste revenues now bring in around 1.7% of national income, but these revenues are expected to fall to close to zero by 2050. When, at the beginning of this section, we described how the current budget deficit is set to grow over the early 2030s – making the government’s fiscal rule harder to meet – this calculation included a reduction in revenues from fuel duties. By the end of the parliament, the target year will have moved to 2033–34, when the OBR expects that more than half of the vehicle stock will be electric.
On the other hand, carbon taxation could partly counterbalance additional net-zero-related spending and lost revenue. In the same central scenario from 2021, the OBR assumed that a comprehensive carbon tax introduced from 2026–27 will raise 1.8% of national income in additional revenue a year. This then gradually falls to around 0.5% of national income by 2050 as taxable carbon emissions fall.
The OBR has not updated the 2021 central scenario (dubbed an ‘early action scenario’), or commented on whether such early action has become more or less likely in the intervening three years. In addition to the comprehensive carbon tax just mentioned, the ‘early action’ involves additional net zero-related spending rising to 0.7% of national income by 2027–28. As Figure 3.13 in Chapter 3 shows, current plans (as set at the 2021 Spending Review and adjusted for Labour’s manifesto commitments) for ‘green’ spending fall well short of the OBR’s ‘early action’ scenario. In other words, the ‘early action’ scenario requires significant policy action within the parliament, and within the forecast horizon at the upcoming Budget. If such policy action was delayed until the 2030s and the private sector did not step up to carry a correspondingly greater share of the whole-economy costs, the OBR estimated that the cumulative effect on debt by 2050 could more than double.
In the OBR’s estimate, the annual direct fiscal cost of dealing with damage from floods and heatwaves is much smaller, at only around 0.04% of national income. However, while the net zero transition includes some one-off additional spending (such as retrofitting schools, hospitals and prisons), the costs of climate change damage are expected to continue to accrue indefinitely. A more important fiscal impact is indirect. The OBR estimates that climate change17 will reduce the size of the economy by around 2% by 2050, adding around 0.4% of national income to borrowing due to lower tax receipts and increased public spending pressures and another 0.3% due to higher debt interest spending. The analysis acknowledges that costs could rise sharply if ‘tipping points’ are breached, and does not include possible international impacts via trade and migration. These could be even harder to model with a sufficient degree of confidence, but could be incredibly important – not least because the UK is expected to suffer a smaller direct impact than many other countries.
However, there is currently no comprehensive estimate of the costs of climate change adaptation so far. We do not even know how much we invest in adaptation at the moment – that is investment on top of what would have been spent on relevant infrastructure regardless of climate change (Office for Budget Responsibility, 2024b). Forecasting future spending is therefore even more difficult, also given the large uncertainty around the impacts of climate change in different scenarios. The OBR hopes to assess adaptation costs in more detail when more information becomes available. What we do know, however, is that the benefits of adaptation outweigh the costs – often by far – and that delaying action will make tackling the risks even harder (Watkiss, Cimato and Hunt, 2021).
The smoke-free generation
While revenues from tobacco duty have fallen by nearly a third in real terms over the last decade, they still stood at £9 billion in the last financial year. As the ‘smoke-free generation’ starts to account for an increasing share of the adult population, as a result of the plan to legislate so that those born on or after 1 January 2009 will never be able to buy tobacco legally in the UK, this revenue will continue to decrease and – if the policy is successful from a public health perspective – faster than it otherwise would. Just as with the OBR’s assumed carbon tax above, a feature of so-called ‘sin taxes’ is that the more successful they are in shifting the behaviour of businesses and consumers, the less revenue they will raise. In the OBR’s latest long-term projection, it assumes that revenues for tobacco duties decline to approximately zero by 2060.
However, a falling share of cigarette smokers – as shown in Figure 2.13 – has been accompanied by rising prevalence of vaping and e-cigarette use in recent years. Total use of nicotine products among adults – i.e. smoking plus vaping – remains virtually unchanged since 2010. There has been no reduction in the prevalence of smoking amongst young people aged 11–18, even as the prevalence of vaping has increased substantially (McNeil et al., 2022). The OBR’s projection assumes that a vaping duty, introduced at the March 2024 Budget, will be insufficient to replace lost revenue from tobacco duty. With some concern about unclear long-term health impacts of vaping among health researchers and advocates (Darzi, 2024), and added environmental concerns due to improper disposal of single-use vapes, there is scope for increased taxation of vaping products to pick up some of that tab.
Figure 2.13. Share of cigarette smokers in Great Britain, by age

Source: Office for National Statistics, adult smoking habits in Great Britain (2022 edition).
What can policy do for growth, and how long would it take?
One of the new government’s ‘missions’ for office is to secure the highest sustained economic growth in the G7. Certainly, good policymaking can help growth and bad policymaking can hinder it. The government has also indicated a number of broad policy areas where it will be implementing reforms with at least an eye on boosting growth. This includes green investment, planning reform and industrial strategy. But prioritising growth may be harder than it sounds. Often, the reason that growth-friendly policies have not already been implemented is that there are real trade-offs with other legitimate considerations. The pursuit of ‘sustained growth’ will also require a great deal of patience from policymakers, and an understanding that the rewards will come far too late to benefit even their immediate successors in office. Finally, while policies that can be expected to deliver a modest boost to growth will often be worth pursuing, it is important to realise exactly how modest those responses might be. This subsection briefly describes each difficulty in turn.
There are real trade-offs
In his recent speech at the Labour Party conference, the new Prime Minister, Sir Keir Starmer, stated: ‘the time is long overdue for politicians to level with you about the trade-offs this country faces’. He went on to set out some areas where there are genuine trade-offs, such as in criminal justice, energy generation, housebuilding, migration and management of the public finances.18 In a similar vein, there are many areas of policy where we know there are reforms that would be good for growth that are not being pursued because other political objectives are prioritised. For example, in trade policy, one of the most effective ways to boost growth would be for the UK to rejoin the EU single market and customs union. But the current government – like its predecessor – has ruled this option out.
Another case comes with the government’s stated aims for its industrial strategy. These are far from limited to growth but include a diverse set of objectives: lower-carbon production processes, reduced geographical inequality, improved resilience in crises and more widespread workplace benefits. These are, of course, all perfectly valid objectives to pursue. So we may believe that the government has better information about the most growth-promoting investments than private sector investors. But it has already told us that it would not necessarily choose the investments that lead to the fastest-growing or most tax-rich economy, to the exclusion of all other considerations. Instead, it would choose the ones that offered the best outcomes across this whole range of objectives. Revisiting investment in the net zero transition discussed above, replacing gas boilers with heat pumps is a necessary endeavour to meet emission reduction targets. But it will not allow us to produce more warm homes per person – if it is successful, we will produce exactly the same number of warm homes, but in a lower-carbon way. Government investment and industrial strategy are likely to make trade-offs and prioritise other objectives over growth in many other cases.
The time horizon can be long
As we have described, the new government’s fiscal rules, like those of its predecessor, are focused on the usual five-year forecasting horizon. Given we are at the start of the parliament, we can still expect purely self-interested policymakers to have an eye on the next decade; by the end of this parliament, the end of the forecast horizon could be 2033–34. And it is appropriate for policymakers to take a longer-term view; policies that will take an even longer time to improve growth may nevertheless be very worthwhile. However, even if a government expects its policies to lead to a bigger, more successful and/or more tax-rich economy in 20 or 30 years, it will still need to address more near-term public finance challenges in the interim.
It is also important for policymakers to understand how long the time horizons might need to be. A focus on a 10 -year horizon will often still be too short. Take the key plank of the government’s plan to promote economic growth: planning reform to allow the building of 1.5 million new homes over the parliament. This is a growth-friendly policy. One way in which more housing at more affordable prices in the right locations could add to growth is through increased mobility of workers: high housing costs, especially in major cities, prevent some workers from moving to the places where they could be most productive. To the extent that additional housebuilding could keep house prices and rents down, this barrier to greater labour mobility and higher productivity could be reduced. But most workers do not continually revisit their decision about which part of the country they would like to live and work in: people buy houses, start families and put down roots. The full benefits of additional housebuilding would likely take at least a generation to materialise, as a new cohort of young people feel more able to start their careers where the most productive firms for their skills and talents are located, rather than being put off from moving by high housing costs.
The scale of the growth impact might not be huge
Policies that led to a modest boost in sustained output could be incredibly worthwhile and, in the best case, public investment may encourage firms to increase their own investment in turn. But even some substantial policies might be expected to deliver remarkably small increases in national income. In a recent discussion paper, the OBR set out its approach to modelling the impact of additional public investment on national income (Suresh et al., 2024). This considers the estimated impact of a permanent, sustained increase in public sector net investment of 1% of national income – that is equivalent to £28 billion in 2024–25. With public sector net investment this year forecast to be £67 billion (2.4% of GDP), that would be a big rise. According to the OBR’s modelling, it would increase sustained output by 0.4% after five years and by 2.4% after fifty years. If correct, this means it would be adding less than 0.05% to the average annual growth rate over the next fifty years (and less than 0.08% to the average annual growth rate over the next five years).
Notably, this calculation is for ‘average’ public investment. Some projects – perhaps well-planned energy and transport infrastructure – may deliver bigger benefits. But some public investment projects, like the aforementioned replacement of polluting infrastructure, or investment in some public services, such as modernisation of the prisons estate, probably have no impact on growth at all. A modest addition to growth is likely still worth having. But it is not huge, and it will not solve all the Chancellor’s problems.
2.6 Conclusions: what should the Chancellor do?
The new Chancellor has inherited an unenviable public finance situation. A combination of much-elevated debt, higher interest rates than we were accustomed to in the 2010s and a weak outlook for growth makes even stabilising debt difficult, let alone getting it on a decisively falling path. Public spending is much higher as a share of national income than prior to either the pandemic or the Great Financial Crisis and yet many public services are showing obvious signs of strain. And taxes are at historic highs – at least by UK standards.
Budgets held in the first few months of a new parliament are often particularly significant, and especially so when there has been a change in the political colour of the Chancellor. The Office for Budget Responsibility (OBR) estimates that Gordon Brown’s July 1997 Budget pushed up revenues by the equivalent of £14 billion a year (in 2024–25 terms), while George Osborne’s second Budget in October 2010 contained a net tax rise of £13 billion. On 30 October, a net tax rise of the scale of those two Budgets – or perhaps even bigger than that – does not seem out of the question.
At her inaugural Budget, Rachel Reeves will also set out the details of her fiscal targets. There is much to commend her commitment to aim for current budget balance over the medium term. But the Chancellor is yet to specify her precise target for the public sector balance sheet. Speculation about swapping the measure of debt targeted by the fiscal rule inherited from the previous government for another measure of the balance sheet has been abundant. While there are arguments for and against various options, we have particular concerns about the suitability of public sector net worth as a main fiscal target. It will remain the case that public sector net debt cannot be completely disregarded – whatever its flaws as a measure, it cannot be allowed to increase faster than national income indefinitely.
More fundamentally, there is nothing sacrosanct about how any of these measures is forecast to change between the ends of the fourth and fifth years of the forecast horizon. A serious focus on a longer-term horizon would be welcome but would require confronting the fact that the UK faces considerable fiscal challenges in the 2030s and 2040s due to factors such as the ageing of the population, the demise of fuel and tobacco duties, and costs associated with transitioning to net zero. Whatever measure Ms Reeves chooses, she should also continue with the previous government’s sensible policy of reporting the full range of fiscal measures.
If the motivation behind a change in fiscal target is a desire to increase investment spending, combined with a belief that it is better (or only possible) to finance that spending through more borrowing rather than through higher taxes or lower day-to-day spending, then that case should be made explicitly. And, perhaps most importantly, it should then be followed up with a focus on ensuring that the increased investment budget is – and is seen to be – spent effectively. That requires selecting the right set of projects and then designing and delivering them in a cost-effective way, a task that governments have all too frequently failed to achieve.
Choosing an easier-to-meet target for the public sector balance sheet could allow Ms Reeves space to top up planned public sector net investment spending while complying with the letter of her new fiscal rules – though would not change any of the underlying trade-offs. But the Chancellor would still be left with plenty of difficult choices to make on taxation and day-to-day spending, since she will likely have little headroom against her target to achieve current budget balance.
Her room for manoeuvre will be in large part determined by the OBR’s new forecast for the path of the public finances. She will also be constrained by the extent to which the spending pressures identified by the new government in July – including its decisions on public sector pay – are expected to persist. Taking Citi’s baseline economic forecast and assuming just the public sector pay awards (and not, for example, the sizeable repeated overspends by the Home Office on asylum and immigration) persist, and after accounting for the specific tax and spending measures in Labour’s manifesto, we estimate this would leave Ms Reeves with a current budget surplus of around £17 billion in 2028–29 (0.5% of national income). This would be little changed from the March 2024 Budget.
This scenario, however, leaves in place the overall spending assumptions bequeathed by Mr Hunt, under which unprotected spending departments would be facing real-terms cuts at next Spring’s multi-year Spending Review. The new government has committed to ‘no return to austerity’ for public services. This is a similar pledge to that made by the first Chancellor of the previous parliament, Sajid Javid, who just prior to the 2019 general election set out plans that at the time implied no department faced a cut to its budget. Were Ms Reeves to adopt a similar position, again under the Citi baseline forecast, this could be consistent with being on course for current budget balance in 2028–29. But only just.
Simply maintaining day-to-day spending in real terms in areas such as skills, courts and prisons might – given the pressures on public sector pay (Chapter 4) and the desire to deliver significant improvements in service quality – prove to be insufficient. As set out in Chapter 3, an alternative scenario – where all services see their budgets rise at least in line with national income – would require an additional £17 billion of spending in 2028–29. Under Citi’s baseline scenario and absent any cuts to spending outside of public services, such as to working-age benefit spending, this would require a tax rise of £16 billion, just to remain on course to deliver current budget balance in 2028–29. This would be on top of the £9 billion tax rise from specific measures set out in Labour’s manifesto; so almost a £25 billion tax rise in total.
As ever, there also remains considerable uncertainty around how the economy and the public finances will evolve. Under Citi’s optimistic scenario, this higher spending scenario would require no further tax rises to be consistent with current budget balance by 2028–29. But under Citi’s pessimistic scenario, the size of the required fresh tax rise would triple to £49 billion, bringing the total tax rise (i.e. including manifesto measures) up to almost £58 billion. This uncertainty has meant that past Chancellors have often built in some ‘headroom’ rather than aiming to meet their fiscal target precisely. In that spirit, even Citi’s baseline scenario could motivate a bigger than £25 billion tax rise from manifesto and new measures. To govern is to choose. And on 30 October, Ms Reeves will need to choose.
References
Adam, S. and Miller, H., 2024. Reforming the taxation of non-doms: policy options and uncertainties. Institute for Fiscal Studies, Comment, https://ifs.org.uk/articles/reforming-taxation-non-doms-policy-options-and-uncertainties
Adam, S., Miller, H. and Upton, B., 2024. The government’s record on tax 2010–24. Institute for Fiscal Studies, Report R321, https://ifs.org.uk/publications/governments-record-tax-2010-24
Darzi, A., 2024. Independent investigation of the National Health Service in England. https://www.gov.uk/government/publications/independent-investigation-of-the-nhs-in-england.
Emmerson, C., 2021. Tax and spend. Institute for Fiscal Studies, presentation, https://ifs.org.uk/sites/default/files/2022-08/Tax-and-Spend-Autumn-Budget-2021-by-Carl-Emmerson.pdf
Emmerson, C., Johnson, P., Stockton, I. and Zaranko, B., 2024. Fiscal rules and investment in the upcoming Budget. Institute for Fiscal Studies, Comment, https://ifs.org.uk/articles/fiscal-rules-and-investment-upcoming-budget
Emmerson, C., Mikloš, M. and Stockton, I., 2023. Outlook for the public finances: Green Budget 2023 – Chapter 3. Institute for Fiscal Studies, Report R281, https://ifs.org.uk/publications/outlook-public-finances-0
Emmerson, C., Mikloš, M. and Stockton, I., 2024a. Spending as much as other countries but taxing less is unlikely to be sustainable. Institute for Fiscal Studies, Comment, https://ifs.org.uk/articles/spending-much-other-countries-taxing-less-unlikely-be-sustainable
Emmerson, C., Mikloš, M. and Stockton, I., 2024b. The context for the March 2024 Budget. Institute for Fiscal Studies, Report R301, https://ifs.org.uk/publications/context-march-2024-budget
Emmerson, C. and Stockton, I., 2021a. Rewriting the fiscal rules: IFS Green Budget Chapter 4. Institute for Fiscal Studies, https://ifs.org.uk/books/rewriting-fiscal-rules
Emmerson, C. and Stockton, I., 2021b. Outlook for the public finances: IFS Green Budget Chapter 3. Institute for Fiscal Studies, https://ifs.org.uk/books/outlook-public-finances-0
Emmerson, C., Stockton, I., van de Schootbrugge, S. and Zaranko, B., 2023. Chancellors’ responses to economic news: Green Budget 2023 – Chapter 5. Institute for Fiscal Studies, Report R276, https://ifs.org.uk/publications/chancellors-responses-economic-news
HM Treasury, 2021. Autumn Budget and Spending Review 2021. https://assets.publishing.service.gov.uk/media/61c495ebe90e07196d2b8383/Budget_AB2021_Print.pdf
HM Treasury, 2024. Forecasts for the UK economy: August 2024. https://www.gov.uk/government/statistics/forecasts-for-the-uk-economy-august-2024.
Institute for Government, 2024. The precarious state of the state: public services. https://www.instituteforgovernment.org.uk/publication/general-election-2024-precarious-state/public-services
Johnson, P., 2024. Gaming fiscal rules is no way to make budget policy. The Times, 4 March. Available at https://ifs.org.uk/articles/gaming-fiscal-rules-no-way-make-budget-policy
King, A. and Jameson, D., 2024. Designing a UK fiscal framework fit for the climate challenge. CETEx and Grantham Research Institute on Climate Change and the Environment, London School of Economics and Political Science, https://www.lse.ac.uk/cetex/publications/designing-a-uk-fiscal-framework-fit-for-the-climate-challenge/.
Labour Party, 2024. Change: Labour Party manifesto 2024. https://labour.org.uk/change/.
Latimer, E., Pflanz, F. and Waters, T., 2024. Health-related benefit claims post-pandemic: UK trends and global context. Institute for Fiscal Studies, Report R333, https://ifs.org.uk/publications/health-related-benefit-claims-post-pandemic-uk-trends-and-global-context
McNeill, A., Simonavičius, E., Brose, L., Taylor, E., East, K., Zuikova, E., Calder, R. and Robson, D., 2022. Nicotine vaping in England: an evidence update including health risks and perceptions, 2022. A report commissioned by the Office for Health Improvement and Disparities, https://assets.publishing.service.gov.uk/media/633469fc8fa8f5066d28e1a2/Nicotine-vaping-in-England-2022-report.pdf
Office for Budget Responsibility, 2016. Economic and fiscal outlook – November 2016. https://obr.uk/efo/economic-and-fiscal-outlook-november-2016/.
Office for Budget Responsibility, 2018. Public sector net financial liabilities. https://obr.uk/box/public-sector-net-financial-liabilities-2/.
Office for Budget Responsibility, 2021. Fiscal risks report – July 2021. https://obr.uk/frs/fiscal-risks-report-july-2021/.
Office for Budget Responsibility, 2024a. Economic and fiscal outlook – March 2024. https://obr.uk/efo/economic-and-fiscal-outlook-march-2024/.
Office for Budget Responsibility, 2024b. Fiscal risks and sustainability – September 2024. https://obr.uk/frs/fiscal-risks-and-sustainability-september-2024/.
Office for National Statistics, 2024. Births in England and Wales: 2022 (refreshed populations). https://www.ons.gov.uk/peoplepopulationandcommunity/birthsdeathsandmarriages/livebirths/bulletins/birthsummarytablesenglandandwales/2022refreshedpopulations
Stockton, I. and Zaranko, B., 2024. Definitions of debt and the new government’s fiscal rules. Institute for Fiscal Studies, Comment, https://ifs.org.uk/articles/definitions-debt-and-new-governments-fiscal-rules
Sumption, M., Walsh, P. W. and Brindle, B., 2024. Net migration to the UK. Migration Observatory briefing, COMPAS, University of Oxford, https://migrationobservatory.ox.ac.uk/resources/briefings/long-term-international-migration-flows-to-and-from-the-uk/.
Suresh, N., Ghaw, R., Obeng-Osei, R. and Wickstead, T., 2024. Public investment and potential output. Office for Budget Responsibility, Discussion Paper 5, https://obr.uk/public-investment-and-potential-output/.
Tetlow, G., Bartrum, O. and Pope, T., 2024. Strengthening the UK’s fiscal framework: putting fiscal rules in their place. Institute for Government, https://www.instituteforgovernment.org.uk/publication/strengthening-uk-fiscal-framework
Warner, M. and Zaranko, B., 2024. Home Office budgeting and asylum overspends. Institute for Fiscal Studies, Comment, https://ifs.org.uk/articles/home-office-budgeting-and-asylum-overspends
Waters, T. and Wernham, T., 2024. The distributional impact of tax and benefit reforms since 2010. Institute for Fiscal Studies, Report R319, https://ifs.org.uk/publications/distributional-impact-tax-and-benefit-reforms-2010
Watkiss, P., Cimato, F. and Hunt, A., 2021. Monetary valuation of risks and opportunities in CCRA3. Supplementary Report for UK Climate Change Risk Assessment 3, prepared for the Climate Change Committee, https://www.ukclimaterisk.org/wp-content/uploads/2021/06/Monetary-Valuation-of-Risks-and-Opportunities-in-CCRA3.pdf
Zaranko, B., 2023. Public sector net worth as a fiscal target: Green Budget 2023 – Chapter 6. Institute for Fiscal Studies, https://ifs.org.uk/publications/public-sector-net-worth-fiscal-target
Endnotes
Authors


Martin Mikloš
Martin is a research economist at TaxDev and works on taxation in developing countries.

Isabel Stockton
Isabel works in the Healthcare sector, and on the public finances. Their research focuses on retaining and developing the NHS workforce.
More from IFS
Understand this issue


Policy analysis


Academic research


