
Downloads
Download the report as a PDF
PDF | 797.06 KB
Executive summary
The Welsh Government aims to increase employment and earnings as part of its ‘Plan for Employability and Skills’, and in order to help generate additional tax revenues that can help fund public services and investment. It also aims to reduce inequalities in employment and earnings, and has clear objectives to reduce rates of child poverty.
This report documents how earnings and employment have evolved over time, and how these compare within Wales, and between Wales and the rest of the UK (rUK). We then look at average income, income inequality and poverty, and discuss the Welsh Government’s strategy for reducing child poverty.
Key findings
- Wales has one of the lowest employment rates in the UK: 71.4% of 16–64 year olds were in work in 2025, compared to 75.1% across the UK. This 4 percentage point gap compared with the UK as a whole is slightly down from 5 percentage points in the late 1990s. However, after narrowing during the 2000s and 2010s, the employment gap had mostly been closed prior to the COVID-19 pandemic, since when the employment rate has fallen in Wales while remaining stable in the rUK, reopening the gap.
- Median monthly earnings for employees in Wales were £2,401 in 2025, around 5% below the UK figure of £2,526. Welsh earnings are lower than in the UK as a whole across the earnings distribution, but the gap is especially pronounced towards the top of the distribution. Growth in median monthly earnings has broadly tracked the UK over the last decade, with Wales experiencing average real-terms growth of 1.3% a year since 2015, compared to 1.2% across the UK as a whole.
- Whilst Wales consistently lags behind the UK in terms of earnings and employment, there is significant geographical inequality within Wales. Areas in the Southeast and Northeast typically have higher median earnings, with rural areas in Wales lagging behind. Employment rates remain lowest in the post-industrial South Wales Valleys, but the last two decades have seen lower-employment regions close some of the gap with higher-employment regions.
- Median annual household net income in Wales stood at £35,701 (£2,975 per month) in the latest data, compared to £37,790 (£3,149 per month) across the UK – a gap of about £2,100 or a little under 6%. Wales has lower housing costs than the rUK, and after deducting housing costs, the gap in average incomes falls to a little over 3%. Like the rUK, Wales has seen weak income growth since the late 2000s, with average real-terms increases of just 0.7% a year since the early 2010s and little progress since the pandemic.
- Income inequality is lower in Wales than in the rUK, but this is because the gap in incomes between Wales and the rUK is particularly large at the top of the distribution, and not because poorer and middle-income households are better off. Incomes in Wales are also lower at every point in the distribution: compared with the rUK, they are roughly 4% lower at the 10th percentile, but 13% lower at the 90th percentile, though we do not have fully up-to-date data on income inequality within Wales.
- Around 22% of people in Wales were in relative poverty after housing costs in the latest data, slightly above the 20% UK average. Relative poverty gives the proportion with household incomes below 60% of the UK-wide median after adjusting for household size. Prior to a revision in how the poverty rate was measured, the Welsh poverty rate had hovered between 22% and 24% since the mid-2000s, having fallen from 27% in the early 1990s. Poverty in Wales has generally been 1–2 percentage points above the rUK in recent decades, and if not for lower housing costs, this gap would be larger. Like the rUK, Wales has recently seen sharp rises in the proportion of households reporting they are unable to afford heating or pay their bills, or are experiencing food insecurity, which are not reflected in income poverty statistics. Estimates of poverty are always somewhat volatile at a regional level, and there is substantial statistical uncertainty associated with them.
- The rate of child poverty in Wales is a little higher than the UK average: 32% of children were in relative poverty after housing costs in the latest data, compared to 28% across the UK. The Welsh Government’s child poverty strategy is broad in scope, and focused on closing broader inequalities between richer and poorer children’s opportunities, education health and environments, rather than focusing on income poverty. Such a broad range of objectives is perfectly legitimate, but can make it difficult to assess progress in the absence of a primary focus. The Welsh Government should be clearer on which objectives it is aiming to prioritise, reflecting both its view of which are most important, and which it has the most power to achieve. Few of the measures announced so far look likely to make a large difference to child income poverty in the short term, not least because the main levers over benefits policy remain reserved to Westminster.
1. Data used in this report
This report draws on a range of evidence from both administrative data sources and surveys:
- Our analysis of earnings and employment makes use of several surveys: the Labour Force Survey (LFS), the source of official employment statistics; the Annual Population Survey (APS), which collects a narrower range of data from the LFS sample and an additional booster sample; and the Annual Survey of Hours and Earnings (ASHE), which is based on a survey of employers. In addition, we use information from His Majesty’s Revenue and Customs (HMRC) pay as you earn (PAYE) real-time information (RTI) administrative data on earnings and jobs, compiled by the Office for National Statistics.
- Our analysis of household incomes and poverty relies on the Family Resources Survey (FRS), the source of official estimates of income distribution statistics, poverty rates and material deprivation measures.
Estimates based on surveys are always subject to some uncertainty, and risks that surveys may systematically under-record (or over-record) some population groups (despite efforts to weight the data to avoid this). However, surveys include more information on more household and individual characteristics than is typically available in administrative data.
For results based on the FRS, which has particularly small sample sizes for Wales, Scotland, Northern Ireland and the individual regions of England, we report three-year rolling averages to reduce the sensitivity of our results to sample volatility. We also exclude the survey from 2020−21 due to concerns over reliability around the pandemic. This means that three-year rolling averages that would otherwise include this year only average over the two other years. This is in line with government practice for official statistics.
The FRS has also seen a fall in response rates since the pandemic. Previous work suggests there is reason to be more cautious in interpreting statistics calculated based on these data since the pandemic (Ray-Chaudhuri and Wernham, 2025). In addition, there are long-running issues with the coverage of benefit income in the FRS; analysis by the Department for Work and Pensions suggests this is a result of both under-representation of benefit recipients in the data and mis-measurement of respondents’ benefit income (Department for Work and Pensions, 2024a). These issues will be mitigated by recent and upcoming revisions to the FRS methodology, though this will make comparisons over time harder. Nevertheless, the FRS remains the highest-quality source of data we have on disposable incomes.
In this report, we make use of the latest published statistics (based on recent methodological revisions) to report on the latest average income and poverty statistics, whilst measuring income inequality, and trends in all statistics, using data collected with the old methodology, ensuring comparability over time. We will indicate clearly whether statistics are derived from the old methodology or the new methodology.
Drops in response rates since the pandemic mean that particular care is needed when interpreting recent changes in survey-based estimates of earnings, employment and incomes. The problems associated with the LFS due to lower response rates are well documented, and whilst the Office for National Statistics has taken steps to improve the representativeness of the survey by improving its weighting methodology, it continues to urge caution in interpreting LFS-based statistics (Office for National Statistics, 2025a). Similar cautiousness should apply to the ASHE and APS. The APS has a larger sample than the LFS, but has not undergone the same improvements to its weighting methodology. In light of these issues, we also make use of PAYE RTI data where possible. These administrative data should not be subject to any sampling volatility or biases in representativeness, but have other drawbacks – for example, they will generally not include earnings from self-employment or informal work.
In the remainder of this report, dates in the format XXYY–YY+1 (e.g. ‘2023−24’) refer to financial years, dates in the format XXYY–YY+3 refer to pooled triplets of financial years (e.g. 2021–24 refers to the three financial years from 2021–22 to 2023–24) and dates in the format XXYY (e.g. ‘2023’) refer to single calendar years.
All results are expressed in 2025–26 prices unless otherwise stated, which in some places results in small deviations from official statistics.
2. Employment and earnings in Wales
The Welsh Government has placed emphasis on increasing earnings and employment (Welsh Government, 2022a). Policies and plans include careers support and a guarantee of employment or training for young people, improving access to the labour market for groups less likely to work (including lone parents and those with health conditions) and improving adult skills. The Welsh Government has also set out ‘fair work’ guidance for employers, encouraging remuneration sufficient to meet living costs, and flexible working to facilitate labour market participation (Welsh Government, 2022b).
There are many reasons why it is important for the Welsh Government to pay attention to the labour market. Employment and earnings are essential drivers of living standards, and helping families into well-paid work is also a key plank of the government’s child poverty strategy (Welsh Government, 2024a). Increases in earnings and employment also have the potential to increase tax revenues for the Welsh Government, giving it additional resources to pursue its objectives.
In this section, we first examine the national picture on employment and earnings in Wales, examining how these have evolved over time, and how both employment and earnings levels and trends compare with other regions and nations of the UK (which we refer to as the ‘rest of the UK’ or rUK). We then examine differences between areas within Wales.
The national picture
Employment
Figure 1 gives the latest annual estimates of employment rates for 16–64 year olds in each region of England and the other nations of the UK, based on the LFS. The employment rate gives the proportion of all individuals in this age range who are in work. Those not in employment include the unemployed, most students, and those out of the labour market due to illness. With an employment rate of just over 71% as of 2025, Wales has one of the lowest employment rates in the UK – only ahead of the North East of England.
Figure 1. Employment rate by UK region, for those aged 16–64, 2025

Source: Authors’ calculations using the LFS (Office for National Statistics, 2026a).
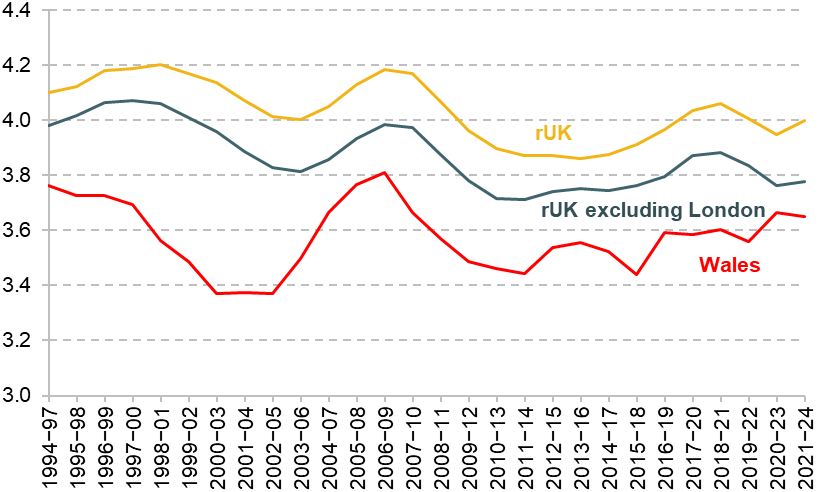
Wales has long had a lower employment rate than the rUK, as shown by Figure 2, which plots the rate for Wales, rUK, and rUK excluding London back to 1995. The employment rate in Wales has grown substantially since the mid-1990s, when it stood at 65%. At that time, there was a 5 percentage point gap between Wales’s employment rate and that of the rUK. Due to a spell of faster growth than the rUK in the early 2000s, and a second spell of slightly faster growth during the recovery from the 2008 financial crisis, Wales had closed most of this gap by the COVID-19 pandemic.1 However, since the pandemic, the employment rate in Wales has declined by more than in the rUK, taking the gap back up to around 4 percentage points.
Figure 2. Individual employment rate for those aged 16–64
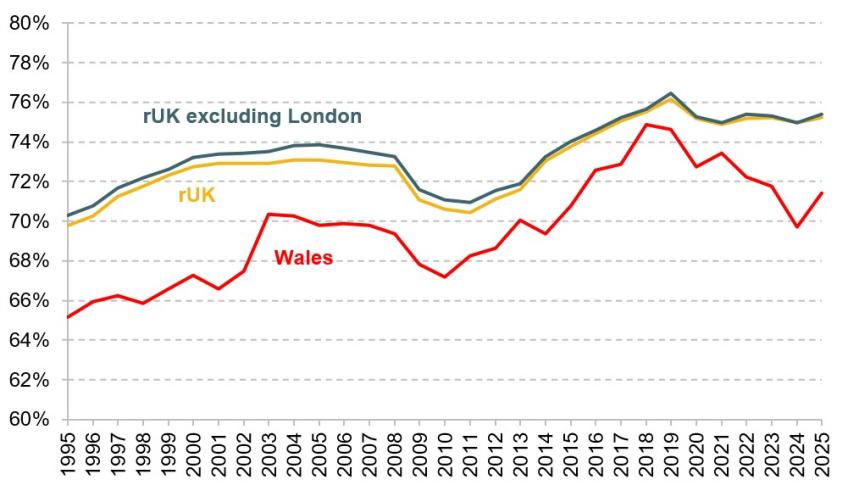
Source: Authors’ calculations using the LFS (Office for National Statistics, 2026a), 1995–2025.
As discussed in Section 1, ongoing issues with the LFS mean we need to be cautious when interpreting recent trends in this estimate. However, this broad pattern of Wales’s employment rate falling behind the rUK since the pandemic is also corroborated by the APS, which boosts the LFS sample (Welsh Government, 2026),2 and the FRS, the latter of which is plotted in Figure A1 in the Appendix. Therefore, while we cannot be confident of the exact size of the gap between Wales and rUK, the available evidence suggests it has widened since the pandemic.
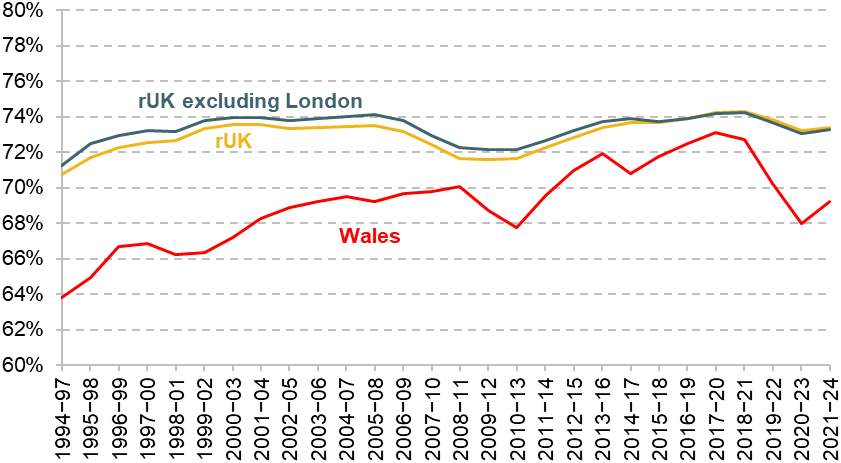
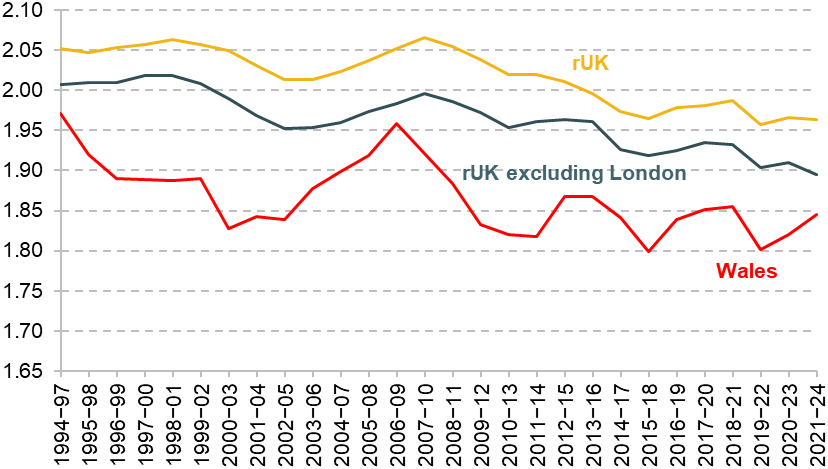
We see a similar picture when looking at the proportion of individuals in a household with at least one earner, which reflects both individual employment rates and household composition. This is important for understanding household income and poverty, which we examine later in more detail. Figure 3 shows that Wales partially caught up with the rUK on this measure, from the late 1990s up until the pandemic. In the mid-1990s, just under 67% of the population of Wales were in a working household, rising to 72% in the three years prior to the pandemic (despite the ageing population). In the rUK, this proportion rose from 72% to 75% over the same time period. Since the pandemic, the proportion in a working household has remained stable in the rUK. But in Wales the proportion has fallen, driven by falls in the individual employment rate, and as of the three years to 2023–24 it sat at 69%. Again, due to small sample sizes and representativeness concerns associated with the FRS in recent years, we should not over-interpret the exact magnitudes of these recent falls, but they do qualitatively align with trends in the LFS and APS, as described above.
Figure 3. Percentage of the population living in working households
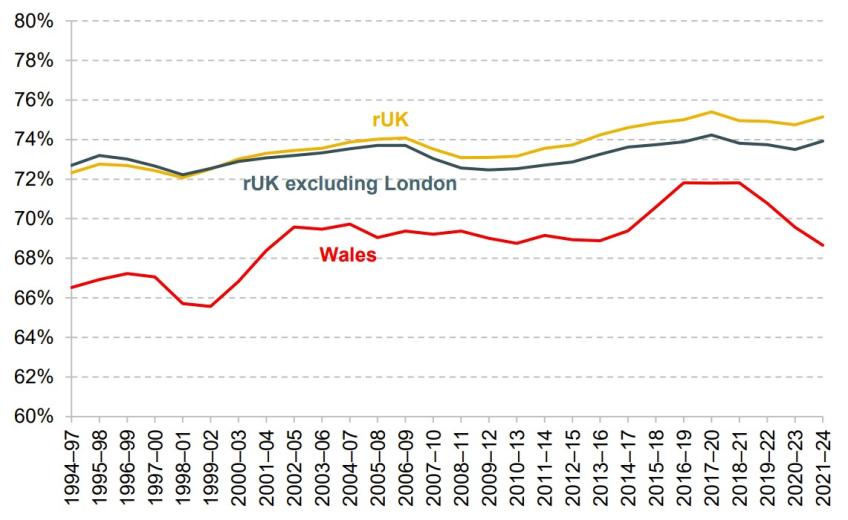
Source: Authors’ calculations using the FRS, 1994−95 to 2023−24.
Long-standing lower employment rates in Wales are explained by a higher rate of labour market inactivity, rather than higher rates of unemployment. Individuals are considered unemployed when they do not have a job but are seeking one. They are considered inactive when they are not looking for a job, for example due to ill health, caring responsibilities, studies (although students are often excluded from statistics) or early retirement. Welsh Government analysis finds that the economic inactivity rate has been consistently 2–4 percentage points higher than the rUK in recent decades, and that long-term sickness is the most common reason for inactivity in Wales (Welsh Government, 2025a). Perhaps in response to this, the Welsh Government has recently increased emphasis on targeting the disability employment gap, which we discuss in Box 1. Another key driver of higher economic inactivity is the fact that a slightly higher proportion of Wales’s working-age population is aged between 50 and 64 than the UK average (Welsh Government, 2024b). This group has a significantly higher rate of inactivity across the UK compared to other age groups. But within this age group, there is a particularly high inactivity rate of 38.1% in Wales (as of the most recent data) relative to 27.4% in the rUK (Department for Work and Pensions, 2024b).
Box 1. Disability employment gap
One employment issue that has received particular attention in Wales is the disability employment gap – that is, the percentage point gap between the employment for adults with and without disabilities. Figure 4 sets out the disability employment gap for working age adults for each nation of the UK. The figure shows that Wales has a 29% employment gap, roughly on par with Scotland, larger than England’s (which stands at 26%), and smaller than Northern Ireland’s (which is 39%). Wales, like Scotland and England, has seen a gradual decline in the disability employment gap since 2013–14, when the Office for National Statistics began reporting the gap. It is also worth noting that according to the 2021 census, Wales has a higher rate of disability than England (21.1%, compared to 17.1%), but that both England and Wales have seen falls in the rate of disability compared to 2011 (Office for National Statistics, 2023).
Figure 4. Disability employment gap
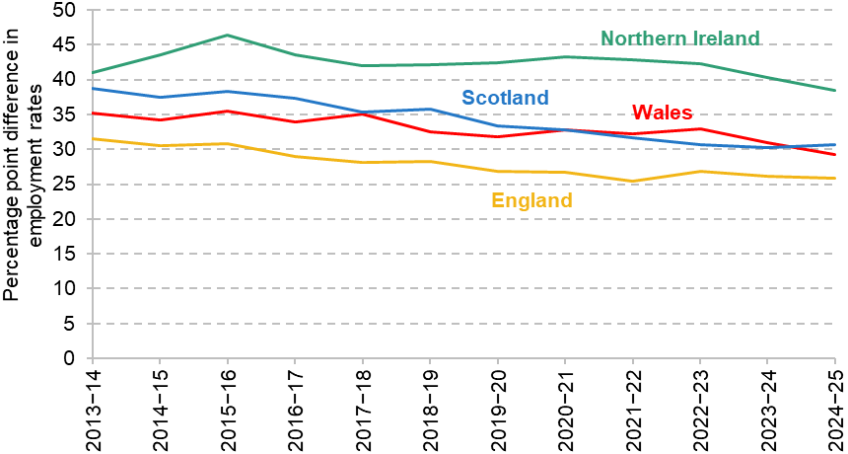
Source: Office for National Statistics (2025b).
A Senedd report published in 2025 has made several recommendations to the Welsh Government with the aim of further reducing the gap. This includes reforms to voluntary employer schemes such as the Disability Confident Scheme, an increased drive by the public sector to close the gap, underpinned by both improvements to data, and measurable, official targets to reduce the size of the gap by particular dates (Senedd, 2025).
Earnings
We now examine the before-tax earnings of people in employment. We begin with Figure 5, which plots mean and median (middle) monthly earnings for employees in Wales and the other nations and regions of the UK in 2025. This is based on HMRC’s RTI data. These data, rather than relying on a survey, come directly from HMRC’s PAYE systems. These have the advantage of not being subject to sampling volatility, or biases from certain types of people choosing not to respond to the survey. This also avoids both the bias and volatility that can result from misreporting of earnings. However, the data only include employees subject to PAYE, so people in self-employment and some of those undertaking casual work will not be captured.
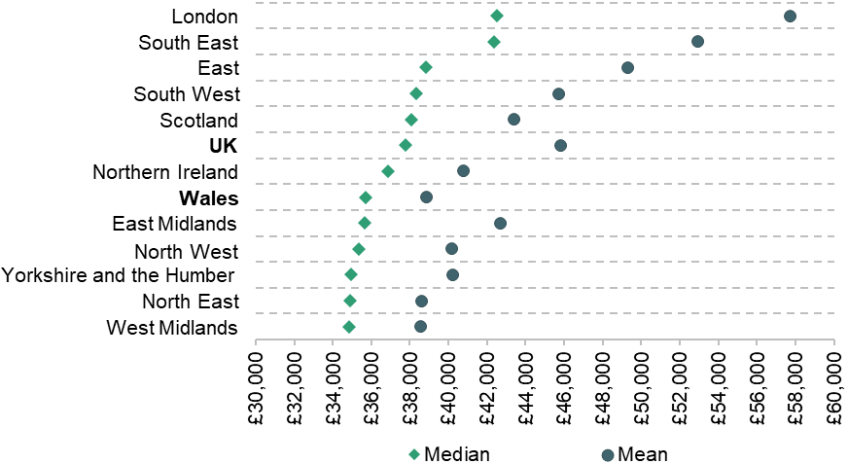
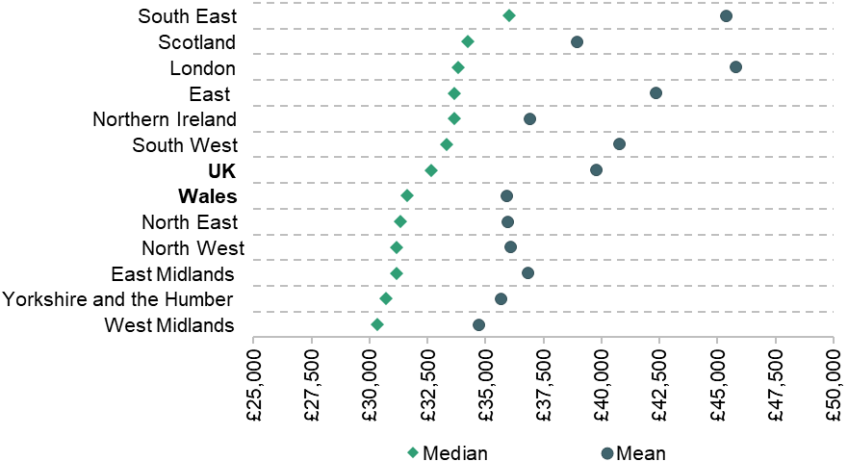
Figure 5. Median and mean RTI monthly earnings by UK region, 2025
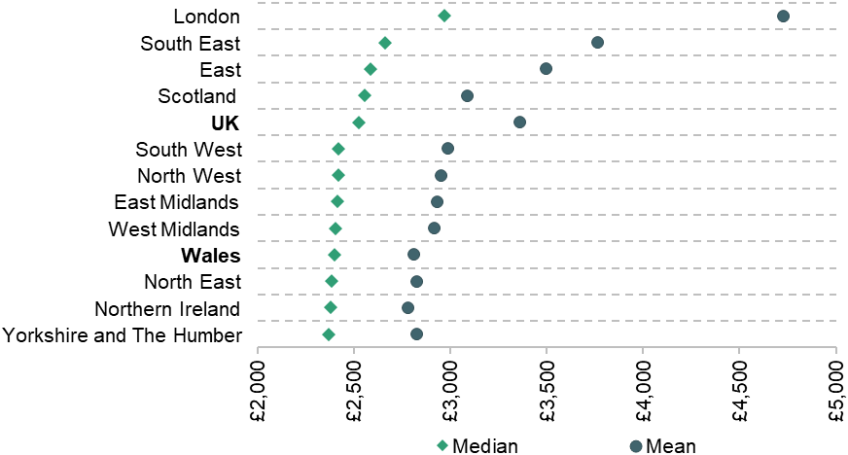
Note: This figure shows monthly earnings because RTI earnings are provided monthly and it is not accurate to straightforwardly convert median monthly earnings into median annual earnings.
Source: Earnings and employment from PAYE RTI, UK: February 2026 (Office for National Statistics, 2026b).
The figure shows that Wales’s median monthly earnings were £2,401 in 2025, compared to £2,526 in the UK as a whole – a difference of 5%. This puts Wales among the lower-earning nations and regions of the UK. Its median monthly earnings are similar to the Midlands, northern England, South West England and Northern Ireland. They are substantially below Scotland, the East and South East of England, and London.
The gap compared to the UK average in terms of mean earnings – especially compared to London and South East England – is larger. This is because Wales has fewer high earners. Whilst we do not observe regional pay distributions in the RTI data, 2025 ASHE survey data estimate that the 10th percentile of full-time earnings in Wales is only 1.5% lower than the UK 10th percentile, whereas the 90th percentile of full-time earnings in Wales is 21.2% lower than the UK 90th percentile.3
A key driver of low overall earnings in Wales, and lower proportions of high earners, is the fact that Wales has particularly low private sector earnings. Table 1 shows median earnings in both sectors for each region and nation of the UK, and the difference between the two (as a percentage of the private sector median). The data in this table come from a different data source (ASHE) to Figure 5, so the absolute earnings figures are not comparable. But the table shows two things:
- First, that the gap between median earnings in Wales and the UK as a whole is larger for the private sector (£28,714 versus £32,376 or 11%) than for the public sector (£32,783 versus £34,943 or 6%).
- Second, that Welsh public sector median earnings are 14% higher than private sector median earnings, the largest gap in the UK. Across the UK as a whole, public sector median earnings are only 8% higher. Some of this gap may reflect differences in the age, education and experience of workers between the public and private sectors. Even accounting for these factors, however, Wales has a larger gap between public and private sectors than most regions of the UK (Cribb, Dominguez and McKendrick, 2024). Increasing the competitiveness of the private sector will be critical to enable earnings in Wales to catch up with the rUK in a way that is fiscally sustainable.
Table 1. Median public and private sector annual earnings by UK region, 2025
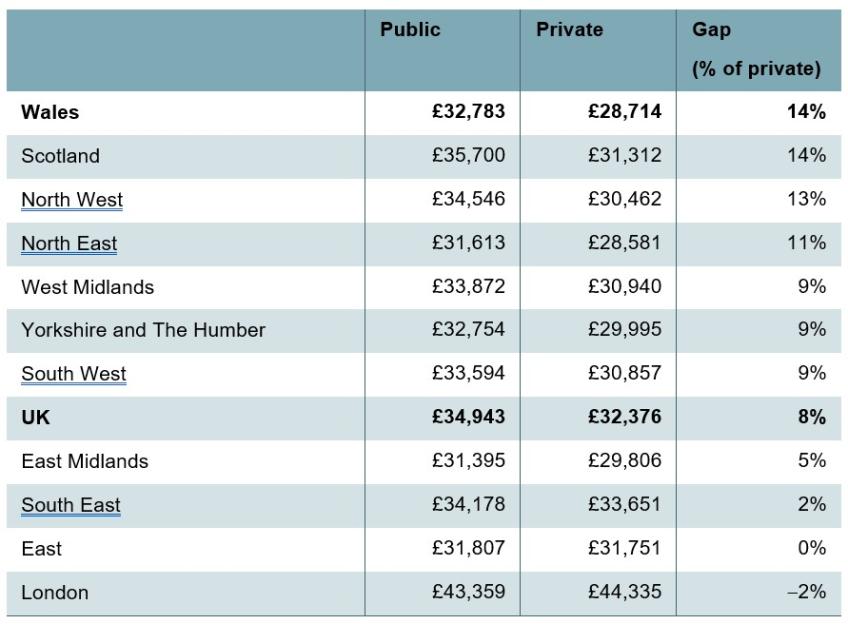
Source: ASHE, 2025 (Office for National Statistics, 2025c).
As well as differing between the public and private sectors, earnings differ by gender. Box 2 discusses the gender pay gap in Wales.
Box 2. Gender pay gap in Wales
The Welsh Government monitors the gender pay gap as one its national indicators of well-being and had set a target to eliminate the gap by 2025 (Welsh Government, 2022c). So far, its policies to reduce the gap have focused on encouraging proper reporting and payment of the ‘real living wage’ by businesses (Welsh Government, 2024c).
Figure 6 shows estimates from the Office for National Statistics of the gender pay gap in median full-time earnings for each nation and region of the UK, in 1997 when reporting began, and in 2025. The figure shows that Wales has almost eliminated its gender pay gap on this measure and has one of the lowest gaps in the UK: just 1.9%, compared to a UK average of 6.9%. This represents a substantial decline since 1997, and a faster rate of decline than anywhere else in the UK. There remains a gender pay gap of 9.7% in Wales (and 12.8% across the UK) in median pay when including part-time workers, reflecting both that part-time workers typically have lower hourly pay than full-time workers, and that women are substantially more likely to work part-time than men. There is also a gap of 4.7% in mean full-time earnings (compared to 10.9% across the UK), reflecting the fact that there are still more significant gaps in the share of women and men in the highest-paid jobs.
Figure 6. Percentage point gender pay gap in median full-time earnings by UK region in 1997 and 2025, as a proportion of men’s earnings
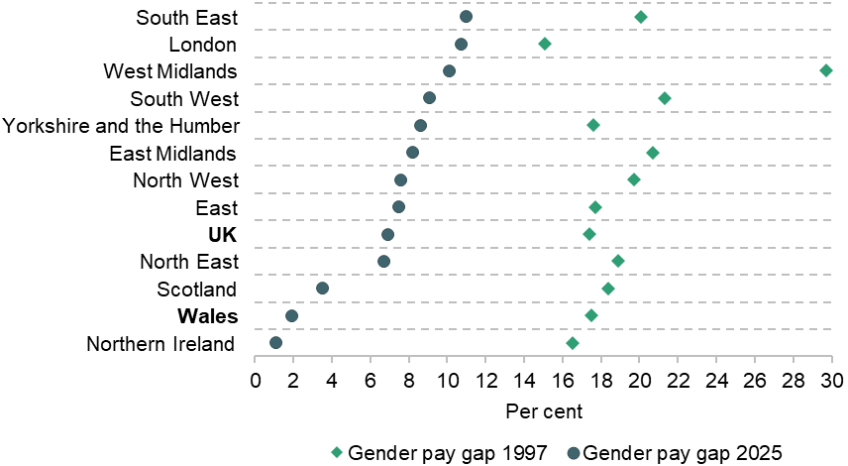
Source: Office for National Statistics (2025d).
Turning to trends in earnings over time, Figure 7 shows that growth in mean and median earnings in Wales has broadly followed trends across the UK over the last decade. Wales, just like the rUK, has seen relatively slow growth in earnings in this period (at least by the standards of the late 20th and 21st centuries). Welsh median monthly earnings have increased by 1.6% per year in real terms since 2019 (compared to 1.3% across the UK), and by 1.3% per year since 2015 when the RTI series begins (compared to 1.2% across the UK). Growth rates have been slower for mean earnings, for both Wales and rUK, suggesting slower growth in earnings among high earners than those with low and middle earnings. Figure A2 in the Appendix shows that household earnings, among households with at least one person in paid work, have seen similarly slow growth.
Figure 7. Median and mean monthly gross earnings
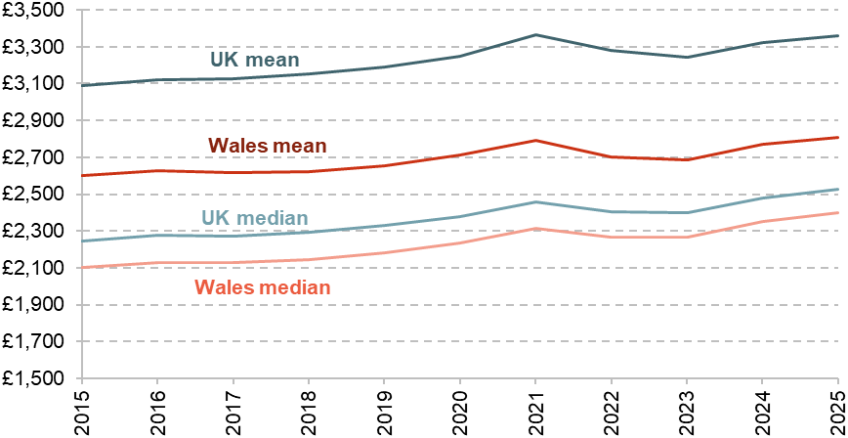
Source: Earnings and employment from PAYE RTI, UK: February 2026 (Office for National Statistics, 2026b).
Underlying Wales’s lower earnings is low productivity: on this metric, Wales is consistently close to the bottom when compared with other UK regions (Welsh Government, 2025b). This partially reflects differences in sector composition, with high-paying sectors such as IT, information and communication, professional and scientific activities, and financial services all forming a smaller share of the Welsh economy than the economy of the UK as a whole (and especially higher-earnings areas). However, low productivity in Wales does not just reflect the fact that Wales has a different mix of industries, but also that within given industries, productivity is lower (Welsh Government, 2025b).
How different is the picture across Wales?
In general, Wales lags behind the rUK in both employment and earnings. However, the size of this lag varies significantly across local areas within Wales. Figure 8 examines how median RTI monthly earnings differ across Welsh NUTS3 regions,4 comparing earnings to the contemporary Welsh median (left) and the contemporary UK median (right).
The regions with higher earnings are concentrated in the south-east of Wales, although Flintshire and Wrexham in the north-east also have higher earnings too. In the south-east, this is primarily driven by the concentration of high-value services in urban areas (and commuting to these jobs from nearby areas such as Monmouthshire and the Vale of Glamorgan). In the north-east, this instead reflects a concentration of relatively highly paid manufacturing jobs. Pay tends to be lower in more rural areas, although this is not a Wales-specific phenomenon. The differences in median earnings across Wales are not insignificant, with the median employee working in Monmouthshire and Newport (the region with the highest median earnings) earning 11.9% more than the median employee in Gwynedd (the region with the lowest median earnings). Over the 11 full years of the RTI series, there has been limited variation in earnings growth, with all regions averaging between 1.1% and 1.7% growth per year. Conwy and Denbighshire has seen the fastest growth in median monthly earnings, whilst Bridgend and Neath Port Talbot has seen the slowest growth in median monthly earnings. There is no obvious trend of different rates of earnings growth either increasing or decreasing earnings inequality in Wales over the last decade.
Figure 8 also shows that all areas of Wales have lower median monthly earnings than the UK median. In no year since 2015 have any of the 12 NUTS3 regions in Wales had as high a median wage as the contemporary UK median. This may change in the near future if trends in earnings growth continue, as over the course of the last ten years, a majority of Welsh regions have seen median earnings grow faster than the UK as a whole, albeit generally only by a small amount. This includes Monmouthshire and Newport, where median earnings are only fractionally below the rUK median.
Figure 9 shows the employment rate for different Welsh local authorities (LAs),5 plotting three-year rolling averages because these statistics come from survey data, and the sample size at the LA level can be quite small. Using the same methodology as we use to calculate LA employment rates, the employment rate across Wales was 73.1% and the employment rate across the UK was 75.5% on average from October 2022 to September 2025 (the most recent three years of available data).
There was relatively significant variation across Wales in employment rates during this period, although significantly less than in some other UK regions (particularly Scotland) Flintshire had the highest estimated employment rate (78.5%), whilst Rhondda Cynon Taf had the lowest estimated employment rate (67.3%). The areas with low employment rates are somewhat different to the areas with low median earnings. In the post-industrial South Wales Valleys, median earnings remain above those in rural areas. However, employment rates are significantly lower in the South Wales Valleys than in more rural aeras. Local area APS data for Wales go back to 2004, which means we have a better idea of how geographical differences in employment have changed over a longer time period. Over the last 20 years, LAs that initially had the lowest employment rates have seen their employment rates increase the most. This is particularly true of the South Wales Valleys – even though employment rates in this region remain lower than elsewhere in Wales. For example, the largest increase in employment rate over this period has been in Merthyr Tydfil: an estimated 9.7 percentage points, albeit from a very low baseline of 60.8% in the mid-2000s. Whilst this has resulted in lower employment areas somewhat catching up with high employment areas, this has not led to a significant reordering of LAs with ‘low’ and ‘high’ rates – five of the top seven LAs and four of the bottom seven in 2004−06 for employment rates were still in the top and bottom six, respectively, in the latest data. Since 2004−06, the employment rate has increased in all Welsh LAs except Powys (which has seen an estimated decline of 1.9 percentage points).
Unlike with earnings, some Welsh LAs have consistently performed well in employment rates relative to the UK average. Sampling variation means that employment rates jump around somewhat in the survey, but the employment rate in LAs such as Monmouthshire, Flintshire, Powys (with the exception of the last couple of years) and Wrexham has been typically above the overall UK rate over the sample period.
3. Household incomes, poverty and deprivation
We now turn to examine material living standards in Wales. Our main focus is net household income. This is partly determined by employment and earnings, which we discussed in the previous section. But it also includes other sources of income, such as benefits, income from savings and child maintenance, and is measured after deducting income tax, National Insurance contributions and council tax. In order to make comparisons across households of different sizes, we assume that resources are shared within the household and adjust – or equivalise – net household incomes so that they are comparable with a two-adult household. This equivalisation allows us to treat net household income as an indicator of people’s material living standards (Institute for Fiscal Studies, 2025). This analysis covers the whole population,6 including those who are retired, children, and people who are otherwise out of work.
We begin with average household incomes and income inequality, examining how Wales compares with the other nations and regions of the UK, and trends over time. We then zoom in on low-income households, measuring rates of income poverty in Wales, as well as other measures of deprivation. We end with some discussion of child poverty, in light of the Welsh Government’s focus on the issue. We discuss the policy levers available to the Welsh Government in tackling child poverty, and the difficult trade-offs faced by both the Welsh and UK governments.
Household incomes and income inequality
First, we examine average household net income in each region of the UK, plotted in Figure 10. As of 2022–25, Wales has a median equivalised household net income of £35,701, 5.5% lower than the UK median of £37,790. Median incomes in Wales are roughly similar to the north of England and West Midlands, but lower than the East Midlands, south of England (including London) and Scotland. When housing costs are deducted, the gap between Wales and the UK as a whole is smaller, as Wales has lower housing costs, as discussed in Box 3. Sampling uncertainty at the regional level means we cannot put too much weight on small differences, but this pattern is broadly consistent between years. The gap in mean incomes between Wales and the richer nations and regions is significantly larger, as Wales has proportionally fewer high-income households (driven by the relative lack of highly paid workers discussed in the previous section).
Figure 10. Median and mean annual household incomes by UK region, 2022−25
Note: Based on the new methodology for calculation of income and poverty statistics (see Section 1).
Source: Department for Work and Pensions (2026).
Box 3. Differences in housing costs
The gap between median incomes is slightly smaller after deducting housing costs (AHC; 3.3% rather than 5.5% in 2022–25). This reflects the fact that housing costs are lower in Wales than they are in the rUK. Figure A3 in the Appendix plots mean and median AHC incomes by region.
It is tricky to interpret differences in AHC incomes between areas. Deducting housing costs gives us a better indicator of living standards insofar as differences in housing costs are driven by differences in housing tenure, or simply because earnings or employment prospects are lower in Wales. In this case, it might make sense to think of Wales’s lower housing costs as reflecting higher material living standards, somewhat offsetting the effect of lower incomes before housing costs (BHC). However, if lower housing costs partly reflect lower-quality housing and/or local amenities in Wales, then AHC measures may overstate relative living standards in Wales.
There are also other circumstances in which AHC measures better captures low living standards, particularly pertinent to lower-income households and therefore when measuring poverty. For example, housing benefit covers the housing costs of some low-income renters, so if their rents increase and this is covered by an increase in benefits, they experience an increase in BHC income, but no increase in living standards, or AHC income. By comparison, if the increase is not covered by housing benefit (e.g. because they are a private renter and have hit the cap in support available in their area), then an increase in rents will lead to a fall in AHC income, reflecting their lower disposable income.
Differences in housing costs between Wales and rUK can be explained by differences in housing tenure to a small extent – Wales has slightly more owner-occupiers, slightly more owner-occupiers without a mortgage (likely explained by Wales’s older population) and slightly fewer private renters, compared with the rUK (Cribb, Wernham and Xu, 2023). However, these differences are small, and the larger contributor is the fact that house purchase prices (including price per square foot) and private rents are lower in Wales than in the rUK (Zoopla, 2024; Office for National Statistics, 2026d). Social rents are broadly comparable with England (Welsh Government, 2024d).
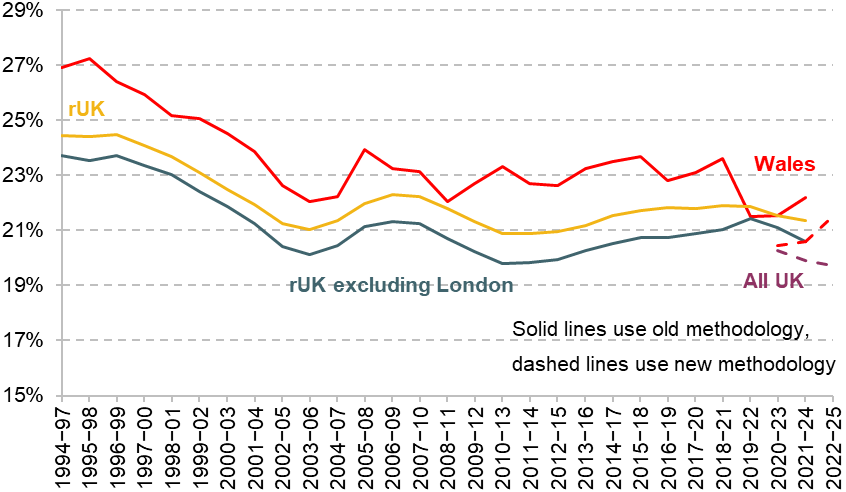
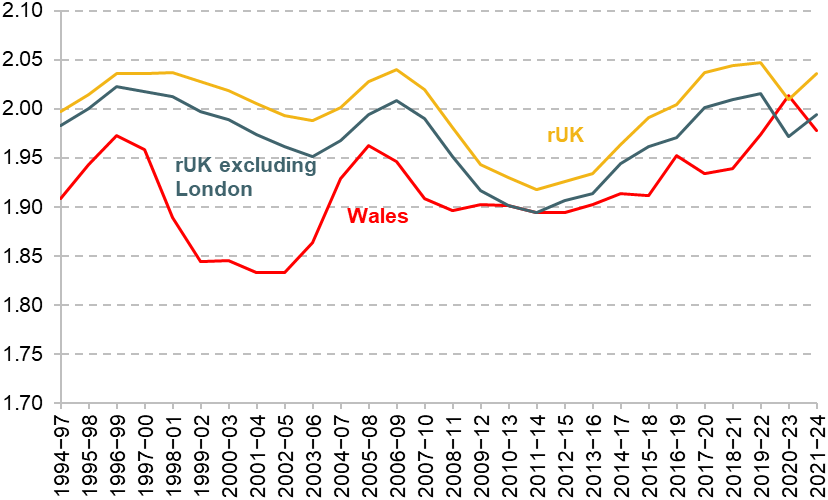
Turning to trends over time, Figure 11 shows the evolution of median household income from 1994−97 to 2022–25, for Wales, rUK, and rUK excluding London. These statistics are based on an older methodology that is comparable over time (see Section 1), while estimates for 2020–23 and 2022–25 based on the new methodology are also provided using dashed lines for Wales.
Figure 11. Median annual net household income
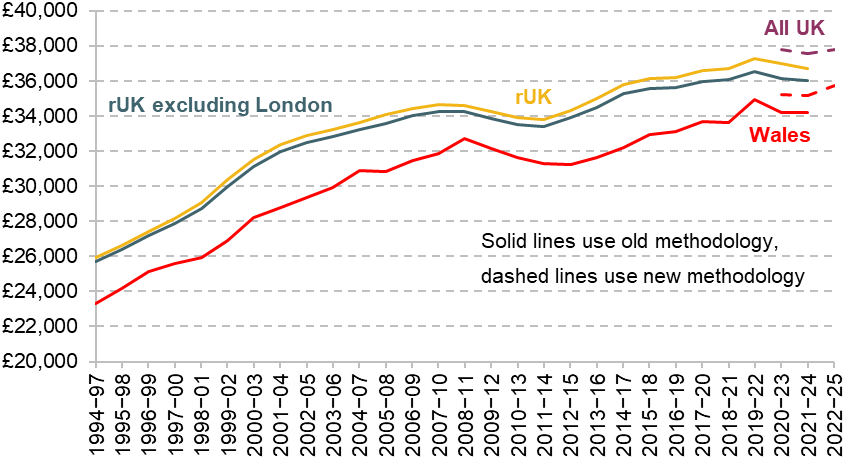
Note: See Section 1 for a discussion of the old and new methodologies for the calculation of income and poverty statistics.
Source: Authors’ calculations using the FRS, 1994−95 to 2023−24, and Department for Work and Pensions (2026).
The figure reveals that Wales has had relatively slow income growth since 2008, much like the rUK. Though there were signs of a pick-up in growth in the late 2010s, Wales and the rUK have since experienced stagnation through the pandemic and subsequent ‘cost-of-living crisis’. Income growth in both Wales and the rUK averaged just 0.7% per year between 2010–13 (the low point after the Great Recession) and 2021–24. The figure also shows that the gap in median household income between Wales and the rUK has been fairly stable over time – albeit declining slightly in percentage terms from around 10% in the 1990s to around 7% as of 2021–24.
Income inequality
Looking beyond average incomes, we now examine household incomes across the distribution, and levels of income inequality. Figure 12 plots income at each percentile of the household income distribution for Wales (red bars) and rUK (yellow bars, which are behind the red bars rather than stacked on top), using data from 2021–24 (based on the old methodology). The figure shows that incomes in Wales are behind the rUK at every level of the income distribution. But this gap between Wales and rUK is proportionally larger at the top of the income distribution than the bottom. Compared with the rUK, the 10th percentile of the household net income distribution in Wales is 4% lower, the 50th percentile (middle) is 7% lower7 and the 90th percentile is 13% lower.
Figure 12. Household income percentiles in Wales and rUK, 2021–24
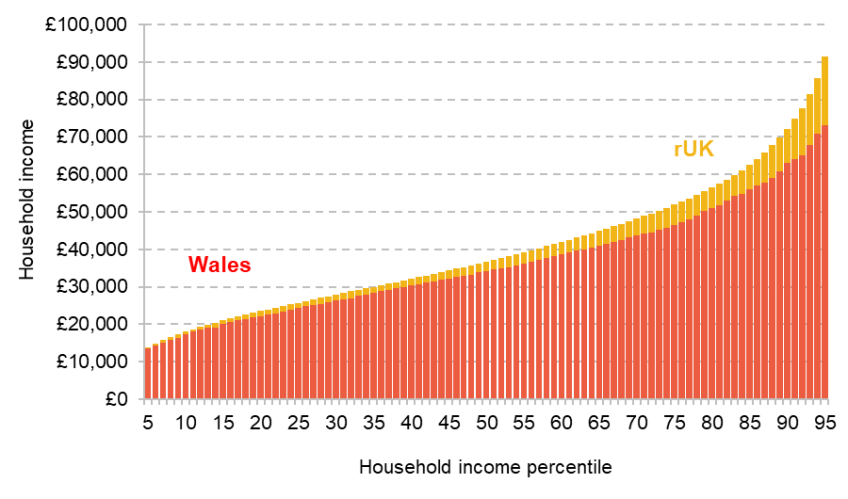
Note: Based on the old methodology for calculation of income and poverty statistics (see Section 1).
Source: Authors’ calculations using the FRS, 2021–24.
As a result of this pattern, Wales has lower income inequality than the rUK. This can be summarised by three measures of household income inequality. The 90:10 ratio (i.e. the ratio of the 90th and 10th percentiles of the income distribution8) gives us an idea of inequality between those close to the top, and those close to the bottom of the income distribution. The 90:10 ratio can in turn be broken down into the 90:50 ratio, which measures inequality between those close to the top and in the middle, and the 50:10 ratio, which measures inequality between those in the middle and those close to the bottom.
In 2021–24, the 90th percentile of incomes in Wales was 3.6 times higher than the 10th, whereas in the rUK it was four times higher, meaning less inequality across the distribution. There is some volatility in this estimate over time, but as shown in Figure A4 the difference in 90:10 ratios between Wales and rUK has been broadly consistent in magnitude in recent decades – with the exception of the early 2000s when the gap was even greater. Wales also has a lower 90:10 ratio than rUK excluding London (3.8), though the gap is smaller, as London has the most unequal incomes in the UK.
As shown by Figures A5 and A6 in the Appendix, Wales has had consistently lower 90:50 and 50:10 ratios than the rUK, meaning inequalities among the top half of incomes, and within the bottom half of incomes, are lower than in the rUK. The gap in the 90:50 ratio is larger than the gap in the 50:10 ratio, as Wales has fewer households with high incomes. It is important to note that the 90:50 and 90:10 ratios do not take into account incomes at the very top of the distribution, and on measures that do, the gap between Wales and the rUK would be even larger, due to the fact that British households with the very highest incomes are concentrated in London and its environs.
Poverty and deprivation
We have seen that incomes in Wales are lower than in the rUK, and that relatively poor households in Wales have lower incomes than relatively poor households in the rUK. In this subsection, we examine more measures focusing on the living standards of poorer households in Wales. Our main measure is the rate of relative income poverty – the proportion of people with household incomes below 60% of the UK median. This tracks the extent to which poorer households’ incomes keep pace with incomes in the middle. In Figure A7, we show rates of absolute poverty, giving the proportions with incomes below a poverty line that is fixed over time (at 60% of the inflation-adjusted 2010–11 median). We also examine measures of material deprivation – based on the proportions of people who report they are unable to afford certain ‘essentials’.
The Welsh Government has adopted relative AHC income poverty, and the proportion of adults living in material deprivation, as two key ‘national indicators’ of well-being (Welsh Government, 2022c). It says it would like to see a decrease in the ‘gap’ in poverty rates between people with and without certain characteristics (including being a child or having a disability) by 2035, and has indicated it wants to set an explicit target for reducing income poverty by 2050.
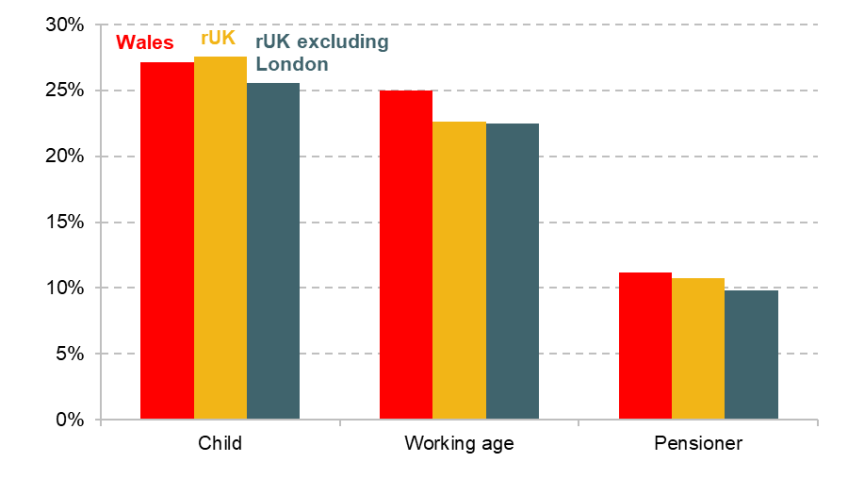
Figure 13 shows the proportion of people in relative AHC income poverty, by region and nation of the UK, and by age group. The figure shows that as of 2022–25, an estimated 22% of people in Wales are in poverty, slightly higher than the UK average of 20%. Wales also has a little higher rates of poverty among children and working-age adults, but slightly lower rates of poverty for pensioners, compared with the UK overall. The poverty rate in Wales is broadly similar to the regions in the north of England, lower than London, and higher than southern England (outside London), Scotland and Northern Ireland.
Figure 13. Relative income poverty, after deducting housing costs, by group and UK region, 2022–25
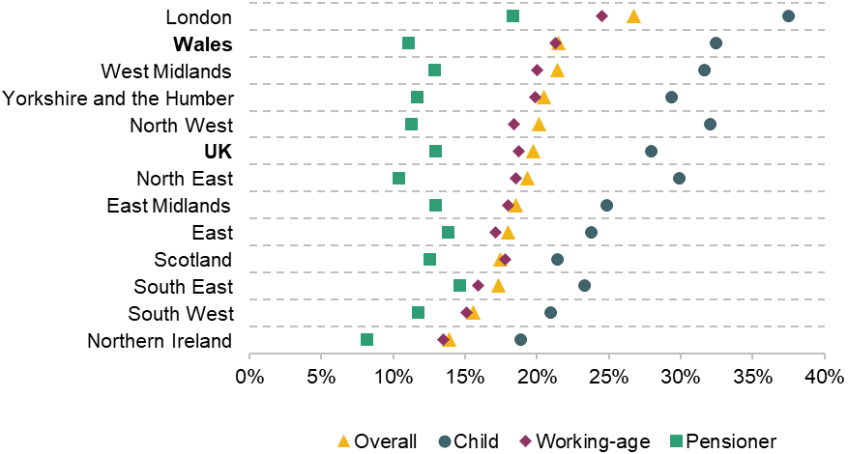
Note: Based on the new methodology for calculation of income and poverty statistics (see Section 1).
Source: Department for Work and Pensions (2026).
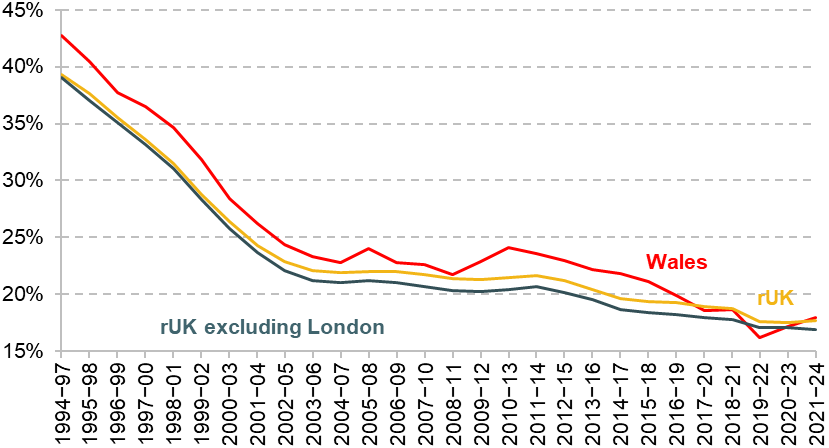
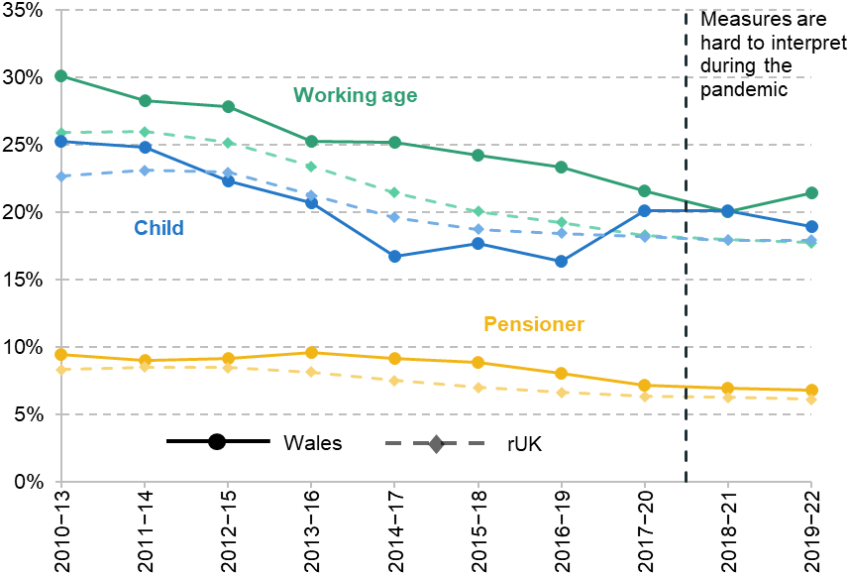
Estimates of regional poverty rates are somewhat volatile, which, combined with other shortfalls in the data discussed earlier, means we cannot be confident poverty rates are higher based only on the latest years of data. In a couple of recent years, the Welsh poverty rate was actually on par with the rUK, though this is a period of heightened volatility in regional estimates. In recent decades prior to the pandemic, relative poverty has consistently been approximately 1–2 percentage points higher in Wales than in the rUK. This is shown by Figure 14, which plots rates of poverty from 1994–97 to 2021–24 using the old methodology (see Section 1), and indicates that Welsh poverty rates hovered around 22%–24% since the mid-2000s. From the mid-1990s to mid-2000s, there were substantial declines in the poverty rate, driven by declining child and pensioner poverty. Trends in the poverty rate have broadly tracked the rUK for all three age groups, with rates a little higher in Wales across all three age groups in most years, as shown in Figures A8, A9 and A10. Again, the figures show updated estimates based on the new methodology for 2020–23 to 2022–25.
Figure 14. Relative income poverty, after deducting housing costs
Note: See Section 1 for a discussion of the old and new methodologies for the calculation of income and poverty statistics.
Source: Authors’ calculations using the FRS, 1994−95 to 2023−24, and Department for Work and Pensions (2026).
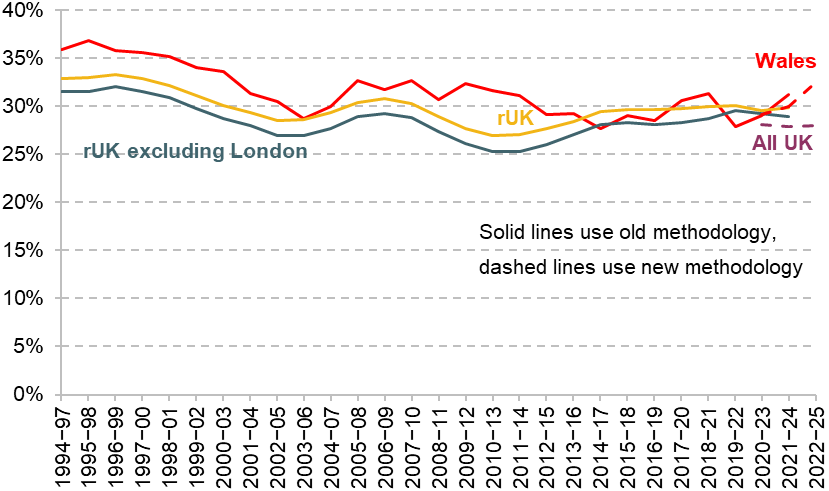
As discussed above, Wales has lower housing costs than the rUK on average, reducing its poverty rate on the above measures. This means that the gap in BHC poverty between Wales and rUK is even larger. Figure 15 shows that when based on BHC income, relative poverty rates in Wales have typically been 3–4 percentage points higher than in the rUK. We generally prefer using AHC income when examining poverty, because AHC incomes are typically better at identifying the households with the lowest living standards. Nevertheless, as discussed above, differences in BHC and AHC measures between regions can be tricky to interpret, and there are other reasons why BHC measures are sometimes preferable, which means examining both measures is valuable.
Figure 15. Relative income poverty, before deducting housing costs

Note: See Section 1 for a discussion of the old and new methodologies for the calculation of income and poverty statistics.
Source: Authors’ calculations using the FRS, 1994−95 to 2023−24, and Department for Work and Pensions (2026).
Material deprivation
Assessing poverty status by income does not allow us to perfectly identify households with the lowest material living standards. Other factors, such as differences in savings and differences in needs or costs (e.g. due to health), mean households with the same incomes (even after adjusting for household size) can have very different living standards. And differences in expenditure patterns mean poorer households can have their purchasing power eroded by more or less than is reflected in headline inflation-adjusted income statistics (if, for example, the prices of necessities that make up a bigger share of their budget increase by more or less than overall inflation). It is therefore useful to examine other measures of deprivation, beyond income poverty.
One useful measure is material deprivation. A family is considered materially deprived if they report that they are unable to afford a number of essential items, which can include heating the home, warm clothing and adequate food. The exact items contributing to the measure vary by age group, and so the measures are not comparable between ages. We use the definition of material deprivation set by the Department for Work and Pensions and measured across the UK using the FRS – the Welsh Government (2022c) has created an alternative measure of adult material deprivation based on a separate survey.
As shown in Figure A11 in the Appendix, material deprivation in Wales was notably higher (3–4 percentage points) for working-age adults than in the rUK in the 2010s. It has also typically been very slightly higher for pensioners, but comparable for children. As in the rUK, child and working-age material deprivation fell over the course of the 2010s across the UK, even as relative income poverty rates increased slightly. There was also a slight fall in pensioner material deprivation.
The definition of material deprivation has recently changed, which – combined with poor interpretability over the pandemic periods – means more recent trends are not especially reliable. Instead, Figure 16 captures the most recent snapshot of material deprivation published, based on 2023–24 data. The estimates of material deprivation should be interpreted with caution, as they draw only on one year of data and thus rely on small sample sizes for Wales.
Figure 16. Rates of material deprivation by age group, 2023–24
Source: Authors’ calculations using the FRS, 1994−95 to 2023−24.
The most robust way to consider recent trends in deprivation is to consider more specific indicators that are consistently defined over time. Figure 17 gives the proportion of people in families reporting that they are unable to heat their home or pay their bills, as well as the proportion experiencing food insecurity. A household is defined as being in food insecurity if they report that the food they could afford was not of sufficient quantity, quality, variety or desirability in the 30 days prior to interview. The figure shows that in recent years these measures have been broadly similar in both Wales and rUK, despite Wales having slightly higher AHC poverty rates and more substantially higher BHC poverty rates. The figure shows that, in both Wales (solid, darker shades) and the rUK (dashed, lighter shades), there were substantial increases in the proportion of households unable to heat their home or experiencing food insecurity in 2021–24, compared with before the pandemic. The fact that these trends differ so markedly from income poverty rates may be because price rises seen since the pandemic, in particular food and energy costs, disproportionately affected poorer families.
Figure 17. Percentage of people in families deprived of specific items
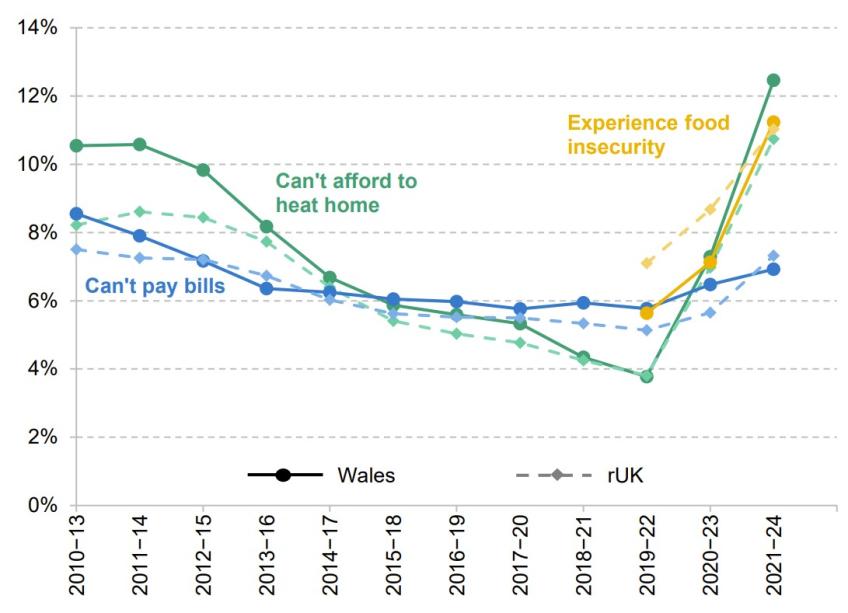
Source: Authors’ calculations using the FRS, 1994−95 to 2023−24.
Child poverty strategy
How should the Welsh Government reduce child poverty, and the wider inequalities associated with it?
Crucial for understanding how to tackle income poverty and the broader outcomes correlated with it, is understanding how they are linked. Unfortunately, the evidence here is not clear cut. The correlations between income poverty and broader child outcomes are very clear, but the extent to which income plays a causal role is not. Richer and poorer parents differ from each other in many ways other than income, including their own education and health, which may also affect their ability to support their children in these areas. Disentangling these effects, and isolating the causal role of income, is complicated. The academic literature suggests that income may have some causal effect on later outcomes – see Cooper and Stewart (2021) and Page (2024) for reviews. However, estimated effect sizes vary considerably, and some precise, high-quality studies find null results, and recent studies based on two randomised controlled trials have also found no evidence of effects on early childhood development (Krause et al., 2025; Noble et al., 2025) And a recent evaluation of the two-child limit to universal credit showed that an average reduction in income of over £10,000 by age 5 had no substantial impact on children’s school readiness at age 5 in England (Cattan, Waters and Wernham, 2025).
Insofar as income does causally create inequalities in children’s broader outcomes, then policymakers may be able to reduce income poverty directly, for example through cash transfers, in a way that simultaneously tackles those broader inequalities. Insofar as other factors cause these broader inequalities, other policy measures such as direct interventions through the health or education systems might be more effective at closing them. This may mean policymakers need to choose between these two objectives, or else spend more money in pursuit of both.
Constraints on the Welsh Government’s powers
The Welsh Government is relatively constrained in the extent to which it can use policy to directly target child income poverty. The easiest policy levers to achieve large and quick reductions in income poverty are found in benefits policy, and because social security is reserved to Westminster, the Welsh Government currently has less scope to use the benefit system to reduce child poverty than the Scottish Government does. As discussed in Adam et al. (2026), there may be scope for the Welsh Government to extend financial support to families through discretionary housing payments and ad-hoc grants. However, it is unclear whether the kind of large-scale regular top-ups targeting families with children proposed by Plaid Cymru (2025) – similar to the Scottish child payment implemented in Scotland – are feasible under the current devolution settlement.
Benefits are of course not the only determinant of the incomes of poorer households, and the Welsh Government is also targeting higher employment and wages as part of its child poverty strategy. However, some of the most direct policy levers available to influence employment and earnings, including minimum wages, employment law and conditionality in benefits policy, are also reserved to Westminster. And even if these policy levers were available, it would be very challenging to achieve large and fast reductions in child poverty using them (Henry and Wernham, 2024). The Welsh Government is instead relying in the short term on childcare provision (which currently is less generous than in England), promotion of good employment practices and the (voluntary) real living wage. In the longer term, parents’ education and skills are another driver of incomes (through higher earnings), which might be influenced by government policy.
The Welsh Government may have more scope to close inequalities in educational attainment and health than it does to boost the immediate material living standards of poorer children. Education, health and childcare are all fully devolved to Wales, meaning it faces fewer legal constraints on its ability to intervene in these areas. Instead, the challenge lies in identifying and implementing the most effective interventions, and of course funding them. In the long run, if these interventions are successful in boosting later life outcomes, some of this cost could be recovered, for example in higher tax revenues, or lower costs in providing healthcare. It is estimated, for example, that the UK government’s Sure Start programme introduced in 1999 almost paid for itself from the government’s perspective, and more than paid for itself if also accounting for the estimated boost to earnings for children attending Sure Start centres (Cattan, Waters and Wernham, 2025).
What policies are part of the strategy?
Against this backdrop, the Welsh Government has placed a particular emphasis on tackling child poverty, and in 2015 launched its child poverty strategy, which was last updated in 2024 (Welsh Government, 2024a). The most recent version of the strategy adopts five key objectives, and a package of policies in pursuit of each. The objectives span measures to directly (via benefits) and indirectly (via efforts to increase employment) boost family incomes, and measures to improve public service provision. The five objectives, and examples of policies set out in the strategy, are set out in Box 4.
Box 4. Child poverty strategy for Wales, 2024
- Increase family income and cut essential costs
- Boosting take-up of both Welsh and UK benefits
- Universal free school meals for primary-aged children
- Grants for education costs
- Creating ‘pathways out of poverty’
- Promoting the living wage, reducing barriers to work for parents, including through boosting skills
- Boosting early years provision and childcare, in hope of improving children’s later life outcomes
- Improve well-being through local services, better housing and community support
- Reforms to tenancies, and a scheme to bring empty homes back into use, to increase housing provision and improve experiences for renters
- Improved mental health services
- More access to sports and arts for children
- Deliver support with dignity and reduce stigma
- Improving children’s experiences of interacting with services, preventing discrimination and consulting with children
- Join up government and local delivery
- Sharing examples of good practice, and ensuring consistency in the quality of local service provision
Source: Welsh Government (2024a).
The Welsh Government’s child poverty strategy is therefore aiming both to reduce income poverty and deprivation in order to improve living standards directly, and to close some of the well-documented inequalities in education and health that are correlated with income poverty. This represents a broad set of objectives.
In its latest progress report, the Welsh Government lists a huge range of policies that it believes will directly or indirectly affect the living standards of children. A few of these are tightly focused on its child poverty goals, cutting costs or improving services for children. Others, such as its new bus franchising model, are tangentially related to child poverty at best. Policy changes made so far, and targeted specifically at improving the living standards of families with children, include (Welsh Government, 2025c): the completion of the roll-out of universal free school meals in primary schools; £1 bus fares for 5–15 year olds; and an expansion of its ‘Flying Start’ programme of free childcare for 2 year olds to more areas. These policies will clearly cut living costs for families with children to some degree. But they are unlikely to result in large changes to headline measures of income poverty, which are based narrowly on household incomes (though they do include a valuation of free school meals). The effect on broader outcomes is unclear – for example, there is mixed evidence of the effects of free school meals on child health (Cribb et al., 2023).
There is nothing wrong with a broad range of ambitions for supporting children in poverty, but there is scope for a clearer sense of prioritisation. This should reflect the government’s assessment of the relative importance of the objectives, and the powers it has to achieve them. There should be a frank assessment of which objectives it has insufficient levers to deliver, in the short or long term, in order to inform future debate on the devolution settlement.
Scotland, for example, has a narrow range of measurable targets based on income poverty and material deprivation, and it explicitly indicates which of its policies are likely to achieve which targets (including through impact modelling in the case of income poverty targets). It also indicates which policies are instead focused on broader objectives to tackle inequalities which are associated with poverty.
Challenges of measuring progress
Given the breadth of the strategy’s objectives, the Welsh Government has set out a wide range of quantitative measures of progress on its child poverty objectives (Welsh Government, 2024e), and it regularly publishes analysis of overall performance against these indicators. However, as discussed above, it is unclear in many cases how policies listed in its progress report fit into its overall child poverty strategy, and which indicators the Welsh Government hopes it will achieve measurable progress against.
Turning specifically to measures of income poverty and material deprivation, which are the focus of this report, ongoing challenges with the quality of income data discussed in Section 1 mean assessment of progress is challenging. Small sample sizes, low response rates and known issues with the quality of some income measures mean that poverty estimates are likely to remain volatile, and biased, though the Department for Work and Pensions is actively working on mitigating many of these issues. Nevertheless, these issues will become increasingly pertinent if the Welsh Government adopts an explicit poverty reduction target, as the current government has indicated it would like to. Issues with the data mean a material risk that the Welsh Government might either appear to have met a future poverty target or missed it, by a large margin, when in fact the reverse is true.
It is also important to remember that, even regarding goals to improve material living standards directly, measures of income poverty will not capture everything. For example, the Welsh Government’s efforts to cut costs for families will not have much impact on relative income poverty rates, which do not take account of differences in living costs (beyond housing) across the UK, or across the income distribution or demographic groups. Given this, it is right that the Welsh Government also includes measures of material deprivation in its indicators.
4. Concluding remarks
There remain a number of challenges facing the next Welsh Government in improving living standards in Wales. At 71%–72%, Wales has one of the lowest rates of employment in the UK. Earnings are lower, and median household net incomes are £2,100 per year (or 5.5%) lower than the rUK. Wales has lower income inequality than the rUK because it has relatively few high earners than in the rUK counterparts, but those on middle and low incomes are also poorer in Wales than their rUK counterparts. It is thanks to lower housing costs that the poverty rate of Wales is only a little higher than that of the rUK (22% compared to 20%), partially offsetting lower earnings and employment.
Achieving higher earnings is crucial to improving living standards in Wales in the longer term. As well as benefiting working households directly, higher earnings would mean more income tax revenue for the Welsh Government, giving it more resources to pursue its policy objectives. Boosting the earnings of people already in work would mean a bigger revenue boost than boosting employment rates – because the personal allowance would mean a significant chunk of the earnings from those entering work would not be taxable. But increasing employment – at least among members of households where no one is currently in work – would do more to reduce inequality.
The Welsh Government has made clear that it wants to reduce child poverty, but it currently has limited policy levers available to achieve a quick reduction in child poverty in the short run, which would require the use of benefits policy. Social security is reserved to Westminster, meaning that if the next Welsh Government wants to go down this route, it must either seek a change to the devolution settlement, or make use of creative (and potentially administratively costly) ad-hoc or locally delivered payments.
But the Welsh Government has signalled that its desire to reduce child poverty is accompanied by a desire to close the inequalities in opportunities, health and educational attainment faced by richer and poorer children, as much as improving immediate material living standards. The limited evidence we have from the UK suggests boosting poorer families’ incomes may not be enough to close these inequalities, and different sorts of interventions may be required. With control of the education and health systems in Wales, the Welsh Government may have more policy levers available to it to tackle these longer-running inequalities, but faces a challenge in identifying, and funding, the most effective interventions.
Appendix
Figure A1. Individual employment rate for those aged 16–64, FRS
Source: Authors’ calculations using the FRS, 1994−95 to 2023−24.
Figure A2. Median gross household earnings among individuals in working households

Source: Authors’ calculations using the FRS, 1994−95 to 2023−24.
Figure A3. Median and mean annual household incomes in UK regions after deducting housing costs, 2022−25
Note: Based on the new methodology for calculation of income and poverty statistics (see Section 1).
Source: Department for Work and Pensions (2026).
Figure A4. 90:10 ratio for net household income
Note: Based on the old methodology for calculation of income and poverty statistics (see Section 1). The income ratios shown here do not exactly match the ratios implied by the percentiles shown in Figure 12. This is because this figure shows three-year averages of annual percentile ratios, whereas Figure 12 shows three-year averages of the percentiles themselves, from which slightly different ratios would be obtained.
Source: Authors’ calculations using the FRS, 1994−95 to 2023−24.
Figure A5. 90:50 ratio for net household income
Note: Based on the old methodology for calculation of income and poverty statistics (see Section 1). The income ratios shown here do not exactly match the ratios implied by the percentiles shown in Figure 12. This is because this figure shows three-year averages of annual percentile ratios, whereas Figure 12 shows three-year averages of the percentiles themselves, from which slightly different ratios would be obtained.
Source: Authors’ calculations using the FRS, 1994−95 to 2023−24.
Figure A6. 50:10 ratio for net household income
Note: Based on the old methodology for calculation of income and poverty statistics (see Section 1). The income ratios shown here do not exactly match the ratios implied by the percentiles shown in Figure 12. This is because this figure shows three-year averages of annual percentile ratios, whereas Figure 12 shows three-year averages of the percentiles themselves, from which slightly different ratios would be obtained.
Source: Authors’ calculations using the FRS, 1994−95 to 2023−24.
Figure A7. Absolute income poverty, after deducting housing costs
Note: Based on the old methodology for calculation of income and poverty statistics (see Section 1).
Source: Authors’ calculations using the FRS, 1994−95 to 2023−24, and Department for Work and Pensions (2026).
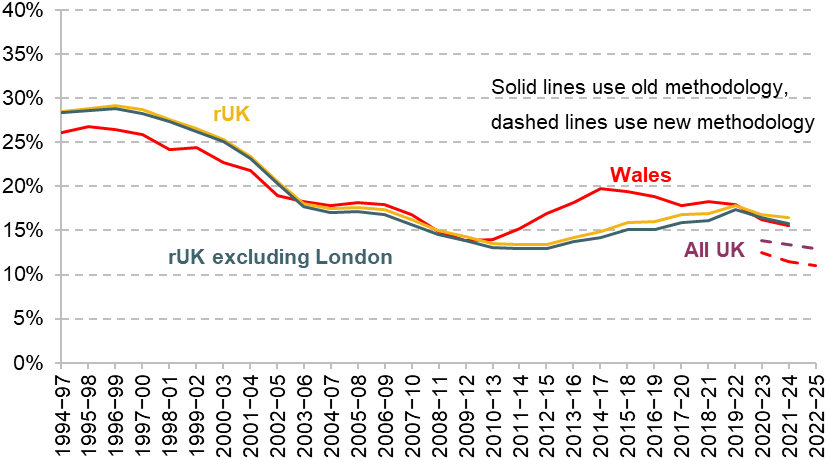
Figure A8. Relative child income poverty, after deducting housing costs
Note: See Section 1 for a discussion of the old and new methodologies for the calculation of income and poverty statistics.
Source: Authors’ calculations using the FRS, 1994−95 to 2023−24.
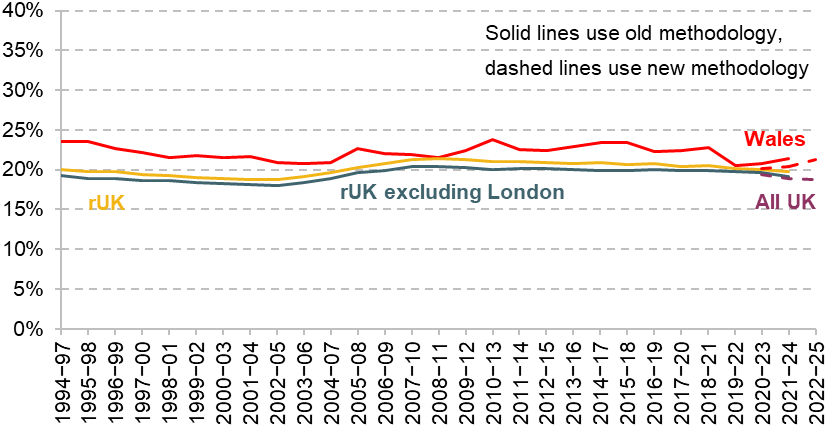
Figure A9. Relative pensioner income poverty, after deducting housing costs
Note: See Section 1 for a discussion of the old and new methodologies for the calculation of income and poverty statistics.
Source: Authors’ calculations using the FRS, 1994−95 to 2023−24, and Department for Work and Pensions (2026).
Figure A10. Relative working-age income poverty, after deducting housing costs
Note: See Section 1 for a discussion of the old and new methodologies for the calculation of income and poverty statistics.
Source: Authors’ calculations using the FRS, 1994−95 to 2023−24, and Department for Work and Pensions (2026).
Figure A11. Rates of material deprivation by age group, 2010 definition
Source: Authors’ calculations using Family Resources Survey, 1994−95 to 2023−24.
References
Adam, S., Michael, J., Phillips, D. and Wernham, T., 2026. The Welsh Government’s record on tax and benefit policy. IFS Report, https://ifs.org.uk/publications/welsh-governments-record-tax-and-benefit-policy.
Cattan, S., Waters, T. and Wernham, T., 2025. What is the effect of the two-child limit on children’s school readiness? IFS Report, https://ifs.org.uk/publications/what-effect-two-child-limit-childrens-school-readiness.
Cooper, K. and Stewart, K., 2021. Does household income affect children’s outcomes? A systematic review of the evidence. Child Indicators Research, 14, 981−1005, https://doi.org/10.1007/s12187-020-09782-0.
Cribb, J., Dominguez, M. and McKendrick, A., 2024. Pressures on public sector pay. IFS Green Budget 2024, https://ifs.org.uk/publications/pressures-public-sector-pay.
Cribb, J., Farquharson., C, McKendrick, A. and Waters, T., 2023. The policy menu for school lunches: options and trade-offs in expanding free school meals in England. IFS Report, https://ifs.org.uk/publications/policy-menu-school-lunches-options-and-trade-offs-expanding-free-school-meals-england.
Cribb, J., Wernham, T. and Xu, X., 2023. Housing costs and income inequality in the UK. Country Studies: Inequalities in Europe and North America. A parallel study to the IFS Deaton Review, https://ifs.org.uk/sites/default/files/2024-01/IFS-Report-Housing-costs-and-income-inequality-in-the-UK-edited.pdf.
Department for Work and Pensions, 2024a. Family Resources Survey transformation: integrating administrative data into the FRS. https://www.gov.uk/government/publications/family-resources-survey-transformation-integrating-administrative-data-into-the-frs/family-resources-survey-transformation-integrating-administrative-data-into-the-frs.
Department for Work and Pensions, 2024b. Economic labour market status of individuals aged 50 and over, trends over time: September 2024. https://www.gov.uk/government/statistics/economic-labour-market-status-of-individuals-aged-50-and-over-trends-over-time-september-2024/economic-labour-market-status-of-individuals-aged-50-and-over-trends-over-time-september-2024.
Department for Work and Pensions, 2026. Households Below Average Income: an analysis of the UK income distribution: FYE 1995 to FYE 2025. https://www.gov.uk/government/statistics/households-below-average-income-for-financial-years-ending-1995-to-2025.
Henry, A. and Wernham, T., 2024. Child poverty: trends and policy options. IFS Green Budget 2024, https://ifs.org.uk/publications/child-poverty-trends-and-policy-options.
Institute for Fiscal Studies, 2025. Living standards, poverty and inequality in the UK – Methodology. https://ifs.org.uk/living-standards-poverty-and-inequality-uk/methodology.
Krause, P. K., Rhodes, E., Miller, S., Bartik, A. W., Broockman, D. E. and Vivalt, E., 2025. The impact of unconditional cash transfers on parenting and children. National Bureau of Economic Research Working Paper 34040, https://www.nber.org/papers/w34040.
Noble, K., Magnuson, K., Duncan, G., Gennetian, L. A., Yoshikawa, H., Fox, N. A., Halpern-Meekin, S., Troller-Renfree, S., Han, S., Egan-Dailey, S., Nelson, T. D., Nelson, J. M., Black, S., Georgieff, M. and Karhson, D., 2025. The effect of a monthly unconditional cash transfer on children’s development at four years of age: a randomized controlled trial in the U.S. National Bureau of Economic Research Working Paper 33844. https://www.nber.org/papers/w33844.
Office for National Statistics, 2023. Disability, England and Wales: Census 2021. https://www.ons.gov.uk/peoplepopulationandcommunity/healthandsocialcare/healthandwellbeing/bulletins/disabilityenglandandwales/census2021.
Office for National Statistics, 2025a. Labour Force Survey performance and quality monitoring report: October to December 2025. https://www.ons.gov.uk/employmentandlabourmarket/peopleinwork/employmentandemployeetypes/methodologies/labourforcesurveyperformanceandqualitymonitoringreportoctobertodecember2025.
Office for National Statistics, 2025b. The employment of disabled people 2025. https://www.gov.uk/government/statistics/the-employment-of-disabled-people-2025/the-employment-of-disabled-people-2025.
Office for National Statistics, 2025c. Earnings and hours worked, public and private sector: ASHE table 13. https://www.ons.gov.uk/employmentandlabourmarket/peopleinwork/earningsandworkinghours/datasets/publicandprivatesectorashetable13.
Office for National Statistics, 2025d. Gender pay gap in the UK: 2025. https://www.ons.gov.uk/employmentandlabourmarket/peopleinwork/earningsandworkinghours/bulletins/genderpaygapintheuk/2025#the-gender-pay-gap-by-region.
Office for National Statistics, 2026a. HI00 Regional labour market: headline Labour Force Survey indicators for all regions. https://www.ons.gov.uk/employmentandlabourmarket/peopleinwork/employmentandemployeetypes/datasets/headlinelabourforcesurveyindicatorsforallregionshi00.
Office for National Statistics, 2026b. Earnings and employment from Pay As You Earn Real Time Information, revision triangle. https://www.ons.gov.uk/employmentandlabourmarket/peopleinwork/earningsandworkinghours/datasets/earningsandemploymentfrompayasyouearnrealtimeinformationrevisiontriangle.
Office for National Statistics, 2026c. Annual Population Survey. https://www.nomisweb.co.uk/home/release_group.asp?g=16.
Office for National Statistics, 2026d. Private rent and house prices, UK: February 2026. https://www.ons.gov.uk/economy/inflationandpriceindices/bulletins/privaterentandhousepricesuk/february2026#house-prices-across-the-uk-and-by-english-region.
Page, M., 2024. New advances on an old question: does money matter for children’s outcomes? Journal of Economic Literature, 62, 891−947, https://doi.org/10.1257/jel.20231553.
Plaid Cymru, 2025. A Plaid Cymru Government would launch ‘transformational’ child payment to tackle child poverty. https://www.partyof.wales/cynnal_announcement.
Ray-Chaudhuri, S. and Wernham, T., 2025. New data suggest dramatic decline in living standards, but it may just be the quality of the data that has declined. IFS Comment, https://ifs.org.uk/articles/new-data-suggest-dramatic-decline-living-standards-it-may-just-be-quality-data-has.
Senedd, 2025. Wales’s Disability Employment Gap consistently the highest in Britain. https://senedd.wales/senedd-now/news/wales-s-disability-employment-gap-consistently-the-highest-in-britain.
Welsh Government, 2022a. Stronger, fairer, greener Wales: a plan for employability and skills: summary. https://www.gov.wales/stronger-fairer-greener-wales-plan-employability-and-skills-summary-html.
Welsh Government, 2022b. A guide to fair work. https://www.gov.wales/guide-fair-work.
Welsh Government, 2022c. Wellbeing of Wales: national indicators. https://www.gov.wales/wellbeing-wales-national-indicators.
Welsh Government, 2024a. Child Poverty Strategy for Wales 2024. https://www.gov.wales/child-poverty-strategy-wales-2024.
Welsh Government, 2024b. National level population estimates by year, age and UK country. https://statswales.gov.wales/Catalogue/Population-and-Migration/Population/Estimates/nationallevelpopulationestimates-by-year-age-ukcountry.
Welsh Government, 2024c. Pay gap – Factsheet. https://businesswales.gov.wales/responsible-business/documents/pay-gap-factsheet.
Welsh Government, 2024d. Social landlord housing stock and rents: as at 31 March 2024. https://www.gov.wales/social-landlord-housing-stock-and-rents-31-march-2024-html.
Welsh Government, 2024e. Child Poverty Strategy Monitoring Framework. https://www.gov.wales/sites/default/files/statistics-and-research/2024-10/child-poverty-strategy-monitoring-framework.pdf.
Welsh Government, 2025a. Labour market statistics (Annual Population Survey): 2024. https://www.gov.wales/labour-market-statistics-annual-population-survey-2024-html.
Welsh Government, 2025b. Welsh Government Wales Economic and Fiscal Report 2025. https://www.gov.wales/sites/default/files/publications/2025-11/wales-economic-and-fiscal-report-2025.pdf.
Welsh Government, 2025c. Child Poverty Strategy for Wales: progress report 2025. https://www.gov.wales/child-poverty-strategy-wales-progress-report-2025-html.
Welsh Government, 2026. Labour market statistics (Annual Population Survey): October 2024 to September 2025. https://www.gov.wales/labour-market-statistics-annual-population-survey-october-2024-september-2025-html.
Zoopla, 2024. Where can you get more space for your money? https://www.zoopla.co.uk/discover/property-news/what-is-the-best-value-home/.
Data
Department for Work and Pensions, NatCen Social Research. (2021). Family Resources Survey. [data series]. 4th Release. UK Data Service. SN: 200017, DOI: http://doi.org/10.5255/UKDA-Series-200017.
Acknowledgements
This report is the fourth in a series of Wesh election briefings funded by the Nuffield Foundation (grant reference WEL/FR-000026348). Co-funding from the Economic and Social Research Council (ESRC) through the Centre for the Microeconomic Analysis of Public Policy is also gratefully acknowledged (grant reference ES/Z504634/1).
The Nuffield Foundation is an independent charitable trust with a mission to advance social well-being. It funds and undertakes rigorous research, encourages innovation and supports the use of sound evidence to inform social and economic policy, and improve people’s lives. The Nuffield Foundation is the founder and co-funder of the Nuffield Council on Bioethics, the Ada Lovelace Institute and the Nuffield Family Justice Observatory. Find out more at www.nuffieldfoundation.org.
The authors thank Anvar Sarygulov (Nuffield Foundation) and Tom Waters and Helen Miller (IFS) for helpful comments and suggestions. All views expressed and any errors or omissions are the responsibility of the authors alone, and not necessarily representative of the views of the Nuffield Foundation or its trustees or staff.
Endnotes
Authors

Jed Michael
Jed joined the IFS in 2025 and works in the Income, Work and Welfare (IWW) sector.

Tom Wernham
Tom's main research areas are living standards and poverty, the benefits system, and its interactions with the labour market.
More from IFS
Understand this issue


Policy analysis


Academic research


