
Downloads
Download the report as a PDF
PDF | 1015.64 KB
Executive summary
The Scottish Government aims to increase employment and earnings as part of its ‘National Strategy for Economic Transformation’ and in order to help generate additional tax revenues that can help fund public services and investment. It also has ambitious targets to significantly reduce poverty, specifically among children.
This report documents how earnings and employment have evolved over time in Scotland, how different parts of Scotland compare, and how trends have differed between Scotland and the rest of the UK. It then looks at average income, income inequality and poverty, and discusses the Scottish Government’s strategy for reducing child poverty.
Key findings
- Since the late 2010s, the employment rate in Scotland has been a little lower than in the rest of the UK. The employment rate was 1.2 percentage points lower on average over 2019–2025, and 0.4 percentage points lower in 2025 specifically, though data quality concerns mean we must be cautious about quantifying the gap too precisely. Slightly lower employment in Scotland is explained by higher rates of inactivity in Scotland rather than by higher levels of unemployment. In particular, rates of inactivity due to long-term sickness or disability are higher in Scotland than in the UK as a whole.
- Median monthly earnings for employees in Scotland were £2,554 in 2025, around 1.1% above the UK figure of £2,526. Both lower- and higher-paying jobs are somewhat less common in Scotland than in the rest of the UK, with 90th percentile earnings around 7% lower than in the UK as a whole. Over the last decade, growth in median monthly earnings has broadly tracked that of the UK, with Scotland experiencing average real-terms growth of 1.1% a year since 2015 compared with 1.2% across the UK as a whole.
- Earnings and employment differ significantly across Scotland. Median earnings in Edinburgh – which has a strong, diversified service sector – and the North East of Scotland – which benefits from the high-paying oil and gas industry – are significantly higher than the UK median. In contrast, median earnings in some parts of the South and West of Scotland are significantly below the UK median. However, these geographic inequalities have reduced over the last decade due to the decline of the oil and gas industry and faster earnings growth in the South. The pattern is similar for employment rates, which in general are much higher in Northern Scotland, Edinburgh and the Lothians than in much of the South and West – although again with these differences being somewhat smaller than 20 years ago.
- As well as aiming to increase earnings and employment, the Scottish Government’s ‘fair work’ plan focuses on tackling issues such as low pay, the gender pay gap and the disability employment gap. Scotland’s disability employment gap stands at 31 percentage points, higher than in England, but a significant fall relative to previous levels, with the current Scottish Government targeting a further fall to 19 percentage points by 2038. Scotland’s gender gap in median full-time earnings is 3.5%, which is among the lowest in the UK, following larger-than-average falls in the pay gap over the last 30 years. But a larger gender pay gap of 8.0% remains for mean full-time earnings, as there are more higher-earning men than women.
- As of the latest data, median annual household net incomes in Scotland (£38,092 per year, or £3,174 per month) are similar to those in the UK as a whole (£37,790 per year, or £3,149 per month). Household net incomes include earnings, net of taxes, as well as other income sources such as benefits. Because housing costs are much lower in Scotland than elsewhere in the UK, median annual net incomes after housing costs are almost 5% higher in Scotland (£34,258) than in the UK as a whole (£32,680), and are higher than in all UK regions other than the South East of England.
- Income inequality is slightly lower in Scotland than in the rest of the UK (rUK). Though we do not have fully up-to-date data on income inequality within Scotland, the latest available data from 2021–24 suggest the 90th percentile of incomes in Scotland was 3.8 times the 10th percentile – the same 90:10 ratio as rUK excluding London, but a little below the 4.0 seen in rUK including London. Lower income inequality is driven by the fact that Scotland has fewer high-income households than rUK as a whole, while the incomes of middle-income and poorer households in Scotland are comparable to those in rUK. Devolved income tax and benefit policy is more progressive than in rUK and is thereby doing more to reduce income inequality in Scotland – without more progressive devolved taxes, the 90:10 ratio would be comparable to that for rUK as a whole (including London).
- Just over 17% of people in Scotland were in relative poverty after housing costs in the latest data, below the UK average of just under 20%. Relative poverty – the proportion with household incomes below 60% of the UK-wide median after adjusting for household size – increased gradually over the 2010s in Scotland while remaining steady in the rest of the UK, but there are signs that it may have fallen more recently. Lower housing costs in Scotland contribute to lower poverty rates, and rates of material deprivation (which measure the proportion of people unable to afford a range of basic goods and services) have typically been slightly lower in Scotland than in the rest of the UK in recent years. Estimates of poverty are always somewhat volatile at a regional level, and there is substantial statistical uncertainty associated with them.
- Scotland has among the lowest child poverty rates in the UK (21%). Scottish benefits are playing a significant role in holding child poverty down, and the Scottish Government projects devolved benefits will reduce child poverty by 100,000 (10 percentage points) in 2026–27 relative to the situation in which those benefits did not exist (most of this reduction reflects Scotland-only benefits, but some reflects devolved benefits where equivalent benefits exist in the rest of the UK). Despite this, the Scottish Government projects it will miss its highly ambitious target to bring relative child poverty down to 10% by 2030 by some margin. The most direct way to make progress towards the target would be further rises in Scottish benefits, but this would come at considerable cost; moreover, without reforms, such an increase would exacerbate the problems currently caused by the inefficient and potentially unfair means-testing of these benefits. Increased employment and earnings could also bring poverty down, but achieving quick and large reductions through these mechanisms is very challenging.
1. Data used in this report
This report draws on a range of evidence from both administrative data sources and surveys.
- Our analysis of earnings and employment makes use of several surveys: the Labour Force Survey (LFS), the source of official employment statistics; the Annual Population Survey (APS), which collects a narrower range of data from the LFS sample and an additional booster sample; and the Annual Survey of Hours and Earnings (ASHE), which is based on a survey of employers. In addition, we use information from His Majesty’s Revenue and Customs (HMRC) pay as you earn (PAYE) real-time information (RTI) administrative data on earnings and jobs, compiled by the Office for National Statistics.
- Our analysis of household incomes and poverty relies on the Family Resources Survey (FRS), the source of official estimates of income distribution statistics, poverty rates and material deprivation measures.
Estimates based on surveys are always subject to some uncertainty, and risks that surveys may systematically under-record (or over-record) some population groups (despite efforts to weight the data to avoid this). However, surveys include more information on more household and individual characteristics than is typically available in administrative data.
For results based on the FRS, which has particularly small sample sizes for Wales, Scotland, Northern Ireland and the individual regions of England, we report three-year rolling averages to reduce the sensitivity of our results to sample volatility. We also exclude the survey from 2020−21 due to concerns over reliability around the pandemic. This means that three-year rolling averages that would otherwise include this year only average over the two other years. This is in line with government practice for official statistics.
The FRS has also seen a fall in response rates since the pandemic. Previous work suggests there is reason to be more cautious in interpreting statistics calculated based on these data since the pandemic (Ray-Chaudhuri and Wernham, 2025). In addition, there are long-running issues with the coverage of benefit income in the FRS; analysis by the Department for Work and Pensions suggests this is a result of both under-representation of benefit recipients in the data and mismeasurement of respondents’ benefit income (Department for Work and Pensions, 2024). These issues will be mitigated by recent and upcoming revisions to the FRS methodology, though these will make comparisons over time harder. Nevertheless, the FRS remains the highest-quality source of data we have on disposable incomes.
In this report, we make use of the latest published statistics (based on recent methodological revisions) to report on the latest average income and poverty statistics, whilst measuring income inequality, and trends in all statistics, using data collected with the old methodology, ensuring comparability over time. We will indicate clearly whether statistics are derived from the old methodology or the new methodology.
Drops in response rates since the pandemic mean that particular care is needed when interpreting recent changes in survey-based estimates of earnings, employment and incomes. The problems associated with the LFS due to lower response rates are well documented, and whilst the Office for National Statistics has taken steps to improve the representativeness of the survey by improving its weighting methodology, it continues to urge caution in interpreting LFS-based statistics (Office for National Statistics, 2025a). Similar cautiousness should apply to the ASHE and the APS. The APS has a larger sample than the LFS, but has not undergone the same improvements to its weighting methodology. In light of these issues, we also make use of PAYE RTI data where possible. These administrative data should not be subject to any sampling volatility or biases in representativeness, but have other drawbacks – for example, they will generally not include earnings from self-employment or informal work.
In the remainder of this report, dates in the format XXYY–YY+1 (e.g. ‘2023−24’) refer to financial years, dates in the format XXYY–YY+3 refer to pooled triplets of financial years (e.g. ‘2021–24’ refers to the three financial years from 2021–22 to 2023–24) and dates in the format XXYY (e.g. ‘2023’) refer to single calendar years.
All results are expressed in 2025–26 prices unless otherwise stated, which in some places results in small deviations from official statistics.
2. Employment and earnings in Scotland
Delivering higher rates of employment and wage growth is a central component of the Scottish Government’s (2022a) National Strategy for Economic Transformation, which sets out ‘the priorities for Scotland’s economy as well as the actions needed to maximise the opportunities of the next decade to achieve our vision of a wellbeing economy’. The Scottish Government particularly views increased employment and earnings as a way to reduce poverty and improve outcomes for disadvantaged families and communities. Accompanying this is a commitment to ‘fair work’, which focuses on tackling issues such as low pay, the gender pay gap and the disability employment gap (Scottish Government, 2022b).
There are many reasons why it is important for the Scottish Government to pay attention to the labour market. Ultimately, employment and earnings are the essential driver of national living standards. They also provide a large proportion of the tax revenues the Scottish Government requires to pursue its objectives, and higher employment and earnings also reduce pressure on the benefit system, which has been made more generous over the last parliament. Increasing employment rates and earnings could also help the Scottish Government to some extent to meet its very ambitious child poverty targets cost-effectively.
In this section, we first study the national picture on employment and earnings in Scotland, examining how these have evolved over time, and how both employment and earnings levels and trends compare with those in other regions and nations of the UK (which we refer to as the ‘rest of the UK’ or rUK).1 We then examine differences between areas within Scotland.
The national picture
Employment
Figure 1 gives the latest annual estimates of employment rates for those aged 16–64 in each region of England and in the other nations of the UK, based on the Labour Force Survey. The employment rate gives the share of all individuals in this age range who are in work. Those not in employment include the unemployed, most students, and those out of the labour market due to illness. At 74.7%, Scotland’s employment rate is similar to but very slightly lower than the UK average (75.1%). This is roughly on a par with the East Midlands and London, behind the South of England, and ahead of the North of England, the West Midlands, Wales and Northern Ireland.
Figure 1. Employment rate by UK region, for those aged 16–64, 2025
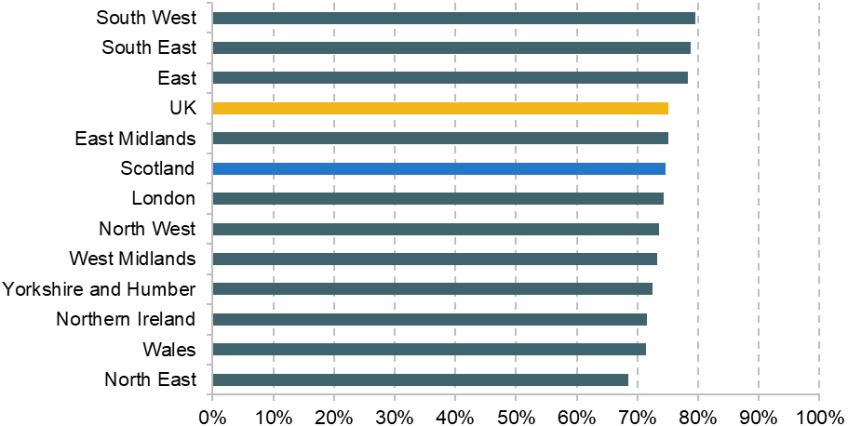
Source: Authors’ calculations using the Labour Force Survey, 2025 (Office for National Statistics, 2026a).
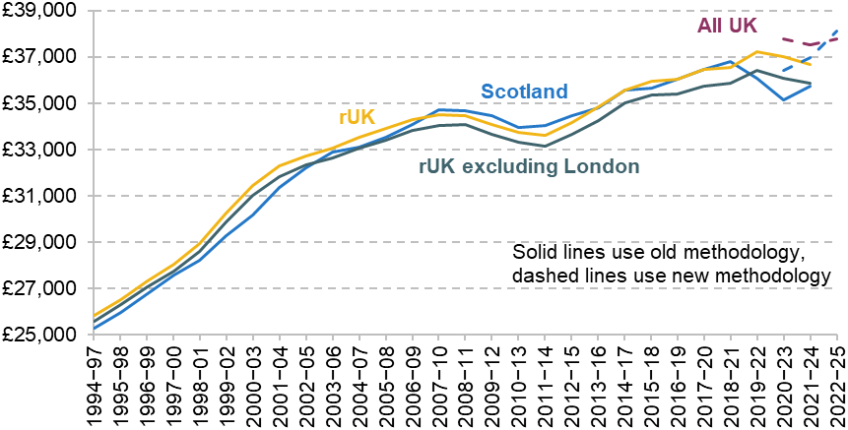
Figure 2 plots the trend in the employment rate since 1995, for Scotland, rUK, and rUK excluding London. As discussed in Phillips, Waters and Wernham (2023), Scotland’s employment rate was similar to, and sometimes higher than, that of the rest of the UK over the late 2000s and early 2010s. But a small gap of around 1 percentage point opened up by the end of the 2010s which seems to have persisted, albeit with some year-to-year volatility.
Figure 2. Individual employment rate for those aged 16–64
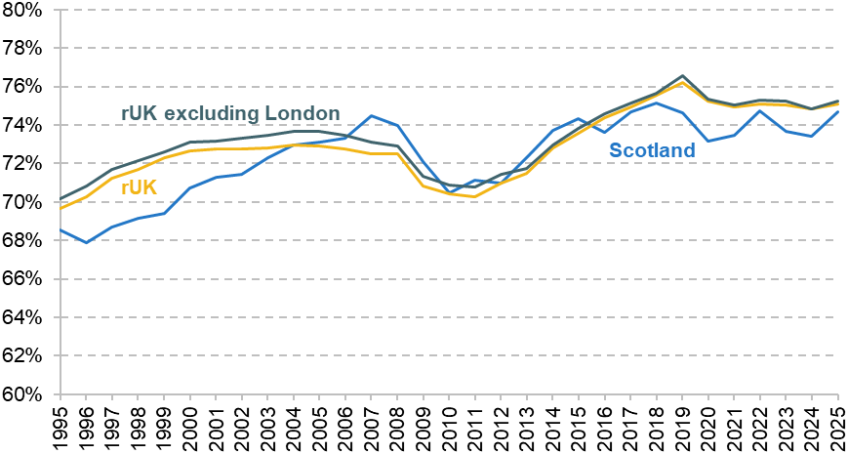
Source: Authors’ calculations using the Labour Force Survey, 1995–2025 (Office for National Statistics, 2026a).
As discussed in Section 1, ongoing issues with the LFS mean we need to be cautious when interpreting recent trends in this estimate. However, this broad pattern of the opening of a small employment gap is also corroborated by the Annual Population Survey, which boosts the LFS sample,2 and the Family Resources Survey, which is plotted in Figure A1 in the appendix. Therefore, while we cannot be confident of the exact size of the gap between Scotland and rUK, the available evidence does suggest it has persisted to some degree.
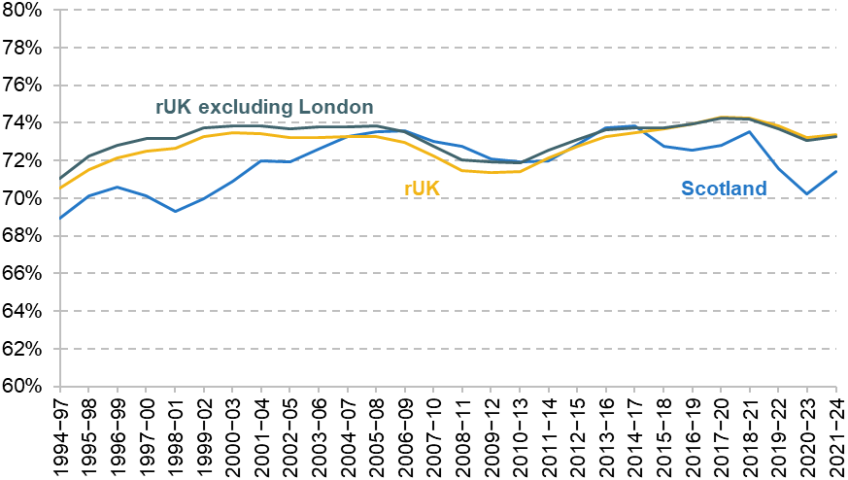
As shown in Figure 3, the percentage of individuals living in a household with at least one earner (which reflects both individual employment rates and household composition) has consistently been lower in Scotland than in the rest of the UK, even in years where individual employment rates were higher. There was barely any increase in the share of the population living in working households in Scotland over the mid 2010s, despite a 2.5 percentage point increase in the rest of the UK (Phillips, Waters and Wernham, 2023). The gap opened up particularly after 2014 when individual employment rates among the working-age population began to stall in Scotland.
Figure 3. Percentage of the population living in working households
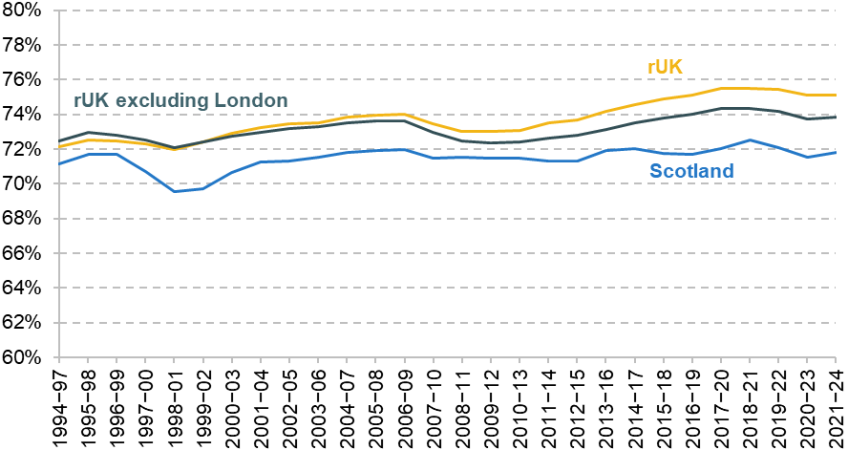
Source: Authors’ calculations using Family Resources Survey, 1994−95 to 2023−24.
The recent gap in individual employment rates that has opened up between Scotland and rUK is the result of higher economic inactivity across all age groups (Boileau and Phillips, 2023), rather than higher rates of unemployment. Individuals are considered unemployed when they do not have a job but are seeking one. They are considered inactive when they are not participating in the labour market – for example, due to ill health, caring responsibilities, studies (although students are often excluded from statistics) or early retirement. In the last quarter of 2025, economic inactivity was estimated to be 22.3% in Scotland against 20.8% in the UK (Scottish Government, 2026c), whilst unemployment was lower in Scotland. Higher levels of inactivity in Scotland are primarily driven by long-term sickness or disability. This accounted for 34.3% of all instances of inactivity in Scotland in 2024 compared with 28.6% in the UK, and has been rising steadily since the pandemic (Scottish Government, 2025a). Perhaps in part in response to concerns over the role of long-term sickness and disability in economic inactivity, the Scottish Government has made targeting the disability employment gap (see Box 1) an important part of its commitment to ‘fair work’.The Annual Population Survey suggests that economic inactivity is lower in Scotland than it is in the UK as a whole for 16- to 24-year-olds, but higher for all other age groups.
Box 1. Disability employment gap
One employment issue that has received particular attention in Scotland is the disability employment gap – that is, the percentage point gap between the employment rates for adults with and without disabilities. The Scottish Government has set a target of halving the disability employment gap between 2016 and 2038. As outlined in a 2018 plan, the Scottish Government’s approach centres on tailored employability support for disabled people, improving school-to-work transitions, and encouraging employers to adopt more inclusive recruitment and workplace practices (Scottish Government, 2025b).
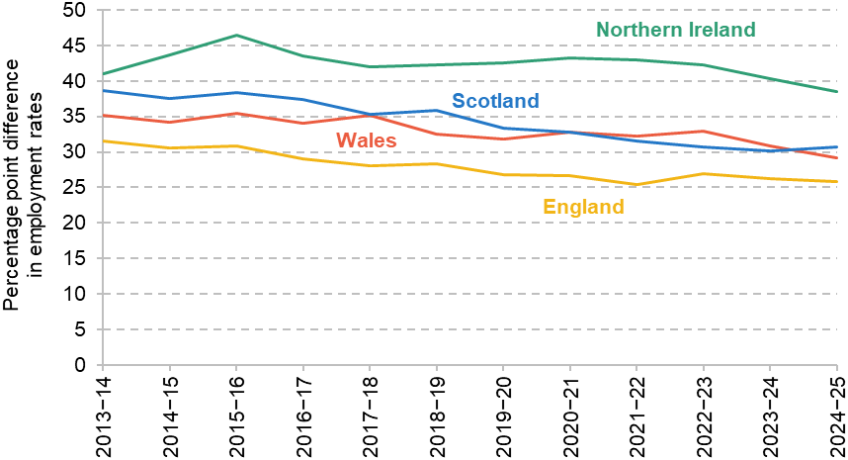
Figure 4 sets out the percentage point (ppt) difference in employment rate between disabled and non-disabled people of working age, for each nation of the UK. The figure shows that Scotland has a 31ppt employment gap, roughly on a par with Wales, larger than England’s (26ppt) and smaller than Northern Ireland’s (39ppt). Scotland, like Wales and England, has seen a gradual decline in the disability employment gap since 2013, when the Office for National Statistics (ONS) began reporting the gap. The Scottish Government’s target implies it is aiming for a reduction to just under 19ppt. In order to reach this target, the disability employment gap will need to fall by an average of around 1ppt a year. This is comparable to the rate of progress since 2016, though of course past trends do not guarantee future success. Indeed, we would expect that the disability employment gap would become harder to close as it decreases, as further reductions will require bringing individuals with more severe disabilities into employment.
Figure 4. Disability employment gap
Source: Office for National Statistics (2025b).
Earnings
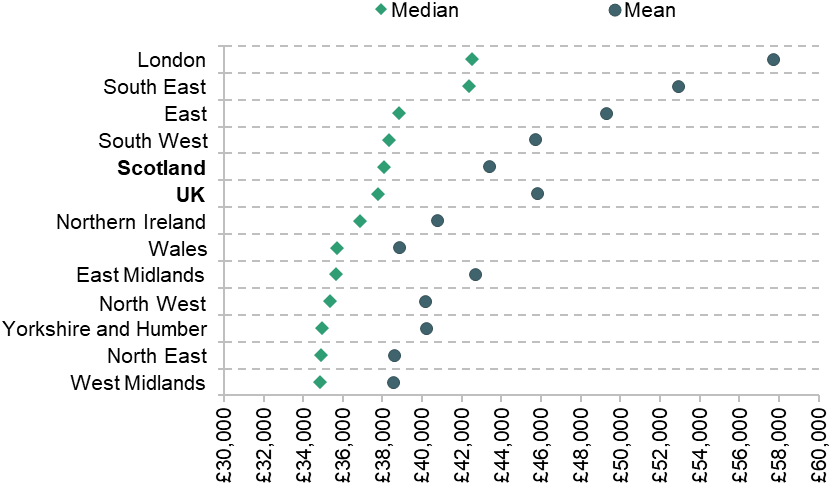
We now examine the before-tax earnings of people in employment. We begin with Figure 5, which plots mean and median (middle) monthly earnings for employees in Scotland and the other nations and regions of the UK in 2025. This is based on HMRC’s RTI data. These data, rather than relying on a survey, come directly from HMRC’s PAYE systems. They have the advantage of not being subject to sampling volatility, or biases from certain types of people choosing not to respond to the survey. They also avoid both the bias and volatility that can result from misreporting of earnings. However, they only include people paid by PAYE, so people in self-employment and some of those undertaking casual work will not be captured.
Figure 5. Median and mean PAYE RTI monthly earnings by UK region, 2025
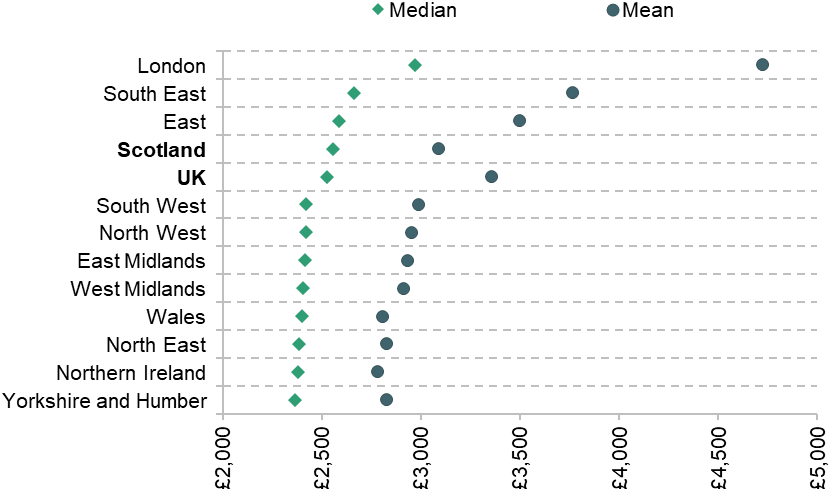
Note: This figure shows monthly earnings because RTI earnings are provided monthly and it is not accurate to straightforwardly convert median monthly earnings into median annual earnings.
Source: HM Revenue and Customs (2026).
The figure shows that Scotland has median monthly earnings of £2,554, compared with £2,526 in the UK as a whole. Scotland’s median earnings are therefore just above the UK average, on a par with the East and South of England, below London, and above those in the North and Midlands of England, Wales and Northern Ireland. However, mean earnings in Scotland are 8% below the UK-wide mean. This is because Scotland has fewer high earners than the East and South East of England, and especially London. Whilst we do not observe regional pay distributions in the RTI data, data from the Annual Survey of Hours and Earnings estimates that the 10th percentile of full-time earnings in Scotland is 2.5% higher than the UK 10th percentile, whereas the 90th percentile of full-time earnings in Scotland is 7.3% lower than the UK 90th percentile.3 Scotland has long had lower earnings at the top of the distribution than rUK. The result is that Scotland has substantially lower earnings inequality than the UK as a whole; this has been true at both the individual and household level since the early 2000s.
Box 2 discusses the gap between public and private sector pay in Scotland, which is larger than that in most of the UK. Box 3 discusses the gender pay gap in Scotland, which is a key focus of Scottish Government policy.
Box 2. Public and private sector earnings in Scotland
Despite economy-wide median earnings in Scotland being comparable to those in the UK as a whole, the picture differs somewhat between the private and public sectors. Table 1 shows median earnings in the private and public sectors for each region and nation of the UK, and the difference between the two (as a percentage of the private sector median). The data in this table come from a different data source (ASHE) from those used in Figure 5, so the absolute earnings figures are not comparable. However, the table suggests that public sector pay is higher in Scotland than in any other region of the UK except London, whilst median private sector pay is lower than the UK median. This contributes to a large public sector pay premium of 14%, compared with 8% in the UK as a whole. Some of this gap may reflect differences in the age, education and experience of workers between the public and private sectors. However, accounting for these factors in Scotland does less to reduce the public sector premium than in most regions of the UK (Cribb, Domínguez and O’Brien, 2025).
Table 1. Median public and private sector annual earnings by UK region, 2025
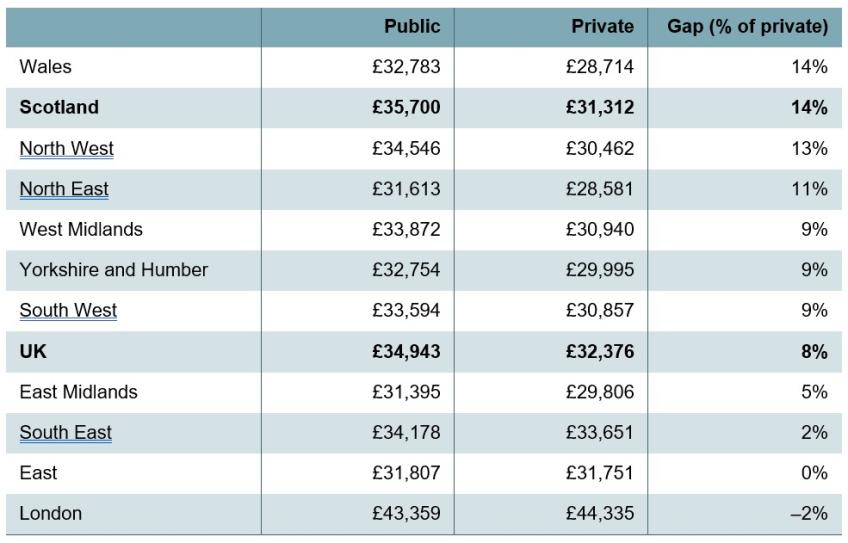
Source: Annual Survey of Hours and Earnings, 2025 (Office for National Statistics, 2025c).
Box 3. Gender pay gap in Scotland
As part of its aim to become a leading ‘fair work’ nation by 2025, the Scottish Government committed to tackling the gender pay gap (although it did not set a specific timetable for eradicating it). Figure 6 shows the ONS’s estimates of the gender pay gap in median full-time earnings for each nation and region of the UK, in 1997 when reporting began and in 2025. The figure shows that Scotland has seen one of the largest reductions in the gender pay gap since 1997 and has one of the lowest levels in 2025. There remains a gender pay gap of 9.4% in Scotland (and 12.8% across the UK) in median pay when including part-time workers (Scottish Government, 2026a), reflecting the facts that (a) part-time workers typically have lower hourly pay, (b) part-time workers work fewer hours and so earn less for a given hourly wage and (c) women are more likely to work part-time than men. The Scottish gender pay gap has risen slightly at the median for full-timers since 2023 (from 1.4% to 3.5%), although this may reflect noise rather than real trends. There is also a gap of 8.0% in mean full-time earnings (compared with 10.9% across the UK), reflecting the fact that there are still more significant gaps in the share of men and women with high pay (Office for National Statistics, 2025d).
Figure 6. Gender pay gap in median full-time earnings by UK region in 1997 and 2025, as a percentage of men’s earnings
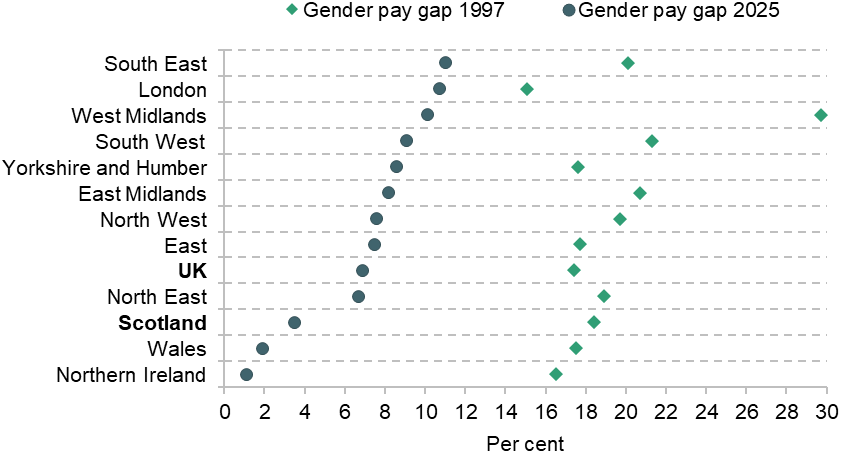
Source: Office for National Statistics (2025d).
Another component of the ‘fair work’ plan is increasing the share of workers paid at least the ‘real living wage’, which is a voluntary wage level (above the statutory minimum) set by the Living Wage Foundation to reflect living costs. Figure 7 shows the percentage of employees earning below the real living wage across the UK regions in 2014 and 2025. Only 11.3% of employee jobs in Scotland are paid less than the real living wage in 2025, compared with 14.6% across the UK as a whole. This percentage has been consistently low in Scotland, but this nation has also made comparatively fast progress in reducing it over the last decade. As well as encouraging voluntary compliance by employers across the public and private sectors, the Scottish Government has also made some more tangible efforts to ensure payment of the real living wage, including making receipt of certain public sector grants and contracts contingent on paying the real living wage (Scottish Government, 2024).
Figure 7. Percentage of employee jobs with hourly pay (excluding overtime) below the real living wage, by UK region
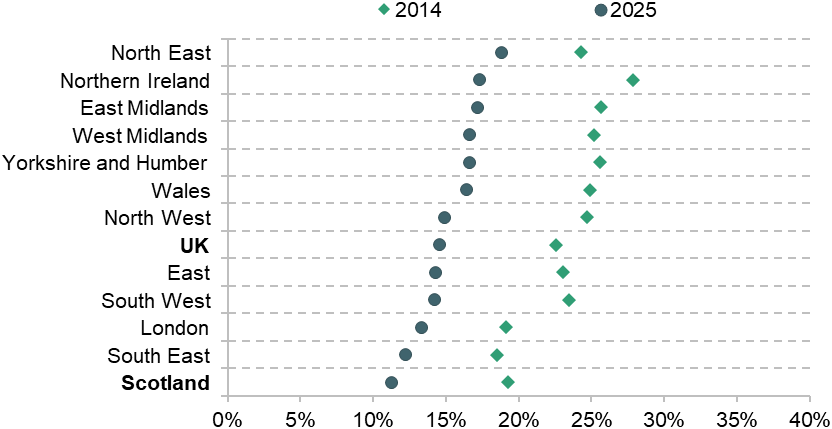
Note: For 2025−26, the real living wage was £13.45 per hour outside London and £14.80 in London. However, the most recent data relate to the 2024–25 rates of £12.60 and £13.85. The 2013–14 rates were £7.65 and £8.80.
Source: Annual Survey of Hours and Earnings, 2014 and 2025 (Office for National Statistics, 2025c).
Turning to trends over time, Figure 8 shows that median earnings in Scotland have broadly been at a very similar level to those across the UK over the last decade. Scotland, like rUK, has seen relatively slow growth in earnings over this period (at least by the standards of the late 20th and early 21st centuries). Scottish median earnings have grown by 1.3% per year since 2019 (the same as across the UK) and by 1.1% per year since 2015 when the RTI series begin (compared with 1.2% across the UK). In the UK, but particularly in Scotland, growth rates have been slower for mean earnings, suggesting more sluggish growth among higher earners. Figure A2 in the appendix shows that household earnings, among households with at least one person in paid work, have seen similarly slow growth.
Figure 8. Median and mean monthly gross earnings
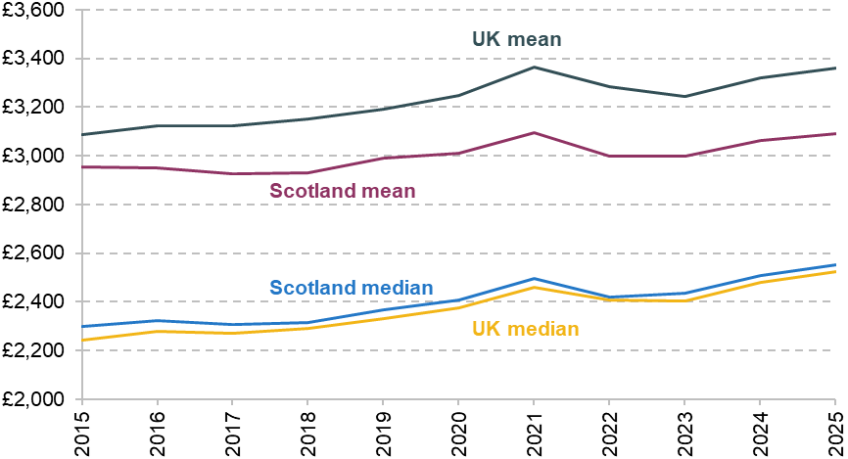
Source: HM Revenue and Customs (2026).
How different is the picture across Scotland?
In general, earnings and employment in Scotland are broadly comparable to those in rUK. However, this does not capture significant inequalities across different areas within Scotland. For a more detailed analysis of these geographic labour market inequalities, see our previous report on earnings and incomes in Scotland (Phillips, Waters and Wernham, 2023).
Figure 9 examines how median monthly earnings have differed across the 23 Scottish NUTS3 regions4 since 2015, expressing earnings as a percentage of the contemporary median across Scotland. The highest- and lowest-earning regions are similar in 2015 and 2025. The four regions with the highest median earnings in 2015 were: Aberdeen City and Aberdeenshire; the Shetland Islands; East Dunbartonshire, West Dunbartonshire and Helensburgh and Lomond; and the City of Edinburgh. These remain the top four regions in 2025, although the order has changed. Higher earnings in the North East primarily reflect the effect of the high-paying oil and gas industry, whereas Edinburgh benefits from being the capital city and a hub for high-value services. Similarly, the four regions with the lowest median earnings in 2015 were: Dumfries and Galloway; Lochaber, Skye and Lochalsh, Arran and Cumbrae and Argyll and Bute; the Scottish Borders; and the Orkney Islands. As well as these four regions still being the bottom four in 2025, the order remains the same.5
However, limited changes to the ordering of regions according to median earnings hide the fact that over the last 10 years there has been a significant reduction in the extent to which median earnings differ across Scottish regions. In 2015, median earnings in Aberdeen City and Aberdeenshire were 13.9% above the Scottish median, whilst median earnings in Dumfries and Galloway were 11.6% below. By contrast, in 2025, the region with the highest median earnings (the Shetland Islands) had median earnings only 5.6% above the Scottish median, whilst median earnings in Dumfries and Galloway were only 8.3% below. Indeed, over the last 10 years, Dumfries and Galloway has seen the fastest growth in real median incomes (1.4% per year), and the bottom four regions for earnings are all in the top seven for earnings growth since 2015. By contrast, Aberdeen City and Aberdeenshire has seen the slowest growth (0.2% per year). As recently as 2023, median earnings in Aberdeen City and Aberdeenshire were lower than they were in 2015. The Shetland Islands has seen the next-slowest income growth. Visually, we can see that there are fewer darker reds or darker blues for 2025, which indicates that the gap between lower- and higher-earning regions has shrunk.
This trend should not be overstated – to the extent that earnings were lower in some regions in 2015 at least partially due to a temporary shock, we would expect them to grow faster over the next decade than regions that had higher earnings in 2015. And with the exception of the North East, variation in earnings growth across Scotland has not been massive. Regardless, it seems that whilst median earnings growth overall in Scotland has been relatively slow over the last decade, what growth there has been has served to reduce regional earnings inequality.
There is also significant variation in employment rates across Scotland. When estimating regional employment rates for Scotland’s 32 local authorities (LAs),6 plotting three-year rolling averages because these statistics come from survey data, and the sample size at the LA level can be quite small. Using the same methodology as we use to calculate LA employment rates, the employment rate across Scotland was 74.5% and the employment rate across the UK was 75.5% on average from October 2022 to September 2025 (the most recent three years of available data). Figure 10 shows local area employment rates and the percentage point changes in these rates since a baseline period.
As of the most recent data, the Shetland Islands has the highest employment rate, at 85.9%, and Dundee City has the lowest employment rate, at 65.7%. Whilst the Shetland Islands are somewhat of an outlier, another four local authorities (the Orkney Islands, the City of Edinburgh, East Lothian, and Midlothian) have employment rates above 80%. Dundee City is less of an outlier, with another five local authorities having employment rates below 70% (Glasgow City, South Ayrshire, Inverclyde, North Ayrshire, and Clackmannanshire). This is a larger degree of variation than among many other regions of the UK. For example, Scotland has six LAs with employment rates higher than every LA in Wales, and five out of the six LAs with the lowest employment rates across Scotland and Wales are in Scotland. Whilst Scotland does have ten more LAs than Wales, this remains a notable result.
Overall, employment rates are generally higher in the North East of Scotland and around Edinburgh, and lower in the South West. This is a relatively similar picture to earnings. However, there is a less clear picture as to how geographical variation in employment rates has changed over time. Since 2004−06, Edinburgh City (6.9ppt) and Glasgow City (5.4ppt) have seen the largest increases in employment rates. In Edinburgh’s case, this has come despite a sharp fall in employment rates around the financial crisis, and has taken the city from having a middling employment rate to having one of the highest, whereas in Glasgow this increase was from a very low baseline. The largest reductions in employment rates have come in Highland and Angus, which both had relatively high employment rates in 2004−06, but there have also been significant reductions in employment rates in Clackmannanshire and South Ayrshire, which had relatively low baseline employment rates.
As highlighted in Phillips, Waters and Wernham (2023), these complex regional patterns and trends in employment and earnings pose something of a policy conundrum for the Scottish Government, especially given a constrained funding environment. On the one hand, it may want to provide additional support to the North of Scotland to help tackle the reductions in earnings (and, to a lesser extent, employment) associated with the decline in the oil and gas industry. Moreover, it will want to keep the – often highly skilled and highly paid – workers from these sectors working in Scotland even if they can no longer work in the oil and gas industry, not least given the outsized contribution their earnings make to supporting local economies and devolved tax revenues. On the other hand, it remains the case that the areas with the lowest earnings and employment are concentrated in Central and South Western Scotland, despite improvements in performance in some of the more deprived areas around Glasgow in recent years. This may suggest focusing general support for skills, employability and economic development on the traditionally struggling areas of Scotland, but providing targeted interventions to help workers in the oil, gas and other sectors to take up other opportunities in Scotland (for instance, related to the green energy transition).
3. Household incomes, poverty and deprivation
We now turn to examine material living standards in Scotland. Our main focus is household net income. This is partly determined by employment and earnings, which we discussed in the previous section. But it also includes other sources of income, such as benefits, income from savings and child maintenance, and is measured after deducting income tax, National Insurance contributions and council tax. The figures in this section therefore reflect changes in Scotland’s personal tax and benefit system, as well as Scotland’s overall economic performance. In order to make comparisons across households with different compositions, we assume that resources are shared within the household and adjust – or equivalise – household net incomes so that they are benchmarked to a two-adult household. This means that a household with many children will see their net income adjusted down, because that income has to be spread across more people. This equivalisation allows us to treat household net income as an indicator of people’s material living standards (Institute for Fiscal Studies, 2025). This analysis covers the whole population,7 including children, those who are retired and people who are otherwise out of work.
We begin with average household incomes and income inequality, examining how Scotland compares with other nations and regions of the UK, and trends over time. We then zoom in on low-income households, measuring rates of income poverty in Scotland, as well as other measures of deprivation. We often compare with rUK excluding London, as London is somewhat of an outlier in the UK in terms of income inequality and poverty. We end with some discussion of child poverty, which the Scottish Government has set ambitious targets to reduce by 2030. We discuss the policy levers available to Scotland in tackling child poverty, and the difficult trade-offs faced by both the Scottish and UK governments.
Household incomes and income inequality
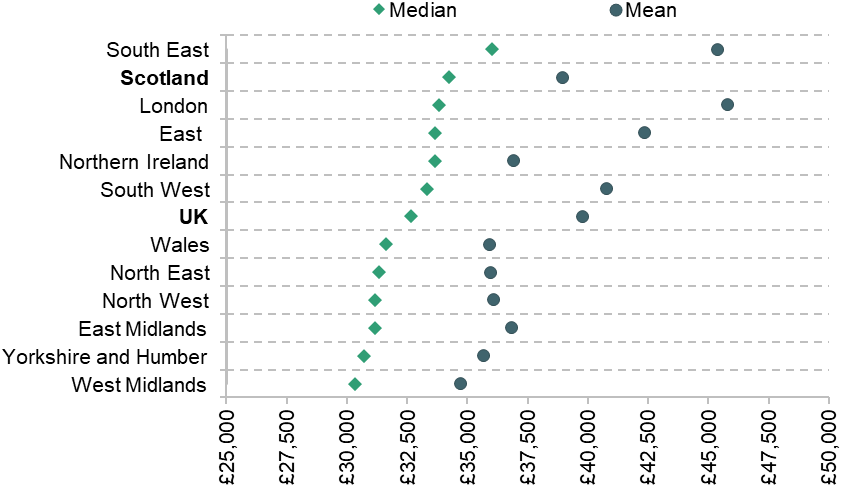
First, we examine median (middle) household income. As of the latest data, covering 2022–23 to 2024–25, Scotland has a median household income of £38,092, which was very slightly above the UK-wide median of £37,790. Figure 11 shows that median income in Scotland is higher than in the Midlands and North of England, Northern Ireland and Wales; roughly similar to the South West and East of England; but considerably lower than in London and the South East of England. As discussed in Box 4, the gap between Scotland and the UK as a whole increases when housing costs are deducted, as Scotland has lower housing costs. However, mean incomes in Scotland are 5% below the UK-wide mean. This reflects the fact that Scotland has fewer high-income households (which influence mean income much more than median income).
Figure 11. Median and mean annual household incomes by UK region, 2022−25
Note: Based on the new methodology for calculating income and poverty statistics (see Section 1).
Source: Department for Work and Pensions (2026).
Box 4. Differences in housing costs
This gap in median income differs substantially if one measures income after housing costs (AHC) – reflecting the fact that these costs are significantly lower in Scotland than they are in the rest of the UK. In the most recent data, Scottish median incomes before deducting housing costs (BHC) were almost identical to the UK’s, whereas AHC incomes were 4.8% higher. AHC median and mean annual household net incomes for different regions are plotted in Figure A4 in the appendix.
It is tricky to interpret differences in AHC incomes between areas. Deducting housing costs gives us a better indicator of living standards insofar as differences in housing costs are driven by differences in housing tenure or by differences in earnings or employment prospects. In this case, it might make sense to think of Scotland’s lower housing costs as reflecting higher material living standards, more than offsetting the effect of lower BHC incomes. However, if lower housing costs partly reflect lower-quality housing and/or local amenities in Scotland, then AHC measures may overstate relative living standards in Scotland.
There are also other circumstances in which AHC measures better capture low living standards, particularly pertinent to lower-income households and therefore when measuring poverty. For example, housing benefit covers some low-income renters’ housing costs, so if their rents increase and this is covered by an increase in benefits, they experience an increase in BHC incomes but no increase in living standards or AHC income. By comparison, if the increase is not covered by housing benefit (e.g. because they are a private renter and have hit the cap in support available in their area), then an increase in rents will lead to a fall in AHC income, reflecting their lower disposable income.
Differences in housing costs between Scotland and rUK can partly be explained by differences in housing tenure – Scotland has substantially more social renters and fewer private renters compared with rUK (Cribb, Wernham and Xu, 2023). Scotland also has lower social rents than England (Scottish Housing Regulator, 2025). However, another contributor is the fact that house purchase prices (including price per square foot) and private rents are lower in Scotland than in the rest of the UK (Zoopla, 2024).
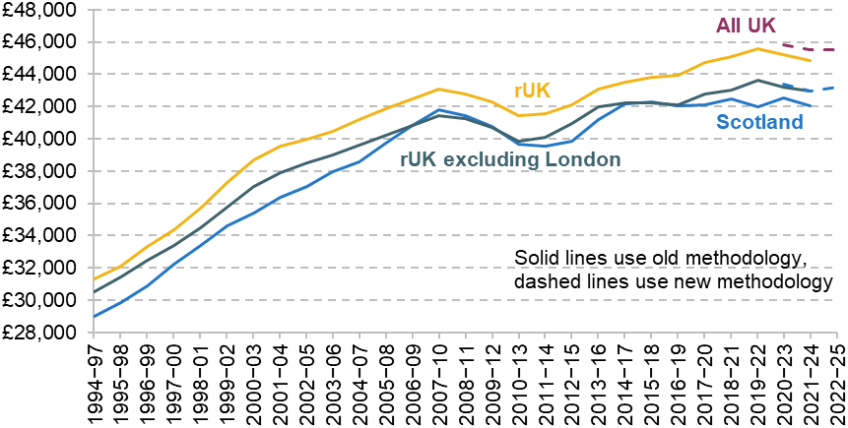
Turning to trends in household incomes over time, median incomes were historically lower in Scotland than in rUK up until 2000, but caught up over the following decade, as shown in Figure 12 and discussed in Phillips, Waters and Wernham (2023). Scottish median household net income remained similar to the rUK median until the COVID-19 pandemic, with both experiencing muted growth. Since then, estimates suggest Scottish median incomes fell behind those in rUK during the pandemic, before catching up again in the latest data, though these estimates are volatile and therefore uncertain. Trends in median incomes will be affected by both UK and Scottish tax and benefit policy. But whilst reforms to both have exhibited stark distributional patterns since 2010, impacts on median incomes are likely to have been more muted (Waters and Wernham, 2024; Adam et al., 2026).
Figure 12. Median annual net household income
Note: See Section 1 for a discussion of the old and new methodologies for calculating income and poverty statistics.
Source: Authors’ calculations using the Family Resources Survey, 1994−95 to 2023−24, and Department for Work and Pensions (2026).
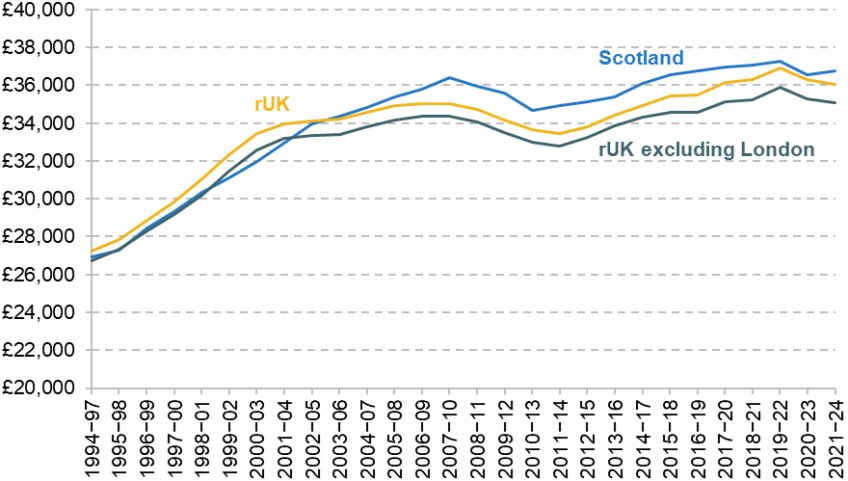
As shown by Figure 13, mean incomes have always been lower in Scotland than in rUK, but the gap has widened, driven particularly by a relative decline in incomes among high-income households in Scotland. These trends are likely partly explained by the employment trends discussed in the previous section, as well as the fact that increases in Scotland’s devolved income taxes have exceeded increases in devolved benefits on average, and particularly for high-income households (Adam et al., 2026). However, we should as ever exercise caution in interpreting the exact size of the gap, due to sampling volatility and other data concerns in recent years.
Figure 13. Mean annual net household income
Note: See Section 1 for a discussion of the old and new methodologies for calculating income and poverty statistics.
Source: Authors’ calculations using the Family Resources Survey, 1994−95 to 2023−24, and Department for Work and Pensions (2026).
Income inequality
Looking beyond average incomes, we now examine household incomes across the distribution, and levels of income inequality. Figure 14 plots income at each percentile of the household income distribution for Scotland (blue bars) and rUK (yellow bars, which are behind the blue bars rather than stacked on top), using data from 2021–24 (based on the old methodology). In 2021−24, this gap between Scotland and rUK was proportionally larger at the top of the income distribution than at the bottom. Compared with rUK, the 10th and 50th percentiles in Scotland were broadly similar, while the 90th percentile was 6.9% lower.8
Figure 14. Household income percentiles in Scotland and rUK, 2021−24
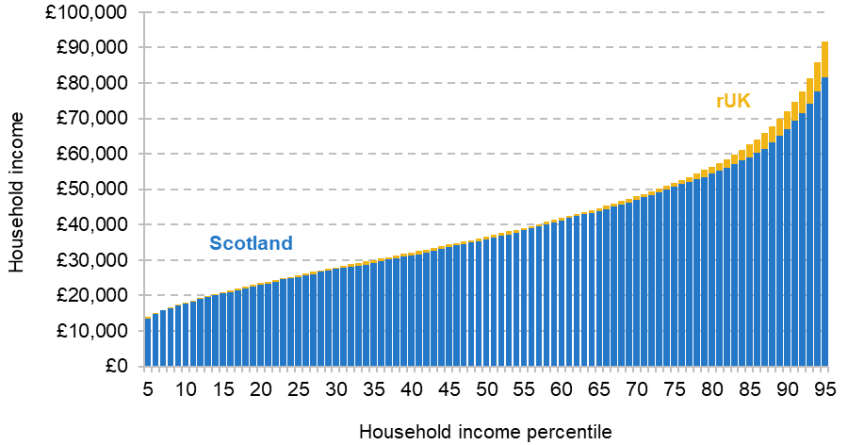
Note: Based on the old methodology for calculating income and poverty statistics (see Section 1).
Source: Authors’ calculations using the Family Resources Survey, 2021–24.
As a result of this pattern, Scotland has slightly lower net household income inequality than rUK. This lower overall inequality in Scotland arises because high-income households in Scotland do not have incomes quite as high as high-income households in rUK (and specifically London and the South East of England), whilst the incomes of middle- and lower-income households are comparable to those in rUK.
This can be summarised by three measures of household income inequality. The 90:10 ratio – the ratio of the 90th and 10th percentiles of the income distribution – gives us an idea of inequality between those close to the top and those close to the bottom of the income distribution. The 90:10 ratio can in turn be broken down into the 90:50 ratio, which measures inequality between those close to the top and in the middle, and the 50:10 ratio, which measures inequality between those in the middle and those close to the bottom.
In 2021–24, the 90th percentile of net household incomes in Scotland was 3.8 times higher than the 10th, whereas in rUK it was 4.0 times higher, meaning slightly lower inequality across the distribution. There is some volatility in this estimate over time but, as shown in Figure A5 in the appendix, the difference in 90:10 ratios between Scotland and rUK has been broadly consistent in magnitude in recent decades. If anything, the gap has narrowed slightly – Scotland has typically had a very slightly lower 90:10 ratio than rUK excluding London, but recent data suggest this is no longer the case. However, particularly high volatility around low incomes means this is difficult to say with confidence.
As shown by Figures A6 and A7 in the appendix, Scotland has had a consistently lower 90:50 than rUK, meaning inequalities among the highest-income half of households are lower in Scotland, reflecting its lower proportion of high earners. For much of the period from 1994−97 until the 2010s, Scotland also had a slightly lower 50:10 ratio, although since the 2010s it has been more similar. It is important to note that the 90:50 and 90:10 ratios do not take account of incomes at the very top of the distribution and, on measures that do, the gap between Scotland and the rest of the UK would be even larger, due to the fact that British households with the very highest incomes are concentrated in London and its environs.
Scotland has substantially lower inequality in gross earnings among working households than rUK (Phillips, Waters and Wernham, 2023). This difference is larger than the corresponding gap in net household income inequality across all households, which we have discussed so far. One likely explanation for this difference is Scotland’s higher rate of household worklessness, shown by Figure 3, which increases inequality in net household incomes because more households rely solely on benefits and therefore have relatively low incomes. This partly offsets the lower inequality observed among households in work.
Also worth noting is the fact that Scotland’s more redistributive income tax and benefit system acts to reduce household income inequality below what it would otherwise be. Our modelling9 suggests that if the income tax and benefit system applying in England and Wales also applied to Scotland, then Scotland’s 90:10 ratio would likely be slightly over 4 (rather than 3.8), comparable to that in rUK as a whole. Whilst uncertainty in both the modelling and the underlying FRS data means we must be cautious about precise quantifications, it is clear that household inequality would be higher in both the top and bottom halves of the income distribution in the absence of Scottish income tax and benefit policy. This suggests that the gap between Scotland and rUK would have narrowed further since devolution of tax and benefit powers in 2016, were it not for Scotland’s use of these powers.
Thus, the combination of both lower gross earnings inequality among working households and more redistributive income tax and benefit policy (both of which reduce household net income inequality) offsets the effect of a higher rate of workless households (which increases net income inequality) in Scotland.
Poverty and deprivation
In this subsection, we focus on the living standards of poorer households in Scotland. We focus on rates of relative income poverty – the proportion of people with household incomes below 60% of the UK median. This tracks the extent to which poorer households’ incomes keep pace with incomes in the middle. Figure A8 in the appendix shows rates of absolute poverty, giving the proportions with incomes below a poverty line that is fixed over time (at 60% of the inflation-adjusted 2010–11 median). We also examine measures of material deprivation – based on the proportions of people who report they are unable to afford certain ‘essentials’.
We examine income poverty principally using incomes measured after housing costs (AHC). This is because AHC incomes are typically better at identifying the households with the lowest living standards. Nevertheless, differences in BHC (before housing costs) and AHC measures between regions can be tricky to interpret, and there are other reasons why BHC measures are sometimes preferable, so we also briefly discuss BHC poverty. Box 4 earlier discusses the pros and cons of each measure in more detail.
The Scottish Parliament has set clear targets on child poverty, incorporating both absolute and relative measures of income poverty, and measures of material deprivation. We discuss the targets, the Scottish Government’s child poverty strategy, its performance against the targets and the role of policy in shaping child poverty in more detail at the end of this subsection.
Figure 15 gives the share of people in relative AHC income poverty, by region and nation of the UK and by age group. There is substantial statistical uncertainty associated with poverty estimates at the regional or national level. As of the latest data covering 2022–23 to 2024–25, 17% of people in Scotland were in relative income poverty, which is below the UK average of 20%. The overall poverty rate in Scotland is lower than in London, the North of England, the West Midlands and Wales, but higher than in Southern England (outside London) and Northern Ireland. Scotland’s pensioner poverty rate is similar to the UK average, and its working-age poverty rate is slightly lower. Where it clearly differs is in child poverty, where Scotland has a significantly lower rate than the UK average, and one of the lowest rates in the UK.
Figure 15. Relative income poverty, after deducting housing costs, by age group and UK region, 2022–25
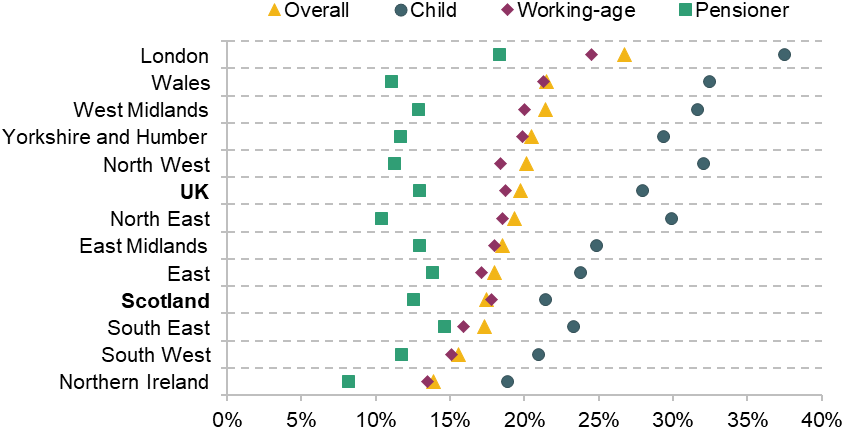
Note: Based on the new methodology for calculating income and poverty statistics (see Section 1).
Source: Department for Work and Pensions (2026).
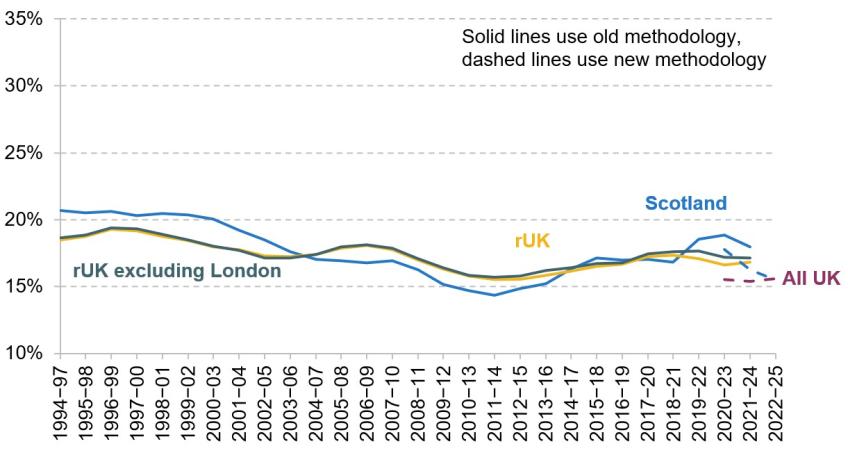
As shown by Figure 16, Scotland has consistently had a lower poverty rate than rUK since the mid 2000s, but from the early 2010s to the pandemic the Scottish overall poverty rate rose, whereas it was little changed in rUK. This rise may have been driven at least in part by aforementioned trends in household worklessness, and larger increases in social rents in Scotland than in England over the 2010s. More recently, the gap has widened again, with larger falls in child and working-age poverty in Scotland relative to rUK, as shown in Figures A9 and A11 in the appendix. Volatility in the data means we cannot be confident of very recent trends but, as discussed later, benefits policy changes in Scotland could plausibly have contributed to a substantial reduction in poverty in recent years. There is also very tentative evidence of a recent narrowing of the employment gap, as shown in Figures 2 and A1, which could be playing a role if this evidence reflets genuine trends rather than statistical volatility. But we cannot be confident of this.
Figure 16. Relative income poverty, after deducting housing costs
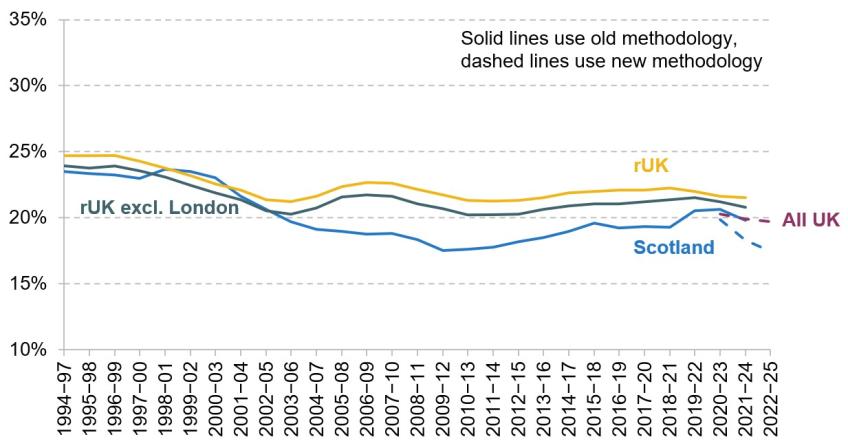
Note: See Section 1 for a discussion of the old and new methodologies for calculating income and poverty statistics.
Source: Authors’ calculations using the Family Resources Survey, 1994−95 to 2023−24, and Department for Work and Pensions (2026).
Figures A9, A10 and A11 in the appendix consider relative poverty rates for children, pensioners and working-age adults respectively. Figure A9 shows that Scotland has consistently had child poverty rates approximately 6 or 7 percentage points lower than the rest of the UK, experiencing a larger fall from the 1990s to the early 2010s. Rates of working-age and pensioner poverty have typically been a couple of percentage points lower than in rUK. The size of the gap for working-age and pensioner poverty decreased over the 2010s, which drove the overall narrowing of the differences in poverty rates in that period.
As discussed in Box 4 earlier, Scotland has lower housing costs than the rUK on average, reducing its poverty rate on the above measures. Figure 17 shows that when based on BHC income, the overall relative poverty rate in Scotland is closer to, and indeed in some periods higher than, that in rUK (e.g. the late 1990s and early 2000s, and the early 2020s).
Figure 17. Relative income poverty, before deducting housing costs
Note: See Section 1 for a discussion of the old and new methodologies for calculating income and poverty statistics.
Source: Authors’ calculations using the Family Resources Survey, 1994−95 to 2023−24, and Department for Work and Pensions (2026).
Material deprivation
Assessing poverty status by income does not allow us to perfectly identify households with the lowest material living standards. Other factors, such as differences in needs or costs (e.g. due to health) and differences in savings, mean households with the same incomes (even after adjusting for household size) can have very different living standards. And differences in expenditure patterns mean poorer households can have their purchasing power eroded by more or less than is reflected in headline inflation-adjusted income statistics (if, for example, the prices of necessities that make up a bigger share of their budget increase by more or less than overall inflation). It is therefore useful to examine other measures of deprivation, beyond income poverty.
One useful measure is material deprivation. A family is considered materially deprived if it reports that it is unable to afford a number of essential items, which can include heating the home, warm clothing and adequate food. The exact items contributing to the measure vary by age group, and so the measures are not comparable across ages. We use the definition of material deprivation set by the Department for Work and Pensions and measured across the UK using the Family Resources Survey – this is also the measure of material deprivation underpinning Scottish Government analysis and targets (Scottish Government, 2025c).
As shown in Figure A12 in the appendix, material deprivation in Scotland has been lower for all age groups than in rUK since 2010. Prior to the pandemic, it was on average 2 percentage points lower for working-age adults, 4 percentage points lower for children and 1 percentage point lower for pensioners. The definition of material deprivation has recently changed and this, combined with poor interpretability over the pandemic period, means more recent trends are not especially reliable. Instead, Figure 18 captures the most recent snapshot of material deprivation measures, from 2023–24.
Figure 18. Rates of material deprivation by age group, 2023−24
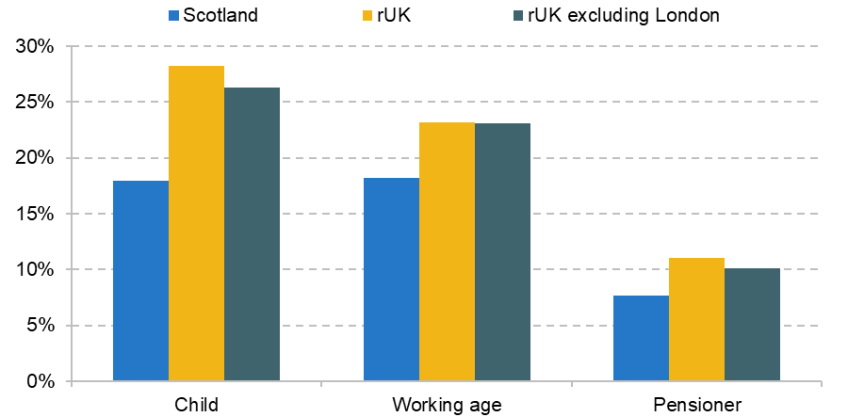
Source: Authors’ calculations using the Family Resources Survey, 2023−24.
The most robust way to consider recent trends in deprivation is to consider more specific indicators that are consistently defined over time. Figure 19 gives the shares of people in families reporting they are unable to heat their home or pay their bills, as well as the share experiencing food insecurity. A household is defined as being in food insecurity if it reports that the food it could afford was not of sufficient quantity, quality, variety or desirability in the 30 days prior to interview. The figure shows that, in both Scotland (solid, darker shades) and the rest of the UK (dashed, lighter shades), there were substantial increases in the proportion of households reporting hardship on these measures in the period 2021–22 to 2023–24, compared with before the pandemic. That these trends differ so markedly from trends in income poverty rates for rUK may be because price rises seen since the pandemic, in particular food and energy costs, disproportionately affected poorer families.
Figure 19. Percentage of people in families deprived of specific items
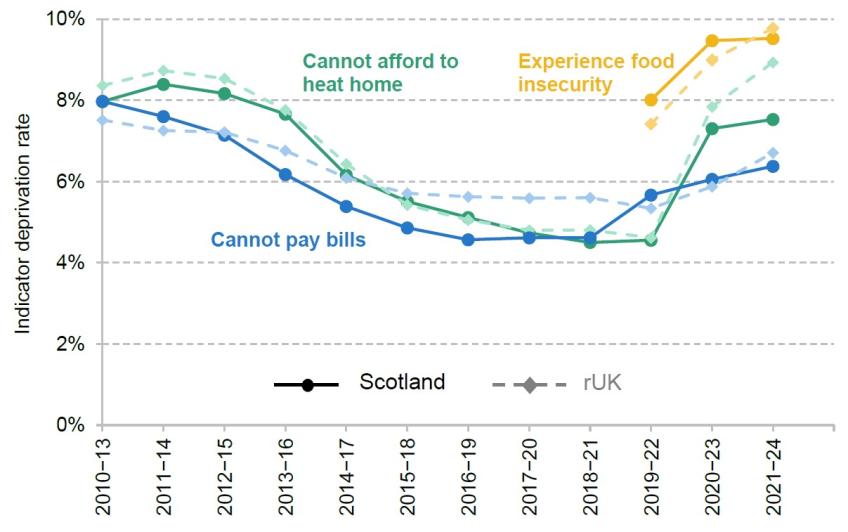
Source: Authors’ calculations using the Family Resources Survey, 2010–11 to 2023−24.
Child poverty
Scotland’s child poverty policies
The Scottish Government has placed a particular emphasis on tackling child poverty. It first launched a child poverty strategy in 2011. The Child Poverty (Scotland) Act 2017 then set four child poverty reduction targets by 2030, and required the Scottish Government to publish delivery plans in 2018, 2022 and 2026, reporting on progress annually. The most recent delivery plan was announced in March and, like previous plans, included policies aimed both at reducing child poverty directly and at the wider inequalities in education, health and other outcomes correlated with it.
How should the Scottish Government reduce child poverty, and the wider inequalities associated with it?
Crucial for understanding how to tackle income poverty, and the broader outcomes correlated with it, is understanding how they are linked. Unfortunately, the evidence here is not clear-cut. The correlations between income poverty and broader child outcomes are very clear, but the extent to which income plays a causal role is not. Richer and poorer parents differ from each other in many ways other than income, including their own education and health, which may also affect their ability to support their children in these areas. Disentangling these effects, and isolating the causal role of income, is complicated. The academic literature suggests that income may have some causal effect on later outcomes – see Cooper and Stewart (2021) and Page (2024) for reviews. However, estimated effect sizes vary considerably, and some precise, high-quality studies find null results, and recent studies based on two randomised controlled trials have also found no evidence of effects on early childhood development. (Noble et al., 2025; Krause et al., 2025). And a recent evaluation of the two-child limit in universal credit showed that an average reduction in income of over £10,000 by age 5 had no substantial impact on children’s school readiness at age 5 in England (Cattan, Waters and Wernham, 2025).
Insofar as income does causally create inequalities in children’s broader outcomes, then policymakers may be able to reduce income poverty directly, in a way that simultaneously tackles those broader inequalities. That is, additional spending on benefits for poorer families, which is likely to be the most effective way to quickly reduce income poverty, may have spillover effects onto these broader inequalities. This is likely contingent on the timing of interventions, and the specific outcomes policymakers are targeting. Insofar as other factors cause these broader inequalities, other policy measures such as direct interventions through the health or education system might be more effective at closing them. This may mean policymakers need to choose between these two objectives, or else spend more money in pursuit of both. The Scottish Government has, to its credit, been clear that it expects the principal role of social security increases to be to improve material living standards, and it hopes to achieve progress in its broader objectives through more direct interventions.
Poverty targets
The Child Poverty (Scotland) Act 2017 sets out four targets the Scottish Government must meet by 2030 in relation to child poverty. These are that by 2030:
- fewer than 10% of children are in relative poverty;
- fewer than 5% of children are in absolute poverty;
- fewer than 5% of children are in combined low income and material deprivation;
- fewer than 5% of children are in persistent poverty.
Relative poverty, absolute poverty and material deprivation are all defined earlier in this section. All the poverty measures are based on AHC incomes. ‘Low income’ in target 3 means below 70% of median income. Persistent poverty is defined by the Scottish Government as those who have lived in relative poverty for at least three of the last four years.
These four targets cover differing forms of poverty and deprivation. We discuss each in turn.
Reductions in relative and absolute child poverty. Relative poverty is essentially a measure of inequality, tracking whether poorer households with children are falling far behind average-income households. This can be lowered either by raising the incomes of poorer households or by lowering the incomes of households in the middle of the income distribution.10 Absolute poverty measures the proportion with household incomes below a fixed poverty line (after adjusting for inflation), so this rate can only be brought down by raising the incomes of poorer households with children. Both targets are based on binary measures, but there are of course varying depths of poverty. These targets will not capture the full effects of policies that provide substantial boosts to very poor households, taking them from far below the poverty line to only slightly below it. Mitigation of the benefit cap is likely to be a good example of this (Henry and Wernham, 2024). Such targets will also not capture where policies help households who are just above the poverty line, but who the government may still want to support in pursuit of its redistributive goals. One way to capture such effects would be to examine deeper (or shallower) poverty lines – for example, drawn at different percentages of the median. But survey measurement issues are particularly pertinent when looking at those with the lowest incomes (e.g. Brewer, Etheridge and O’Dea, 2017), making this difficult to do reliably, especially at a sub-UK level when sample sizes in the data are low.
Reductions in combined low income and material deprivation. Another way to indirectly capture effects on deep poverty is to examine material deprivation. Material deprivation reflects living costs and savings as well as income, and measuring this is useful because some families may have lower living standards than others for a given level of income, due to differences in savings, expenditure patterns, needs or costs, as described earlier. This measure can capture those who are deprived due to high costs, despite having an income above the poverty line (or, conversely, exclude those who are not deprived due to access to other resources, despite having an income below the poverty line). However, combining material deprivation with a measure of low income, as the Scottish targets do, loses its usefulness for this purpose. Instead, the target is effectively (roughly) measuring a deeper form of relative poverty, identifying those who both have relatively low incomes and are unable to afford many essentials (perhaps due to some combination of low income, low savings or high costs).
Reductions in persistent child poverty. Some people in income poverty may only find themselves below the poverty line temporarily. People with high lifetime incomes may temporarily fall into income poverty as measured in the Family Resources Survey if they are between jobs, or retire before drawing their pension, for example. Examining persistent poverty allows a more specific focus on those for whom poverty is not just a temporary state.
Child poverty strategy
The most recent delivery plan was announced in March, and included four key broad objectives (Scottish Government, 2026b). The objectives span measures to directly (via benefits) and indirectly (via efforts to increase employment) boost family incomes, and measures to improve public service provision. The four objectives, and examples of policies set out in the strategy, are detailed in Box 5.
Box 5. Scotland’s child poverty delivery plan
1. Increase earnings
- Increase skills and employment among parents
- Increase childcare availability and affordability
- Provide affordable public transport
- Improve job quality
2. Reduce living costs
- Increase provision of social and affordable homes, and create alternatives to temporary accommodation
- Improve home insulation
- Ease impact of public debt collection (e.g. council tax debt) on households
3. Boost incomes through benefits
- Continue to provide additional Scottish benefits for families with children, and increase benefit rates, including a higher rate of Scottish child payment for under-1s, and a care leavers’ grant
- Increase take-up of Scottish and UK benefits
- Provide financial and debt advice
4. Improve public services
- Improve early years provision – for example, expanding health services around pregnancy and early childhood
- Provide additional funding for schools to support children in poverty
- Provide support for school-to-work transitions for those in poverty and at risk of poor outcomes
Source: Scottish Government (2026b).
The Scottish Government’s child poverty strategy aims both to reduce income poverty and deprivation to improve living standards directly, and to close some of the well-documented inequalities in education and health that are correlated with poverty. This represents a broad set of objectives.
The latest progress report, based on the previous delivery plan, highlights a wide range of policies in progress in pursuit of the Scottish Government’s objectives. These include a substantial package of benefits already introduced, with some further increases in generosity planned. The contribution of these to reducing child poverty is discussed below. Broader policies the Scottish Government highlights include expansions of free school meals and breakfasts, funding for local authorities to forgive school meal debt, and continuation of public service provision in other areas including childcare, healthcare and transport.
The progress report clearly sets out which of the four child poverty targets each policy is intended to work towards. It also sets out which policies are not aimed at reducing poverty on any of the four measures, but instead aim to close the inequalities correlated with it.
Poverty projections and impacts of policy
Figure 20 presents the Scottish Government’s analysis of its performance against the poverty targets. It shows the four poverty targets (squares), recent estimates of each measure (solid lines) and, in the case of relative and absolute poverty, the Scottish Government’s projections for these (dashed lines). This figure does not account for the revision to child poverty statistics discussed in Section 1, which as discussed means Scotland’s latest estimated child poverty rate is slightly lower than previously estimated, at 21%.
Figure 20. Four Scottish child poverty targets
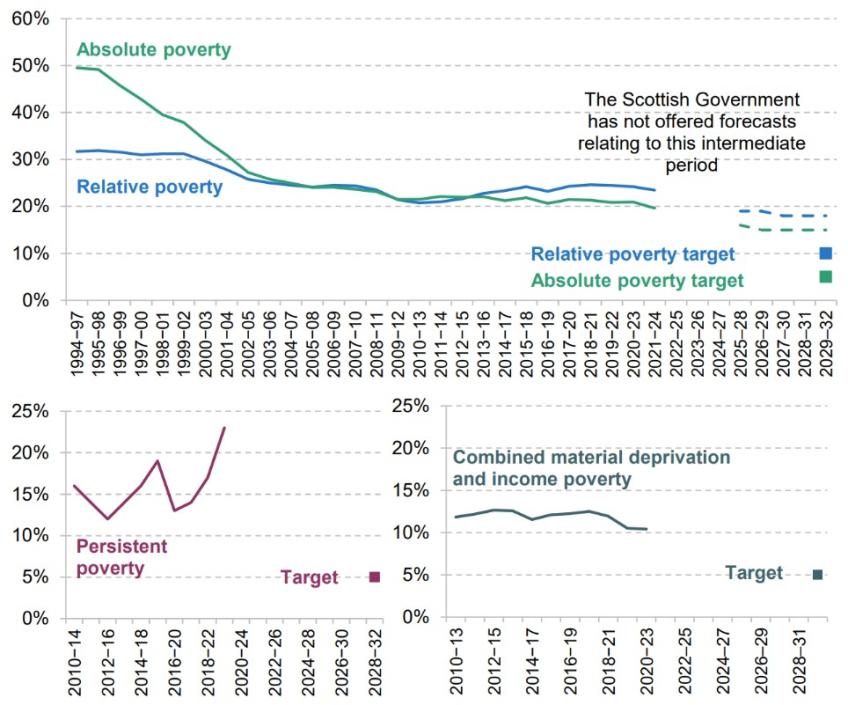
Note: Based on the old methodology for calculating income and poverty statistics (see Section 1). Dotted lines indicate projections.
Source: Scottish Government (2025c, 2025d and 2026b).
The figure shows that all four measures are currently above their 2030 target, and the two targets that the Scottish Government forecasts (relative and absolute poverty) are on course to be missed. This is despite projected falls in poverty that are considerably larger than those projected across the UK (Department for Work and Pensions, 2025a). The next forecast will likely be brought down slightly by the revised methodology (perhaps by 1–2 percentage points), but this alone will only partially close the outstanding gap, and other revisions in the coming years could push the estimated poverty rate in either direction.
The projections reflect changes in background economic conditions as well as the direct effects of Scottish Government policies. Policies modelled for these projections include the Scottish child payment, mitigation of the benefit cap and ‘bedroom tax’, council tax reductions, the Scottish carer supplement, and Best Start grants. The modelling only includes benefits, with the exception that it incorporates an assumed increase in employment from employment support programmes. Other policy areas that might less directly reduce poverty, such as childcare support facilitating parents to enter work, are not modelled, due to a lack of evidence on their effectiveness.
The Scottish Government compares its central projections with a scenario where its package of devolved benefits does not exist. This analysis suggests that the policies will reduce relative child poverty by 10 percentage points (100,000 children) and absolute poverty by 7ppt (70,000) in 2026–27, rising to 11ppt (110,000) and 8ppt (80,000) in 2030–31 (Scottish Government, 2026b). The Scottish child payment alone is forecast to contribute a 5ppt reduction to child poverty in 2026–27, half of the overall reduction in that year. Note that some of the policies modelled, including free school meals and council tax reductions, do have analogues elsewhere in the UK, so the results do not show what the poverty rate would be under UK government policy. However, the majority of spending on the policy package modelled is unique to Scotland.
Modelling of the impacts of these policies on the other targets is more challenging. As we discuss in Adam et al. (2026), other research has estimated that the Scottish child payment has reduced rates of child material deprivation by 8–9 percentage points (Andersen et al., 2025), with a similar effect on rates of food insecurity, albeit with very large uncertainty around the precise magnitude of the effect.
There are of course uncertainties in the forecast, related to data (discussed below), background economic conditions and the effects of the policy reforms themselves. But the central forecast suggests the next Scottish Government has a lot more to do if it is to meet the very ambitious 2030 targets that were unanimously agreed by all MSPs in the Scottish Parliament in 2017.
10% is a very low rate of relative poverty. Relative child poverty averaged around 15% in the UK in the 1960s and 1970s, before the rise in income inequality in the 1980s. Achieving the 10% target would therefore take Scotland to historically low levels, and mean it had one of the lowest relative child poverty rates in Europe (though differences in measurement make rigorous comparisons challenging). 5% is also a very low rate of absolute poverty. Further use of benefits policy would provide the most immediate reductions in poverty. But the expenditure likely to be required to achieve these is considerable. For example, analysis by the Fraser of Allander Institute finds that, even with substantial increases in parental employment, it would cost around £2 billion per year to meet the targets via an increase to the Scottish child payment (e.g. to £150 per week for each child) and a top-up to universal credit so that private renters’ housing costs were covered in full (Fraser of Allander Institute, 2025). And policies required to boost employment and pay – for example, expanded childcare provision – would cost more on top of this. Meeting these costs would require further increases in taxation, or cuts to other public services elsewhere.
Big increases in benefits targeted only at the poorest families are likely to weaken incentives to work and, as we discuss in Adam et al. (2026), the empirical evidence suggests families do in general respond to such incentives. This has the effect of increasing costs to the government (from reduced tax revenues and potentially further rises in benefit spending) and offsetting the aggregate impact of benefit increases on household incomes (since disposable incomes fall when earnings fall). These risks may be mitigated if in-work benefits are simultaneously increased, but this comes with further cost. Moreover, as discussed in Adam et al. (2026), additional increases in benefits would further increase the need to think carefully about improving means-testing, reducing reliance on cliff-edge eligibility criteria that give very different levels of support to similar families, and risk weakening work incentives more than is necessary.
Achieving reductions in poverty through increased employment or earnings may be preferable, but achieving large and fast reductions in child poverty through these channels is very challenging (Henry and Wernham, 2024). Partly this is because some relevant policy levers, such as universal credit conditionality rules and the minimum wage, remain reserved to Westminster. But it is also because increases in earnings and employment may not be tightly targeted at the households with the lowest incomes, and indeed could have an ambiguous effect on relative poverty if there were substantial gains in the middle of the income distribution (thus increasing the relative poverty line) as well as among poorer households.
Challenges in measuring poverty
Ongoing challenges with the quality of income data discussed in the first section of this report mean assessment of progress towards poverty targets is also likely to be challenging. Small sample sizes alone mean recent estimates of the relative child poverty rate in Scotland have had 95% confidence intervals that are 10 percentage points wide. If they remain this wide (i.e. if sample sizes do not increase), this means it is statistically plausible that the Scottish Government could appear to have met the target, when in fact it has missed it by a wide margin, or conversely that it could appear to have missed its target by a wide margin, when in fact it has achieved it. These issues also mean there remains uncertainty on whether an interim target for 2023–24 was met (Thompson and Randolph, 2026).
The sample sizes underpinning persistent poverty estimates, which come from a separate data source (Understanding Society), are even smaller (Scottish Government, 2025d). Other issues, such as low response rates and known issues with the quality of some income measures, add further uncertainty and possible biases in estimates which are not reflected by the confidence intervals. The Department for Work and Pensions is actively working on mitigating many of these issues, including through its recent incorporation of administrative benefits data. But absent a very large increase in the sample size for the Family Resources Survey, substantial uncertainty in poverty estimates is likely to remain.
In summary, issues with the measurement of poverty create a material risk that the Scottish Government might either appear to have met its poverty target, when in fact it has missed it by several percentage points, or appear to have missed its poverty target by several percentage points, when in fact it has met it.
Local area poverty
There is considerable variation in the prevalence of child poverty across Scotland. Though measures of poverty as comprehensive as those above are not available at the local area level, alternative measures do exist which can provide information on the patterns. One such measure is provided by the Department for Work and Pensions (DWP), which uses administrative records for benefits to estimate the proportion of children living in families with before-housing-costs income below the relative poverty line in different local authorities.11
These local area child poverty rates are shown in the left panel of Figure 21. The right panel shows estimates by Loughborough University for End Child Poverty, which additionally try to account for housing costs by imputing these. The figure shows that BHC relative poverty rates for children are highest in Glasgow City and in North and East Ayrshire. In general, the South West of Scotland has the highest BHC child poverty rates, but this broad region also contains the local authorities with the lowest estimated child poverty rates – East Dunbartonshire and East Renfrewshire, which have child poverty rates less than a third of neighbouring Glasgow City. Aberdeenshire also has similarly low rates. These geographical differences are not dissimilar from those for earnings and employment. When accounting for housing costs, the pattern does not change drastically, but poverty is slightly less concentrated in the South West, and somewhat higher than on a BHC basis in the South East of Scotland, due to higher housing costs in Edinburgh and the Lothians. AHC relative child poverty is 7.6 percentage points higher in Glasgow City than in any other local authority, reflecting relatively high housing costs in addition to relatively low (albeit improving) employment rates.
4. Concluding remarks
In many respects, Scotland is similar to the rest of the UK (rUK) in terms of earnings and employment, with median monthly earnings and the working-age employment rate both roughly in line with the rUK average. Median household net income is marginally higher in Scotland, but lower housing costs mean that median household net income after housing costs is almost 5% higher in Scotland. Poverty rates are slightly lower in Scotland than in rUK, particularly child poverty. And fewer high earners mean income inequality overall is lower.
Increasing productivity and earnings is crucial to improving living standards in Scotland in future. As well as benefiting working households directly, higher earnings would mean more income tax revenue for the Scottish Government, giving it more resources to pursue its policy objectives. Boosting the earnings of people already in work would mean a bigger revenue boost than boosting employment rates – because the personal allowance means that a significant portion of the earnings from those entering work is not taxable. But increasing employment – at least among members of households where no one is currently in work – would do more to reduce household income inequality and poverty. As things stand, Scotland’s higher rates of household worklessness serve to partially offset the impact of lower earnings inequality among working households and Scotland’s more progressive devolved income tax and benefit system.
The Scottish Government’s package of devolved benefits, including the Scottish child payment, helps reduce child poverty in Scotland. But the Scottish Government’s own analysis suggests it is on track to miss its highly ambitious child poverty targets. Further expansions of benefits would in one sense be the most direct way to achieve further reductions, but this would be costly. It would require rethinking the design of means-testing of Scottish child payment and other benefits to ensure increases were fairly and efficiently targeted, and a consideration of tax revenue sources beyond income tax to raise the requisite revenue, given the challenges set out in Adam et al. (2026). Increases in employment or earnings could also reduce child poverty, but reductions through these channels would be very challenging to achieve at scale in the shorter term.
The Scottish Government has signalled that its desire to reduce child poverty is motivated by a desire to close the inequalities in opportunities, health and educational attainment faced by children from richer and poorer families, as much as improving immediate material living standards. The limited evidence we have from the UK suggests boosting poorer families’ incomes may not be enough to close these inequalities, and different sorts of interventions may be required. The Scottish Government may therefore need to carefully consider which objectives it wishes to prioritise when helping poorer children. With full control of the education and health systems in Scotland, the Scottish Government may have more policy levers available to it to tackle these longer-running inequalities in outcomes, but it faces a challenge in identifying, and funding, the most effective interventions.
Appendix
Figure A1. Individual employment rate for those aged 16–64 (Family Resources Survey)
Source: Authors’ calculations using the Family Resources Survey, 1994−95 to 2023−24.
Figure A2. Median gross household earnings among individuals in working households
Source: Authors’ calculations using the Family Resources Survey, 1994−95 to 2023−24.
Figure A4. Median and mean annual household incomes by UK region after deducting housing costs, 2022−25
Note: Based on the new methodology for calculating income and poverty statistics (see Section 1).
Source: Department for Work and Pensions (2026).
Figure A5. 90:10 ratio for net household income
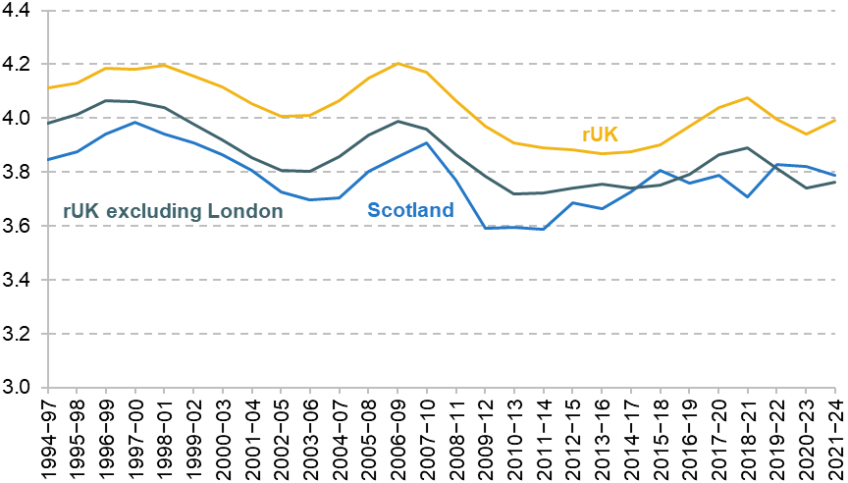
Note: Based on the old methodology for calculating income and poverty statistics (see Section 1). The income ratios shown here do not exactly match the ratios implied by the percentiles shown in Figure 14. This is because this figure shows three-year averages of annual percentile ratios, whereas Figure 14 shows three-year averages of the percentiles themselves, from which slightly different ratios would be obtained.
Source: Authors’ calculations using the Family Resources Survey, 1994−95 to 2023−24.
Figure A6. 90:50 ratio for net household income
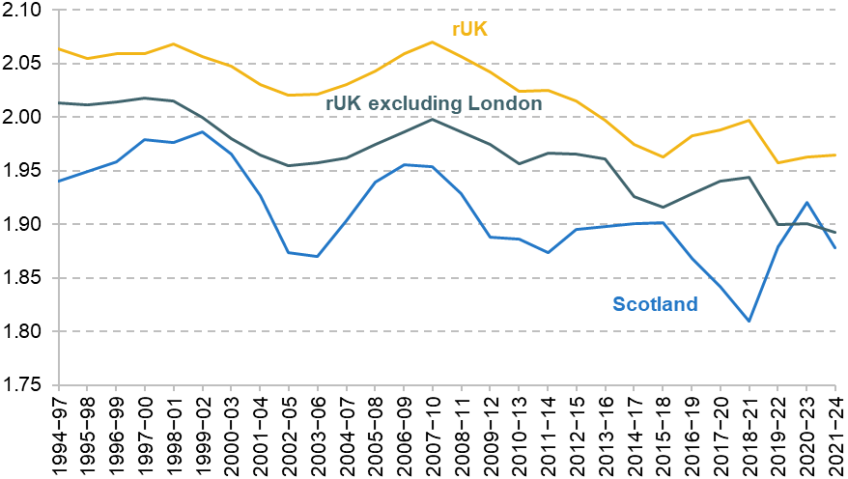
Note: Based on the old methodology for calculating income and poverty statistics (see Section 1). The income ratios shown here do not exactly match the ratios implied by the percentiles shown in Figure 14. This is because this figure shows three-year averages of annual percentile ratios, whereas Figure 14 shows three-year averages of the percentiles themselves, from which slightly different ratios would be obtained.
Source: Authors’ calculations using the Family Resources Survey, 1994−95 to 2023−24.
Figure A7. 50:10 ratio for net household income
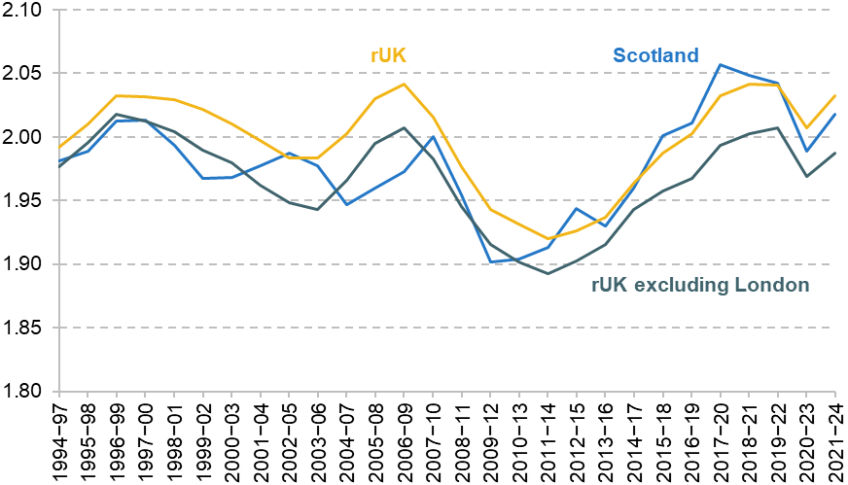
Note: Based on the old methodology for calculating income and poverty statistics (see Section 1). The income ratios shown here do not exactly match the ratios implied by the percentiles shown in Figure 14. This is because this figure shows three-year averages of annual percentile ratios, whereas Figure 14 shows three-year averages of the percentiles themselves, from which slightly different ratios would be obtained.
Source: Authors’ calculations using the Family Resources Survey, 1994−95 to 2023−24.
Figure A8. Absolute income poverty, after deducting housing costs
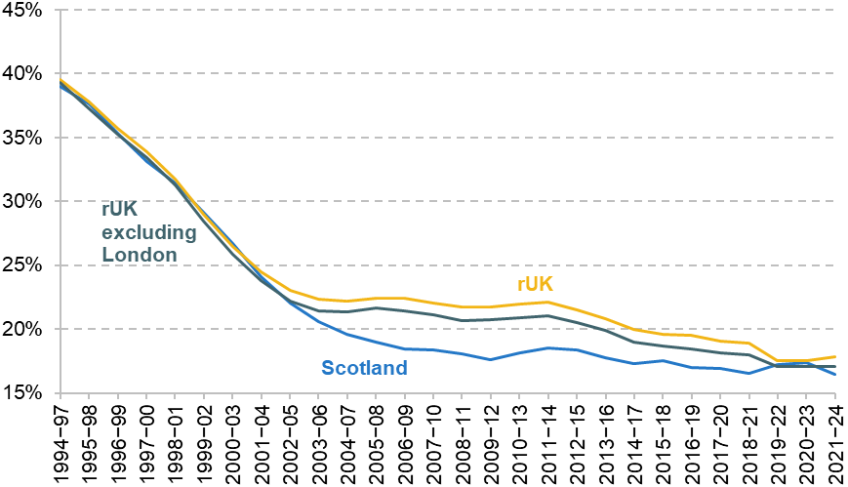
Note: Based on the old methodology for calculating income and poverty statistics (see Section 1).
Source: Authors’ calculations using the Family Resources Survey, 1994−95 to 2023−24.
Figure A9. Relative child income poverty, after deducting housing costs
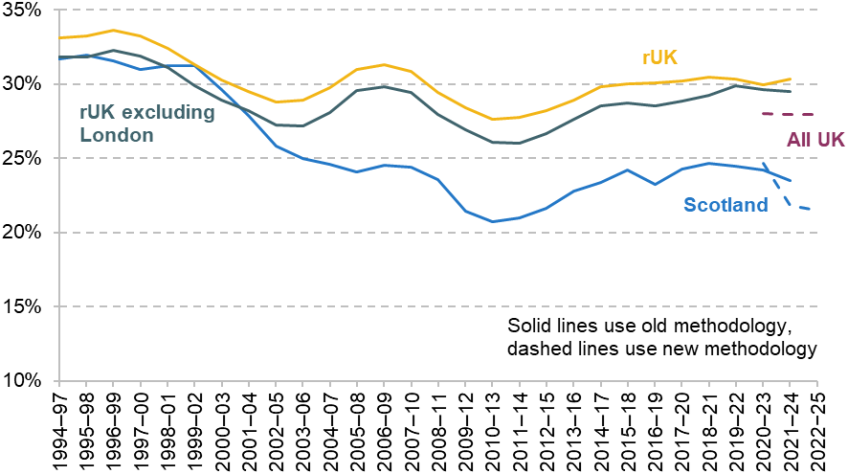
Note: See Section 1 for a discussion of the old and new methodologies for calculating income and poverty statistics.
Source: Authors’ calculations using the Family Resources Survey, 1994−95 to 2023−24, and Department for Work and Pensions (2026).
Figure A10. Relative pensioner income poverty, after deducting housing costs
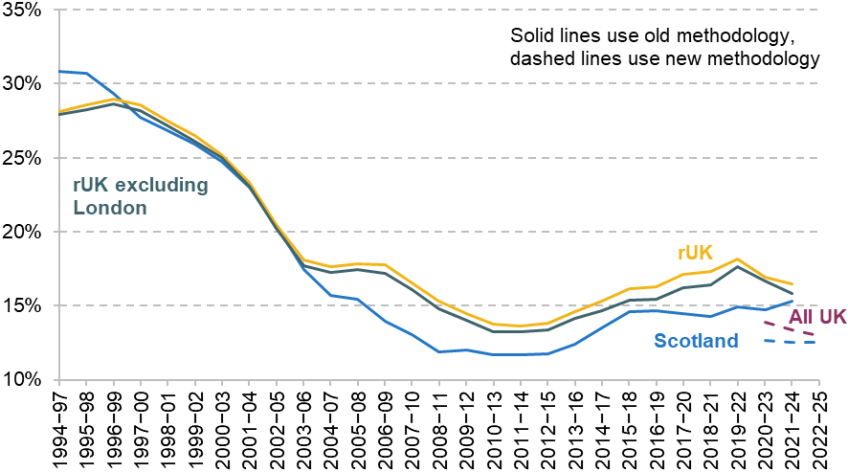
Note: See Section 1 for a discussion of the old and new methodologies for calculating income and poverty statistics.
Source: Authors’ calculations using the Family Resources Survey, 1994−95 to 2023−24, and Department for Work and Pensions (2026).
Figure A11. Relative working-age income poverty, after deducting housing costs
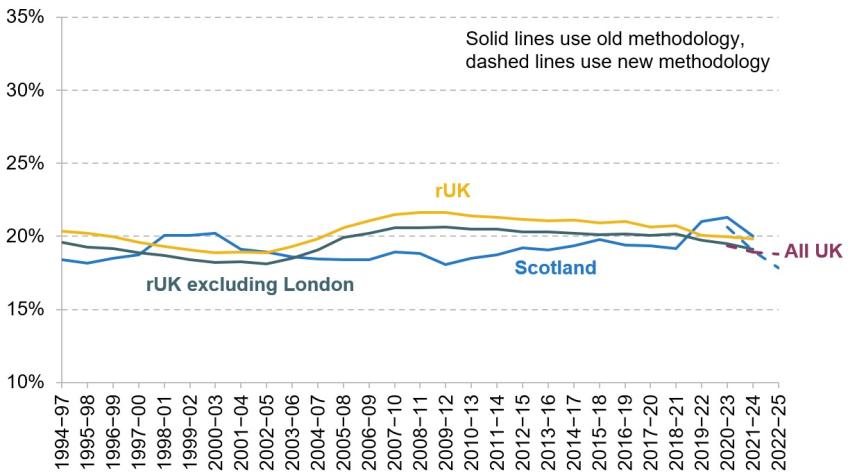
Note: See Section 1 for a discussion of the old and new methodologies for calculating income and poverty statistics.
Source: Authors’ calculations using the Family Resources Survey, 1994−95 to 2023−24, and Department for Work and Pensions (2026).
Figure A12. Rates of material deprivation by age group, 2010 definition
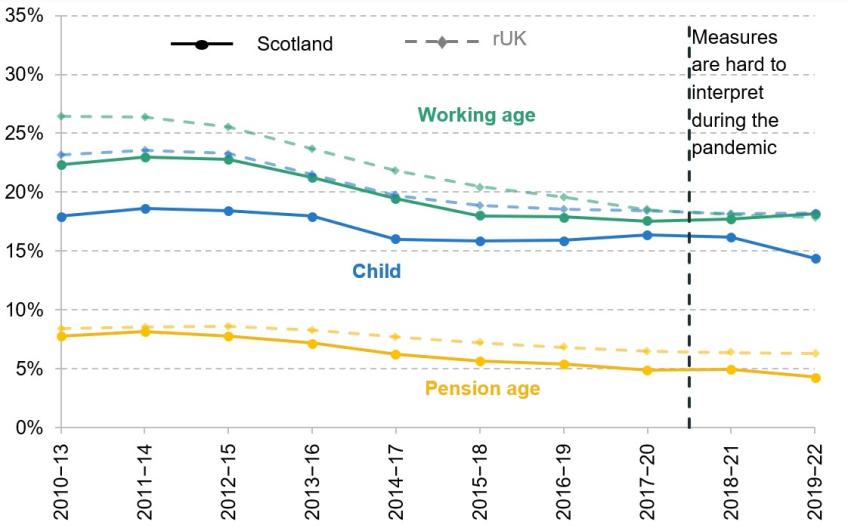
Source: Authors’ calculations using the Family Resources Survey, 2010–11 to 2021–22.
References
Adam, S., Michael, J., Phillips, D. and Wernham, T., 2026. The Scottish Government’s record on tax and benefit policy. IFS Report, https://ifs.org.uk/publications/scottish-governments-record-tax-and-benefit-policy-0.
Andersen, K., Nesom, S., Patrick, R., Pinter, I., Stewart, K. and Tominey, E., 2025. Investing in children: early findings on the difference the Scottish child payment makes to child well-being. LSE, Working Paper CASE/238, https://sticerd.lse.ac.uk/dps/case/cp/casepaper238.pdf.
Boileau, B. and Phillips, D., 2023. Income tax performance: Scottish Budget 2023–24. IFS Report, https://ifs.org.uk/publications/income-tax-performance.
Brewer, M., Etheridge, B. and O’Dea, C., 2017. Why are households that report the lowest incomes so well‐off? The Economic Journal, 127(605), F24−49, https://doi.org/10.1111/ecoj.12334.
Cattan, S., Waters, T. and Wernham, T., 2025. What is the effect of the two-child limit on children’s school readiness? IFS Report, https://ifs.org.uk/publications/what-effect-two-child-limit-childrens-school-readiness.
Cooper, K. and Stewart, K., 2021. Does household income affect children’s outcomes? A systematic review of the evidence. Child Indicators Research, 14, 981−1005, https://doi.org/10.1007/s12187-020-09782-0.
Cribb, J., Domínguez, M. and O’Brien, L., 2025. Scottish public sector employment and pay. IFS Report. https://ifs.org.uk/publications/scottish-public-sector-employment-and-pay.
Cribb, J., Wernham, T. and Xu, X., 2023. Housing costs and income inequality in the UK. IFS Deaton Review of Inequalities. https://ifs.org.uk/sites/default/files/2024-01/IFS-Report-Housing-costs-and-income-inequality-in-the-UK-edited.pdf.
Department for Work and Pensions, 2024. Family Resources Survey transformation: integrating administrative data into the FRS. https://www.gov.uk/government/publications/family-resources-survey-transformation-integrating-administrative-data-into-the-frs/family-resources-survey-transformation-integrating-administrative-data-into-the-frs.
Department for Work and Pensions, 2025a. Low income poverty projections for children, FYE 2025 to FYE 2030, November 2025. https://www.gov.uk/government/publications/low-income-poverty-projections-for-children-fye-2025-to-fye-2030-november-2025/low-income-poverty-projections-for-children-fye-2025-to-fye-2030-november-2025.
Department for Work and Pensions, 2025b. Children in low income families: local area statistics, financial year ending 2024. https://www.gov.uk/government/statistics/children-in-low-income-families-local-area-statistics-2014-to-2024/children-in-low-income-families-local-area-statistics-financial-year-ending-2024.
Department for Work and Pensions, 2026. Households Below Average Income: an analysis of the UK income distribution: FYE 1995 to FYE 2025. https://www.gov.uk/government/statistics/households-below-average-income-for-financial-years-ending-1995-to-2025.
End Child Poverty, 2025. Local child poverty statistics 2025. https://endchildpoverty.org.uk/child-poverty-2025/.
Fraser of Allander Institute, 2025. Meeting Scotland’s child poverty targets: modelling and policy packages. https://fraserofallander.org/wp-content/uploads/2025/03/2025-03-Child-poverty-modelling-report.pdf.
Henry, A. and Wernham, T., 2024. Child poverty: trends and policy options. In C. Emmerson, P. Johnson and K. Ogden (eds), The IFS Green Budget: October 2024. https://ifs.org.uk/sites/default/files/2024-10/Child-poverty-trends-and-policy-options_1.pdf.
HM Revenue and Customs, 2026. Earnings and employment from Pay As You Earn Real Time Information, UK: February 2026. https://www.ons.gov.uk/employmentandlabourmarket/peopleinwork/earningsandworkinghours/bulletins/earningsandemploymentfrompayasyouearnrealtimeinformationuk/february2026.
Institute for Fiscal Studies, 2025. Living standards, poverty and inequality in the UK – methodology. https://ifs.org.uk/living-standards-poverty-and-inequality-uk/methodology.
Krause, P. K., Rhodes, E., Miller, S., Bartik, A. W., Broockman, D. E. and Vivalt, E., 2025. The impact of unconditional cash transfers on parenting and children. National Bureau of Economic Research, Working Paper 34040, https://www.nber.org/papers/w34040.
Noble, K., Magnuson, K., Duncan, G., Gennetian, L. A., Yoshikawa, H., Fox, N. A., Halpern-Meekin, S., Troller-Renfree, S., Han, S., Egan-Dailey, S., Nelson, T. D., Nelson, J. M., Black, S., Georgieff, M. and Karhson, D., 2025. The effect of a monthly unconditional cash transfer on children’s development at four years of age: a randomized controlled trial in the U.S. National Bureau of Economic Research, Working Paper 33844, https://www.nber.org/papers/w33844.
Office for National Statistics, 2025a. Labour Force Survey performance and quality monitoring report: October to December 2025. https://www.ons.gov.uk/employmentandlabourmarket/peopleinwork/employmentandemployeetypes/methodologies/labourforcesurveyperformanceandqualitymonitoringreportoctobertodecember2025.
Office for National Statistics, 2025b. The employment of disabled people 2025. https://www.gov.uk/government/statistics/the-employment-of-disabled-people-2025/the-employment-of-disabled-people-2025.
Office for National Statistics, 2025c. Earnings and hours worked, public and private sector: ASHE table 13. https://www.ons.gov.uk/employmentandlabourmarket/peopleinwork/earningsandworkinghours/datasets/publicandprivatesectorashetable13.
Office for National Statistics, 2025d. Gender pay gap in the UK: 2025. https://www.ons.gov.uk/employmentandlabourmarket/peopleinwork/earningsandworkinghours/bulletins/genderpaygapintheuk/2025#the-gender-pay-gap-by-region.
Office for National Statistics, 2026a. HI00 Regional labour market: headline Labour Force Survey indicators for all regions. https://www.ons.gov.uk/employmentandlabourmarket/peopleinwork/employmentandemployeetypes/datasets/headlinelabourforcesurveyindicatorsforallregionshi00.
Office for National Statistics, 2026b. Annual Population Survey. https://www.nomisweb.co.uk/home/release_group.asp?g=16.
Page, M., 2024. New advances on an old question: does money matter for children’s outcomes? Journal of Economic Literature, 62(3), 891−947, https://doi.org/10.1257/jel.20231553.
Phillips, D., Waters, T. and Wernham, T., 2023. Employment, earnings and incomes in Scotland. IFS Report, https://ifs.org.uk/sites/default/files/2023-08/Employment-earnings-and-incomes-in-Scotland-IFS-Report.pdf.
Ray-Chaudhuri, S. and Wernham, T., 2025. New data suggest dramatic decline in living standards, but it may just be the quality of the data that has declined. IFS Comment, https://ifs.org.uk/articles/new-data-suggest-dramatic-decline-living-standards-it-may-just-be-quality-data-has.
Scottish Government, 2022a. Scotland’s National Strategy for Economic Transformation. https://www.gov.scot/publications/scotlands-national-strategy-economic-transformation/.
Scottish Government, 2022b. Fair Work action plan: becoming a leading Fair Work nation by 2025. https://www.gov.scot/publications/fair-work-action-plan-becoming-leading-fair-work-nation-2025/pages/2/.
Scottish Government, 2024. Fair Work First: guidance. https://www.gov.scot/publications/fair-work-first-guidance-3/pages/7/.
Scottish Government, 2025a. Scotland’s labour market insights: April 2025. https://www.gov.scot/publications/scotlands-labour-market-insights-april-2025/pages/people-not-in-work/.
Scottish Government, 2025b. Helping disabled people access work. https://www.mygov.scot/help-disabled-people-access-work.
Scottish Government, 2025c. Poverty and income inequality in Scotland 2021-24. https://data.gov.scot/poverty/.
Scottish Government, 2025d. Persistent poverty in Scotland 2010-2023. https://data.gov.scot/poverty/persistent.html.
Scottish Government, 2026a. Annual Survey of Hours and Earnings 2025. https://www.gov.scot/publications/annual-survey-of-hours-and-earnings-2025/pages/gender-pay-gap/.
Scottish Government, 2026b. Bringing hope, building futures: tackling child poverty delivery plan 2026−2031. https://www.gov.scot/binaries/content/documents/govscot/publications/strategy-plan/2026/03/bringing-hope-building-futures-tackling-child-poverty-delivery-plan-2026-2031/documents/tackling-child-poverty-delivery-plan-2026-2031/tackling-child-poverty-delivery-plan-2026-2031/govscot%3Adocument/tackling-child-poverty-delivery-plan-2026-2031.pdf.
Scottish Government, 2026c. Labour market trends: February 2026. https://www.gov.scot/publications/labour-market-trends-february-2026/pages/economic-inactivity-estimates/.
Scottish Housing Regulator, 2025. National Report on the Scottish Social Housing Charter - 2024-2025. https://www.housingregulator.gov.scot/landlord-performance/national-reports/national-reports-on-the-scottish-social-housing-charter/national-report-on-the-scottish-social-housing-charter-2024-2025/#section-5.
Thompson, S. and Randolph, H., 2026. Understanding the latest child poverty statistics. Fraser of Allander Institute, https://fraserofallander.org/child-poverty-stats-2026/.
Waters, T. and Wernham, T., 2024. The distributional impact of tax and benefit reforms since 2010. IFS Report, https://ifs.org.uk/sites/default/files/2024-06/The-distributional-impact-of-tax-and-benefit-reforms-since-2010.pdf.
Zoopla, 2024. Where can you get more space for your money? https://www.zoopla.co.uk/discover/property-news/what-is-the-best-value-home/.
Data
Department for Work and Pensions, NatCen Social Research. (2021). Family Resources Survey. [data series]. 4th Release. UK Data Service. SN: 200017, DOI: http://doi.org/10.5255/UKDA-Series-200017.
Acknowledgements
This report is the fourth in a series of Scottish election briefings funded by the Nuffield Foundation (grant reference WEL /FR-000026348) and Robertson Trust (grant reference PROG-7220). Co-funding from the Economic and Social Research Council (ESRC) through the Centre for the Microeconomic Analysis of Public Policy is also gratefully acknowledged (grant reference ES/Z504634/1).
The Nuffield Foundation is an independent charitable trust with a mission to advance social well-being. It funds and undertakes rigorous research, encourages innovation and supports the use of sound evidence to inform social and economic policy, and improve people’s lives. The Nuffield Foundation is the founder and co-funder of the Nuffield Council on Bioethics, the Ada Lovelace Institute and the Nuffield Family Justice Observatory. Find out more at www.nuffieldfoundation.org.
The Robertson Trust is an independent grant-making trust in Scotland. Established in 1961, the Trust’s mission is to prevent and reduce poverty and trauma in Scotland by funding, supporting and influencing solutions to drive social change. Its work focuses on four key themes: Financial Security, Work Pathways, Education Pathways, and Nurturing Relationships.
The authors thank Nina Ballantyne and Russell Gunson (Robertson Trust), Anvar Sarygulov (Nuffield Foundation) and Tom Waters (IFS) for helpful comments and suggestions. All views expressed and any errors or omissions are the responsibility of the authors alone, and not necessarily representative of the views of the Nuffield Foundation, Robertson Trust or their trustees or staff.
Endnotes
Authors

Jed Michael
Jed joined the IFS in 2025 and works in the Income, Work and Welfare (IWW) sector.

Tom Wernham
Tom's main research areas are living standards and poverty, the benefits system, and its interactions with the labour market.
More from IFS
Understand this issue


Policy analysis


Academic research


