
Downloads
Download the report as a PDF
PDF | 847.54 KB
Executive summary
Families receiving universal credit usually receive an additional element worth £3,514 per year for each child they have. However, for third and subsequent children born from 6 April 2017 onwards, families do not receive this uplift, due to a policy known as the ‘two-child limit’. The policy – intended to align the financial incentives of benefit recipients with families not receiving means-tested benefits with respect to having additional children – has been criticised by its opponents for increasing child poverty, particularly among larger families.
While income is strongly correlated with children’s educational outcomes, existing evidence on the causal impact of income is more limited and mixed, meaning until now it has been unclear whether, and to what extent, the two-child limit would harm children’s educational development. With the first cohort of children affected by the two-child limit now in primary school, this report uses new high-quality administrative data from England to provide the first robust evidence on the two-child limit’s impact on school readiness, measured by the early years foundation stage profile (EYFSP) at the end of reception. While this is not the only measure of progress in primary school, it is the benchmark that underpins the government’s ‘milestone’ in their ‘opportunity mission’.
Key findings
- Around 60% of families with a third or subsequent child under age 5 see their benefit entitlements for that child reduced by the two-child limit at any given time. Among those who receive means-tested benefits for the whole of the first five years of their third child’s life, the two-child limit typically reduced benefit entitlements by over £18,300 in total (in 2025–26 prices). Among all families whose third or later child was born in the months following April 2017, including those who do not receive any means-tested benefits, the average loss in benefit income for the child from the policy was an average of £10,200 over the first five years of the third or subsequent child’s life.
- Despite these substantial income losses, we find no statistically significant impact of the policy on the proportion of children achieving a ‘good level of development’ (GLD) at age 5 – a measure that covers communication, physical development, literacy and numeracy skills at the end of reception, which around two-thirds of children achieve in England. As ever, it is possible there is a very small effect that is statistically undetectable; to give a rough indication of what we can rule out, the results of our main estimation method suggest it is unlikely that the proportion of children achieving the GLD falls by more than 0.9 percentage points due to the policy. To put this in perspective, a child who is 11 days younger than another will, on average, be 0.9 percentage points less likely to achieve the GLD.
- We also find no evidence of an effect on the GLD for children in the groups most likely to be hit financially by the policy, such as families in the most deprived 20% of neighbourhoods and those entitled to free school meals prior to the third child’s birth. These groups are more likely to have low earnings; therefore, they are more likely to be entitled to means-tested benefits and to see their incomes affected by the two-child limit.
- These findings do not mean the policy has no wider consequences. The two-child limit clearly contributes to higher rates of child poverty and lower material living standards for many low-income families. This research does not study outcomes such as child health, well-being, skills not captured in the GLD measure, later educational performance at older age, or parental stress. This means that these findings do not rule other effects of the policy on children, now or as they grow up, or indeed on their parents.
- But the findings do suggest that scrapping or mitigating the two-child limit would be unlikely to contribute cost-effectively to the government’s target to increase the GLD pass rate to 75%, up from the current rate of 68%. Other policies, such as integrated family services delivered via Sure Start, the free entitlement to 15 hours of childcare for 3- and 4-year-olds, or home visiting programmes such as the Family Nurse Partnership, have been shown to have significant effects on school readiness.
1. Introduction
Families claiming universal credit (and previously child tax credit) receive an additional element currently worth £3,514 per year for each child they have. However, for third and subsequent children born since 6 April 2017, families do not receive this uplift. Billed by the Conservative government at the time of announcement in Summer 2015 as ensuring families on benefits faced ‘the same financial choices’ (HM Treasury 2015) as those relying on earnings when deciding whether to have additional children, opponents have criticised this ‘two-child limit’ for pushing children into income poverty. Indeed, relative child poverty has risen from 27% in 2010–11 to 31% in 2023–24, and this rise is more than entirely accounted for by families with three or more children – relative child poverty for families with one or two children actually fell. By the time it is fully rolled out, the effect of the two-child limit will be to increase child poverty by half a million children (Henry and Wernham, 2024). In this context, and faced with a tight fiscal situation as the government prepares to report on its child poverty strategy this autumn, the two-child limit has become a highly fraught political issue.
Critics argue that these effects on incomes may have knock-on effects on children’s life chances, with implications for future earnings and tax revenue. There are long-standing and well-documented gaps in a wide range of important outcomes between children from richer and poorer families, with disadvantaged children performing worse across a range of measures. However, while these correlations between family income and children’s outcomes are consistent with a causal link between the two, they are not enough to conclude how a policy such as the two-child limit might affect children’s development. As we discuss below, while the weight of existing research on the causal impact of income on children’s outcomes would suggest a negative effect of income on children’s outcomes, the evidence base does include a range of estimates, with studies sometimes finding that higher income improves children’s outcomes, and others finding little or no effect.
Now, with the children first affected by the policy aged 8, high-quality data from school records in England allow us to assess its early effects on educational outcomes. This report provides some of the first rigorous causal evidence on the policy’s impact, focusing on educational attainment at the end of reception (known as ‘school readiness’) for third and subsequent children born in England around April 2017. This is measured using the early years foundation stage profile (EYFSP), which assesses children’s progress on their early learning goals at the end of reception. The government has put a significant amount of weight on this measure – their ‘milestone’ in the ‘Opportunity Mission’ is for 75% of 5-year-olds to achieve a good level of development (GLD) by 2028 (up from 68% in 2023–24). This is defined as having achieved the early learning goals for communication and language, personal, social and emotional development, physical development, mathematics and literacy. While our estimates of the effect of the two-child limit on children’s likelihood to achieve the GLD cannot definitively tell us what the longer-term educational or wider impacts of the policy will be, they do inform the debate over the two-child limit itself, the trade-offs the government might have to face in achieving the opportunity mission milestone, and our broader understanding of the determinants of early childhood development.
This report is part of a mixed method study funded by Nesta, and follows Nesta’s own qualitative research published last year. That research, which interviewed parents of young children affected by the two-child limit, reported that many parents feared the two-child limit had reduced their ability to afford educational opportunities such as learning resources, extra-curricular activities, days out and access to formal childcare, with knock-on effects on their mental health. But it also found many parents saying they had attempted to shield their children from the effects by cutting back on their own expenditure (Motiani, Lucas and Bazalgette, 2024), skipping meals or accumulating debt – parents reported experiencing severe financial hardship, with consequences for their own mental health and that of their children. This report’s quantitative findings complement that previous research by providing quantitative evidence on the specific question of whether, and by how much, children’s school readiness at age 5 was affected by the two-child limit.
The report proceeds as follows. In the rest of the introduction, we briefly explain how the policy works and the impact it has had on family incomes and rates of child poverty. We also discuss what the existing evidence might tell us about the impact of income on child development. In Sections 2 and 3, we describe the data and methodology we employ in our policy evaluation. In Section 4, we present our main results. Section 5 concludes the report. The Appendices contain additional details on the data, and checks we have carried out to ensure the robustness of our methodology.
How does the two-child limit affect family income?
The benefits system supports families with children in several ways. The main system of support targeted at lower-income families is universal credit, which includes a standard allowance for all claimants and additional allowances for factors such as rent, incapacity, or caring responsibilities. Furthermore, for each additional child, a family on universal credit typically receives a ‘child element’ worth £3,514 per year. This total entitlement is then gradually withdrawn once a family earns more than their work allowance (£8,208 for a homeowning family with children), at a rate of 55p for every additional £1 of after-tax earnings.
However, for third and subsequent children born from 6 April 2017 onwards (with a few exceptions, e.g. adoption, non-consensual conception and multiple births, such as twins or triplets), families receiving universal credit do not receive this element. This is the policy known as the two-child limit. Its effect on universal credit entitlement at different levels of net earnings is illustrated in Figure 1, which shows entitlements for an example lone parent. As the figure makes clear, the two-child limit affects those out of work as well as those on a low income in work, but it does not affect families on higher incomes who are not entitled to universal credit anyway. Prior to the roll-out of universal credit – and, for some families, until the last financial year – additional support for poorer families with children was delivered through child tax credit instead. Although the rules for entitlement under that system differed from universal credit, the value of the child element was the same, the payment was available to families both in and out of paid work, and the effect of the two-child limit on benefit entitlements was similar.
Figure 1. Annual universal credit entitlement for a lone parent with three children, by net earnings from work
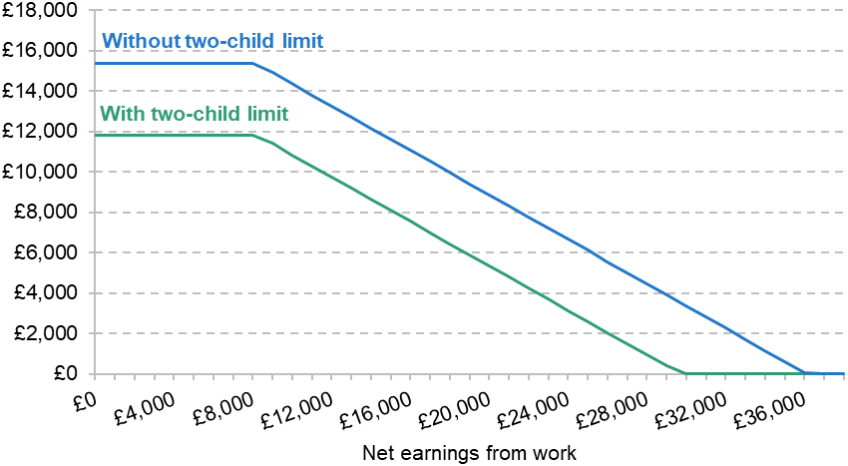
Note: Assumes lone parent is an owner-occupier and receives no additional allowances beyond the standard allowance and child element.
This report focuses on third and subsequent children born just after the April 2017 cut-off and their level of development at the end of reception year in the academic year 2021–22. By this age, the extent to which children have been affected by the drop in benefit entitlement varies considerably. Some have been in families with sufficiently high earnings each year never to be eligible for means-tested benefits, and so have seen no drop in entitlement. Others have been in families entitled every year, and so may have seen their total entitlements drop by over £18,300. And still others have fallen somewhere in between, having been entitled to benefits – and thus hit by the two-child limit – in some years but not others. Our analysis suggests that around 60% of families with a third or subsequent child under age 5 have their benefit entitlements for that child reduced by the policy at any point in time. On average, we estimate families with third and subsequent children born near the cut-off would lose around £10,200 in benefit entitlement as a result of the policy over the first five years of the child’s life (i.e. around £2,300 per year on average), if they did not change their earnings or employment in response to the policy.1 Families with three or more children were already, on average, a particularly low-income group, making them especially likely to be entitled to means-tested benefits.
Because the two-child limit applies only to children born after April 2017, the policy gradually affects more families over time. Targeted at lower-income families, the policy represents a significant hit to their disposable incomes; by the time it is fully rolled out, it will reduce the incomes of affected families by around 13% and push half a million children into absolute income poverty. In total, the government is set to save around £3 billion a year in benefit expenditure as a result of the two-child limit (Henry and Wernham, 2024).
Families may respond to the policy by entering paid work, or increasing the amount of hours they work (which itself could have an impact on child development). This means that the impact of the policy on total family income might be less than £10,200. Evidence suggests that the policy increased full-time employment among all mothers with a third child born around the cut-off by 1.4 percentage points when the child was aged 4 (Cook, 2025). Compared to the 60% of children affected, this suggests that employment responses to the policy would only reduce the hit to average family income by a relatively small amount, and would be concentrated in a small number of families. Families might also respond to the policy by having fewer children, though research so far has found no such response (Reader, Portes and Patrick, 2025).
What do we already know about how family income affects child development?
Money is largely believed to matter in shaping children’s outcomes. A lack of income may constrain the quantity and quality of monetary investments parents can make to support their children’s development. This ranges from basic necessities, such as safe housing and food, to access to educational opportunities such as school trips, extracurricular activities, and learning resources at home such as play materials. A second channel through which poverty is believed to affect children is through the emotional strain and stress that it creates on parents and caregivers, which in turn results in reduced engagement in play with children, less effective parenting (such as reduced warmth and bonding), increased conflict, inconsistent discipline and/or punitive or unresponsive parenting styles.
Empirically, there is well-documented evidence of a strong correlation between family income and early childhood development. For example, Cattan et al. (2024) show, using a longitudinal study of children born in the UK in the early 2000s, that at age 3 children in the poorest 10% of families have scores on measures of emotional and behavioural difficulties that are, on average, 24 percentiles higher, and scores on cognition that are 31 percentiles lower, compared with children in the richest 10% of families. However, it does not follow from these correlations that simply increasing the income of poorer families will necessarily improve developmental outcomes; that is, the relationship is not necessarily causal. Indeed, families at different income levels differ in many other important ways, such as parental health and education, which may also influence child development. These confounding factors mean we cannot determine the effect of income simply by comparing richer and poorer families. Therefore, estimating the causal relationship between income and development reliably is challenging. To do so in the most rigorous way, we need a randomised controlled trial to generate random variation in income across two groups. While there are a few examples of such trials, experimental evidence on the causal relationship between income and development remains the exception rather than the norm. Instead, researchers have studied policies that are designed in a way that generates arguably ‘as good as random’ variation in income within a particular population – providing so-called quasi-experimental evidence.
Two recent literature reviews, by Cooper and Stewart (2021) and Page (2024), synthesise the existing body of quasi-experimental and experimental evidence from various countries and conclude that the weight of the evidence would suggest there is a positive causal effect of family income on a variety of children’s outcomes, including cognitive development, educational outcomes and health outcomes, at younger and older ages.
But as Page (2024) emphasises, there is significant variation in the size of effects found. While there is still much to understand about what drives this variation, Page (2024) highlights that studies are more likely to find a stronger impact when the transfer is regular and predictable. The evidence also suggests that the impact of additional family income on children’s outcomes is likely to be greater for poorer families than for middle- or higher-income families, but we still know too little about the impact of cash transfers across the income distribution to be able to conclude how far income transfers to poorer children could go in closing inequalities in outcomes (Carneiro et al., 2025). While this evidence base is predominantly non-UK based, if the patterns found in this literature did apply to the UK context, they would suggest that the two-child limit could have a particularly negative impact on child outcomes because it affected families already on low incomes and meant that affected families missed out on regular and predictable payments that unaffected families did receive. The research base for the UK context specifically remains limited. There, the evidence of a link between family income and children’s outcomes is mostly based on correlational and longitudinal studies, and only includes a few quasi-experimental studies. Of most relevance is Reader (2023), which finds that a universal conditional cash transfer during pregnancy (the Health in Pregnancy Grant of £190, available for babies due from April 2009 to April 2011) improved birth outcomes. To our knowledge, there is no quasi-experimental or experimental causal evidence of the impact of income transfers on children’s educational attainment specifically, making this analysis the first of its kind for the UK context.
Most of the literature to date on the two-child limit has focused on its impact on households’ finances and poverty. As mentioned above, findings by Read, Portes and Patrick (2025) and Cook (2025) suggest that the fertility and labour supply responses to the policy were unlikely to be large enough to significantly counteract its effect on the income of families affected. In fact, Henry and Wernham (2024) argue that, partly as a result of this policy, the rise in relative child poverty since 2010 has been more than entirely accounted for by families with three or more children; poverty among one- and two-child families has fallen.
Motiani et al. (2024) offer a comprehensive qualitative study of the experiences of large families with very young people affected by the two-child limit. They report that parents in these families thought that the two-child limit had worsened their financial situation compared with their previous circumstances, and that as a result their children were losing out on opportunities to learn and play. For example, compared with their older siblings, they reported their children did not spend as much time in formal childcare, had less access to learning resources such as toys and books, had fewer opportunities for educational experiences, and/or for socialisation with their peers. The parents the researchers interviewed also shared how they struggled to be the parent they aspired to be, which in turn took a toll on their mental health.
While these findings would suggest that the two-child limit would have a negative impact on the development of children, Motiani et al. (2024) also described the many ways in which parents tried to cope with the severe financial pressures and neglected their own needs in order to meet their children’s needs and provide the support they needed to grow and develop. Importantly, the quantitative estimate of the impact of the two-child limit on school readiness that we present in this study will encapsulate these different potential and possibly counteracting mechanisms.
Understanding the effects of the two-child limit is important not only because of its large impact on the incomes of an already particularly poor group on average (i.e. families with three or more children) but also because it presents a unique opportunity to study the effects of income on early educational outcomes in the UK. Three factors make this possible. The first is simply the fact that it does represent such a large proportional change in income for a poor group of households. The second reason lies in the precise logistics of the roll-out of the policy, which, as will be explained, allow a causal analysis of its effects to be conducted. The third is the recent availability of rich administrative data on the educational outcomes, date of birth and birth order of all children in the state health and education system in England.
2. Data
This report draws on a very recently created administrative dataset, Education and Child Health Insights from Linked Data (ECHILD), which links state school records from the National Pupil Database (NPD) with NHS hospital records from the Hospital Episode Statistics (HES). The NPD includes a termly census of children in English state schools, alongside test results at ages 5, 7, 11 and 16. The HES contains data on every hospital admission and outpatient visit in England.
A major contribution of ECHILD is its ability to identify siblings within school records –something not previously possible. This is thanks to work by Feng et al. (2024), who linked children in ECHILD to their mothers using birth and maternal hospital admission records. This link allows us to see which individuals are siblings (or maternal half-siblings) in both health and school records. More detail on the linkage, and how this affects the representativeness of our analysis sample, can be found in Appendix A.
Using this mother–baby link and the dates of birth admission records,2 we can identify with high accuracy which children are subject to the two-child limit; that is, which children are third or subsequent children born after the 6 April 2017 policy cut-off.3
Importantly, we do not directly observe benefit entitlement, so we cannot pinpoint exactly which children saw their household’s benefit entitlement reduced as a result of the policy. Instead, we identify all children who meet the demographic conditions for being affected by the policy: they live in a family with at least three children where the youngest is born on or after 6 April 2017. Such families would have had their entitlement reduced by the policy if their household income were low enough to be entitled to means-tested benefits.4 We also observe other measures, such as eligibility for free school meals (FSM) and area-level deprivation, which allow us to examine groups more likely to have been affected by the policy.
In addition to identifying children affected by the policy, the dataset provides rich demographic, school and health information. This includes data on which children are deemed to be ‘school ready’, as measured by their achievement of a GLD at age 5, as we explain below. The data also include delivery method at birth, health indicators at birth, maternal age, ethnicity and area-level deprivation, all of which are used to check the robustness of our methodology.
The good level of development measure
The main outcome we study is whether a child achieves a good level of development (GLD) in the Early Years Foundation Stage Profile (EYFSP) assessed at the end of reception when most children are aged 5. The EYFSP assesses children against 17 early learning goals, divided into five areas, on a pass/fail criterion in seven areas of learning (see Table 1). These are assessments, usually carried out by teachers, based on a statutory framework.
Table 1. Early learning goals assessed as part of the EYFSP

Note: For more details, see the early years foundation stage statutory framework (Department for Education, 2014).
In order to be defined to have achieved the GLD, a child needs to pass all of the first five areas (comprising 12 goals), which cover the three primary areas of learning (communication and language, personal, social and emotional development, and physical development) and two specific areas of learning (literacy and mathematics).
Figure 2 shows the proportion of children achieving the GLD at age 5 who were born around the time the two-child limit was introduced and are in reception in academic year 2021–22, as we calculate in the ECHILD data. The figure shows that almost two-thirds of children pass this measure, but with substantial variation between groups. Girls are around 13 percentage points more likely to achieve the GLD than boys. Only 58% of those born in the most deprived fifth of areas, and fewer than half of those with a sibling claiming FSM before they were born, achieved GLD. This is another illustration of the correlation between child development and income, as discussed in Section 1. Also notable is the fact that third and subsequent children are substantially less likely to achieve the GLD – though to some extent this is more of the same correlation with income, as larger families are more likely to be poorer.
Figure 2. Percentage of children achieving a GLD at age 5, born around April 2017

Note: Calculated based on all children observed in academic year 2021–22. Some minor differences with published statistics, for example where we measure characteristics at birth (based on HES records) rather than using data from the NPD.
Source: Authors’ calculations using ECHILD.
We cannot (yet) measure later attainment for third and subsequent children born around April 2017, due to data lags and simply because those children are only 8 years old. But the GLD measure is likely to give us some clue as to what later effects might be. Analysis by the FFT Education Datalab found that the EYFSP in the academic year 2006–07, which had a different assessment framework than that used in this paper, was a decent predictor of later GCSE performance. More specifically, those scoring lowest on the EYFSP in the academic year 2006–07 scored roughly 3.5 grades lower, on average, in English and mathematics GCSEs in 2017–18. However, while the effects of the two-child limit on the GLD may be indicative of effects on educational attainment at an older age, we cannot rule out the possibility that those later effects will present a different picture. For example, previous research on Sure Start centres found a larger effect on later educational outcomes than those measured at the time of the EYFSP (Carneiro et al., 2025).
3. Methodology
A robust estimate of the causal effect of the two-child limit policy is made possible by the design of its introduction. The two-child limit reduces the benefit entitlements of families with third and subsequent children born on or after an arbitrary cut-off date, 6 April 2017. This means a significant difference in benefit entitlements, and therefore incomes, across families with at least three children, which we would not expect to differ, on average, in any ways other than for the fact that some have one child born just before the cut-off and others have one child born just after. As we discussed previously, this difference in entitlements averages around £10,200 in total across the first five years of the child’s life (i.e. £2,300 in each of those years on average). This average includes families never entitled to benefits who therefore see no fall in entitlement, and families whose entitlements are lower every month for the whole first five years of their child’s life, who lose over £18,300.
This design lends itself to an analysis method known as a regression discontinuity design (RDD). The basic idea is to compare outcomes for children born just before the cut-off with those born just after, within the same academic year, on the basis that such children are similar in every way other than being treated differently by the two-child limit. One way in which children born before and after the cut-off differ is in their age at the time the EYFSP is assessed, with children born later in the school year tending to be less likely to achieve their early learning goals on average than their elder peers. The RDD method allows us to account for these age-related trends in our analysis and, in essence, to examine whether children born in the months just after the April cut-off perform differently to those born in the months just before, beyond what we would expect due to differences in age alone. If we find an abrupt shift in the proportion of children achieving the GLD occurring at the cut-off, then we would attribute this to the two-child limit. A more precise and technical statement of the methodology is found in Appendix B.
The analysis set out here gives us the average effect of the policy on outcomes among all children who meet the age criteria to be affected by the policy. This average includes the effect among children whose family’s income is high enough when they are young that they are never entitled to benefits. As discussed above, we think around 60% of these children were affected by the policy. This is an ‘intention-to-treat’ design, and, compared with studying the impact of the policy solely on those directly affected by it, will tend to scale the impact we measure towards zero. To help interpret these results, we compare them to the effect of the policy on average benefit entitlements up to age 5 – measured across all families with three or more children – to compute the average effect of the reform per £1,000 of entitlement lost. Though, as we will see, because our estimates are close to zero anyway, this rules out a large effect of the policy even among those poor enough to actually see their benefit entitlements hit by the policy.
There are two key things we need to be assured of for our methodology to work.
- There are no other significant changes to policy or changes in other background factors that would affect the child’s environment, which affect the same group of children according to the same (or a similar) cut-off date.
- Children do not systematically and discontinuously differ around the cut-off. For example, if those born in March happened to be significantly more likely to be from lower-income families than those born in April, then this would cause a problem for our approach. This could be because of strategic choices made by parents in response to the policy (such as timing a birth to just before April 2017 to avoid the impact of the two-child limit).
Our analysis sample includes children born from September 2016 to August 2017, with those born within a week of 6 April 2017 excluded. This is to mitigate problems that might arise from measurement error in date of birth (because we use date of birth admission,5 though we think the extent of this measurement error is very small) or strategic birth timing. Therefore, those born before April 2017 form a control group in our analysis, as they are unaffected by the policy.
In the next section, we discuss these assumptions in more detail, including both data analysis and qualitative research that reassure us that these assumptions hold.
4. Results
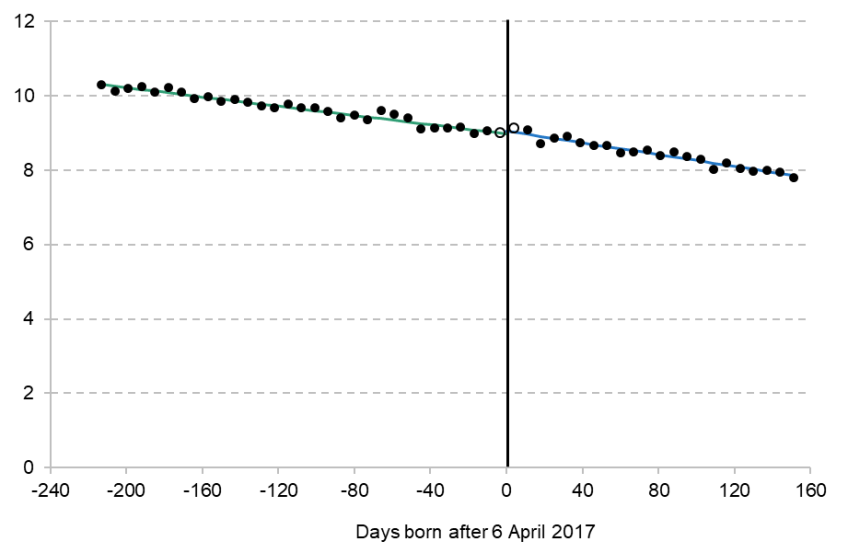
Our main result is shown in Figure 3, which plots the proportion of all third and subsequent children achieving a GLD by their date of birth, relative to the policy’s 6 April cut-off. One clear pattern is the strong age gradient: children born just four weeks apart show over a 3 percentage point gap in attainment, with later-born children doing worse. This pattern is consistent with earlier cohorts when no policy change occurred (as shown later in Figure 6), and our statistical model accounts for this by fitting separate age trends for children born before and after the cut-off. Despite the policy reducing average benefit entitlements for post-cut-off children by around £10,200 over their first five years, there is no visible drop in GLD attainment around the cut-off that could be attributed to the two-child limit. A negative effect would appear as a downward jump in the trend line to the right of the cut-off. We see no such pattern – there is essentially no jump at all. As shown in Figure C1 in Appendix C, there is also no effect on the average score, calculated as the number of the 12 early learning goals contributing to the GLD which children reach.
Figure 3. Proportion of third and subsequent children achieving a GLD, by date of birth relative to 6 April 2017

Note: Lines show results of the RDD analysis, as explained in Section 3 and set out in detail in Appendix B. The regression lines are based on day of birth admission, but the dots show weekly bins of date of birth admission for ease of reading. Date of birth admission is used as a proxy for date of birth. Birth admissions within seven days of the 6 April cut-off are excluded from the regression analysis, but illustrated in the figure by the hollow dots.
Source: Authors’ calculations using ECHILD.
It is important to note that this analysis does not guarantee that the policy had no negative impact at all. Even though our data include almost all third and subsequent children with state school and health records – more than 90,000 in total – it remains possible that a small negative effect exists that our analysis could not detect, because it was masked by idiosyncratic differences between children born just before and after the cut-off.
Figure 4 helps put a bound on this. It shows our central estimate of the policy’s impact on the GLD pass rate, along with a range of values that are statistically plausible given the data (the 95% confidence interval). The central estimate itself is very close to zero, and the range suggests that we are confident6 that the effect was no worse than a 0.9 percentage point fall in the GLD pass rate – about the same as the impact of being born 11 days later in the school year. Estimates based on other methods may give different numbers here; for example, the analysis shown in Table C2 in Appendix C only rules out an effect larger than 1.5 percentage points based on the same confidence threshold. But it is clear that, relative to the large hit to benefit entitlements caused by the two-child limit, we can be confident of no large impact on educational attainment.
Figure 4. Estimate of percentage point impact of two-child limit on pass rate for GLD and component areas of learning, with 95% confidence intervals

Note: The figure shows the coefficient on binary indicator for birth after 6 April 2017, from the regression specified in Appendix B. Sample includes children aged 5 in academic year 2021–22, and so born either side of 6 April 2017. The sample excludes children with birth admissions within seven days of the cut-off. Areas with asterisks do not contribute to the GLD classification.
Source: Authors’ calculations using ECHILD.
Such precise estimation means, even if we were able to observe children whose families were on means-tested benefits and if we restricted our focus to this group, we can be confident we would still see no large average effects. Put another way, losing £1,000 in cumulative benefit entitlement between birth and age 5 would be expected to reduce the GLD pass rate by no more than 0.09 percentage points, equivalent to being born one day later. We also show results for each of the seven EYFSP learning areas, the first five of which count towards the GLD. In no case do we find evidence of large adverse effects.
Does the two-child limit have different effects on particular groups?
Having estimated the overall impact for all third and subsequent children, we next examine effects for specific subgroups. These include:
- children whose families were, or were not, observed to be claiming FSM before April 2017 (43% and 56% of our analysis sample, respectively);7
- children born in the most deprived fifth of areas (31% of our analysis sample);
- boys and girls;
- White and minority ethnic children (68% and 32% of our analysis sample, respectively).
As mentioned earlier, our dataset does not include information on benefits, but the first subgroups allow us to proxy for groups of children who live in families that are disproportionately likely to have been affected by the two-child limit. We also explore whether the policy affected children differently by gender, and by racial and ethnic backgrounds because, as discussed earlier, school readiness levels significantly differ between these groups, and the way households respond to the policy may also vary along these dimensions.
The results, shown in Figure 5, are all close to zero, with no statistically significant differences from zero. Estimates are slightly less precise than in the overall analysis because of the smaller sample sizes in each group.
Figure 5. Estimate of percentage point impact of two-child limit on pass rate for GLD and component areas of learning, with 95% pointwise confidence intervals

Note: This figure shows the coefficient on binary indicator for birth after 6 April 2017, from the RDD specified in Appendix B. Sample includes children aged 5 in academic year 2021–22, and so born either side of 6 April 2017. The sample excludes children with birth admissions within seven days of the cut-off.
Source: Authors’ calculations using ECHILD.
Of particular interest are children from families who had previously claimed FSM before April 2017 – meaning they had definitely been in receipt of means-tested benefits – and children in the most deprived areas. Of course, not all children affected by the two-child limit belonged to these groups. But they were especially likely to have lost benefit entitlement if born after the 6 April cut-off, and would also have been hit harder by any cash loss due to their lower incomes (though some not in these groups were still also affected by the two-child limit). Yet even among these groups, there is no evidence of a large effect on the GLD pass rate.
How robust are these results?
As discussed in Section 3, to successfully estimate the causal impact of the two-child limit with our research methodology, we must make two key assumptions.
- There are no other significant changes to policy or changes in other background factors that would affect the child’s environment, which affect the same group of children according to the same (or a similar) cut-off date.
- Children do not systematically and discontinuously differ around the cut-off. For example, if those born in late March happened to be from generally lower income families than those born in April, that would cause a problem for our approach because our strategy would confound the two-child limit with that of other systematic and unobserved differences between children born on each side of the cut-off. One reason why families may systematically differ on each side of the cut-off is if some families strategically timed the birth of their child to just before April 2017 to avoid the impact of the two-child limit.
Assumption 1
We are not aware of any other abrupt policy changes using the same date of birth cut-off for third and subsequent children. There was at the same time the withdrawal of the family premium in tax credits and universal credit – but that only affected families with a first-born child born on or after 6 April 2017.
There could be seasonal factors – such as termly provision of services or differences in early education enrolment – that might create systematic differences in outcomes for children born just before or just after the 6 April cut-off. For example, free childcare for 3-year-olds is provided the term after the child turns 3, meaning that those born at the end of March become eligible in April, while those born at the start of April become eligible in September. It is possible this could contaminate our results.
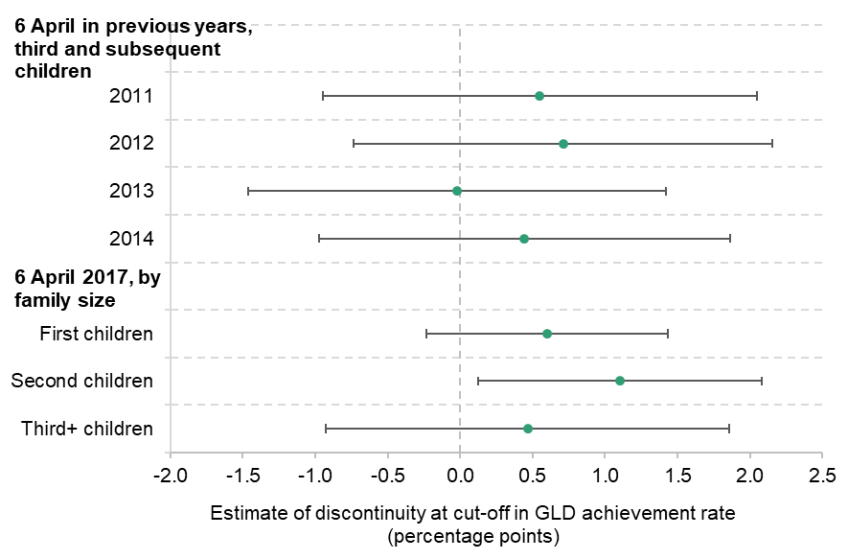
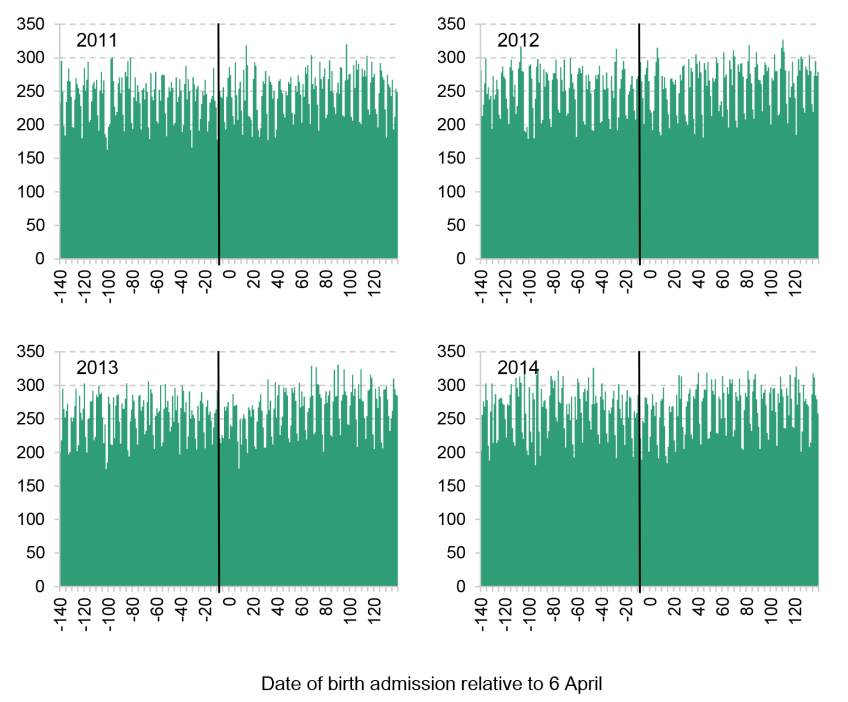
We check this in two ways. First, we repeat the same analysis for third and subsequent children born around April in earlier years, for whom there was no major policy reform based upon their precise date of birth, but the same seasonal factors would still be at work. If seasonal factors were interfering with our estimate of the effect of the two-child limit, we might see a jump or drop in pass rates about the cut-off in those earlier years. Figure 6 checks this separately for those born around April in each year from 20118 to 2014 (children born in 2015 and 2016 did not have the EYFSP assessment due to the COVID-19 pandemic). As the figure shows, the earlier cohorts all show a smooth, roughly linear age gradient across the year, with no discontinuity at the April point – mirroring what we see in 2017. This reassures us that the absence of a jump in 2017 is not due to seasonal patterns masking a true policy effect.
Figure 6. Proportion of third and subsequent children achieving a GLD, by day of birth relative to 6 April, 2011–14

Note: Lines show results of RDD analysis, as explained in Section 3 and stated more precisely in Appendix C. The regression lines are based on day of birth admission, but the dots show weekly bins of date of birth admission for ease of reading. Date of birth admission is used as a proxy for date of birth. Birth admissions within seven days of the 6 April cut-off are excluded from the regression analysis.
Source: Authors’ calculations using ECHILD.
Second, we repeat the same analysis for those born around April 2017 who were first or second children in the family. Again, these children’s birth dates do not determine whether they are affected by the two-child limit.9 As Figure 7 shows, again we see a smooth age gradient across the year, though in the case of second children there is a slight statistically significant jump in the GLD for children born after April 2017. As discussed in Appendix C, this jump is itself statistically indistinguishable from the jump observed among third children born around April 2017.
Figure 7. Proportion of first children and second children achieving a GLD, by day of birth relative to 6 April 2017
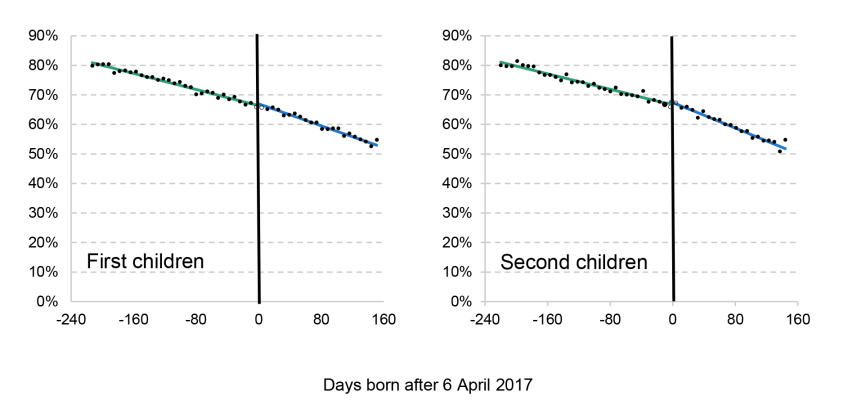
Note: Lines show results of the RDD analysis, as explained in Section 3 and stated more precisely in Appendix B. The regression lines are based on day of birth admission, but the dots show weekly bins of date of birth admission for ease of reading. Date of birth admission is used as a proxy for date of birth. Birth admissions within seven days of the 6 April cut-off are excluded from the regression analysis.
Source: Authors’ calculations using ECHILD.
In Appendix C, we show the results of a more rigorous statistical exercise, which treats each of these groups of children from earlier cohorts, and first and second children separately, as a control group (a ‘difference in discontinuity’) and confirms the findings of the visual analysis of Figures 6 and 7 in the previous paragraphs. We also show, in Figure C4 in Appendix C, the estimates of the discontinuities in Figures 6 and 7, with 95% confidence intervals.
Assumption 2
We examine whether parents altered the timing of births to avoid the policy, either by bringing forward delivery (e.g. via elective caesarean) or by forgoing a third or later child. The data show no drop in the number of births in the months after April 2017, and no spike in elective caesareans before the cut-off. We also find no changes in key predetermined characteristics – maternal age, ethnicity, area deprivation at birth and newborn health – reassuring us of the comparability of children born before and after the cut-off. This is consistent with the fact that many parents were unaware of the policy when it was implemented.10 All these results can be seen in Appendix C.
Finally, we test the robustness of our results to different analytical choices, such as varying the number of weeks included on either side of the cut-off, changing how many days are excluded close to the cut-off, and adjusting the functional form of the statistical model. Based on the other checks we have conducted, it would be unlikely these assumptions would have a material impact, but we check for this directly to make sure. Again, the results of these tests are found in Appendix C. In all cases, the conclusion is the same: there is no evidence that the two-child limit caused a large fall in the proportion of children achieving a GLD.
Summary
Here we summarise the range of checks we have conducted to verify the reliability of our findings:
- We have repeated the analysis on children not affected by the two-child limit policy (because they were first or second children, or born in previous years), and verified that patterns in attainment across the year look similar, both visually and using a difference-in-discontinuity design.
- We have ensured our results are not sensitive to assumptions of linear impact of age at the time of the EYFSP, to how far away from the birth cut-off we estimate trends, or to the number of weeks immediately adjacent to the cut-off we excluded, by varying these assumptions. As shown in Appendix C, we still find results close to, and not statistically distinguishable from, zero in all cases.
- We have zoomed in on subgroups more likely to be affected by the policy, such as those born in poorer areas and those whose families were entitled to FSM prior to the policy. We still find no evidence that the policy had any effect on school readiness.
- We have checked that there are no sharp changes in various predetermined characteristics, such as area deprivation, maternal age and ethnicity, to ensure our treatment and control groups are comparable in all respects other than age.
- We have checked that there is no evidence of strategic birth timing around the cut-off, or drops in the frequency of births immediately after the cut-off.
5. Conclusions
This report finds that the two-child limit did not cause a significant reduction in the proportion of children achieving a GLD at age 5. Using high-quality administrative data covering the majority of children in the state school and health systems in England, and exploiting the policy’s cut-off date in a robust RDD, our central estimate suggests no negative effect at all, and we can rule out with reasonable confidence any negative effect larger than 0.9 percentage points. With the existing evidence base on the causal effect of income on child outcomes still developing, and evidence from the UK very limited, this report adds an important new piece of causal evidence to an emerging literature on how income shapes early childhood development.
Given that some previous research suggests that increases in family income can improve early educational outcomes, and given the substantial income loss caused by the two-child limit, this result may seem surprising. While the weight of the academic literature suggests a positive impact of family income on children's outcomes, the evidence base shows considerable variation in estimated effects of income on educational performance. This even includes studies that find null impacts of cash transfers on child development outcomes, such as a recent randomised controlled trial in the United States, which tested cash transfers of a similar magnitude to the cuts in benefit incomes caused by the two-child limit (Noble et al., 2025).
Our research design does have limitations that are important to bear in mind regarding what can be or cannot be concluded from our findings. While the finding presented in our research is methodologically robust, the research, so far, has only focused on the policy’s effect on school readiness at age 5 as measured by the EYFSP in England. This means that we cannot rule out effects on outcomes we do not measure here, such as children’s health, well-being, behaviour or early skills not captured by the EYFSP. Motiani, Lucas and Bazalgette (2024) document common worries, among the parents they interviewed affected by the policy, that the policy had reduced children’s access to opportunities for play and learning, which could have an impact on these outcomes.
We cannot rule out either that the policy will have impacts on outcomes as children grow and the difference in income between families with a third or subsequent child born before or after the cut-off cumulates. For example, previous research on Sure Start found that its benefits for later educational outcomes were larger than those measured at the time of the EYFSP (Carneiro et al., 2025), though evidence of a positive effect on the rate achieving the GLD was still found, as discussed later in the conclusion.
Finally, the research also cannot rule out significant effects on parents’ health or well-being. Given the size of the reform, one potential explanation for our finding is that parents on lower incomes might tend to prioritise resources for their children first, and start spending more on themselves once their incomes increase. So children might be shielded to some extent from the effects of large decreases or increases in income. Consistent with this possibility, many of the parents interviewed by Motiani, Lucas and Bazalgette (2024) frequently reported that their stress and mental well-being were affected, from trying to raise children while facing severe financial hardship, and having to sacrifice taking care of their own health to prioritise their children. Our future research, including the use of ECHILD, will shed light on the effects of the policy on some of these wider outcomes both in early childhood and beyond.
While it is good news that we find no evidence the two-child limit has harmed this dimension of children’s early development, the results also present policymakers with a challenge. On the one hand, the government is currently developing a child poverty strategy, with one of its focuses on income poverty.11 Abolishing the two-child limit would be the most effective policy to help poorer children on that measure. On the other hand, the government is pursuing a mission to break the barriers to opportunity, with the milestone goal to increase the GLD pass rate to 75% by 2028. Our findings suggest that abolishing the two-child limit would be unlikely to help with this specific aim and that policymakers may need to use other policy levers to reach this fairly ambitious target (for which they have actually set out a separate strategy).12 Various other research provides examples of interventions and policies that can have a positive effect on school readiness. For example, the introduction of the free part-time pre-school provision for 3-year-olds (Blanden et al., 2016) and the Family Nurse Partnership home-visiting programme (Robling et al., 2021) have both been found to increase school readiness (based on an earlier measure than the one used in this report) in England. Recent research found that children who had access to a Sure Start centre during their early years were more likely to score higher on their Foundation Stage Profile (FSP) score and to achieve a GLD (Carneiro et al., 2025). Interventions have also been shown to improve components of school readiness: targeted language teaching after the COVID-19 pandemic in England offered via the Nuffield Early Language Intervention (NELI) was shown to boost oral language skills (Smith et al., 2023), and a programme of sustained parenting support up to age 5 in Ireland was found to boost the cognitive and socio-emotional skills of children (Doyle, 2020).
Naturally, each policy will come with its own cost, and it will be important to not only consider the effectiveness but the cost-effectiveness of policy options. When it comes to the two-child limit, this report suggests we can be reasonably confident that giving families with young children an additional £1,000 of benefits in their first five years would boost the GLD pass rate by no more than 0.09 percentage points. To put this into perspective, research on Sure Start finds that living close enough to a Sure Start centre from birth to age 5 boosted children’s chances of achieving a GLD by 1.49 percentage points, at an average cost per child of around £5,000 per child (Carneiro et al., 2025).
Had our results shown a clear negative effect of the two-child limit on early educational outcomes, the government might have been able to ‘kill two birds with one stone’ by scrapping the policy – and thereby both improving early attainment and reducing child poverty. Instead, the emerging evidence on a range of early years interventions implies that the government may need to prioritise between these two objectives, or commit greater resources to meet both at once.
Appendix A. Additional information on data: representativeness of the analysis sample in ECHILD
Though the Education and Child Health Insights from Linked Data (ECHILD) data form an administrative dataset, meaning the data is based on actual government records of the population, rather than a survey, there are a few reasons why our analysis dataset is not perfectly representative of the population.
Children not covered by or linked in ECHILD
First, it is important to note that ECHILD is only meant to cover state health and education services in England; children born outside of English NHS hospitals, or attending school outside of English state schools or non-maintained special schools, will therefore not appear in the data.
Second, not all children had their education and health records successfully linked. These children will not appear in our analysis, as we need health records to observe birth order and date of birth admission, and education records to be able to measure the effect on their educational attainment. Analysis by the ECHILD team suggests the linkage rate is very high for more recent years of data, in excess of 98% (Mc Grath-Lone et al., 2022). One reason linkages might fail is that people may opt out of appearing in the Hospital Episode Statistics (HES) data, though the rates of this for young children are very low.13
Reliance on mother–baby linkage
Crucial for our analysis is identifying which children are third or subsequent children, and therefore affected by the two-child limit. For this, we rely on the mother–baby linkage implemented by Feng et al. (2024), who link children’s birth records with mothers’ delivery records based on a variety of observed variables found in both sets of records, including healthcare provider, date, episode duration, delivery method and gestational age. Their analysis finds over 94% of birth records were linked with mothers. This in turn allows us to identify which children are siblings or maternal half siblings, and therefore we can derive a measure of birth order.
Not all children in the education data are linked to their mothers. For this, we require their National Pupil Database (NPD) records to be linked to the HES, their HES record to contain a birth record, and their birth record to be linked to their mother’s delivery record. As shown in Table A1, the proportion of children in the NPD for whom all three of these requirements are passed is just over 83%. Therefore, some third and subsequent children will either be entirely absent from our analysis, or miscategorised as first or second children.
Table A1. Linkage rates, among children in NPD
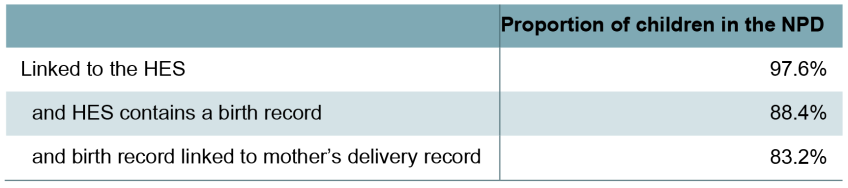
Note: Calculations based on the NPD, academic year 2021–22.
Failure to meet all these requirements to observe birth order is not random – for example, failures to link birth records to mothers’ delivery records are more frequent for those of Black and mixed ethnicities, and for those with older mothers, as Feng et al. (2024) document. And clearly, children for whom we do not observe a birth in an English state hospital will be more likely to be born abroad, for example. The implications for the representativeness of our analysis sample, compared with the NPD overall, are shown in Table A2. On most characteristics, the linkage does not undermine representativeness substantially and – perhaps particularly important for our analysis – the fraction who achieve a GLD is very little changed. However, as expected, there is slight under-representation of ethnic minorities, and those for whom English is not a first language.
Table A2. Characteristics of children in the NPD, compared to linked subsample
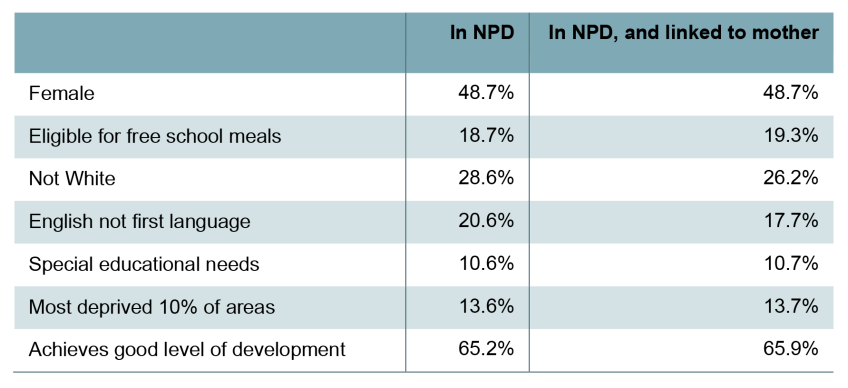
Note: Calculations based on the NPD, academic year 2021–22.
It is also important to note that the link is not perfect – some mothers and babies will be linked erroneously. Feng et al. (2024) estimate that fewer than 1% of linked records were falsely matched, so this is not a major concern for the analysis.
Appendix B. Additional information on methodology
The main results come from a simple linear regression discontinuity design (RDD). The estimation model is
where is our binary outcome variable, achieving the GLD, is our running variable (i.e. the date of birth admission of individual relative to 6 April 2017), is an indicator function taking the value 1 if , and 0 otherwise, and is an error term. For example, corresponds to individual being born on the 6 April, to being born on 7 April, etc.
The causal effect, under the assumptions discussed in the main part of the report, is identified by , which we estimate by ordinary least squares. is essentially an intention-to-treat estimate, calculating the average causal effect of the policy among all those liable to be affected by the two-child limit on the basis of their date of birth, including among those whose family incomes are sufficiently high that they never see their entitlements fall.
Our bandwidth (the range of weeks included on either side of the 6 April cut-off) is the entire academic year. We exclude from the estimation sample those with birth admissions dated within seven days of 6 April – known as a donut RDD – to mitigate against the possibility of strategic birth timing, and potential measurement error of the exact date of birth, as discussed earlier.
We calculate the uncertainty associated with our estimate by calculating robust standard errors, and, from these, calculating 95% confidence intervals.
Except where otherwise stated, all of our robustness checks take the form of estimating the same regression, but changing either the outcome variable , the definition of the running variable , and/or the analysis sample. This is explained in the main part of the report, and in Appendix C.
Appendix C. Additional results tables and robustness checks
Main regression results
Table C1 gives the full regression results underlying the fitted lines in Figure 3. The estimate of the coefficient on which is in the regression equation in Appendix B, is our main estimate of the casual effect of the policy.
Table C1. Results from estimation of main regression
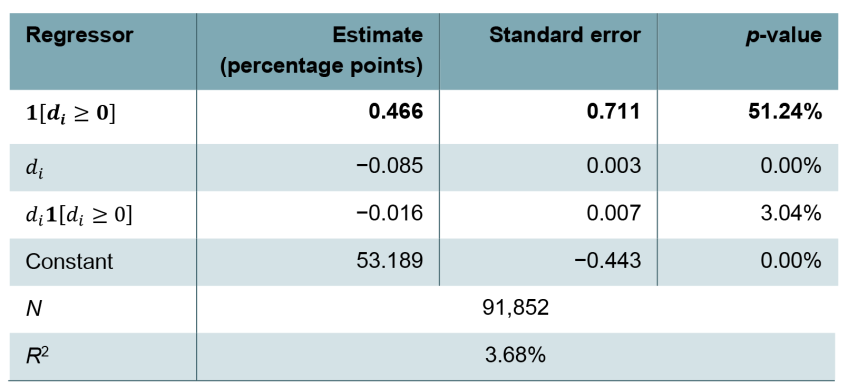
Note: The outcome variable is the binary indicator for achieving GLD. The bandwidth is the whole academic year. Sample includes third and subsequent children in academic year 2021–22, with birth records between September 2016 and August 2017. Birth admissions within seven days of the 6 April cut-off are excluded from the RDD analysis. Estimates and standard errors are given in percentage points (i.e. multiplied by 100).
Source: Authors’ calculations using ECHILD.
Impact on other outcome measures derived from the EYFSP
Here, in Figure C1, we show the plot and regression output for an alternative outcome measure, the number of goals contributing to the GLD which children reach. We also show in Figure C2 the effect on the probability of achieving a low number of goals (fewer than five) or no goals contributing to the GLD, to ensure we are not missing effects at the bottom of the attainment distribution. As discussed in the main part of the report, the conclusions are the same in all cases. In all cases, the discontinuities are small and not significantly different from zero. Figure C3 explicitly shows estimates of discontinuities and confidence intervals.
Figure C1. Effect on average number of goals contributing to the GLD among third and subsequent children, by date of birth relative to 6 April 2017
Note: Lines show results of RDD analysis, as explained in Section 3 and stated more precisely in Appendix B. The regression lines are based on day of birth admission, but the dots show weekly bins of date of birth admission for ease of reading. Date of birth admission is used as a proxy for date of birth. Birth admissions within seven days of the 6 April cut-off are excluded from the regression analysis, but are illustrated in the figure by the hollow dots.
Source: Authors’ calculations using ECHILD.
Figure C2. Effect on proportion of third and subsequent children achieving fewer than five, or zero, goals contributing to the GLD, by day of birth relative to 6 April 2017
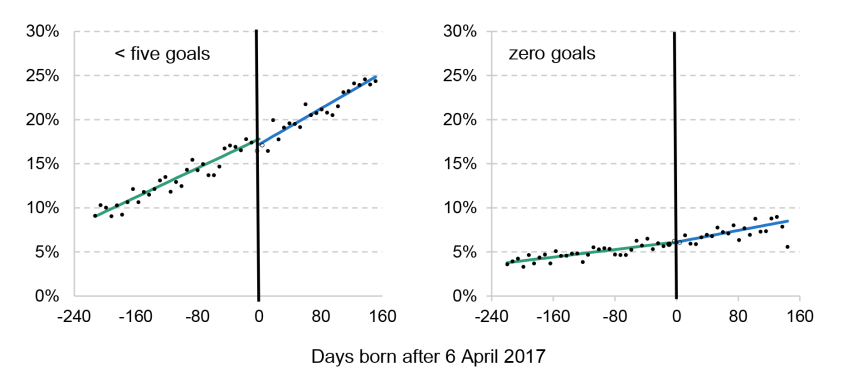
Note: Lines show results of RDD analysis, as explained in Section 3 and stated more precisely in Appendix B. The regression lines are based on day of birth admission, but the dots show weekly bins of date of birth admission for ease of reading. Date of birth admission is used as a proxy for date of birth. Birth admissions within seven days of the 6 April cut-off are excluded from the regression analysis.
Source: Authors’ calculations using ECHILD.
Figure C3. Estimates of effects on different measures derived from EYFSP, with 95% confidence intervals

Note: This figure shows the coefficient on binary indicator for birth after 6 April 2017, from the RDD specified in Appendix B, with different outcome variables. Sample includes children aged 5 in academic year 2021–22, and so born either side of 6 April 2017. The sample excludes children with birth admissions within seven days of the cut-off. Estimates for binary measures are in percentage points (i.e. multiplied by 100).
Source: Authors’ calculations using ECHILD.
Comparison with previous years
Estimates of discontinuities at the 6 April cut-off in previous years
Our core analysis is based on the assumption that, in the absence of any effect of the two-child limit, there would be no discontinuity in the regression line of the GLD pass rate on date of birth at the 6 April cut-off. As discussed above, we are satisfied that this is true, based on examining third and subsequent children born in other years, and first and second children born around April 2017, for whom there is also no visible (or statistically significant) discontinuity. This was shown in Figures 6 and 7.
Estimates of the discontinuities in the regression lines given in those figures, and associated confidence intervals, are shown more explicitly in Figure C4. The coefficient on second children does have a p-value of 2.7%, but given the large number of hypotheses examined in this report, we would expect to find a few small p-values even in the absence of any genuine positive effects. Most importantly, as shown in the exercise in the difference-in-discontinuity subsection, and by comparison of the confidence intervals in Figure C4, there is no evidence that the discontinuity for third children was any larger than that for second or first children.
Figure C4. Estimate of discontinuity in rate of achievement of GLD, around 6 April cut-off, for third and subsequent children in previous years, and for first and second children in 2017
Note: This figure shows the coefficient on binary indicator for birth after 6 April 2017, from the RDD specified in Appendix B. Sample includes children aged 5 in academic year 2021–22, and so born either side of 6 April 2017. The sample excludes children with birth admissions within seven days of the cut-off.
Source: Authors’ calculations using ECHILD.
Difference in discontinuity
Here, we present a more statistically rigorous exercise than simply comparing the chart to earlier years, whereby we test whether the discontinuity estimated in April 2017 for third and subsequent children is equal to any discontinuity for those other groups.
First, we compare to third and subsequent children born in previous years. Formally, we estimate
where is an indicator for individual passing the GLD in time , is the running variable (’s date of birth admission) relative to 6 April in year , and
Our null hypothesis, that the two-child limit had no effect, is then identified by , which means the discontinuity in the GLD pass rate at 6 April 2017 was no different to the discontinuity observed at 6 April in other years. This estimate for is given by the row ‘2017 discontinuity interaction’ in Table C2, and, as is clear, the estimate is small, and not significantly different from zero.
Table C2. Results from difference in discontinuity regression, comparing to earlier years
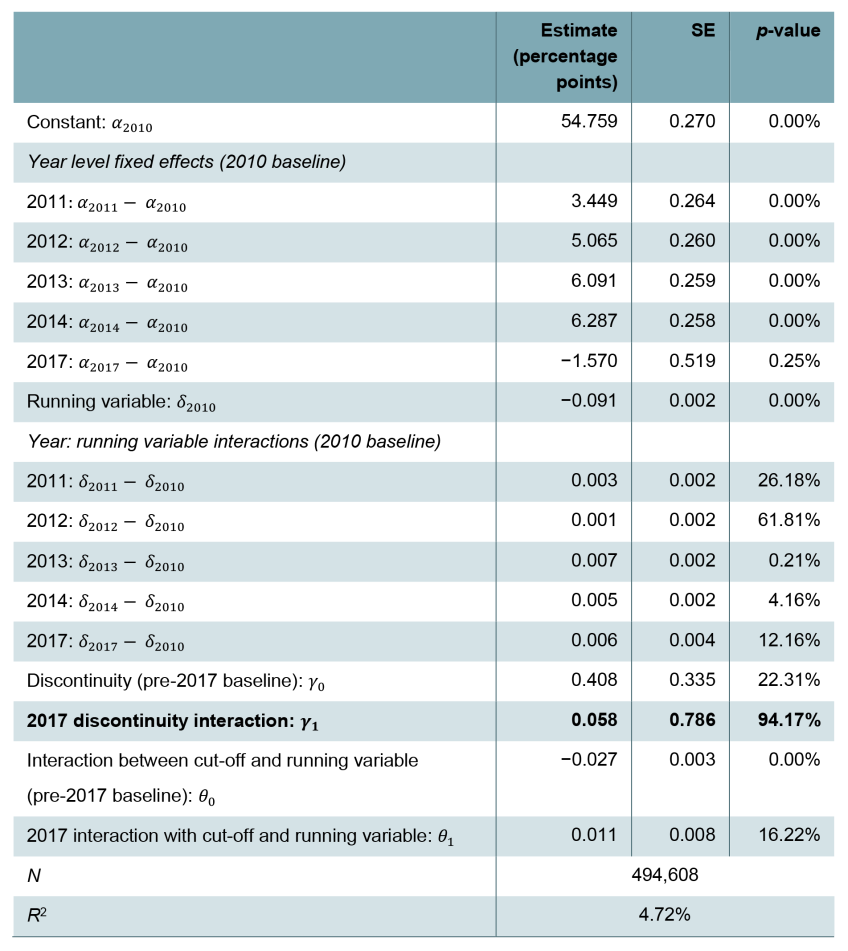
Note: Estimates and standard errors are given in percentage points (i.e. multiplied by 100).
Second, we perform the same exercise, but instead of looking at third and subsequent children in previous years, we compare with first children, and with second children, born around 6 April 2017. That is, we estimate
where indicates birth order group. Our null hypothesis, that the two-child limit had no effect, is again identified by , which this time means the discontinuity in the GLD pass rate at 6 April 2017 for third and subsequent children was no different to the discontinuity observed for first children and second children. The estimate for is given by the row ‘Third+ children discontinuity interaction’ in Table C3, and again the estimate is small, and not significantly different from zero.
Table C3. Results from difference in discontinuity regression, comparing with first and second children

Note: Estimates and standard errors are given in percentage points.
Balance checks
Here, we verify that children are similar with respect to a number of predetermined characteristics either side of the date of birth cut-off. This helps us ensure that our treatment group and control groups are comparable, which could be undermined if there are other background factors that cause differences between the two groups, or because of strategic birth decisions in relation to the policy. Figure C5 shows no evidence of systematic differences either side of the cut-off, and this is confirmed by small and non-statistically significant regression coefficient estimates. The panel on elective caesareans reassures us further that there is no clear evidence of strategic manipulation of birth timing around the cut-off. Estimates of the discontinuity at the cut-off, and the associated confidence intervals, are then shown in Figure C6.
Figure C5. Proportion of third and subsequent children with various predetermined characteristics, by day of birth relative to 6 April 2017

Note: Lines show the results of the RDD, as stated in Appendix B. The regression lines are based on day of birth admission, but the dots show weekly bins of date of birth admission for ease of reading. Date of birth admission is used as a proxy for date of birth. Birth admissions within seven days of the 6 April cut-off are excluded from the regression analysis.
Figure C6. Estimate of discontinuity in predetermined characteristics around the 6 April 2017 cut-off, with 95% confidence intervals
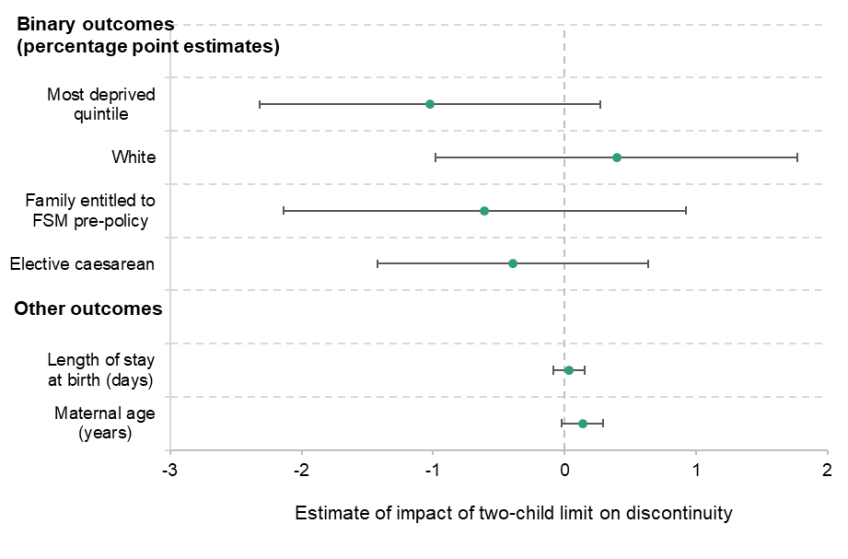
Note: This figure shows the coefficient on binary indicator for birth after 6 April 2017, from the RDD specified in Appendix B, with different outcome variables. Sample includes children aged 5 in academic year 2021–22, and so born either side of 6 April 2017. The sample excludes children with birth admissions within seven days of the cut-off.
Source: Authors’ calculations using ECHILD.
Robustness to alternative assumptions
In Figure C7, we show that our estimate of no causal effect holds regardless of choice of donut size (the number of days adjacent to the April cut-off that we exclude from the analysis), and for smaller bandwidth choices (the number of weeks either side of the cut-off that we include in the analysis, apart from those in the donut).
Figure C7. Estimate of percentage point impact of two-child limit on pass rate for GLD and component areas of learning, with 95% pointwise confidence intervals, varying bandwidth and donut sizes
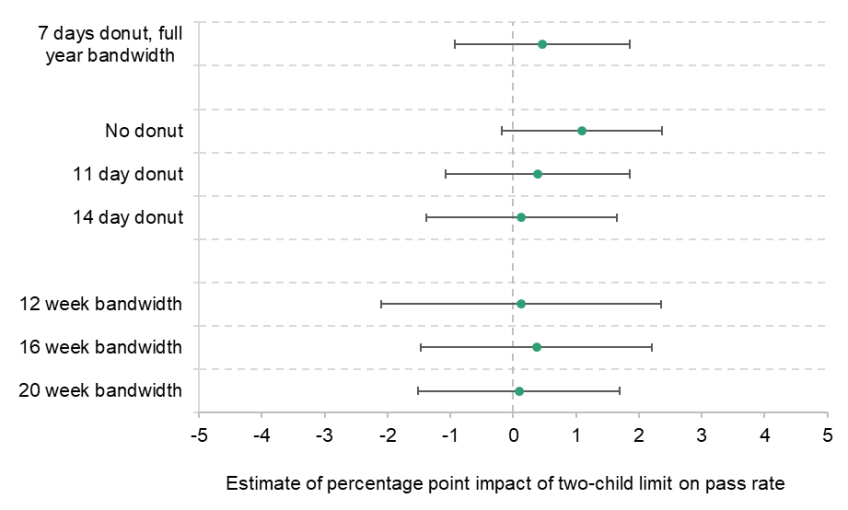
Note: This figure shows the coefficient on binary indicator for birth after 6 April 2017, from the RDD specified in Appendix B, with different outcome variables. Sample includes children aged 5 in academic year 2021–22, and so born either side of 6 April 2017. The sample excludes children with birth admissions within seven days of the cut-off.
Source: Authors’ calculations using ECHILD.
We also confirm that our result is not dependent on the assumption that the relationship between age and the outcome(s) of the study is linear. If we allow for quadratic terms in the regression, then our main estimate is still close to zero (and the coefficients on the squared terms are very close to zero), as shown in Table C4. This is unsurprising given the strong linearity in the average GLD pass rate observed from the scatter plots.
Table C4. Results from estimation of regression: 7 days donut, including polynomial terms
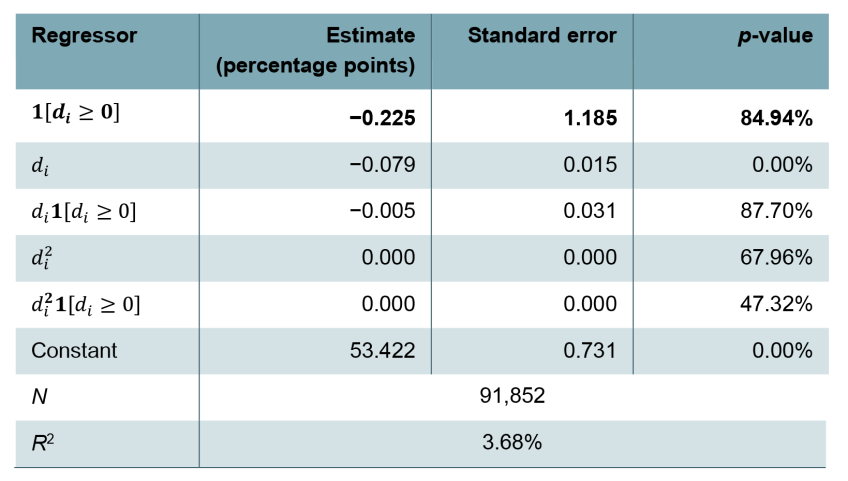
Note: The outcome variable is the binary indicator for achieving the GLD. The sample includes third and subsequent children born around 6 April 2017. The bandwidth is the whole academic year. Estimates and standard errors are given in percentage points (i.e. multiplied by 100).
Nor is our null result changed by a simpler specification in which we restrict the slope of the regression line to be the same either side of the cut-off, that is, estimating
This is shown in Table C5.
Table C5. Results from estimation of regression: 7 days donut, excluding dummy-slope interaction
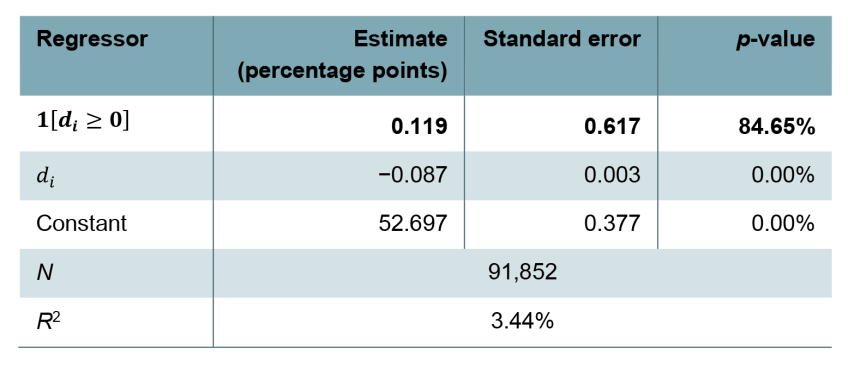
Note: The outcome variable is the binary indicator for achieving the GLD. The sample includes third and subsequent children born around 6 April 2017. The bandwidth is the whole academic year. Estimates and standard errors are given in percentage points (i.e. multiplied by 100).
Birth frequency distribution
In Figure C8, we plot the daily frequency of birth admissions (for third and subsequent children), relative to the 6 April cut-off. There is no evidence of any unusual suspicious mass of births prior to the cut-off, nor of a drop in births after the cut-off. This holds also if we restrict the sample to those in our analysis sample – for whom we also observe education records. Note the pattern of peaks and troughs is largely explained by elective caesareans occurring only on weekdays. As shown in Figure C9, there is also no obvious pattern around the cut-off in other years.
Figure C8. Daily frequency of birth admissions for third and subsequent children, April 2017

Note: Sample includes all birth admissions observed in the HES of third and subsequent children.
Source: Authors’ calculations using ECHILD.
Figure C9. Daily frequency of birth admissions for third and subsequent children, around April in previous years
Note: Sample includes all birth admissions observed in the HES of third and subsequent children.
Source: Authors’ calculations using ECHILD.
References
Blanden, J., Del Bono, E., McNally, S., and Rabe, B., 2016. Universal Pre-school Education: The Case of Public Funding with Private Provision. The Economic Journal, 126, 682-723. ttps://doi.org/10.1111/ecoj.12374
Cabinet Office, 2025. Policy Paper: Tackling Child Poverty: Developing Our Strategy, https://www.gov.uk/government/publications/tackling-child-poverty-developing-our-strategy/tackling-child-poverty-developing-our-strategy-html
Carneiro, P., Cattan, S., Dearden, L., Farquharson, C., Janke, K. and Vira, B., 2025. The short- and medium-term effects of Sure Start on children’s outcomes. IFS Report, https://ifs.org.uk/publications/short-and-medium-term-effects-sure-start-childrens-outcomes
Cattan, S., Fitzsimons, E., Goodman, A., Phimister, A., Ploubidis, G. B. and Wertz, J., 2024. Early childhood inequalities—IFS Deaton Review of Inequalities, Oxford Open Economics, 3, i711–i740, https://doi.org/10.1093/ooec/odad072
Cook, W., 2025. Unconditional cash transfers and maternal labour supply: the case of the two-child limit in the UK. SSRN Working Paper, https://doi.org/10.2139/ssrn.5163890
Cooper, K. and Stewart, K., 2021. Does household income affect children’s outcomes? A systematic review of the evidence. Child Indicators Research, 14, 981–1005, https://doi.org/10.1007/s12187-020-09782-0
Department for Education, 2014. Statutory guidance: early years foundation stage (EYFS) statutory framework, https://www.gov.uk/government/publications/early-years-foundation-stage-framework--2
Doyle, O., 2020. The first 2,000 days and child skills. Journal of Political Economy, 28, 2067–122, https://doi-org.libproxy.ucl.ac.uk/10.1086/705707
Feng, Q., Ireland, G., Gilbert, R. and Harron, K., 2024. Data Resource Profile: a national linked mother–baby cohort of health, education and social care data in England (ECHILD-MB). International Journal of Epidemiology, 53(3), dyae065, https://doi.org/10.1093/ije/dyae065
Henry, A. and Wernham, T., 2024. Child poverty: trends and policy options. IFS Report R335, https://ifs.org.uk/publications/child-poverty-trends-and-policy-options
House of Commons Work and Pensions Committee, 2019. Two-child limit, Report HC 1540, https://publications.parliament.uk/pa/cm201719/cmselect/cmworpen/1540/1540.pdf
HM Treasury, 2015. Policy paper: Summer Budget 2015, https://www.gov.uk/government/publications/summer-budget-2015/summer-budget-2015
Motiani, S., Lucas, P. J. and Bazalgette, L., 2024. Lost opportunities: parents’ perspectives on how the two‑child limit policy is affecting their children’s early learning and development. Nesta Report, https://www.nesta.org.uk/report/lost-opportunities-parents-perspectives-on-how-the-two-child-limit-policy-is-affecting-their-childrens-early-learning-and-development/
Mc Grath-Lone, L. et al., 2022. Data resource profile: the Education and Child Health Insights from Linked Data (ECHILD) database. International Journal of Epidemiology, 51, 17–17f, https://doi.org/10.1093/ije/dyab149
Noble, K. et al., 2025. The effect of a monthly unconditional cash transfer on children’s development at four years of age: a randomized controlled trial in the U.S. National Bureau of Economic Research Working Paper 33844, https://doi.org/10.3386/w33844
Page, M. E., 2024. New advances on an old question: does money matter for children’s outcomes? Journal of Economic Literature, 62, 891–947, https://doi.org/10.1257/jel.20231553
Reader, M., 2023. The infant health effects of starting universal child benefits in pregnancy: evidence from England and Wales. Journal of Health Economics, 89, 102751, https://doi.org/10.1016/j.jhealeco.2023.102751
Reader, M., Portes, J. and Patrick, R., 2025. Does cutting child benefits reduce fertility in larger families? Evidence from the UK’s two-child limit. Population Research and Policy Review, 44, 21, https://doi.org/10.1007/s11113-025-09935-5
Robling, M., et al., 2021. The Family Nurse Partnership to reduce maltreatment and improve child health and development in young children: the BB:2–6 routine data-linkage follow-up to earlier RCT. NIHR Journals Library, https://doi.org/10.3310/phr09020
Smith, A., Staunton, R., Sahasranaman, A. and Worth, J., 2023. Impact Evaluation of Nuffield Early Language Intervention (NELI) Wave Two. Nuffield Foundation, https://educationendowmentfoundation.org.uk/projects-and-evaluation/projects/nuffield-early-language-intervention-scale-up-impact-evaluation
Data
Office for National Statistics, Social and Vital Statistics Division, Department for Work and Pensions, National Centre for Social Research. (2023). Family Resources Survey, 2016–2017. [data collection]. UK Data Service. SN: 8336, http://doi.org/10.5255/UKDA-SN-8336-1
University College London (2024). ONS SRS Metadata Catalogue, dataset, Education and Child Health Insights from Linked Data (ECHILD) - England, https://doi.org/10.57906/j1gr-gm30
Acknowledgements
The authors gratefully acknowledge the support of Nesta, and the Economic and Social Research Council Centre for the Microeconomic Analysis of Public Policy (ES/T014334/1), as well attendees at seminars and conferences, and Nesta’s parent advisors group, convened by the Child Poverty Action Group.
This project used data from Education and Child Health Insights from Linked Data (ECHILD). We thank all the children, young people, parents and carers who contributed to the ECHILD project. We gratefully acknowledge all children and families whose de-identified data are used in this research. The ECHILD database uses data from the Department for Education (DfE), NHS England (NHSE) and the Office for National Statistics (ONS). The DfE, NHSE and ONS do not accept responsibility for any inferences or conclusions derived by the authors. This work uses data provided by patients and collected by the National Health Service as part of their care and support. The ECHILD project is run in collaboration with the London School of Hygiene & Tropical Medicine and the Institute for Fiscal Studies. We are also grateful to the ONS for providing the trusted research environment for the ECHILD database.
About Nesta
We are Nesta. The UK’s innovation agency for social good. We design, test and scale solutions to society’s biggest problems. Our three missions are to give every child a fair start, help people live healthy lives and create a sustainable future where the economy works for both people and the planet.
For over 20 years, we have worked to support, encourage and inspire innovation.
We work in three roles: as an innovation partner working with frontline organisations to design and test new solutions, as a venture builder supporting new and early-stage businesses and as a system shaper creating the conditions for innovation. Harnessing the rigour of science and the creativity of design, we work relentlessly to change millions of lives for the better.
Find out more at nesta.org.uk.
Endnotes
Authors

Sarah Cattan
Sarah is a Research Fellow at the Institute for Fiscal Studies.

Tom Waters
Tom is an Associate Director at the IFS and Head of the Income, Work and Welfare sector.

Tom Wernham
Tom's main research areas are living standards and poverty, the benefits system, and its interactions with the labour market.
More from IFS
Understand this issue


Policy analysis


Academic research


