Downloads
Download the report as a PDF
PDF | 657.81 KB
Executive summary
Public services play an important role in supporting households’ well-being and their residents’ life chances. This is especially true for low- and middle-income households, for whom the in-kind services received represent a larger share of overall consumption, and for whom equivalent private services may be prohibitively expensive.
Most public service spending in Wales – including the vast majority of what is spent on health, education, social care, transport, environmental and rural affairs and housing – is devolved to the Welsh Government and Welsh local authorities. Spending on services that are largely devolved amounted to £30 billion in 2024−25, the most recent year for which data are available.
But how is this spending allocated across different services? How have these allocations changed over time? What trade-offs between services might be required in future? And how do a range of headline indicators of public service outcomes vary between Wales and the rest of the UK?
Key findings
Trends in public service spending
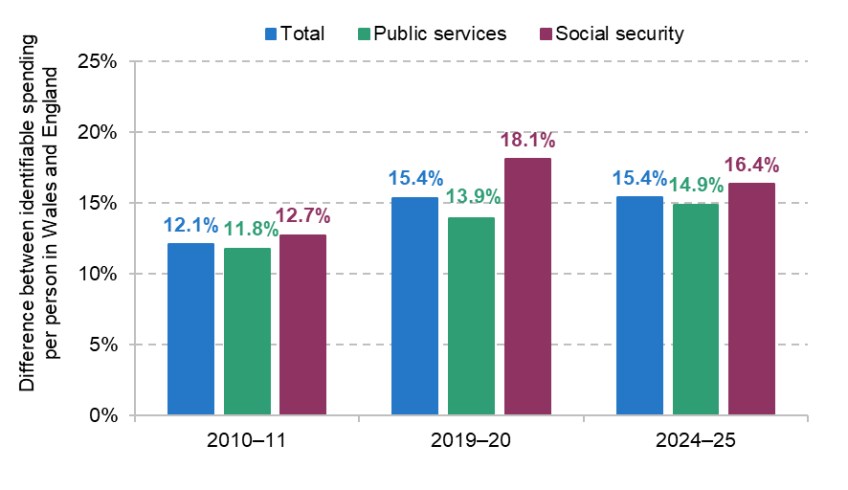
- Identifiable public spending per person in Wales in 2024–25 was 15.4% higher than in England. The gap is smaller for public service spending (14.9%) than for benefit spending (16.4%). Whereas the gap for benefit spending has shrunk since 2019–20 (when it was 18.1%), the gap for public service spending has grown slightly over the last few years (it was 13.9% in 2019–20).
- The biggest differences in public service spending are in generally smaller areas of spending. For example, spending per person on recreation, culture and religion was 67% higher in Wales than in England in 2024–25, and spending per person on housing and community amenities was 63% higher.
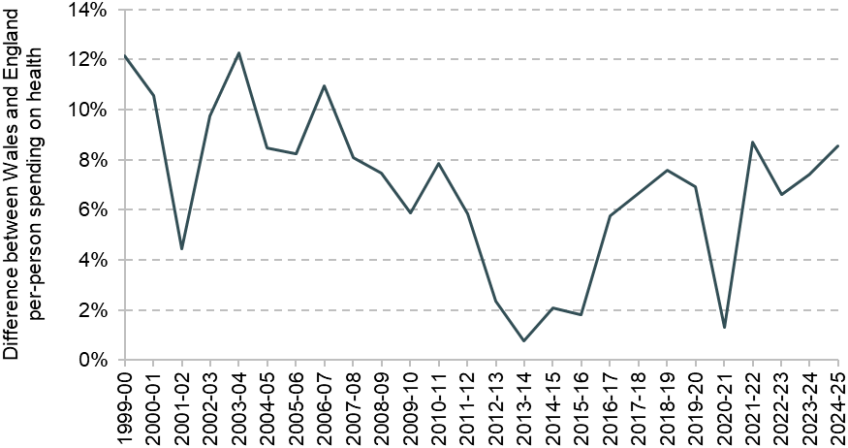
- The difference between Wales and England for spending per person on health, the largest area of public spending, is 9% – up from 7% in 2019–20 and 2% in 2015–16. The 2010s saw spending first fall relative to England as the Welsh Government offered less protection from austerity to the NHS (and more protection to other services) than in England. From 2015–16 onwards, the Welsh Government increased health spending by more per person than the UK government did in England, restoring Wales’s relatively higher levels of health spending by the early 2020s.
- School spending per pupil in Wales is expected to be £8,700 in 2025–26, slightly above the expected level of £8,600 for England. Both England and Wales saw a 14% real-terms rise in school spending per pupil between 2019–20 and 2025–26. In Wales, this more than reversed cuts of 5% during the 2010s and leaves spending per pupil about 10% higher in real terms than in 2009–10.
Performance of Welsh health and education services
- Waiting times in the Welsh NHS are higher than pre-pandemic and comparable measures are higher than in either England or Scotland. The median wait for elective treatment was 19 weeks in December 2025, compared to 10.7 weeks in December 2019. The median wait in England in December 2025 was 13.4 weeks. There has recently been some improvement in elective waiting times in Wales, but many recovery targets have already been missed. A&E waiting times have, if anything, worsened over the last two years.
- The Welsh NHS has more funding and staff than pre-pandemic, but hospital activity has not increased proportionally. This raises concerns about a fall in NHS labour productivity in Wales. Similar patterns are also seen in English hospitals. Concerningly, large increases in outpatient appointments in Wales have not obviously translated into improved elective performance relative to England and Scotland.
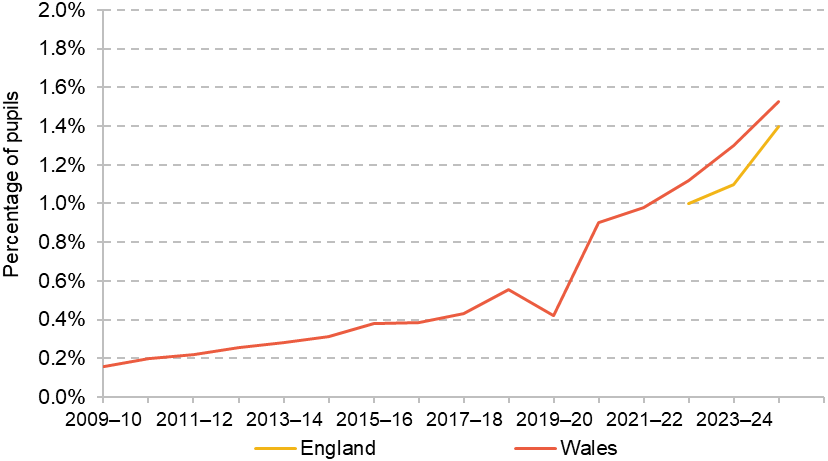
- Educational attainment on PISA tests is low relative to England, with some evidence that gaps have increased in recent years. The recent introduction of the new Curriculum for Wales is unlikely to do much to improve this gap. High rates of pupil absence likely contribute to lower attainment, with Welsh pupils missing around 9% of school sessions on average in 2024–25 – compared to around 7% in England, and 6% in Wales itself prior to the COVID-19 pandemic. There has also been a very significant rise in the share of pupils in elective home education in Wales (1.5% in 2024–25 compared to 0.6% in 2018–19 and 0.2% in 2009–10), which presents challenges to councils in ensuring educational quality and safeguarding.
- Educational participation has been declining. The share of 16- and 17-year-olds in full-time education in Wales has fallen from 78% in 2014 to 64% in 2024, and the share of 18-year-olds who enter an undergraduate degree is now only 29%, below 2016 levels. The reasons behind these trends are not well understood and should be investigated by Welsh policymakers.
- Inequalities in health and educational performance are similar to those in England. Areas with lower average incomes tend to have lower life expectancy in Wales, very similar to the pattern we see in England. Areas with similar average incomes in Wales and England have similar life expectancies, and higher than those in similar Scottish areas. On education, Wales sees a similar socio-economic gradient in PISA scores as England, suggesting similar levels of educational inequality. However, gaps in GCSE attainment show greater educational inequality in Wales.
Outlook for public service spending
- A tough outlook for public service spending will make improving public services challenging for the next Welsh Government – starting in the immediate post-election period. The current Welsh Government plans to draw down reserves in full this year in order to top-up pre-election budgets. Given this, the Budget currently going through the Senedd for next year, 2026–27, implies that health and social care spending would fall by 2.2% in real terms year-on-year. This is simply inconsistent with planned pay increases or maintaining, let alone improving, service quality. Top-ups to funding by the UK government in the 2026 Spring Statement will allow for in-year top-ups to health and social care spending in 2026–27. Without this additional UK government funding, the next Welsh Government would highly likely have had to make in-year cuts to other areas of spending in a post-election emergency budget.
- The current Welsh Government has not set out plans beyond next year, but scenario analysis can help illustrate the trade-offs the next government will face. In 2027–28 and 2028–29, matching England’s planned increases in health and social care resource spending and protecting housing and local government spending from cuts would, under current funding forecasts, require cuts averaging 4.9% a year to spending on other services.
- Changes to UK and Welsh government policy could see overall funding evolve differently to current official plans and forecasts – affecting the trade-offs between services. An additional £500 million in resource funding in 2028–29 – equivalent to a 2% boost, or the amount raised from a 1.25 percentage point increase in all Welsh rates of income tax – would allow for small increases in spending on other services even if increases in health and social care spending matched those planned for England. Conversely, a £500 million reduction in resource funding in 2028–29 – a 2% cut, or the cost of a 1.25 percentage point reduction all Welsh rates of income tax – would mean cuts of 11% to other spending if the next government wanted to match English increases in health and social care spending, and protect housing and local government spending from cuts.
1. How much is spent on public services in Wales?
The Welsh Senedd has responsibility for large parts of public spending, including most services directly used by households. This includes the NHS, social care services, education, transport and housing. Responsibility for some areas – such as defence, foreign affairs, immigration services, policing and justice, and social security benefits – is not devolved and remains with the UK parliament in Westminster. A fuller list can be found in our online election explainer.1
Total ‘identifiable’ public expenditure in Wales – that is, spending flowing directly to Welsh beneficiaries, including both devolved and non-devolved areas – amounted to £48.3 billion in 2024–25, according to the UK government’s Country and Regional Analysis (CRA) publication (HM Treasury, 2025a). This is equivalent to £15,601 per person in today’s prices – a figure that is 12.2% higher than the UK average and 15.4% higher than spending per person in England.2 Note that this is not the same as Welsh Government funding, which does not include spending in Wales by the UK government itself. Recent work by IFS researchers has showed that Welsh Government funding per person is around 25% higher than what is provided to UK government departments for spending on comparable functions in England (Brogaard and Phillips, 2026a). This bigger difference reflects the fact that the Wales–England gap in spending on public services that are devolved to the Welsh Government is greater than the gap in spending on both non-devolved areas (such as social security benefits, policing and justice, and rail infrastructure) and local government expenditure funded via council tax.
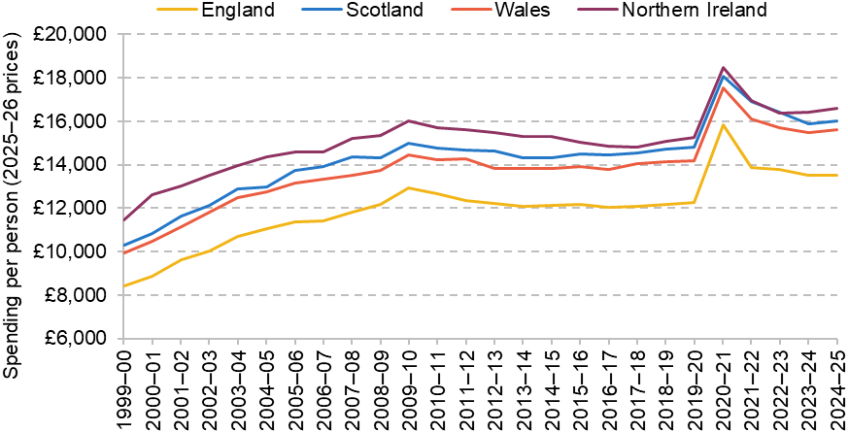
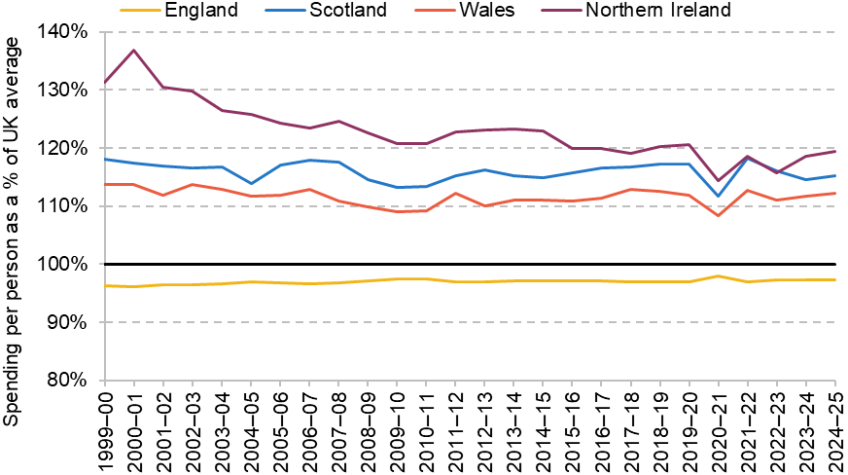
Figure 1 shows how total identifiable spending per person in each of the four nations of the UK has evolved since 1999−2000, at the outset of devolution. Figure 2 shows how identifiable spending per person as a share of the UK average has evolved for each of the four nations over the same period.
Figure 1. Total identifiable expenditure per person (2025–26 prices)
Source: Authors’ calculations using HM Treasury (2024, 2025a) and Office for National Statistics (2024a, 2025a).
Figure 2. Total identifiable expenditure per person as a share of UK average
Source: Authors’ calculations using HM Treasury (2024, 2025a) and Office for National Statistics (2024a, 2025a).
Figure 1 shows that while spending per person has fallen back from its COVID-19 pandemic peak, identifiable government spending per person in Wales was 10% higher in real terms in 2024–25 than in both 2019–20 and 2010–11. This is a similar rate of increase to England since 2019–20 but a bigger increase than in England since 2010–11 (where the growth has been just under 7% per person).
Figure 2 shows that identifiable spending per person has long been higher in Wales than the UK as a whole. The gap narrowed during the 2000s (from 14% above the UK average in 1999–2000 to 9% above the UK average in 2010–11) due to both smaller increases in benefit spending and a former episode of the so-called ‘Barnett squeeze’ delivering smaller percentage increases in funding for public services compared with England. The gap then widened in the 2010s (to 12% above the UK average in 2019–20) as the Barnett squeeze went into reverse. The gap fell during the COVID-19 pandemic but then rebounded (and remained 12% above the UK average as of 2024–25).
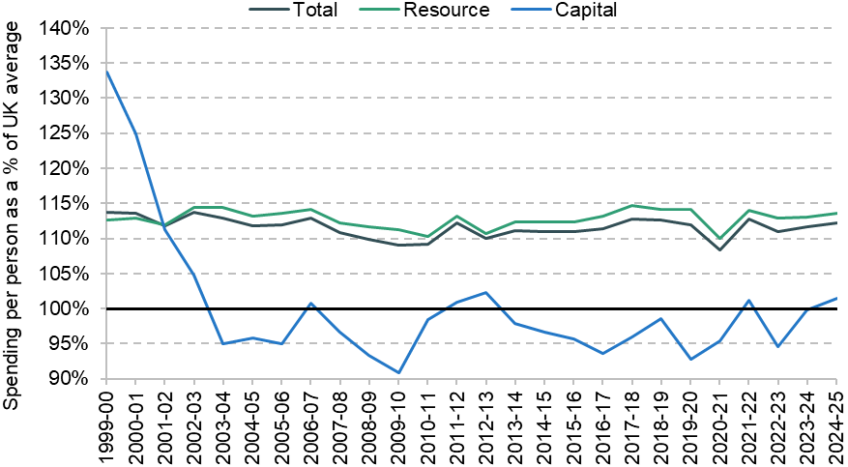
Figure 3 shows that for over 20 years the gap has been driven by higher identifiable resource spending (that is, spending on the day-to-day operation of services). Resource spending per person was 14% higher than the UK average as of 2024–25. In contrast, capital spending – that is, investment in buildings, equipment, infrastructure and research – was just 2% higher than the UK average in the same year. And, in general, capital spending has been slightly lower than the UK average over the last 20 years: averaging 3% lower between 2005–06 and 2024–25, for instance. This stands in stark contrast to Scotland where capital spending is much higher than the UK average (Brogaard and Phillips, 2026b).
Figure 3. Capital and resource identifiable expenditure per person in Wales as a share of the UK average
Source: Authors’ calculations using HM Treasury (2024, 2025a) and Office for National Statistics (2024a, 2025a).
The Welsh Government and Welsh councils are responsible for approximately 61% of all identifiable expenditure in Wales: £30 billion out of £50 billion as of 2024–25. This includes large majorities of both capital expenditure (£4.0 billion out of £4.9 billion, or 79%) and resource expenditure on public services (£25 billion out of £28 billion, or 90%). However, virtually all spending on social security benefits (£17 billion) is undertaken by UK government departments (Department for Work and Pensions and His Majesty’s Revenue and Customs).
2. How has spending on different services fared?
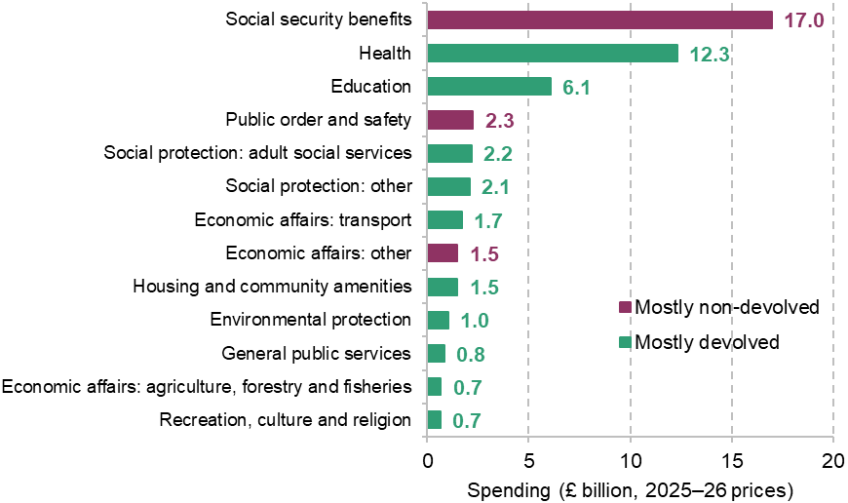
Figure 4 provides a breakdown of how the £50 billion of identifiable expenditure in Wales was allocated between different services as of 2024–25. The largest component – spending on social security benefits – is almost entirely outside the purview of the Welsh Government: decisions on the vast majority of benefits are made by the UK government. Similarly, most spending on ‘public order and safety’ (e.g. on police and the justice system) and other ‘economic affairs’ (e.g. on employment policies and science and technology) is non-devolved.
Figure 4. Breakdown of identifiable expenditure in Wales in 2024–25, by service area (2025–26 prices)
Note: Benefits and tax credits is defined as identifiable benefit expenditure (from Department for Work and Pensions), plus spending by HMRC on child benefit, personal tax credit, guardian’s allowance, universal credit, tax-free childcare, Saving Gateway and child trust funds. Because it is not possible to precisely identify devolved and non-devolved expenditure, some items within ‘mostly devolved’ will be reserved matters, and some items within ‘mostly non-devolved’ will in fact be devolved.
Source: HM Treasury (2025a) and Department for Work and Pensions (2025).
Identifiable expenditure on health and education are the largest components under Welsh Government control, with spending of £12.3 and £6.1 billion, respectively, in 2024–25.
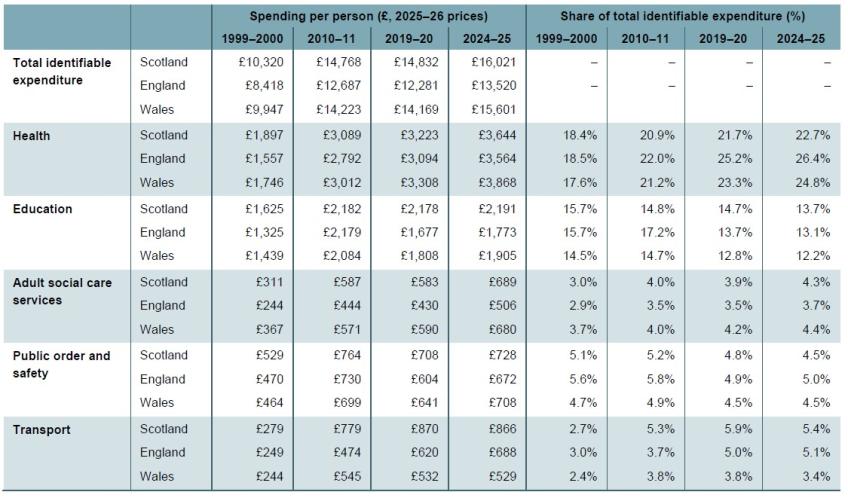
Table 1 provides a detailed breakdown of how spending on a subset of service areas has evolved in Wales and England over time. In all bar one of these categories (transport), spending per head is higher in Wales than in England, but the gaps differ, as do the trends.
Table 1. Spending on different service areas in Wales and England (2025–26 prices)
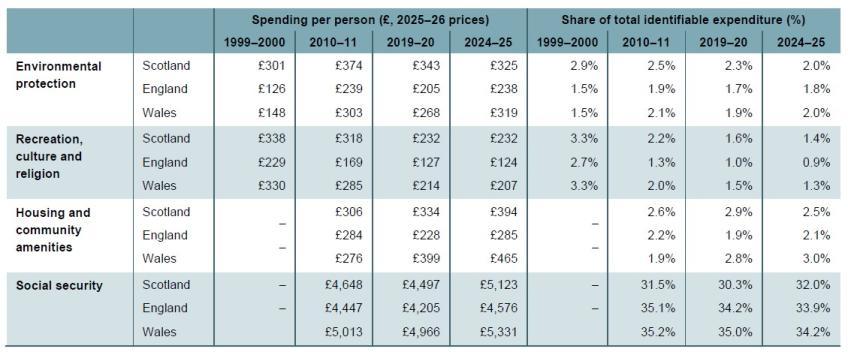
Note: ‘Adult social services’ is defined here as total spending on personal social services, less the family and children and unemployment components. This falls within the overall ‘social protection’ function. ‘Social security’ is defined as identifiable benefit expenditure (from Department for Work and Pensions), plus spending by HMRC on child benefit, personal tax credit, guardian’s allowance, universal credit, tax-free childcare, Saving Gateway and child trust funds, plus spending by the Welsh Government on social security, social exclusion, social protection and community justice. This measure of social security spending is not available for 1999−2000. ‘Housing and community amenities ’ is defined as identifiable spending on housing and community amenities, less spending on water supply. This measure of spending is also unavailable for 1999−2000. Not all components of spending are included here, so percentages do not add up to 100%.
Source: Authors’ calculations using HM Treasury (2025a), Office for National Statistics (2024a, 2025a) and Department for Work and Pensions (2025).
The biggest differences are not for the biggest devolved services (health and education), but instead for some of the smaller areas of spending. For instance: spending per person on recreation, culture and religion was 67% higher (£207 versus £124) than in England in 2024–25; spending person on housing and community amenities was 63% higher (£465 versus £285); and spending per person on adult social care services 36% higher (£680 versus £506). In contrast, the differences in spending for both health (9%) and education (7%) are much lower. And spending per person on transport was 23% lower (£529 versus £688) than in England.
Trends over time also differ between Wales and England, reflecting different prioritisation by the Welsh and UK governments. During the 2010s, for instance, cuts to education spending were less significant in Wales – reflecting, as discussed below, more generous support for higher education students. Spending per person on adult social care services also increased in real terms during the 2010s in Wales (+3%) while falling in England (-3%). More recently, trends have been more similar in Wales and England. The one exception is transport, where spending has fallen in Wales but increased in England. This reflects not only Welsh Government policy but UK government policy: rail infrastructure spending has increased by more in England than in Wales.
Table 1 also shows that, over the past 25 years, spending per person in Wales has generally been lower than in Scotland. In 2024–25, spending per person in Wales was 2.7% lower overall. The way money is allocated across services is broadly similar in both nations, but there are some differences. In Wales, education makes up 12.2% of total spending (£1,905 per person), compared with 13.7% in Scotland (£2,191 per person). On the other hand, health accounts for a larger share of spending in Wales – 24.8% (£3,868 per person) – compared to 22.7% (£3,644 per person) in Scotland.
The gap between Wales and Scotland has narrowed in recent years. In 2019–20, spending per person in Wales was 4.7% lower than in Scotland. This is because spending has grown faster in Wales (10.1% in real terms) than in Scotland (8.0%) over this period. A similar pattern can be seen across most services, including health (up 16.9% in Wales compared with 13.1% in Scotland) and education (up 5.4% in Wales compared to 0.6% in Scotland).
Figure 5 shows how overall identifiable spending, spending on public services and spending on social security benefits in Wales compares with England for three years: 2010–11, 2019–20 and 2024–25. The blue bars show that overall identifiable spending increased relative to England during the 2010s (from 12.1% higher than in England to 15.4% higher), and has since remained fairly stable.
Figure 5. Relative spending gap between Wales and England, selected years
Note: ‘Public services’ is total spending excluding spending on both reserved and devolved social security.
Source: Authors’ calculations using HM Treasury (2024, 2025a), Office for National Statistics (2024a) and Department for Work and Pensions (2025).
The green bars show that public service spending has increased throughout this period relative to England. The main reason for this is set out in our previous election briefing note on Welsh Government funding (Brogaard and Phillips, 2026a): the operation of the Barnett formula, which determines changes in UK government funding for the Welsh Government. During the 2010s, spending was being reduced UK-wide and Wales’s population was growing less quickly than that of England. Thus, Wales saw smaller cuts in funding for public services than England – leading spending to grow relative to England. While spending began to increase from 2019–20 onwards, and the gap in population growth rates narrowed, which we would have expected to start to reverse this divergence (through a process known as the Barnett squeeze), the gap in funding per person continued to grow slightly during the early 2020s. The Barnett squeeze is set to bite in the coming Senedd term though, likely reducing the gap in spending on public services between Wales and England over the next few years.
The picture for social security benefits is somewhat different. An older, less healthy and poorer population means spending per person has long been higher in Wales than England. This gap grew during the 2010s (from 12.7% in 2010–11, to 18.1% in 2019–20), but has subsequently narrowed somewhat (to 16.4%) in 2024–25. The reasons for these trends are unclear, but may reflect a shift in the balance on benefit spending over time: away from means-tested benefits for working-age adults and families with children to benefits for pensioners and disability-related benefits. Wales’s older and less healthy population would have been less affected by cut-backs to means-tested benefits for working-age adults and families with children, and more exposed to increases in benefits for pensioners and disabled adults.
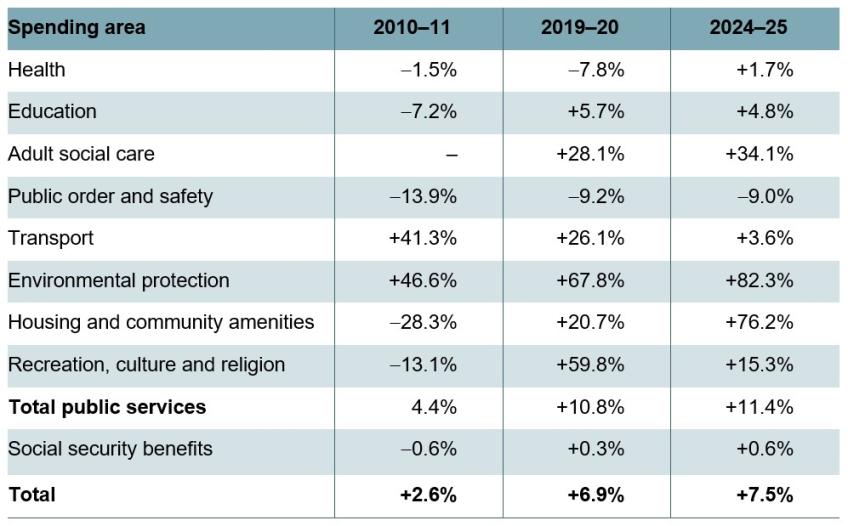
Table 2 compares spending per person in Wales in three years (2010–11, 2019–20 and 2024–25) to spending per person in the North East of England – the most comparable region socio-economically to Wales. The greater similarity in socio-economic characteristics allows for more meaningful spending comparisons than for England as a whole (where much of the South has lower poverty and lower levels of ill health than Wales).
Table 2. Relative spending gap, Wales and the North East of England
Note: A positive number implies higher spending in Wales relative to the North East.
Source: Authors’ calculations using HM Treasury (2025a), Office for National Statistics (2024a, 2025a) and Department for Work and Pensions (2025).
Overall, identifiable public spending is higher in Wales than the North East of England: 7.5% as of 2024–25, which is a similar gap to 2019–20 (6.9%) but a larger gap than in 2010–11 (+2.6%). As of 2024–25, spending is higher in Wales than the North East for all public services bar public order and safety. The biggest differences are for environmental protection (+82%) and housing and community amenities (+76%).
After growing less quickly in the 2010s, spending per person on health has grown substantially more quickly in Wales than in the North East of England – with spending per person in Wales moving from almost 8% lower than in the North East of England in 2019–20 to almost 2% higher in 2024–25. After growing more quickly during the 2010s, education spending per person has grown slightly less in Wales than in the North East of England since 2019–20 (moving from just under 6% higher to just under 5% higher).
Trends in health and education spending
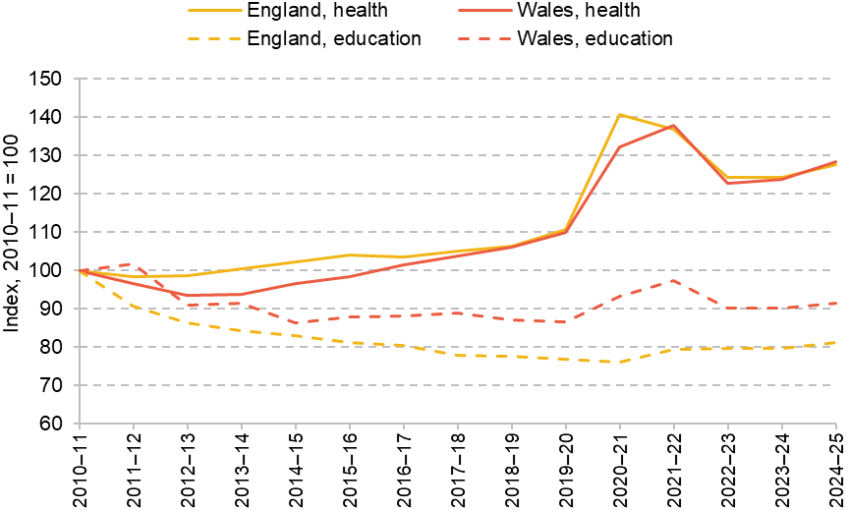
Figure 6 looks in more detail at trends in health and education spending in both Wales and England – with real-terms spending normalised to 100 in each country and for each service in 2010–11 for ease of comparison.
Figure 6. Real-terms spending per person on selected services (2010–11 = 100)
Source: Authors’ calculations using HM Treasury (2025a), Office for National Statistics (2024a, 2025a) and Department for Work and Pensions (2025).
The figure shows that reported health spending has increased at about the same rate in Wales as in England over the last 15 years: around 28% in real terms per person. The gap opened up during the early 2010s when the Welsh Government provided relatively less protection to health spending (and more to other services such as local government) than the UK government did. For instance, health spending in Wales was 1% lower in real terms in 2015–16 than it was in 2010–11, while in England it was 8% higher. Since 2015–16, health spending has grown somewhat more quickly in Wales (31% in real terms per person) than in England (23% in real terms per person), closing the gap in spending increases that opened up in the early 2010s.
The population of Wales has grown less quickly over the last 15 years than the English population. On a per-person basis, therefore, health spending has grown at the same rate in real terms as England since 2020–11 (28%). This reflects different trends over time though: Welsh health spending fell in the early 2010s but has subsequently grown at a faster rate than England.
Figure 7 shows the resulting differences in health spending between Wales and England since 2010–11. It shows that whereas between 2010–11 and the mid-2010s spending in Wales converged closer to English levels (from 8% higher to only 2%), it has subsequently pulled ahead again (back to 8% higher in 2024–25).
Figure 7. Additional spending per person on health in Wales relative to England
Note: A positive figure indicates that spending per person was higher in Wales than in England.
Source: Authors’ calculations using HM Treasury (2025a) and Office for National Statistics (2024a, 2025a).
Turning to education, the picture is different: education spending was cut by less in Wales during the 2010s, largely because the Welsh Government has cut spending on higher and further education by less than England.3 As a result, while total education spending in England was 8% lower in 2024–25 than in 2010–11, it was only 5% lower in Wales. Given population growth, the differences are starker: education spending per person in 2024–25 was 19% lower in England, compared to 9% lower in Wales.
School spending per pupil
The picture for spending on school-aged education differs to the picture for overall education spending.
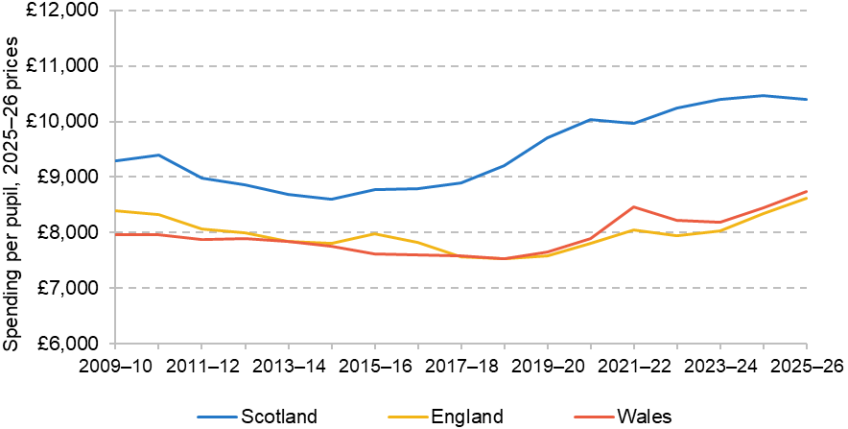
In Figure 8, we show the level of school spending per pupil across Wales, England and Scotland. To ensure full comparability across the three nations, these figures also include early years expenditure on pupils aged 3–4 and school sixth form funding for pupils aged 16–18. All figures are shown as spending per full-time equivalent pupil. Figures also include temporary, additional funding during and immediately after the COVID-19 pandemic to support schools and pupils with education recovery. All figures are shown in 2025–26 prices.
Figure 8. School spending per pupil aged 3–18 across Scotland, England and Wales, 2009–10 to 2025–26
Source: Total school spending for Scotland is based on net revenue spending on early learning and childcare, schools and all education-related specific grants from central government. These figures were kindly supplied by the Scottish Government on a consistent basis from the underlying data for the Scottish ‘Local government finance statistics’ for 2009–10 to 2019–20. Figures for net revenue expenditure on schools and education specific grants for later years were taken from ‘Scottish local government finance statistics’ for 2020–21, 2021–22, 2022–23, 2023–24 and 2024–25. Net revenue expenditure on schools in 2025–26 is taken from https://www.gov.scot/publications/local-government-2024-25-provisional-outturn-and-2025-26-budget-estimates/. Ring-fenced specific grants for 2025–26 are based on https://www.gov.scot/publications/local-government-finance-circular-1-2025-settlement-for-2025-to-2026/. HM Treasury, GDP deflators, December 2025 update. Full-time-equivalent pupil numbers in Scotland calculated as the sum of pupils in state-funded schools and early education centres (https://www.gov.scot/collections/school-education-statistics/). Spending per pupil in England is taken from Farquharson et al. (2026). For consistency with figures for Scotland, we include early years spending, grants to cover higher employer contributions to teachers’ pensions in England and COVID-related grants for 2020, 2021 and 2022. COVID-related spending for England is taken from https://www.gov.uk/government/publications/department-for-education-consolidated-annual-report-and-accounts-2021-to-2022 and school funding statistics for 2022–23. Spending for Wales is taken from education out-turn statistics (https://statswales.gov.wales/Catalogue/Local-Government/Finance/Revenue/Education) up to 2023–24 and from budgeted expenditure (https://www.gov.wales/local-authority-budgeted-expenditure-schools-april-2025-march-2026-html). For 2024–24, we also add grants of £60.7 million for teacher pensions (https://www.gov.wales/sites/default/files/publications/2024-10/1st-supplementary-budget-2024-2025-note.pdf) and £18.1 million for teacher pay (https://business.senedd.wales/documents/s156757/Paper%201%20-%20Welsh%20Government.pdf). Pupil numbers for Wales are taken from Welsh schools’ census results, 2025 and earlier years.
In 2025–26, spending per pupil is expected to be £8,700 in Wales, only very slightly above the expected level of £8,600 for England. However, spending per pupil is significantly higher in Scotland, where spending per pupil is expected to be about £10,400 in 2025–26, about 19% higher than in Wales.
Over the last 15 years, school spending per pupil has followed very similar trends across Wales and England. Between 2009 and 2010, spending per pupil fell in both nations, with a 5% real-terms fall in Wales between 2009–10 and 2019–20 and a larger 10% real-terms fall in England over the same period. After 2019–20, spending per pupil rose again in both nations, with a 14% real-terms rise across both nations between 2019–20 and 2025–26. This leaves school spending per pupil in Wales about 10% higher than in 2009–10. In contrast in England, the increase since 2009–10 is just 3%, while in Scotland it is 12%.
School spending per pupil in Wales is expected to be £8,700 in 2025–26, only very slightly above the expected level of £8,600 for England. Both England and Wales saw a 14% real-terms rise in school spending per pupil between 2019–20 and 2025–26. In Wales, this more than reversed cuts of 5% during the 2010s and leaves spending per pupil about 10% higher than in 2009–10 in real terms.
These differences in school spending per pupil are then translated into differences in pupil:teacher ratios across the three nations (Department for Education, 2025a). As of 2024–25, the average pupil:teacher ratio was highest in Wales (18.9), a little bit lower in England (18.0) and significantly lower in Scotland (13.3). Whilst not a direct measure, this will likely equate into higher class sizes in Wales and England than in Scotland.
3. How have public services performed?
The previous section showed that in virtually all areas of government, per-person spending is higher in Wales than in England. In part, this reflects different patterns of need. For instance, the Welsh population is, on average, older and in worse health than the English population, so we would expect health spending to be higher in Wales than in England. The population is also more sparsely populated, which might increase the cost of delivering some services and the transport infrastructure needed to link up communities. But part of the difference reflects policy choices, and decisions taken by the devolved administration over how those services should be organised and operated.
Differences in how services are operated and how performance is measured mean it is not feasible to do a comprehensive comparison of how things are faring in Wales and the rest of the UK. But we can look at how performance has changed over time in Wales and compare some headline figures with England and Scotland. We do this for the NHS and education system.
It is worth noting that the current Senedd term includes the latter stages and period following the COVID-19 pandemic. The pandemic – and policy responses to it – had significant impacts on the economy, on well-being and on public service delivery. Hospitals postponed pre-planned treatment and appointments, and some people avoided coming forward for treatment both to avoid catching COVID-19 and to avoid putting strain on the NHS. Schools closed to in-person teaching for several months in both 2020 and 2021. However, it is nearly five years now since the height of the pandemic, so we focus on comparing performance with 2019 and earlier – to assess the extent to which services have recovered to pre-pandemic levels of performance.
Health and NHS performance
Health, the largest area of public service spending in Wales, is a major focus of the Welsh Government: at the start of this Senedd term, it set out a five-year ‘Plan for Health and Social Care’, with an emphasis both on recovering services from the effects of the COVID-19 pandemic and of improving health and well-being more widely (Welsh Government, 2021). In this section, we first consider health outcomes in Wales over this period, with a particular focus on life expectancy. In doing so, it is important to note that many factors outside both the healthcare system and the wider public sector affect life expectancy and health, including living standards and conditions, and lifestyle choices and behaviours. We then examine recent trends in NHS staffing, activity, productivity and performance. Where possible, we compare performance across all measures to England and Scotland.
Health outcomes
One important measure of health outcomes is life expectancy at birth. This takes into account mortality rates at all ages, and so is a comprehensive, if crude, measure of overall population health.
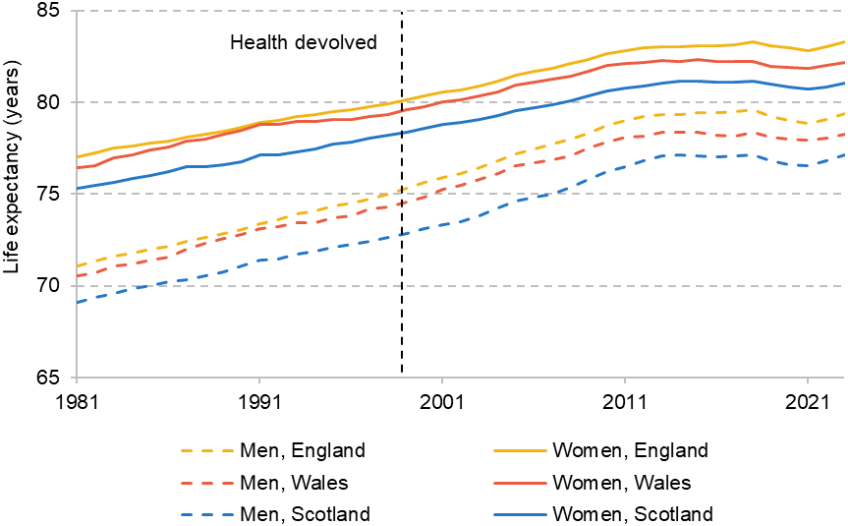
Life expectancies have long varied significantly within the UK. Figure 9 shows that life expectancies in Wales have consistently been lower than in England but higher than in Scotland over the last 40 years, for both men and women. In the most recent years of data (2022–24), for example, women born in Wales could expect to live for 82.2 years, compared to 81.0 years in Scotland and 83.3 years in England.
Figure 9. Life expectancy at birth in England, Scotland and Wales, 1980–82 to 2022–24
Note: Life tables are calculated on a rolling three-year basis. Values presented here use the midpoint year of each life table to present life expectancies over time.
Source: Office for National Statistics (2025b).
All three nations have seen little change to life expectancies since the early 2010s, following years of sustained improvements. Healthy life expectancies have in fact fallen across the UK since 2015, including in Wales, meaning that people are spending more of their lives in poor reported health (Public Health Wales, 2025).
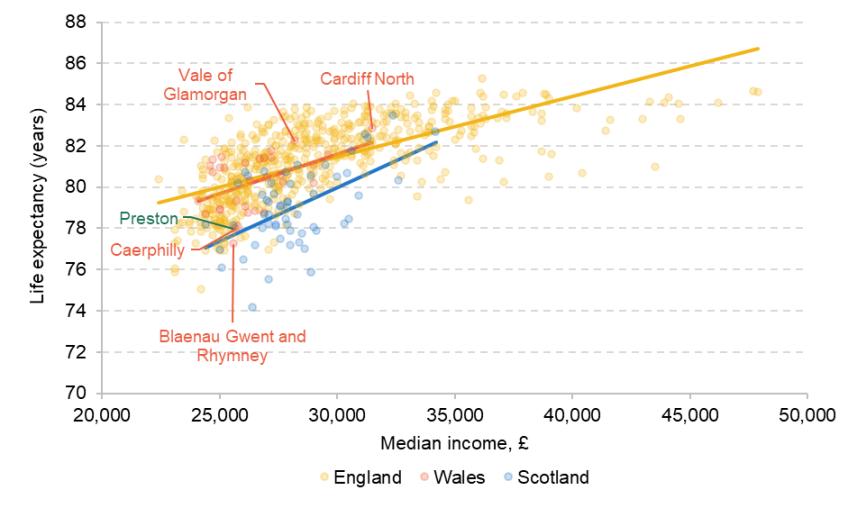
Figure 10 shows average life expectancy and median income in each parliamentary constituency in England, Scotland and Wales in 2023. The figure illustrates the extent of variation in life expectancy across areas in Wales. Constituencies in parts of the South Wales valleys, such as Blaenau Gwent and Rhymney or Caerphilly, have average life expectancies around five years lower than in Cardiff North and the Vale of Glamorgan. At the neighbourhood level, gaps in healthy life expectancy between the most and least deprived areas in Wales have grown over the last decade (Welsh Government, 2025a).
Figure 10. Life expectancy and median income in England, Scotland and Wales, 2023
Note: Each point represents a parliamentary constituency. Median income is median taxable income, including income from employment, pensions, and profits, but not (for example) some benefit income. Lines represent nation-specific ordinary least squares regressions.
Source: HMRC (2024) and Office for National Statistics (2025b).
Some of the differences in average life expectancy between Wales, England and Scotland can be explained by wider variation in living standards across Great Britain. Figure 10 suggests that Wales in part has lower life expectancies than England because areas in Wales are, on average, poorer. Areas in Wales with comparable income levels to English constituencies have very similar life expectancy outcomes. For example, whilst life expectancies in Caerphilly and Swansea West are lower than the UK average, at around 78 years, they are very similar to constituencies in England with similar average incomes, such as Preston and East Thanet. By contrast, the same pattern is not true in Scotland: life expectancies in Scottish constituencies are still markedly lower than those in English or Welsh constituencies at similar levels of income.
There are many other measures of health outcomes, such as quality of life. Healthy life expectancy measures the number of years people are expected to spend in good health. Data for 2022–24 suggest that Welsh male healthy life expectancy is lower than in England and similar to in Scotland. Welsh female healthy life expectancy is also lower than in England, and somewhat lower than in Scotland (Office for National Statistics, 2026). At the 2021 Census, 6.7% of Welsh respondents reported ‘bad’ or ‘very bad’ health, compared to 5.3% in England (Office for National Statistics, 2023). Obesity rates are lower in Wales than in all of the other nations of the UK (Stiebahl, 2025), although smoking rates are higher than in England (Health Foundation, 2025).
Taken together, this analysis suggests that health outcomes in Wales are broadly, though not exclusively, better than those seen in Scotland, but worse than those in England. At least some of this variation can be explained by differences in incomes between nations.
NHS performance
We now examine how the NHS is performing in Wales. Waiting times for treatment have increased dramatically since the start of the COVID-19 pandemic, and the Welsh government has focused heavily on reducing these waiting times. We therefore start by examining waiting times in Wales, how they have changed over time and how they compare with those in England and Scotland. Waiting times are an important measure of how well the NHS is performing, capturing how easy it is for patients to access the care they need. Importantly, though, they do not directly measure the quality of care that is provided.
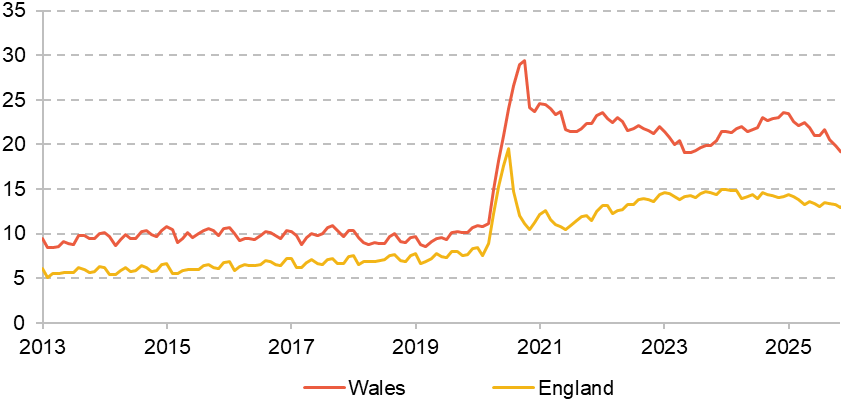
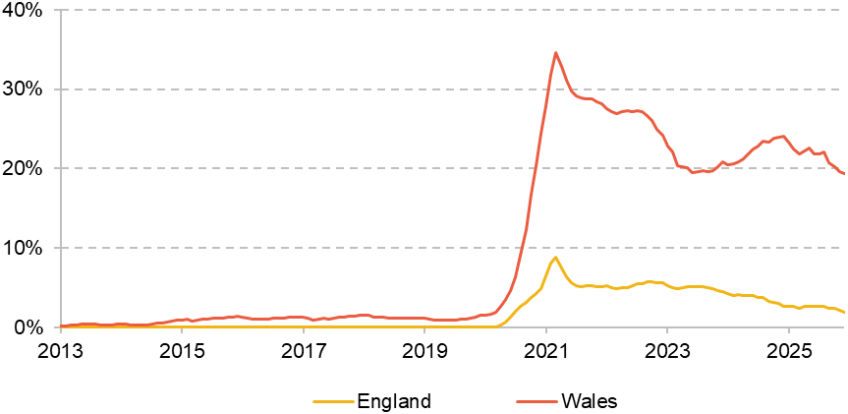
Figures 11 and 12 show two measures of waiting times for pre-planned (elective) treatment in Wales. Figure 11 shows the median waiting time, while Figure 12 shows the share of patients waiting more than a year for treatment. In both cases, waiting times increased dramatically in Wales during the COVID-19 pandemic. Waiting times then fell between 2021 and 2023, before starting to rise again, and then start falling again in late 2024 and 2025.
Figure 11. Median waiting time for elective treatment, weeks
Note: Median waiting time measured from ongoing waiters, not from completed waiting times. Welsh Referral to Treatment (RTT) statistics include some specialties (Diagnostic Services, Allied Health Profession Services) that are not included in English RTT statistics. However, these specialties have much lower waiting times than the overall median, meaning that the comparable measure for Wales would be even higher than the series shown here.
Source: StatsWales (2026a) and NHS England (2026a).
Figure 12. Share of patients waiting over a year from referral to starting elective treatment
Note: Excludes specialties that are not in scope of both the English and Welsh RTT statistics.
Source: StatsWales (2026b) and NHS England (2026a).
Waiting times for pre-planned care remain substantially higher than pre-pandemic. In the latest available data, the median waiting time was 19 weeks in December 2025, compared to 10.7 weeks in December 2019. The share of patients waiting more than a year was 19.3% in December 2025, compared to 1.5% in December 2019. Given the total waiting list is also much higher, that means that the number of people waiting more than a year for treatment has increased by even more.
The Welsh Government has set a number of targets to improve waiting times. In 2022, it set targets that waits for pre-planned activity longer than a year would be eliminated in most specialties by Spring 2025 (Welsh Government, 2022). This has not been achieved. Indeed, the Health and Social Care Committee of the Welsh Senedd concluded in November 2025 that the Welsh Government had failed to meet any of its targets for recovering elective activity, including those for cancer and diagnostic testing (Health and Social Care Committee, 2025).
Figures 11 and 12 also show these measures for England, in yellow. It is worth noting that it is always difficult to perfectly compare waiting times across the nations of the UK due to differences in measurement and organisation of the NHS. Here we have primarily focused on comparisons between England and Wales, as both nations report elective waiting times in a reasonably comparable way (Office for National Statistics, 2024b).
England has also seen elective waiting times rise a lot since the start of the pandemic, and waiting times are still higher than pre-pandemic. But performance in Wales is worse than in England. Starting with median waiting times, Wales already had longer waits than England pre-pandemic – the median wait in December 2019, for example, was 10.7 weeks in Wales and 8.3 weeks in England. That gap has widened since the pandemic, with the median wait in December 2025 being 19 weeks in Wales and 13.4 weeks in England. Wales also has a much larger share of waits longer than a year than does England. In December 2025, 19.3% of patients in Wales were waiting more than a year for pre-planned treatment, compared with 1.9% in England. Like Wales, England has also failed to achieve its own targets to eliminate waits more than a year.
Although we have not included figures for Scotland here, as data on elective waiting times are less comparable, Scotland similarly has elective waiting times that are higher than pre-pandemic, and the Scottish Government has also failed to achieve many of its recovery targets.
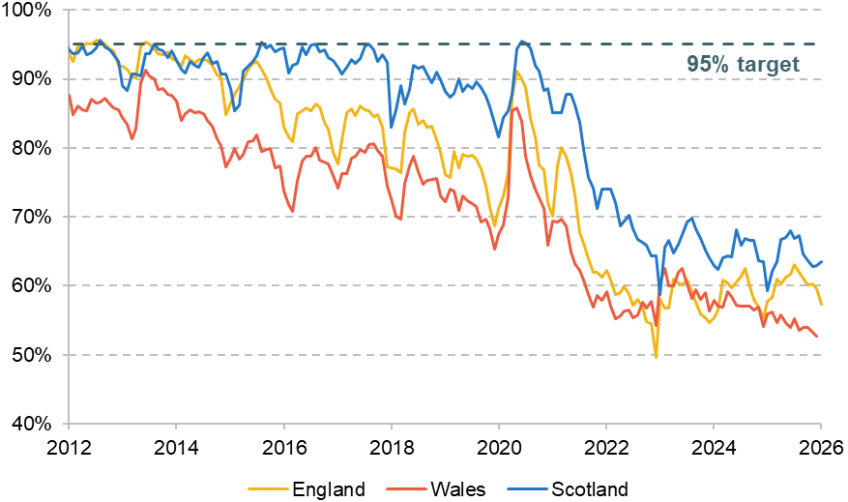
Figure 13 repeats this analysis but considers waiting times in A&E departments, a measure of waiting times for emergency care. This is measured in all three nations as the share of patients waiting less than four hours to be admitted, transferred or discharged. Pre-pandemic, Wales had worse A&E waiting times than either England or Scotland. In December 2019, for example, 65.3% of patients in Wales waited less than four hours in A&E, compared to 68.6% in England and 83.5% in Scotland.
Figure 13. Share of patients waiting less than four hours to be admitted, transferred or discharged in major A&E departments
Note: Only includes ‘type 1’ A&E departments (England), ‘major’ A&E departments (Wales) and Emergency Departments (Scotland), as recommended for comparability by the Office for National Statistics (2024c).
Source: StatsWales (2026b), NHS England (2026b) and Public Health Scotland (2026a).
Waiting times have worsened in all three nations since the start of the pandemic, but Wales remains bottom of the pack. Even more concerning, A&E waiting times have consistently worsened in Wales between 2023 and 2025, unlike in either England or Scotland. In the latest available data for all three nations, for December 2025, 52.7% of patients waited less than four hours in A&E in Wales, compared to 59.6% in England and 62.9% in Scotland. However, a large part of the deterioration in Wales is due to a significant decline in A&E performance in the Betsi Cadwaladr health board in North Wales, where just 42% of patients were seen within four hours in December 2025. Performance elsewhere in Wales has been roughly flat over the last two years.
Taken together, waiting times for NHS treatment in Wales are much higher than pre-pandemic. There has been some recent improvement in elective waiting times, but a worsening in A&E waiting times. While the Scottish and English NHS are also performing worse than pre-pandemic, waiting times for treatment are consistently higher in Wales than in either Scotland or England.
NHS activity and staffing
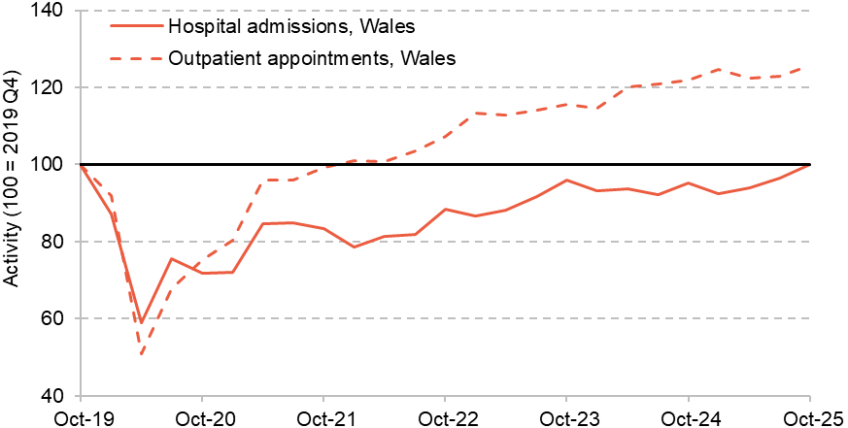
We next turn to hospital activity, i.e. the number of people treated by hospitals in Wales. Panel (a) of Figure 14 shows how two key measures of hospital activity – admissions and outpatient appointments – have changed since 2019. Both measures of hospital activity fell sharply during the COVID-19 pandemic, but have since then recovered. Hospitals have delivered more outpatient appointments than pre-pandemic since 2022, and more admissions than pre-pandemic since 2025. In the latest available data, for October to December 2025, hospitals delivered 25% more outpatient appointments and roughly the same number of admissions as in October to December 2019.
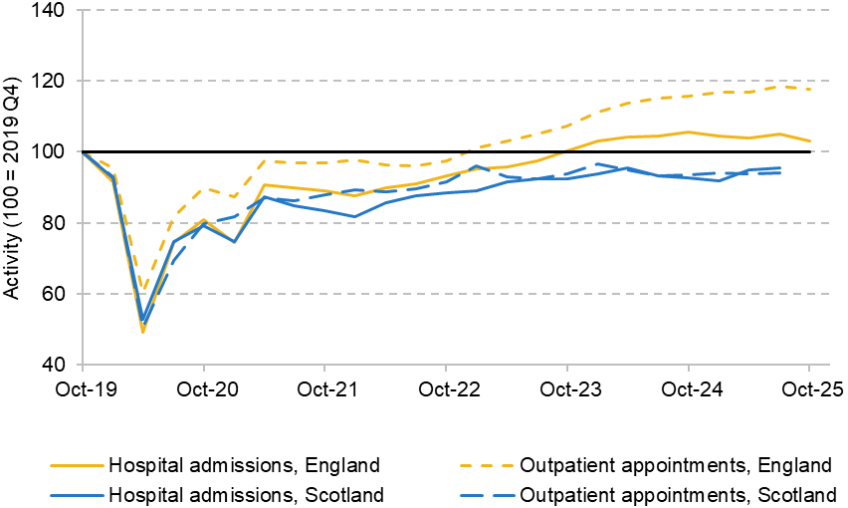
Figure 14. Changes to hospital activity, relative to 2019 Q4
(a) Wales
(b) England and Scotland
Note: ‘Hospital admissions’ includes both emergency and elective admissions.
Source: Digital Health and Care Wales (2026), NHS England (2026c) and Public Health Scotland (2026b).
Panel (b) of Figure 14 shows the same measures for England and Scotland. The Welsh NHS has recovered hospital activity much better than in Scotland, where both types of hospital activity remain below pre-pandemic levels. However, Wales has recovered outpatient activity faster than in England, but hospital admissions slower than in England. In the latest available data, for October to December 2025, English hospitals delivered 3% more admissions than in October to December 2019, compared with roughly no growth in Wales. For outpatient appointments, English hospitals delivered 18% more over the same period, compared to 25% more for Wales. It is worth noting that increases in hospital activity are not unambiguously good – all three nations are trying to reduce ‘unnecessary’ outpatient appointments, for example. That being said, when waiting times for elective activity are so high, increases in hospital activity are likely to correspond to reduced waiting times. It is therefore notable that Wales has worse elective waiting times than Scotland (Figure 8), despite greater increases in hospital activity. A similar pattern has also taken place in England (Harvey-Rich and Warner, 2025), but it is beyond the scope of this piece to understand what is driving the divergence in Wales.
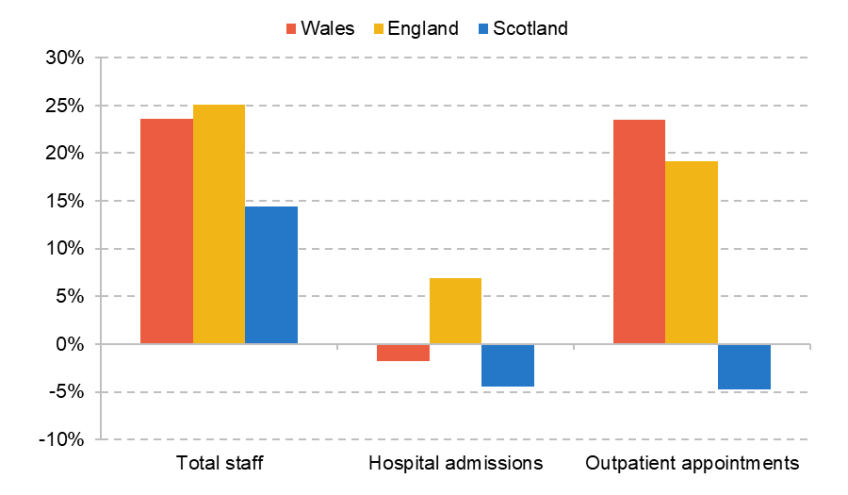
Figure 15 shows how NHS staffing has changed in Wales, England and Scotland, and how this compares with hospital activity. Because of the larger lag in publication of Scottish data, and in order to compare across the three nations, here we focus on changes between April to September 2019 and April to September 2025. Wales has substantially increased NHS staffing since the start of the pandemic, with 23.6% more staff. This increase is slightly smaller than in England (25.0% over the same period), but much larger than in Scotland (14.4% over the same period). Relatedly, as discussed in Section 2, Wales has seen a substantial increase in health spending since the start of the pandemic.
Figure 15. Changes to staffing and hospital activity, April to September 2025 versus April to September 2019
Note: ‘Hospital admissions’ includes both emergency and elective admissions. ‘Total staff’ includes both staff working in hospitals and in the community sector.
Source: Digital Health and Care Wales (2026), StatsWales (2026d), NHS England (2026c, 2026d), Public Health Scotland (2026b) and TURAS Data Intelligence (2025).
While Wales has seen a large increase in outpatient appointments, roughly proportional to the increase in staffing, it has not seen a commensurate increase in hospital admissions. This suggests that hospital activity per staff member, a crude measure of labour productivity, has fallen in Wales since the start of the pandemic. Figure 15 also helps illustrate that England and Scotland have seen similar falls in activity per staff member – in England, hospital activity has not increased commensurately with increases in staffing, and in Scotland, staffing has risen while activity is still below pre-pandemic levels.
This analysis is simple – it does not take into account changes in the types of activity delivered, the complexity of patients and the mix of staff employed by the NHS. Measuring productivity is a complex challenge and Wales – like Scotland – currently lacks the detailed productivity measures produced by NHS England. But the analysis here does suggest that there has been a fall in hospital productivity. Indeed, this simple analysis for England matches the qualitative pattern of more advanced analysis, which also finds that hospital productivity is lower than pre-pandemic (e.g. NHS England, 2024).
In response to these challenges with waiting times and productivity, the Welsh government commissioned an independent Ministerial Advisory Group (MAG) on Performance and Productivity in the Welsh NHS. This group published their analysis in April 2025 and issued a set of recommendations, with a focus on reducing variation between health boards, better accountability and performance management, and improving productivity measurement. The Welsh government have accepted 18 recommendations and accepted ‘in part’ the remaining 11.
Conclusion
Performance in the Welsh NHS remains worse than pre-pandemic and recovery has taken far longer than expected. Almost every recovery target has been missed, and waiting times for many services remain far higher than they were pre-pandemic. There has been some recent improvement in elective waiting times, but concerningly A&E waiting times have worsened. Other nations in the UK have also faced similar challenges, but comparable waiting times remain higher in Wales than in England or Scotland. There are also worrying signs that hospital productivity may have fallen, given large increases in staffing and funding that have not fully translated into higher activity.
Educational performance
Education policy is devolved, and Wales, England and Scotland operate under different institutional frameworks. Up until devolution in 1999, Wales and England operated very similar school and education systems. After devolution, school policies and institutions have gradually diverged (Sibieta and Jerrim, 2021).
In Wales (as in Scotland), councils continue to play a significant role in school funding and spending. This contrasts with England, where schools (particularly academies) have more autonomy. Policymakers in Wales have also placed less emphasis on high-stakes tests during primary and secondary schools, with externally assessed SATs phased out in the 2000s. Wales has since brought back literacy and numeracy tests from 2013 onwards, though these are used only for national benchmarking and internal school use, rather than school-to-school comparisons.
Historically, Wales followed a similar curriculum to England. Since 2022, Wales has gradually rolled out the new ‘Curriculum for Wales.’ Like the curriculum in Scotland, the Curriculum for Wales emphasises cross-cutting areas of learning and gives significant discretion to schools and teachers to shape the precise content. In contrast, schools in England must follow the National Curriculum, which has maintained traditional subjects and which provides specific guidance on the minimum amount of material expected to be covered at each stage.
Given the differences in the education systems and standardised testing regimes, it is difficult to compare educational performance across the nations using domestic examination results. We therefore use data from the Programme for International Student Assessment (PISA), which provide a useful tool for comparing educational performance across countries. This programme assesses a broadly representative selection of 15-year-old pupils across a wide range countries on areas including maths, science and reading ability. It aims to test students on what they should be expected to know at their age.
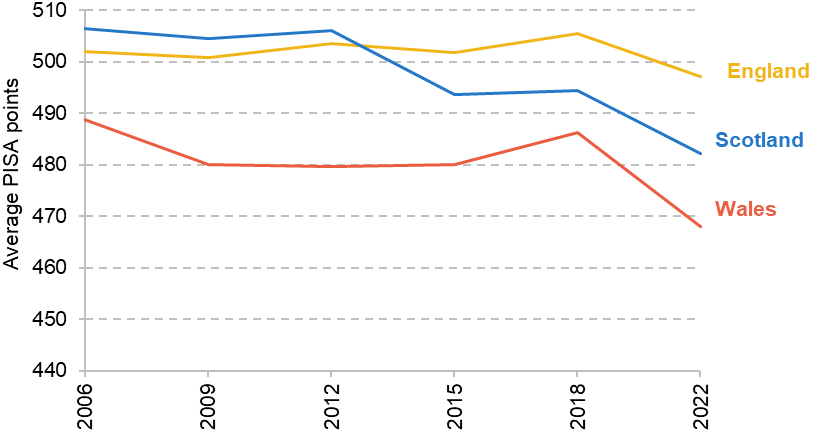
Welsh performance on PISA tests has been systematically lower than in England and the rest of the UK since the mid-2000s, as shown in Figure 16. There is also some evidence that this gap has increased, particularly for the latest results in 2022. This trend is broadly similar across all three of the maths, science and reading domains of PISA scores. Although there are no data available since the rollout of the new Curriculum for Wales, existing evidence on the impact of these ‘skills-based’ curricula suggests that it is unlikely to improve academic attainment; see Sibieta (2024) and Crehan et al. (2025) for an overview.
Figure 16. Average PISA performance by nation
Note: Average is from authors’ calculations based on subject score in maths, reading and science.
Source: Programme for International Student Assessment (2022).
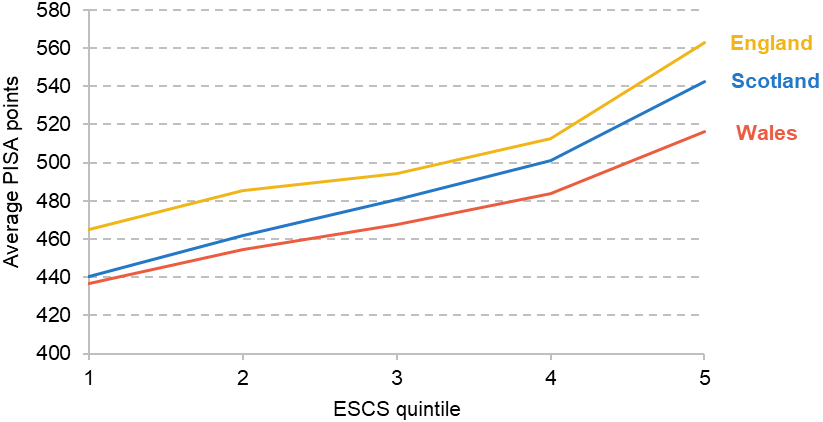
We are also interested in how pupils of different socio-economic status perform within each nation. Figure 17 shows the average PISA score by quintiles of PISA’s index of economic, social, and cultural status (ESCS). Importantly, these quintiles are constructed within each nation rather than for the UK as a whole, and so each quintile does not represent pupils of the same socio-economic status for each nation. For 2022, we can see that the socio-economic gradient for Wales was broadly similar to that of England, consistent with similar levels of inequality in educational performance for the two nations. Other analysis of GCSE scores suggests that educational inequalities have been persistently higher in Wales than England (Cardim-Dias and Sibieta, 2022).
Figure 17. Average PISA score by socio-economic quintile and nation, 2022
Note: Average is from authors’ calculations based on subject score in maths, reading and science.
Source: Programme for International Student Assessment (2022).
Furthermore, this socio-economic breakdown helps to illustrate that the overall worse performance of Wales on PISA tests is not solely due to higher levels of deprivation in Wales; the most deprived quintile of English pupils perform similarly to the average pupil in Wales, and although deprivation quintiles are not strictly comparable across nations, this does suggest that part of the England–Wales gap is due to lower Welsh attainment even conditional on pupil characteristics.
School attendance
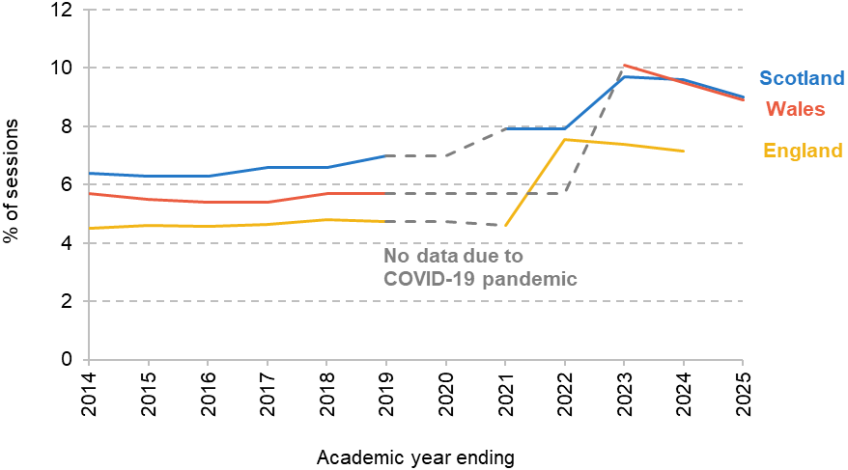
Wales, England and Scotland have all faced similar challenges around a rise in pupil absence, particularly since the COVID-19 pandemic. Figure 18 shows the overall pupil absence rate (percentage of half-day sessions missed) for each nation over time. Prior to 2020, all three nations saw generally stable absence rates, with absences in Wales and Scotland consistently higher than in England. Since the full return to in-person schooling following the pandemic, all three nations have seen significantly higher levels of pupils absence. More recent years have seen a decline from the peak around 2022, but so far this decline has been slow and largely due to falling rates of authorised absences, while rates of unauthorised absence remain stable at around double pre-pandemic rates. Wales has seen a particularly steep increase in absences; while pre-pandemic it sat between England and Scotland, it has been consistently at Scottish levels in the most recent years. This is also true for rates of persistent absence, which in Wales increased from 15% of pupils in 2018–19 to 27% of pupils in 2024–25. By contrast, England saw a smaller absolute rise from 11% of pupils in 2018–19 to 20% in 2023–24.
Figure 18. Average share of overall sessions absent
Note: ‘Sessions’ refer to half-days of schools. Welsh absences exclude data from the late May bank holiday for secondary school pupils each year and so are not perfectly comparable.
Source: Scottish Government (2026), StatsWales (2025a) and Department for Education (2025a).
This is a worrying trend: the roughly 9% of sessions pupils were absent for in Wales and Scotland in 2024–25 translate into about 17 lost days of schooling per pupil. This likely has a meaningful impact on academic attainment, with estimates suggesting that 10 days of absence can reduce attainment by between 0.03 and 0.06 standard deviations, with some estimates much higher (Goodman, 2014; Aucejo and Romano, 2016). Absence rates are also higher for pupils from more deprived backgrounds, and thus contribute to inequality in attainment across socio-economic groups.4
In England, the rise in absences has predominantly been driven by an increase in absence due to sickness and a rise in unexplained unauthorised absences. Part of this may be due to changes in parental attitudes around school attendance as well as a rise in mental health problems and anxiety around attending school (Burtonshaw and Dorrell, 2023). Data on the causes of absence are less comprehensive in Wales, but some reports suggest that health issues and school refusal are key elements of absences that have worsened since the pandemic (Parentkind, 2023).
Alongside increases in school absence, Figure 19 shows that there has been a rapid rise in the share of pupils in Wales who are educated at home (‘elective home education’). In 2009–10, less than 0.2% of pupils in Wales were educated at home, which rose to 0.6% in 2018–19 (just before the pandemic). After the pandemic, figures continued to rise, with 1.5% of pupils educated at home in Wales in 2024–25. Ensuring educational quality and appropriate safeguarding for this growing group of children is important – but challenging.
Figure 19. Share of pupils in elective home education, England and Wales
Source: StatsWales (2025b) and Department for Education (2026).
These figures vary significantly across local authorities, with the largest share of pupils educated at home in rural local authorities (about 3% of pupils in Ceredigion and Powys), but also relatively high shares in more deprived local authorities (2% in Torfaen, Neath Port Talbot and Blaenau Gwent). The lowest shares of pupils in home education are seen in South Wales, with 1% in home education in Cardiff, Swansea and the Vale of Glamorgan.
Unfortunately, statistics are not available for Scotland. However, we do observe similar recent trends for England, with a rise in pupils in home education from 1.0% in 2022–23 to 1.4% in 2024–25. Older council data further suggest there was significant growth in the number of pupils in home education in England during the late 2010s and just after the pandemic, suggesting similar trends to Wales (Long and Danechi, 2023).
Participation in post-16 and higher education
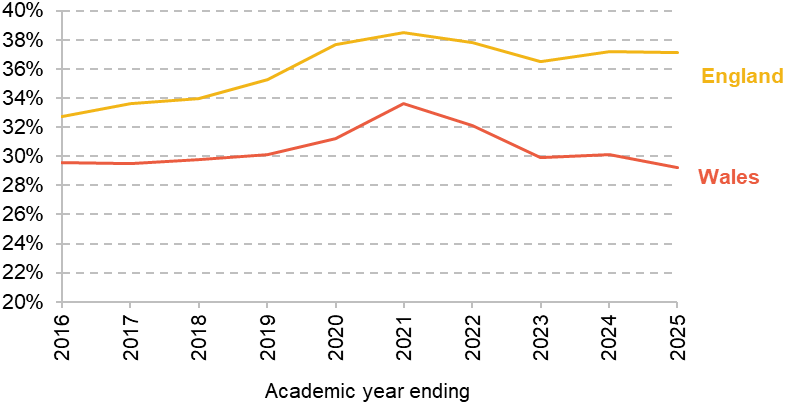
Over the past few decades, an increasing share of young people in the UK have chosen to go to university. This trend has somewhat waned in recent years, with the share of 18-year-olds accepted into higher education having broadly levelled off in England since 2021 (Figure 20). In Wales, however, the trend now seems to be one of somewhat declining participation in higher education, with this share falling since 2021 and now below 2016 levels. It should be noted that this measure does not perfectly capture the share of secondary school leavers who go into university, as 18-year-olds may be delaying university entry until a later age. However, even as a proxy, it does suggest a decline in higher education participation among Welsh pupils.
Figure 20. Proportion of 18-year-olds accepted into undergraduate courses
Source: UCAS (2025).
This is a potentially worrying trend given that university graduates consistently have higher lifetime earnings than non-graduates (Britton et al., 2020). The exact reasons behind this trend are unclear, but the share of Welsh young people not in education, employment or training (NEET) does not seem to have markedly increased. It therefore seems that more young people are entering training and employment rather than higher education.5 This might allay some concerns about declining higher education participation, particularly if it reflects fewer people participating in degrees with low returns, and instead entering occupations with higher returns. Further research is needed.
This trend of declining participation in education is not just restricted to higher education, as there has also been a decline in the share of 16- and 17-year-olds participating in education (Figure 21). The share of 16- and 17-year-olds participating in full-time education declined from 78% in 2014 to 64% by 2024 in Wales. In England, by contrast, participation has grown from 82% to 84% over the same period. Looking by individual age, provisional statistics suggest that only 69% of 16-year-olds and 59% of 17-year-olds were in full-time education in 2024 in Wales, with both figures reflecting a steady decline in participation since the peaks of 83% and 73% in 2013 and 2014, respectively. Again, if this declining post-16 participation reflects young people moving into training and employment with higher lifetime returns for them, this trend is not necessarily a bad thing. However, at face value, these steadily declining rates of educational participation at multiple stages of education could be a cause for concern.
Figure 21. Share of 16- and 17-year-olds in full-time education, England and Wales
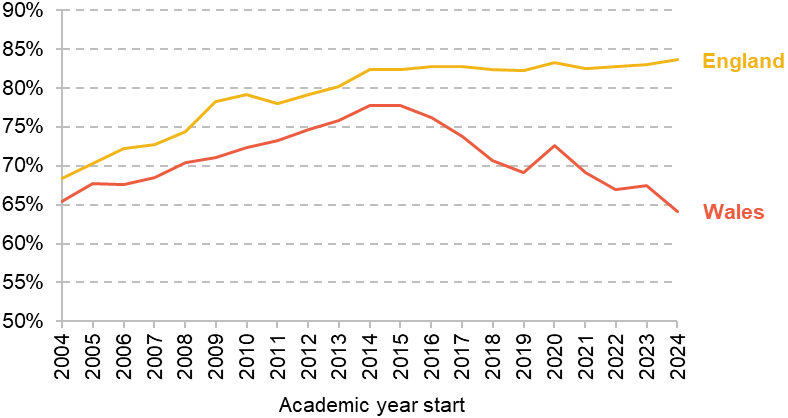
Note: Welsh figures for 2024 are provisional and may be subject to revision.
Source: StatsWales (2025d) and Department for Education (2025b).
Conclusion
Spending per pupil is similar in Wales and England. Yet on multiple metrics, the education system in Wales looks to be performing more poorly, and this is cause for concern. Performance in international PISA tests has consistently been lower than in England, with this gap widening in the most recent years. There is little evidence that the new skills-based Curriculum for Wales will help to reverse this trend. Absence rates are high and have seen a larger increase since the pandemic than both England and Scotland. Participation rates in post-16 and post-18 education have fallen. Policymakers in Wales should do more to understand the reasons behind these trends and to address them. The cost to Wales of not doing so could be high.
4. What is the outlook for public service spending?
Whereas the UK and Scottish governments have published three-year spending plans as part of Spending Reviews, the Welsh Government has chosen to set budgets for the coming financial year, 2026–27, only. The stated reason for this is to enable a new government to set its priorities post-election – which is reasonable given that polling suggests a change of government is likely in Wales. As discussed in our recent Scottish Budget Report (Boileau, Brogaard and Phillips, 2026), the funding arrangements and limited borrowing powers of the devolved governments also make multi-year budgeting difficult. However, setting only a one-year budget also allows the current government to avoid spelling out the tough choices any government is likely to face in allocating funding between services from 2027–28 onwards, as overall growth in funding slows down. We therefore use scenario analysis to examine what different choices for major services such as the NHS and local government could mean for other public services in Wales.
The 2026–27 Welsh Budget
First, though, we look at the plans set by the Welsh Government for 2026–27.
Last summer, the current Welsh Finance Secretary, Mark Drakeford (2025), set out a plan for what he termed a ‘business as usual’ budget, with spending allocations for each service area (or ‘main expenditure group’ (MEG) in Welsh Government parlance) increased in line with inflation. This would leave hundreds of millions of pounds of unallocated money for the next Senedd post-election, plans for which could be ‘put before the Welsh electorate in [parties’] manifestos’. The Draft Budget for 2026–27 published in October was broadly in line with that approach, but used different inflation figures for different MEGs, reflecting differences in the share of labour and other costs in each MEG’s overall budget (Welsh Government, 2025b).
As we pointed out at the time (Phillips, 2025), such inflation-based funding increments was in no way a ‘business as usual’ approach: the needs for and costs of different services are changing differently, with those of the largest MEG (health and social care) likely increasing by substantially more than inflation. We were concerned that labelling such an approach as ‘business as usual’ or ‘neutral’ could lead political parties and the electorate to think that there was ‘easy’ money available for new spending measures or tax cuts – when in fact much, if not all, available funding would be needed for ‘business as usual’ pressures.
Following the Draft Budget, the current Welsh Government negotiated a deal with Plaid Cymru and the Liberal Democrats to amend plans – and in doing so allocate much more of the then available funding across MEGs. But there is still substantial funding to be allocated: around £40 million of resource funding held back in the Final Budget, £322 million of new funding confirmed in the UK government’s 2026 Spring Statement, plus a potential £120 million of resource funding from the Immigration Health Surcharge;6 and around £118 million of capital funding.
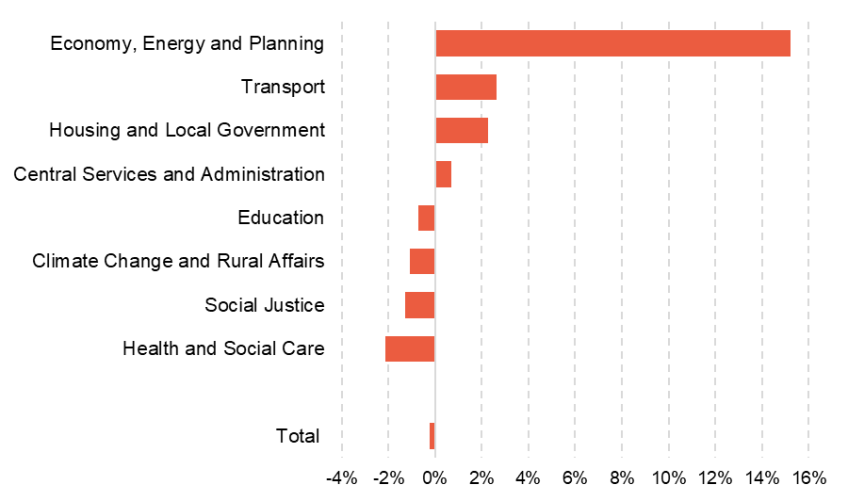
Bearing this in mind, Figure 22 shows the implied year-on-year real-terms changes in currently allocated resource spending for each MEG in 2026–27, relative to the final plans for 2025–26 set out in the 2nd supplementary budget of February 2026.
Figure 22. Planned real-terms change in resource spending by Welsh Government MEG, between 2025–26 and 2026–27
Note: Excludes funding for the Senedd Commission and Audit Wales.
Source: Welsh Government (2026a, 2026b).
Figure 22 shows that based on current allocations, overall resource spending would fall by 0.2% in real terms in the coming year, 2026–27. The changes differ significantly by MEG though. Spending on health and social care is currently set to fall most – by2.1% in real terms. The social justice (-1.3%), climate change and rural affairs (-1.1%) and education (–0.7%) MEGs are also set to see real-terms reductions on the basis of the budget currently agreed for 2026–27. Conversely, fairly sizeable increases are planned for housing and local government (+2.3%), transport (+2.7%) and, especially, economy, energy and planning (+15.2%) MEGs. The apparent increase in spending on the economy, energy and planning MEG though is driven by the fact some spending in this area in the current year has been offset by the proceeds of property disposals, reducing net spending by the Welsh Government: the lack of planned disposals in the coming year pushes up net spending.
The fall in overall spending and especially health and social care spending implied by these plans to a large extent reflects large in-year top-ups to spending in the current fiscal year, 2025–26. In particular, as explained in Box 1, the 2nd Supplementary Budget for 2025–26 significantly topped up spending for the health and social care MEG, including by planning to draw the Wales Reserve down in full (previously, the Welsh Government had planned only modest Reserve drawdowns this year).
Box 1. The Welsh Government’s 2nd Supplementary Budget for 2025–26
After the Senedd passes the Budget Act prior to the start of a fiscal year, this initial budget is typically revised in two supplementary budgets during the course of the year: one in June and the other towards the end of the year in February. The 2nd Supplementary Budget for 2025–26 was published on 24 February 2026 and made big changes to the current fiscal year’s spending plans – with potentially important consequences for budgeting in 2026–27.
Overall resource spending was topped up by £371 million (or 1.6%) in the 2nd Supplementary Budget, following a top of £388 million (or 1.7%) in the 1st Supplementary Budget (of which just over half reflected compensation for higher employer National Insurance Contributions or NICs).7 Increases in the 1st Supplementary Budget were spread across MEGs (reflecting the impact of higher employer NICs across the Welsh Government). But increases in the 2nd Supplementary Budget were targeted at the health and social care MEG (£363 million, or 98% of the overall total increase of £371 million). All told, in-year increases to health and social care resource spending in 2025–26 amount to around £625 million or 5.2%. After stripping out employer NICs compensation, the increase was around £525 million or 4.4%. This leaves the final budget for health and social care resource spending in 2025–26 4.5% higher in real terms than spending in 2024–25, or 3.7% higher after stripping out spending on higher employer NICs.8
The 2nd Supplementary Budget documentation says that £89 million of the top-up for the health and social care MEG relates to pay awards in 2025–26. The remainder reflects in-year pressures and efforts to reducing waiting lists and times (£200 million), as well as the allocation of a final tranche of Immigration Health Surcharge income to NHS services (£74 million). Each of these relates to recurring pressures (such as pay) or objectives (reducing high waiting lists and times), rather than one-off items. This means that the fall in real-terms spending on health and social care in 2026–27 implied by the Budget plans currently going through the Senedd would, if stuck to, entail difficult choices over NHS staffing and service provision.
As discussed in Box 1, the in-year top-ups to health spending this year reflect ongoing pressures – pay increases in 2025–26, and addressing long waiting lists and times – rather than one-off costs that can be expected to abate. The large fall in health spending implied by current 2026–27 Budget plans is therefore inconsistent with maintaining service standards let alone continuing the recent modest improvements in the performance of the Welsh NHS. It is also inconsistent with proposed pay increases for NHS staff. The Welsh Government proposes pay rises for NHS staff on Agenda for Change contracts (such as nurses) of 3.3% in cash terms or 1.1% in real terms relative to the GDP deflator measure of inflation (Miles, 2026). A new contract for resident doctors with a 4% increase in higher pay (before annual uplifts) is due to start rolling out from August 2026 (British Medical Association, 2025). It is hard to see how such pay increases could be afforded within the existing health and social care spending allocation without cutbacks in staffing and/or service provision.
As discussed though, the Welsh Government has still to allocate around £480 million of resource spending in 2026–27. Accounting for both of these would take the overall year-on-year real-terms change in Welsh Government resource spending from -0.2% to +1.8%. If this as-yet unallocated funding were allocated in full to the health and social care MEG, its resource spending in 2026–27 would be approximately 1.6% higher in real terms than in the current fiscal year, rather than 2.2% lower. This would be a big change from the current plans, and roughly in line with plans for England in the coming year (also a 1.6% increase). But it would be lower than the increase required over the last year to finally start bringing down waiting times (3.7% after stripping out the effect of higher employer NICs bills).
In the absence of the top-ups to funding by the UK government in 2026–27, the £160 million or so that would have been available for in-year top-ups (£40 million unallocated funding in the Welsh Final Budget plus an assumed £120 million from the Immigration Health Surcharge) would have only been sufficient to bring the change in health and social care spending from –2.2% to -0.9%. This would have highly likely necessitated the next Welsh Government having to make in-year cuts to other spending in a post-election ‘emergency budget’ in order to boost health and social care spending in 2026–27, not least to pay for planned real-terms increases in pay.9 After previously avoiding the habit of relying on short-term funding for recurrent spending pressures that the Scottish Government got itself into during the COVID-19 pandemic (Brogaard et al., 2026), that would have been a potentially nasty final budgetary hangover for the next Welsh Government. With the extra UK government funding, the next Welsh Government may be able to avoid such a scenario – although a 1.6% real-terms increase in health spending would still be low by historic standards. But it will still have limited budgetary room for manoeuvre.
The outlook for 2027–28 and 2028–29
Looking further ahead, the Welsh Government has not set plans for later years – in keeping with its objective of providing flexibility for the next Senedd and government to determine their own priorities. However, as political parties develop their plans and the electorate assess them, it is useful to analyse what the overall funding outlook – discussed in our first Welsh election briefing note (Brogaard and Phillips, 2026a) – implies for the trade-offs between different services and between tax and spending after 2026–27. We do this through scenario analysis.
We first consider the trade-offs if resource funding evolves in line with existing UK government policy and official devolved revenue forecasts. The one-off nature of additional funding provided in the UK Spring Statement for 2026–27 means resource funding is set to decline by 0.4% in real terms in 2027–28. Resource funding is then set to increase by 1.5% in real terms in 2028–29. This means an annual average increase of just 0.5% a year in real terms over these two years.
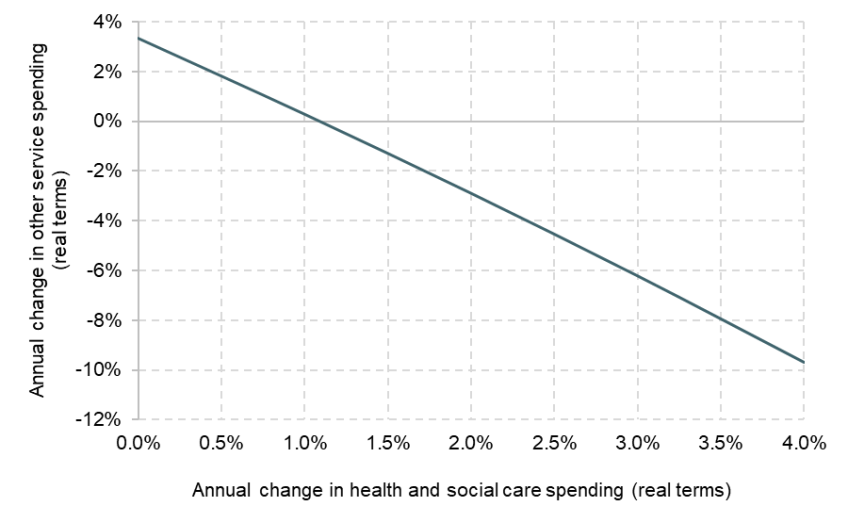
Figure 23 shows the average annual change in resource funding in 2027–28 and 2028–29 for MEGs other than the ‘health and social care’ and ‘housing and local government’ MEGs for different assumed increases in health and social care spending, if we also assume that the amount provided to the ‘housing and local government’ MEG was held flat in real terms (to avoid cuts to school and social care spending, for instance). That is, it shows how the amount of funding available for resource spending on other services – including transport, economic development, higher and further education, agricultural support and rural affairs, culture and tourism, and central administration costs – would change if health and social care services saw bigger or smaller increases in spending. In doing this, we assume that the £480 million or so of currently unallocated resource funding available in 2026–27 is allocated to the health and social care MEG (as discussed, bringing the year-on-year real-terms change in resource spending for this MEG to approximately +1.6% in the coming year).
Figure 23. Average annual change in real-terms resource spending for ‘other’ services for given changes in ‘health and social care’ resource spending, in 2027–28 and 2028–29
Note: Excludes funding for the Senedd Commission and Audit Wales, which we assume to equal £110 million each year.
Source: Authors’ calculations using Welsh Government (2026b), HM Treasury (2025c) and Office for Budget Responsibility (2026).
The figure shows that increases in health and social care spending averaging more than around 1.1% a year in real terms would require cuts to services outside housing and local government. These cuts would need to average around 4.9% a year, on average, if increases in the health and social care MEG were to match the real-terms increases provided to the UK Department of Health and Social Care (2.6% a year, on average; HM Treasury, 2025b).
Under current funding plans and revenue forecasts, therefore, the next Welsh Government would likely to need to make some significant cuts to some areas of spending if it wanted to both increase health and social care spending and protect housing and local government spending from cuts.
Upside and downside risks to funding and spending
The outlook for overall funding is also uncertain – which means the outlook for spending and the trade-offs between services, and between tax and spending may also change.
On the one hand, IFS researchers have previously highlighted how tight UK government plans in 2028–29 and indicative overall spending totals in 2029–30 look, especially in the context of a UK general election taking place in Summer 2029 at the latest.10 If the UK government topped up its spending plans, that would allow the Welsh Government to increase its spending by more (or reduce taxes) too. Faster than currently expected increases in devolved tax revenues – whether due to higher tax rates, or faster growth in the tax base (for instance, if average earnings or employment grow faster than in England) would also allow for larger increases in overall public service spending.
On the other hand, if devolved Welsh revenues perform less well than forecast, that would mean the Welsh Government would be able to increase its spending by less over the next few years. Such a scenario could arise either due to lower tax base growth than England, or reductions in Welsh tax rates.
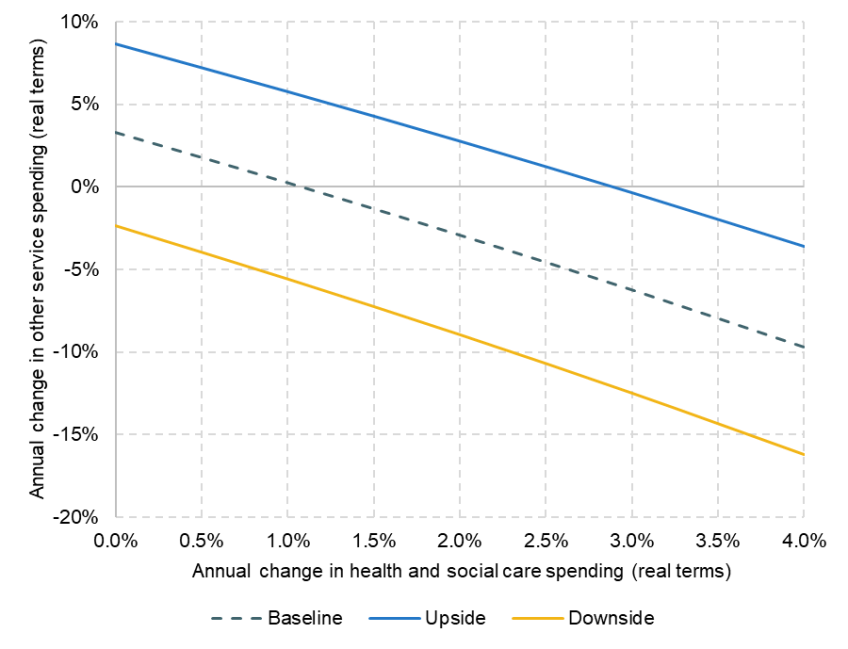
In the blue line on Figure 24, we show the same trade-off between health and social care spending and other spending in 2027–28 and 2028–29 if Welsh Government resource funding in 2028–29 is £500 million higher than under current official policy and forecasts. Such an increase would be consistent with the UK government topping up comparable spending in England by £8.9 billion (2%) in 2028–29, or around a 1.25 percentage point increase in all Welsh rates of income tax. The yellow line in the figure repeats the analysis, except under the assumption that Welsh Government resource funding in 2028–29 is £500 million lower than under current official policy and forecasts. Such a reduction would require growth in Welsh tax revenues to virtually stall in cash terms from this summer (which is unlikely), but would be consistent with around a 1.25 percentage point reduction in all Welsh rates of income tax.
Figure 24. Average annual change in real-terms resource spending for ‘other’ services for given changes in ‘health and social care’ resource spending, in 2027–28 and 2028–29, upside and downside scenarios
Note: Excludes funding for the Senedd Commission and Audit Wales, which we assume to equal £110 million each year.
Source: Authors’ calculations using Welsh Government (2026b), HM Treasury (2025c) and Office for Responsibility (2026).
The blue line in the figure shows that an additional £500 million in funding would significantly change the picture – conditional on the assumption that housing and local government funding would be held flat in real terms. For instance, matching real-terms increases in spending by the UK Department of Health and Social Care (2.6% a year) would be consistent with increases in funding for other services (outside housing and local government) averaging 0.9% a year in real terms. (The increase would be 0.3% if one also allowed housing and local government spending to increase in such a scenario.)
The yellow line shows that if funding was £500 million lower in 2028–29 than under current policy and forecasts, the trade-offs between services would be stark. Even if health and social care (as well as housing and local government) spending were held flat in real terms, other services would still need to be cut by 2.3% a year in real terms. Increasing health and social care spending in line with UK Department of Health and Social Care figures would require cuts to other services outside housing and local government of 11% a year, on average. (The reduction would be 4.0% if one also allowed the housing and local government MEG to be cut back in such a scenario.)
These scenarios therefore show that the budgetary trade-offs facing the next Welsh Government could be meaningfully different if either the UK government changes its spending plans, or devolved taxes are increased or decreased. Increases in funding (whether from the UK government or increased devolved taxes) could ease trade-offs somewhat – albeit through some combination of higher taxes (UK-wide or in Wales) or UK government borrowing. Reductions in funding (for instance, due to reductions in devolved taxes) would make the trade-offs between different services more stark – making sustaining performance across the full range of current services difficult. In such a context, if the Welsh Government wanted to maintain or improve performance for a subset of services, it might need to consider withdrawing from (or charging for) other services.
5. Concluding remarks
Public spending in Wales – by both the UK and Welsh governments – was 15.4% higher per person than in England, and 7.5% higher per person than in the North East of England (the most comparable region) in 2024–25. This extra spending was not spread equally across all areas of spending though: spending on health (+9%) and education (+7%) is only a little higher than in England; in contrast, spending per person on recreation, culture and religion (+67%), housing and community amenities was (+63%), and adult social care services (+36% higher) is much higher.
Recent years have seen spending trends for smaller areas of spending differ significantly between Wales and England – with much bigger increases in spending on housing and community amenities in Wales, and much bigger increases in spending on transport in England, for instance. But for the largest areas of public service spending – health and schools – trends have been more similar, especially if we focus on the period since 2019–20, just before the pandemic. Between 2019–20 and 2024–25, for instance, health spending per person increased by 17% in real terms in Wales and 15% in real terms in England. School spending per pupil increased by 14% per person in both Wales and England between 2019–20 and 2025–26.
Service performance for the two largest areas of Welsh Government spending – health and education – is currently poor on both an historic basis and relative to England. For health, despite recent falls in waiting lists and waiting times, NHS performance remains substantially poorer than before the COVID-19 pandemic. Moreover, waiting times for pre-planned care are much higher than in England, and waiting times in A&Es are higher than in either England or Scotland, and have worsened in recent years. For education, Welsh teenagers perform worse than those in the rest of the UK in international tests, with this gap growing during the pandemic – and being evident right across the income distribution. School absences are up by more than England and Scotland, with the share of pupils absent on any given day up from 6% to 9% since 2019. And participation in both post-16 and higher education is below pre-pandemic levels – with just 59% of 17-year-olds in full-time education in 2024, down from 73% a decade earlier.
The causes of this poor performance are not fully clear. Funding levels seem unlikely to be a major factor given spending in Wales is higher than comparable areas of England and, as discussed above, has grown at similar rates since before the pandemic. High levels of deprivation can likely only explain part of it too. The performance of pupils from deprived backgrounds is lower in Wales than in similar or more highly deprived areas of England (Cardim-Dias and Sibieta, 2022). PISA scores in Wales are also lower across the income distribution than in England. Participation in higher education lags comparatively deprived regions of England. Instead, policies and the way services are delivered are likely to play a role. The average in-patient hospital stay in Wales was 6.7 days, around 40% longer than in England (NHS Wales, 2025; NHS England, 2025). All else equal, higher durations of stay will reduce the number of patients that can be admitted and treated. For education, accountability for poor performance may be weaker, and the scope for learning between schools more limited, in part because data on performance are less easily accessible. Research suggests the lack of school league tables in Wales has a negative (albeit small) effect on performance (Burgess et al, 2013). But more work is needed to diagnose the various reasons for and potential solutions to Wales’s poor public service performance. Doing this could be one of the defining successes – or failures – of the next Welsh Government.
Looking to the future, efforts to improve performance will take place in the context of tricky trade-offs between spending on different services. The 2026–27 Welsh Budget implies year-on-year real-terms cuts in health and social care spending of 2.2%, which is inconsistent with planned pay increases and maintaining – let alone improving – service quality. The UK government has, to some extent, ridden to the rescue, by providing an additional £322 million in funding as Wales’s population share of the amount being spent to write off English councils’ SEND deficits. This should allow the next Welsh Government to top-up health and social care spending. But as this funding is planned to be mostly one-off, it simply postpones the pain to later years.
Looking further ahead, increasing health and social care spending in line with the increases per person planned for England, and protecting housing and local government spending in real terms would, under current forecasts mean other services facing an average cut of 4.9% a year in real terms in 2027–28 and 2028–29. An increase in funding compared to current forecasts of £500 million by 2028–29, equivalent to a 1.25 percentage point increase in all devolved rates of income tax, would instead allow other services to see average real-terms increases in funding of 0.9% a year under such a scenario (or 0.3% if local government funding was also increased). However, a decrease in funding equivalent to a 1.25 percentage points reduction in all devolved rates of income tax by 2028–29 would require cuts to other services even if health and social care spending were held flat in real terms.
These scenarios therefore illustrate the stark reality facing the next Welsh Government. If it wants to reduce taxes or fund expansions in some services, it will not only need a laser-like focus on improving the efficiency of service delivery, but will also need to consider withdrawing from providing certain services (or start charging for them). Without such a hard-nosed approach, not only would the next Welsh Government struggle to improve the performance of core public services – but performance may further deteriorate.
References
Aucejo, E. M. and Romano, T. F., 2016. Assessing the effect of school days and absences on test score performance. Economics of Education Review, 55, 70–87, https://doi.org/10.1016/j.econedurev.2016.08.007.
Boileau, B., Brogaard, M. and Phillips, D., 2026. The IFS Scottish Budget Report 2026–27. IFS Report, https://ifs.org.uk/publications/ifs-scottish-budget-report-2026-27.
British Medical Association, 2025. Contract reform for resident doctors in Wales. https://www.bma.org.uk/our-campaigns/resident-doctor-campaigns/pay-in-wales/contract-reform-for-resident-doctors-in-wales.
Britton, J., Dearden, L., Waltmann, B. and van der Erve, L., 2020. The impact of undergraduate degrees on lifetime earnings. IFS Report, https://ifs.org.uk/publications/impact-undergraduate-degrees-lifetime-earnings.
Brogaard, M., Domínguez, M., Harvey-Rich, O., Phillips, D., Sibieta, L., Snape, D. and Warner, M., 2026. Public service spending and performance in Scotland. IFS Report, https://ifs.org.uk/publications/public-service-spending-and-performance-scotland.
Brogaard, M. and Phillips. D., 2026a. Recent changes and the future outlook for Welsh Government funding. IFS Report, https://ifs.org.uk/publications/recent-changes-and-future-outlook-welsh-government-funding.
Brogaard, M. and Phillips, D., 2026b. Recent changes and the future outlook for Scottish Government funding. IFS Report, https://ifs.org.uk/publications/recent-changes-and-future-outlook-scottish-government-funding.
Burgess, S., Wilson, D. and Worth, J., 2013. A natural experiment in school accountability: the impact of school performance information on pupil progress. Journal of Public Economics, 106, 57–67, https://www.sciencedirect.com/science/article/abs/pii/S0047272713001291.
Burtonshaw, S. and Dorrell, E., 2023. Listening to, and learning from, parents in the attendance crisis. Public First, https://impetus-org.files.svdcdn.com/production/assets/publications/Listening-to-and-learning-from-parents-in-the-attendance-crisis.pdf.
Cardim-Dias, J. and Sibieta, L. 2022. Inequalities in GCSE results across England and Wales. Education Policy Institute, https://epi.org.uk/wp-content/uploads/2022/07/Inequalities-in-Wales-and-England-EMBARGO-1.pdf.
Crehan, L., Badgeri, A., Carleton, C., Luck, B., Menzies, L., Morrish, D., Rushton, N. and Wall, P. 2025. Curriculum policy: international comparative review. Centre for Education Systems, https://www.ces.partners/curriculum-full-report.
Department for Education, 2025a. Education and training statistics for the UK, 2025. https://explore-education-statistics.service.gov.uk/find-statistics/education-and-training-statistics-for-the-uk/2025.
Department for Education, 2025b. Pupil absence in schools in England: 2023 to 2024. https://www.gov.uk/government/statistics/pupil-absence-in-schools-in-england-2023-to-2024.
Department for Education, 2025c. Participation in education, training and employment age 16 to 18. https://explore-education-statistics.service.gov.uk/find-statistics/participation-in-education-and-training-and-employment/2024.
Department for Education, 2026. Elective home education, Autumn term 2025/26. https://explore-education-statistics.service.gov.uk/find-statistics/elective-home-education/2025-26-autumn-term.
Department for Work and Pensions, 2025. Benefit expenditure and caseload tables 2025. https://www.gov.uk/government/publications/benefit-expenditure-and-caseload-tables-2025.
Digital Health and Care Wales, 2026. Secondary Care Activity Dashboard. https://dhcw.nhs.wales/data/statistical-publications-data-products-and-open-data/hospital-data/secondary-care-activity-dashboard22/.
Drakeford, M., 2025. Statement by the Cabinet Secretary for Finance and Welsh Language: the approach to the 2026–27 Budget. https://record.senedd.wales/Plenary/15175#A98445.
Farquharson, C., Ogden, K., Ornadel, N., Ridpath, N., Sibieta, L., Snape, D. and Tahir, I., 2026. Annual report on education spending in England: 2025–26. IFS Report, https://ifs.org.uk/publications/annual-report-education-spending-england-2025-26.
Goodman, J., 2014. Flaking out: student absences and snow days as disruptions of instructional time. National Bureau of Economic Research, Working Paper 20221, http://www.nber.org/papers/w20221.
Harvey-Rich, O. and Warner, M., 2025. Why isn’t hospital productivity growth bringing down the waiting list more quickly? IFS Comment, https://ifs.org.uk/articles/why-isnt-hospital-productivity-growth-bringing-down-waiting-list-more-quickly.
Health and Social Care Committee, 2025. NHS Wales waiting times – termly monitoring report. https://business.senedd.wales/documents/s168718/NHS%20waiting%20Times%20-monitoring%20report%20November%202025.pdf.
Health Foundation, 2025. Risk factors. https://www.health.org.uk/evidence-hub/risk-factors.
HMRC, 2024. Personal incomes statistics for the tax year 2022 to 2023. https://www.gov.uk/government/statistics/personal-incomes-statistics-for-the-tax-year-2022-to-2023.
HM Treasury, 2024. Country and regional analysis: 2024, https://www.gov.uk/government/statistics/country-and-regional-analysis-2024.
HM Treasury, 2025a. Country and regional analysis: 2025, https://www.gov.uk/government/statistics/country-and-regional-analysis-2025.
HM Treasury, 2025b. Budget 2025 document. https://www.gov.uk/government/publications/budget-2025-document.
HM Treasury, 2025c. Block grant transparency: October 2025. https://www.gov.uk/government/publications/block-grant-transparency-october-2025.
HM Treasury, 2026. Spring forecast 2026: the right economic plan for Britain. https://www.gov.uk/government/news/spring-forecast-2026-the-right-economic-plan-for-britain.
Long, R. and Danechi, S., 2023. Home education in England. House of Commons Library, https://researchbriefings.files.parliament.uk/documents/SN05108/SN05108.pdf.
Miles, J., 2026. Written statement: responding to the 39th NHS Pay Review Body. https://www.gov.wales/written-statement-responding-39th-nhs-pay-review-body.
NHS England, 2024. NHS productivity. https://www.england.nhs.uk/long-read/nhs-productivity/.
NHS England, 2025. Hospital admitted patient care activity, 2024–25. https://digital.nhs.uk/data-and-information/publications/statistical/hospital-admitted-patient-care-activity/2024-25.
NHS England, 2026a. Referral to treatment (RTT) waiting times. https://www.england.nhs.uk/statistics/statistical-work-areas/rtt-waiting-times/.
NHS England, 2026b. A&E attendances and emergency admissions. https://www.england.nhs.uk/statistics/statistical-work-areas/ae-waiting-times-and-activity/.
NHS England, 2026c. Provisional monthly hospital episode statistics for admitted patient care, outpatient and Accident and Emergency data. https://digital.nhs.uk/data-and-information/publications/statistical/provisional-monthly-hospital-episode-statistics-for-admitted-patient-care-outpatient-and-accident-and-emergency-data.
NHS England, 2026d. NHS workforce statistics. https://digital.nhs.uk/data-and-information/publications/statistical/nhs-workforce-statistics.
NHS Wales, 2025. APC statistics – data for the period 1st April 2004 to 31st March 2025. NHS hospital admitted patients – all Welsh providers. https://dhcw.nhs.wales/data/statistical-publications-data-products-and-open-data/annual-pedw-data-tables/hospital-admissions-publications-tables/headlines-figures-all-wales-providers-202425/?ts=1771503366149.
Office for Budget Responsibility, 2026. Welsh taxes outlook – January 2026. https://obr.uk/wto/welsh-taxes-outlook-january-2026/.
Office for National Statistics, 2023. General health, England and Wales: Census 2021. https://www.ons.gov.uk/peoplepopulationandcommunity/healthandsocialcare/healthandwellbeing/bulletins/generalhealthenglandandwales/census2021.
Office for National Statistics, 2024a. Country and regional public sector finances expenditure tables 2023. https://www.ons.gov.uk/economy/governmentpublicsectorandtaxes/publicsectorfinance/datasets/countryandregionalpublicsectorfinancesexpendituretables.
Office for National Statistics, 2024b. NHS planned care waiting times across the UK. https://www.ons.gov.uk/peoplepopulationandcommunity/healthandsocialcare/healthcaresystem/articles/nhsplannedcarewaitingtimesacrosstheuk/2024-06-18.
Office for National Statistics, 2024c. Accident and Emergency wait times across the UK: 2024. https://www.ons.gov.uk/peoplepopulationandcommunity/healthandsocialcare/healthcaresystem/articles/accidentandemergencywaittimesacrosstheuk/2024-02-28.
Office for National Statistics, 2025a. Estimates of the population for the UK, England, Wales, Scotland, and Northern Ireland. https://www.ons.gov.uk/peoplepopulationandcommunity/populationandmigration/populationestimates/datasets/populationestimatesforukenglandandwalesscotlandandnorthernireland.
Office for National Statistics, 2025b. Period expectation of life (ex), by single year of age. https://www.ons.gov.uk/peoplepopulationandcommunity/birthsdeathsandmarriages/lifeexpectancies/datasets/periodexpectationoflifeexbysingleyearofage.
Office for National Statistics, 2026. Healthy life expectancy, UK: between 2011 to 2013 and 2022 to 2024. https://www.ons.gov.uk/peoplepopulationandcommunity/healthandsocialcare/healthandlifeexpectancies/bulletins/healthstatelifeexpectanciesuk/between2011to2013and2022to2024#healthy-life-expectancy-at-national-and-regional-levels.
Parentkind, 2023. Understanding pupil absence in schools in Wales. https://www.parentkind.org.uk/assets/resources/20230706-WG-attendance-report-final.pdf.
Phillips. D., 2025. Welsh Draft Budget approach increased the risk of unaffordable election pledges. IFS Comment, https://ifs.org.uk/articles/welsh-draft-budget-approach-increased-risk-unaffordable-election-pledges.
Programme for International Student Assessment, 2022. PISA databases 2000–2022. https://www.oecd.org/en/about/programmes/pisa/pisa-data.html.
Public Health Scotland, 2026a. Accident and Emergency. https://publichealthscotland.scot/healthcare-system/urgent-and-unscheduled-care/accident-and-emergency/downloads-and-open-data/our-downloads/.
Public Health Scotland, 2026b. Acute hospital activity and NHS beds information (quarterly). https://publichealthscotland.scot/publications/acute-hospital-activity-and-nhs-beds-information-quarterly/acute-hospital-activity-and-nhs-beds-information-quarterly-quarter-ending-30-september-2025/data-summary/.
Public Health Wales, 2025. Public Health Outcomes Framework (PHOF 2025). https://phw.nhs.wales/services-and-teams/observatory/data-and-analysis/public-health-outcomes-framework/.
Scottish Government, 2026. School attendance and absence statistics. https://www.gov.scot/publications/school-attendance-and-absence-statistics/.
Sibieta, L., 2024. Major challenges for education in Wales. https://ifs.org.uk/publications/major-challenges-education-wales.
Sibieta, L. and Jerrim, J., 2021. A comparison of school institutions and policies across the UK. Education Policy Institute, https://epi.org.uk/publications-and-research/a-comparison-of-school-institutions-and-policies-across-the-uk/.
StatsWales, 2025a. Attendance and absence from schools: September 2024 to August 2025. https://www.gov.wales/attendance-and-absence-schools-september-2024-august-2025.
StatsWales, 2025b. Pupils educated other than at school: September 2024 to August 2025. https://www.gov.wales/pupils-educated-other-school-september-2024-august-2025-html.
StatsWales, 2025c. Estimated participation of 16 to 24 year olds in education and training by age group, gender, education mode and economic activity. https://stats.gov.wales/en-GB/58f02ed0-8e7f-4d14-96cd-c610f5f6994b.
StatsWales, 2025d. Participation of 16 to 30 year olds in education by mode, age and year. https://stats.gov.wales/en-GB/9b72ceaf-7b78-4888-8a7b-071c67b17602.
StatsWales, 2026a. NHS waiting lists: pathways waiting 26 weeks, 36 weeks, one year and two years, September 2011 onwards. https://stats.gov.wales/en-GB/3ef3a1d8-1467-4afe-ad60-4fc3d92228a1#data.
StatsWales, 2026b. Emergency departments: performance against waiting times targets, October 2009 onwards. https://stats.gov.wales/en-GB/d9cf3aca-7476-499e-a64a-287885aa67e5.
StatsWales, 2026c. Young people not in education, employment or trainings (NEET): October 2024 to September 2025. https://www.gov.wales/young-people-not-education-employment-or-training-neet-october-2024-september-2025-html.
StatsWales, 2026d. NHS workforce: staff directly employed by NHS Wales. https://www.gov.wales/nhs-workforce-staff-directly-employed-nhs-wales-30-september-2025-html.
Stiebahl, S., 2025. Obesity statistics. House of Commons Library, Research briefing, https://researchbriefings.files.parliament.uk/documents/SN03336/SN03336.pdf.
TURAS Data Intelligence, 2025. NHS Scotland official workforce statistics. https://turasdata.nes.nhs.scot/data-and-reports/official-workforce-statistics/?pageid=1243.
UCAS, 2025. UCAS undergraduate end of cycle data resources 2025. https://www.ucas.com/data-and-analysis/undergraduate-statistics-and-reports/ucas-undergraduate-end-of-cycle-data-resources-2025.
Welsh Government, 2021. A healthier Wales: our Plan for Health and Social Care. https://www.gov.wales/sites/default/files/publications/2021-09/a-healthier-wales-our-plan-for-health-and-social-care.pdf.
Welsh Government, 2022. Our programme for transforming and modernising planned care and reducing waiting lists in Wales. https://www.gov.wales/sites/default/files/publications/2022-04/our-programme-for-transforming--and-modernising-planned-care-and-reducing-waiting-lists-in-wales.pdf.
Welsh Government, 2025a. Wellbeing of Wales 2025. https://www.gov.wales/wellbeing-wales-2025-progress-towards-national-milestones-html.
Welsh Government, 2025b. Draft Budget 2026 to 2027. https://www.gov.wales/draft-budget-2026-2027.
Welsh Government, 2025c. 1st Supplementary Budget 2025 to 2026. https://www.gov.wales/1st-supplementary-budget-2025-2026.
Welsh Government, 2026a. Final Budget 2026 to 2027. https://www.gov.wales/final-budget-2026-2027.
Welsh Government, 2026b. 2nd Supplementary Budget 2025 to 2026. https://www.gov.wales/2nd-supplementary-budget-2025-2026.
Welsh Government, 2026c. Report on outturn 2024 to 2025. https://www.gov.wales/report-outturn-2024-2025.
Acknowledgements
This report is the second in a series of Welsh election briefings funded by the Nuffield Foundation (grant reference WEL/FR-000026348). Co-funding from the Economic and Social Research Council (ESRC) through the Centre for the Microeconomic Analysis of Public Policy is also gratefully acknowledged (grant reference ES/Z504634/1).
The Nuffield Foundation is an independent charitable trust with a mission to advance social well-being. It funds and undertakes rigorous research, encourages innovation and supports the use of sound evidence to inform social and economic policy, and improve people’s lives. The Nuffield Foundation is the founder and co-funder of the Nuffield Council on Bioethics, the Ada Lovelace Institute and the Nuffield Family Justice Observatory. Find out more at www.nuffieldfoundation.org.
The authors thank Anvar Sarygulov (Nuffield Foundation) and Ben Zaranko (IFS) for helpful comments and suggestions. All views expressed and any errors or omissions are the responsibility of the authors alone, and not necessarily representative of the views of the Nuffield Foundation or its trustees or staff.
Endnotes
Authors

Martin Brogaard
Martin joined the IFS in 2025 and works in the IOD sector, researching consumer behaviour and nutrition. He also works on devolved government policy.

Magdalena Domínguez
Magdalena is a Senior Research Economist at the IFS. Her research focuses on issues related to the economics of crime, networks & place-based policies

Olly Harvey-Rich
Olly joined the IFS in 2024 and works in the Healthcare sector.

David Phillips
David is Head of Devolved and Local Government Finance. He also works on tax in developing countries as part of our TaxDev centre.

Luke Sibieta
Luke is a Research Fellow at the IFS and his general research interests include education policy, political economy and poverty and inequality.

Darcey Snape
Darcey joined the IFS in 2024 as a research economist in the Education and Skills sector.

Max Warner
Max joined the IFS in 2020. His work covers health and social care, public spending and public sector productivity.
More from IFS
Understand this issue


Policy analysis


Academic research