Downloads
Download the report as a PDF
PDF | 686.69 KB
Update notice
Updated funding assumptions
Since the initial publication of this report, changes in government funding decisions have affected several of the figures presented. The main report has not been updated to reflect these but here we provide a summary of the main changes.
First, the Welsh Government updated its reserve drawdown assumptions for 2025–26 in the Second Supplementary Budget. The government has decided to fully draw down £286 million from the Welsh Reserve in 2025–26. This change affects a number of both historical (backward-looking) and projected (forward-looking) figures in the report.
Second, alongside the 2026 Spring Forecast, the UK government confirmed additional funding for special education needs and disabilities (SEND) spending in England – including writing-off 90% of local authorities’ historic SEND deficits – and a few other items between 2026–27 and 2028–29. This generates Barnett consequentials for the Welsh Government, which affects some of our forward-looking projections.
Taking these updates into account, our revised findings are:
- After adjusting for changes in responsibilities over time, Welsh Government funding in 2025–26 is projected to be 18.3% higher in real terms than in 2019–20 (previously estimated at 16.3%). On a per-person basis, and after accounting for population growth, this represents an increase of 13.8% (previously 11.9%).
- On as close to a like-for-like basis as possible, Welsh Government resource funding in 2025–26 will be 15.0% higher in real terms than in 2010–11 (previously 13.0%). After accounting for population growth, this equates to 9.6% higher funding per person (previously 7.4%).
- Official forecasts now show average real-terms growth of 1.0% per year over the next three years (previously 1.1%). Growth is expected to be 1.8% in 2026–27 (previously 1.4%), followed by average growth of 0.6% per year in the subsequent two years (previously 1.0%).
These revised figures reflect the funding changes described above. However, the report itself has not been updated, so the charts and figures in the report will not reflect these revisions.
Assessing Wales’s relative funding and spending
How the funding received by the Welsh Government, and how the amount spent in Wales on devolved responsibilities, compare both to England and to assessments of Wales’s spending needs are important to assessing the UK’s subnational fiscal framework and the Welsh Government’s performance. For example, if on a range of measures services are performing better or worse in Wales than England, information on how funding and spending compares to spending needs helps identify whether funding (or other factors) is a factor likely to be underlying this.
Section 5 of this report provides an estimate of how much the Welsh Government receives in funding per person as a percentage of the amount the UK government spends per person on comparable responsibilities in England. This estimate is based on the methodology used by HM Treasury both in its periodic analysis of relative funding, and in the approach set out in the fiscal framework agreement agreed with the Welsh Government for assessing whether Welsh Government funding is higher or lower than 115% of comparable spending per person in England. The method uses the departmental expenditure limits (DELs) set by HM Treasury, and the comparability factors used in the Barnett formula (which in turn are estimates of the share of spending by departments which relate to spending in England, which in the case of Wales is devolved) to estimate comparable spending in England. After making some adjustments for how business rates are accounted for in England and Wales, these estimates of comparable English spending can then be compared to the Welsh Government’s funding.
Using this long-standing official approach, we estimate that in 2024–25 the Welsh Government’s funding per person from the UK government was equivalent to 124.5% of the amount departments spent per person on comparable services in England. Accounting for devolved revenues (such as net revenue from the Welsh rates of income tax), the figure increases to 126.8%. These estimates, based on the official HM Treasury methodology, therefore suggest that the Welsh Government receives substantially higher funding relative to England than the Holtham Commission’s 2010 estimates of Wales’s relative needs (114 – 117%) would imply it would require.
HM Treasury also publishes data in its Country and Regional Analysis (CRA) publication on the amount spent in England and Wales. By carefully selecting specific line items of expenditure, it is possible to approximate the amount spent in Wales and in England on the services that are devolved to the Welsh Government. This is the approach taken in a Wales Governance Centre report published since our report, which estimates that the amount spent per person in Wales on such services by the Welsh Government and Welsh local authorities is 115% of the amount spent by the UK government and English local authorities in England – in line with the Holtham Commission’s estimates of relative spending needs.
This alternative figure includes spending funded by council tax – which is roughly a similar cash amount per person in England and Wales, and should arguably be excluded from the comparison (because the Holtham Commission’s estimates of needs are for needs excluding council tax-funded services). Adjusting for this would raise the Wales Governance Centre’s estimates by 2 percentage points. UK government departments and agencies also spend a small amount of money in the devolved service areas the Wales Governance Centre focuses on (1.5% of all spending on these services) – this spending is excluded from their definition of devolved Welsh spending (which is spending by the Welsh Government and Welsh local authorities only) but implicitly included in the English spending it is being compared to. If a similar amount per person in spent on these types of services in England as in Wales, accounting for this would raise Wales Governance Centre’s estimates by a further 1.5 percentage points or so. Taking account of both of these would therefore mean the Welsh Government’s relative funding slightly exceeded the Holtham Commission’s estimates of its relative needs. The measure of spending included in the Country and Regional Analysis database is also different (total identifiable expenditure on services, TIES) to that used in the HM Treasury methodology (DELs). If spending on areas of spending in TIES but not in DEL (such as council borrowing, or certain public sector pension scheme spending) is higher in England than Wales, that would also explain part of the discrepancy between the two sets of estimates of relative funding/spending.
Nevertheless, CRA-based spending estimates of 115 – 120% of English levels per person are substantially lower than the funding estimates implied by the HM Treasury approach (the approach used in our report). Given the salience of estimates of relative funding and spending in Wales to political and policy debate, the UK and Welsh governments should examine the reasons for these differences. The conclusions of this analysis should be published. It may be concluded that the existing HM Treasury methodology is more appropriate, in which case information on why this is the case should be published. On the other hand, if the analysis suggests that CRA-based data would be a more appropriate data source for assessing Wales’s relative funding – with appropriate adjustments for council tax, etc. – this change should be adopted. As it stands we have two seemingly reasonable methodologies giving substantially different estimates, which is an unsatisfactory situation.
Executive summary
The funding available to the Welsh Government determines the choices available to it – including what services to provide, and where to ask for co-payments from service recipients. Such choices especially affect households on low and middle incomes, and particularly those in poverty or with higher needs, for whom the in-kind consumption provided by public services generally represents a larger share of their overall consumption. This makes government spending – and the funding which pays for it – a more important determinant of low- and middle-income households’ living standards and life chances.
In contrast with most of the 2010s, the period since 2020 has seen real-terms increases in the Welsh Government’s funding for both day-to-day (resource) spending and investment (capital) spending. However, increases in resource funding are set to slow significantly and capital funding is set to fall over the next few years, which will mean tough choices over tax and spending allocation for the next government.
Key findings
Funding for day-to-day (resource) spending
- In 2025–26, Welsh Government funding for day-to-day (resource) spending is forecast to amount to £23.1 billion. Around four-fifths of this (79%) is provided by the UK government, largely in the form of a block grant that the Welsh Government is free to allocate across devolved services in line with its own priorities. Devolved taxes – the most significant of which is revenues from the Welsh rates of income tax – make up the remaining 21% of Welsh Government funding. While devolved tax revenues make up a growing share of funding, changes in UK government funding continue to be the biggest factor in driving trends in the overall level of resources available to the Welsh Government.
- Adjusting for changes in responsibilities over time, Welsh Government funding in 2025–26 is set to be 16.3% higher in real terms than in 2019–20, just prior to the COVID-19 pandemic. This is equivalent to an increase of 11.9% per person, after accounting for population growth.
- The increase in Welsh Government funding since 2019–20 follows cuts to funding during the 2010s. Bearing in mind that long-run comparisons should be seen as indicative rather than definitive, we estimate that, on as close to a like-for-like basis as possible, Welsh Government resource funding in 2025–26 will be 13.0% higher in real terms than in 2010–11, or 7.4% higher per person after accounting for population growth.
- Changes in UK government funding have driven the overwhelming majority of the changes in total funding for the Welsh Government since 2010–11, and in the more recent period since 2019–20. But the taxes that were devolved in the late 2010s (part of income tax, land transactions tax and landfill tax) have made a growing contribution to Welsh Government funding over time. The Welsh rates of income tax, for instance, are forecast to raise a net £0.2 billion in revenues for the Welsh Government this year, despite no changes having been made to tax rates inherited from the UK government. This reflects the fact that recent and ongoing freezes in tax thresholds raise relatively more in Wales because of the shape of the Welsh income distribution.
- Looking ahead, increases in Welsh Government resource funding are set to slow, driven by UK government decisions to hold down spending growth in order to reduce a sizeable budget deficit. Official forecasts show real-terms growth averaging 1.1% per year over the next three years – less than half of the average increase seen over the last six years. There is significant uncertainty around these forecasts, though. On the one hand, for instance, the UK government may top up its spending plans as the UK general election approaches, which would generate additional funding for the Welsh Government. On the other hand, tax revenues could disappoint existing forecasts if the Welsh economy lags that of the rest of the UK.
Funding for investment (capital) spending
- The Welsh Government funds its investment (capital) spending through a combination of UK government funding and devolved borrowing and reserves powers. After falling in the early 2010s, capital funding has grown substantially: on as close to a like-for-like basis as possible, we estimate it to be 26.6% higher in 2025–26 than in 2010–11, and 37.5% higher than in 2019–20. The biggest driver of changes in overall capital funding over time has been changes in UK government funding, although Welsh Government has used borrowing to boost capital spending power by an average of 2.8% – or a total of £0.7 billion in real terms – since it has had the power to do so.
- Looking ahead, after increasing in 2026–27, capital funding is set to fall in real terms over the following three years, driven by a reduction in UK government funding. This will be the case even if the Welsh Government makes full use of its borrowing powers. If it does, we estimate that capital funding in 2029–30 will be 5.0% lower in real terms than in 2025–26.
Comparisons with England
- The Welsh Government received around 25% more UK government funding per resident than is spent on comparable services in England as of 2024–25. Devolved funding sources provided a further 2.3 percentage points, in part reflecting the aforementioned favourable income tax revenue position. There are no up-to-date official estimates of Wales’s spending needs relative to England. But an assessment by the Holtham Commission using data from the late 2000s suggested Wales’s needs were around 14% to 17% higher than England’s at that time. On the basis of these figures, needs-based funding would mean a reduction rather than increase in funding for the Welsh Government. However, given that the Holtham Commission’s estimates are based on data which is now almost two decades old, an updated needs assessment should be undertaken, which could change the picture.
- This is particularly important given trends in Wales’s relative funding levels. After increasing during the 2010s, Welsh Government funding is now falling relative to comparable spending in England, and will fall to 21% higher than England by 2028–29. This is the result of the so-called ‘Barnett squeeze’: the tendency of the Barnett formula to deliver smaller percentage changes in funding for Wales given Wales’s higher levels of funding to start with. A Welsh top-up to the Barnett formula introduced in 2018 means this squeeze is less significant than in Scotland. But it is still the case that without substantial increases in devolved revenues, or improvements in public sector efficiency, the Barnett squeeze could mean it is hard to avoid services deteriorating relative to England.
1. How is Welsh Government resource spending funded?
When it was set up in 1999, the Welsh Government1 received almost all of its funding in the form of a block grant from the UK government. This was true for both day-to-day (resource) spending on managing and delivering services, and investment (capital) spending. This reflected the fact that nearly all the taxes paid by people and businesses in Wales went to the UK government, which used them to help pay for the block grant and its own spending in or on behalf of Wales (such as on UK-wide working-age social security, state pensions and defence).
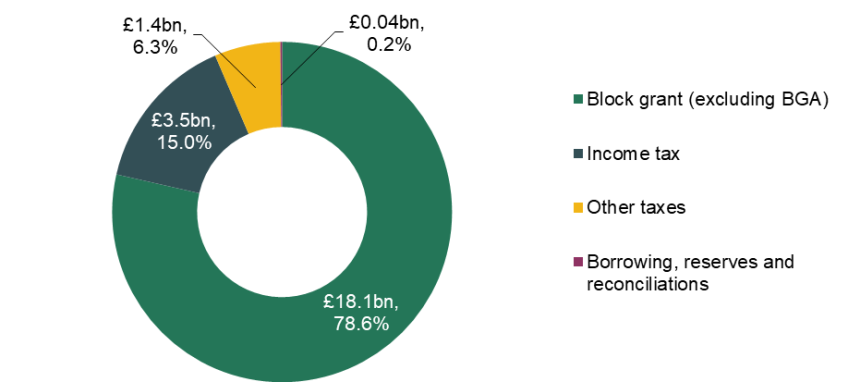
However, fiscal devolution in the second half of the 2010s has resulted in the Welsh Government setting and keeping more of its own taxes, including land transactions tax (paid on the purchase of real estate), landfill disposals tax and a proportion of income tax. Figure 1 shows that together with business rates, which have been fully devolved since 2015, these taxes are forecast to contribute around 21.3% of the Welsh Government’s funding for resource spending in 2025–26, with the majority of this (15.0 percentage points) coming from income tax. We discuss the sources of funding for capital spending in Section 4.
Figure 1. Sources of Welsh Government resource funding, 2025–26
Note: Block grant (excluding BGA) is the block grant after subtraction of tax BGAs.
Source: Author’s calculations using HM Treasury (2025a) and Welsh Government (2025).
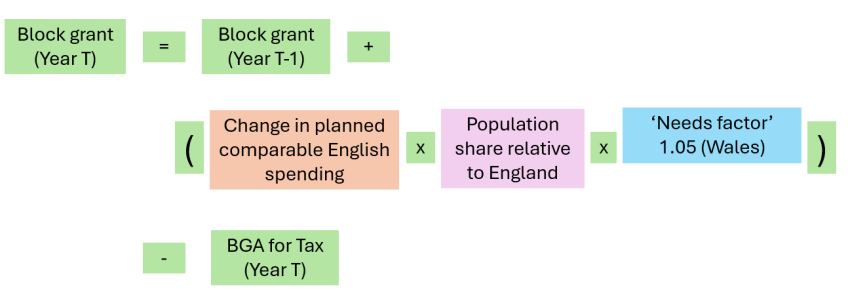
It remains the case that the majority of funding comes in the form of a block grant from the UK government, though: 78.6% after accounting for the block grant adjustments (BGAs) made to reflect the devolution of tax revenues to the Welsh Government. The level of this grant is determined as follows, and as shown in Figure 2.
Figure 2. The calculation of Welsh Government block grant funding
Source: Authors’ summary of block grant calculations.
- First, the amount of block funding that would be due in the absence of fiscal devolution is calculated using the Barnett formula. This is equal to the block grant from the previous year plus an amount equal to 105% of Wales’s population share of any change in UK government funding on services in England that in Wales’s case are devolved. This differs to the situation in Scotland (where the Barnett formula provides a 100% population share of changes in English spending) because of the inclusion of a 5% needs-based uplift to the standard Barnett formula introduced in 2018 (see Section 5).
- Second, an adjustment is made for the taxes that are devolved to the Welsh Government. When these taxes were first devolved, an amount equal to the revenues being devolved was deducted as a BGA. Subsequently, these BGAs have been updated each year according to a formula based on Wales’s share of the relevant tax base prior to devolution, population share, and changes in tax bases (for income tax) or revenues (for the other devolved taxes) in England and Northern Ireland. Together, this means that the Welsh Government receives more revenue than it would in the absence of tax devolution if tax bases (for income tax) or revenues (for the other devolved taxes) grow faster than in the rest of the UK, and vice versa – whether these differences are the result of policy changes, or underlying economic performance. The aim of this is three-fold:
- to help ensure that tax changes applying only in the rest of the UK do not benefit or cost residents of Wales;
- to give the Welsh Government a stronger financial incentive to boost economic performance – it retains the additional revenue generated from devolved taxes resulting from better economic performance, and bears the losses resulting from poorer economic performance;
- to insulate the Welsh Government’s funding from the ups and downs of economic cycles affecting the whole of the UK – the resulting ups and downs in Welsh revenues are offset by changes in the BGAs.
Even though this ‘fiscal framework’ offers protection from economic cycles and shocks affecting the whole of the UK, the Welsh Government is still exposed to more funding risk than before fiscal devolution. To help it address these risks, the Welsh Government is able to pay money into, and draw down from, its reserves. It is also able to borrow if revenues turn out to be lower than forecast, and if the associated BGAs also turn out to differ from forecasts (e.g. because tax revenues grow more strongly than expected in the rest of the UK, meaning a higher-than-expected BGA).
The total amount that can be held in the Welsh Reserve is currently capped at £734 million. This limit is to be increased by 10% in 2026–27 and then uprated in line with inflation each year.
Borrowing is also subject to strict limits. The Welsh Government can currently borrow up to £629 million in a year to cover forecast errors, subject to a cap on outstanding debt of just over £1.8 billion. The annual limit is equivalent to 2.7% of the Welsh Government’s resource funding, and 16.4% of the devolved tax revenues the borrowing powers relate to. Both limits are again uprated each year in line with inflation.
Further information on the Welsh Government’s funding, the Barnett formula, BGAs and borrowing and reserves powers can be found in our online explainers,2 and within the Welsh fiscal framework agreement (HM Government and Welsh Government, 2016).
2. How and why has funding for resource spending changed?
All told, the Welsh Government’s resource funding is set to amount to £23.1 billion in 2025–26. In principle, the Welsh Government could access a further £0.3 billion in funding by drawing down reserves in full – but the plan is to utilise these in future years instead, as discussed in Sections 3 and 4 of this report.
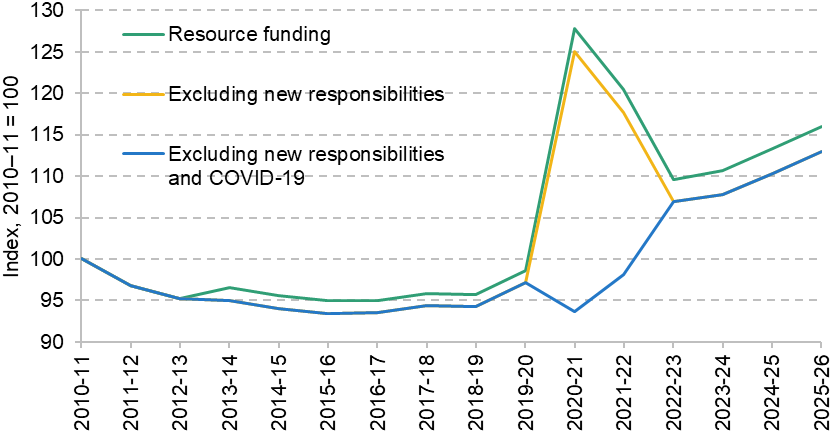
Figure 3 shows how this funding compares with previous years, separating out funding received during 2020–21 and 2021–22 to help respond to the COVID-19 pandemic, and funding for new responsibilities (such as post-Brexit agricultural payments). Amounts are normalised to 100 in 2010–11 and adjusted for inflation so that it is easier to see the real-terms changes that have taken place over the last 15 years. A number of adjustments have been made to make the figures more consistent over time (e.g. attempting to strip out the effect of changes in accounting definitions). Further information on these changes can be found in a methodology appendix.
Figure 3. Welsh Government resource funding, 2010–11 to 2025–26, adjusted for inflation (2010–11 = 100)
Note: See the appendix for adjustments.
Source: Authors’ calculations using HM Treasury (2014, 2018, 2025a), Welsh Government (2018, 2020–2026) and correspondences with the Welsh Government.
The figure illustrates the following.
- Between 2010–11 and 2017–18, Welsh Government resource funding fell by 4.1% in real terms, or 5.6% after adjusting for changes in responsibilities.
- Between 2017–18 and 2019–20, funding grew by approximately 3.0% in real terms. This means that on the eve of the COVID-19 pandemic, funding was 2.8% lower than in 2010–11 in real terms, adjusting for changes in responsibilities.
- In 2020–21 and 2021–22, there was a surge in funding provided in response to the COVID–19 pandemic. Including this, but excluding money for new responsibilities, funding was 25.0% higher than 2010–11 levels in the first full year of the pandemic (2020–21) and 17.7% higher in the second full year (2021–22).
- While temporary COVID-19 funding was withdrawn at the start of 2022–23, core resource funding (excluding funding for new responsibilities) increased between 2021–22 and 2025–26. By 2025–26, core resource funding is set to be 16.3% higher than in 2019–20 and 13.0% higher than 2010–11.
After adjusting for population growth, core resource funding (excluding funding for new responsibilities) in 2025–26 is set to be 11.9% higher per person in real terms than in 2019–20 and 7.4% higher per person in real terms than 2010–11.
Changes in UK government funding
The biggest factor underlying these changes in overall funding is changes in the funding received from the UK government.
The early-to-mid 2010s saw substantial cuts to UK government funding – more so than Scotland and Northern Ireland, which benefited from a flaw in the Barnett formula that accidentally shielded them from the impact of cuts to funding for English local government (Phillips, 2014).
Starting in the late 2010s, UK government funding began to increase in real terms again – in part because initial spending plans have been topped up as demand and cost pressures have become clearer (or less avoidable). This includes the period following the 2015 Spending Review (covering 2016–17 to 2019–20), the 2019 and 2020 Spending Rounds (covering 2020–21 and 2021–22, respectively, during which the UK government provided £8.4 billion of top-ups to Wales to address the COVID-19 pandemic) and the 2021 Spending Review.
Top-ups made by both the Conservative and Labour UK administrations increased the size of the resource block grant in 2024–25 by around 11% compared to the figure originally announced in the 2021 Spending Review.3 These increases compensated – albeit only just – for higher than expected economy-wide inflation over this period,4 although parts of the public sector have faced increases in input costs significantly exceeding economy-wide inflation over this period, not least big increases in the National Living Wage – see Ogden and Phillips (2024) for examples for English councils.
Overall, funding from the UK government is forecast to have increased by 17.6% in real terms between 2019–20 and 2025–26, excluding that provided for new responsibilities such as post-Brexit agricultural support. This makes up all of the £3.2 billion real-terms increase in funding for existing responsibilities over this period.
The role of devolved policies and powers
While it is changes in UK government funding that have had by far the biggest impact on Welsh Government funding, devolved revenues have also changed – albeit in different ways for different sources.
Revenues from business rates, for instance, are estimated to have fallen by 20% in real terms, reflecting freezes for some or all ratepayers in some years over this period, as well as an increase in the scope of rates reliefs for certain types of businesses. This is a real-terms fall of almost £300 million.
The net contribution of Wales’s other devolved taxes has increased by around £300 million though, offsetting the fall in business rates revenues.
The net contribution of income tax was zero in 2019–20,5 and increased to around £200 million in 2025–26,6 or £254 million when accounting for a reconciliation payment for errors in the initial forecasts for the net contribution of income tax in 2022–23. This is despite Wales having made no changes to income tax rates relative to those set by the UK government. The main factor underlying this is the freezes in income tax thresholds implemented by the UK government: lower taxable incomes in Wales mean that these freezes lead to a bigger percentage increase in the average amount of tax paid by taxpayers in each of the three income tax bands (basic rate, higher rate and additional rate) that still apply in Wales. In turn, this leads to Welsh income tax revenues from each band growing more quickly than the associated BGA for each income tax band – boosting the net income tax position (Office for Budget Responsibility, 2026).
The net contribution from land transactions tax and landfill disposal tax has also increased – from a combined £39 million in 2019–20 to £63 million in 2025–26,7 or to £69 million when accounting for reconciliation payments for errors in the forecasts for the BGAs for these taxes in 2022–23.
3. What is the outlook for resource funding?
After several years during which resource funding has grown at a decent pace, growth in funding is set to slow significantly over the next few years, posing budgetary challenges for the next Welsh Government. These must be borne in mind when assessing the spending and policy proposals set out by both current Ministers and opposition parties.
UK government funding
The main contributor to this slowdown is again UK government funding.
As discussed in the previous section, the Labour government elected in July 2024 topped up the spending plans it inherited substantially, leading to substantial increases in funding for the Scottish Government in 2024–25 and 2025–26. Spending plans – and hence Welsh Government funding – for 2026–27 onwards were topped up too, but the year-on-year rate of increase is slowing substantially. As in the 2010s, this is part of an effort to reduce borrowing and slow the rise in government debt – although tax increases (such as increases in employers’ National Insurance contributions and freezes in tax thresholds) are playing a larger role now than in that previous period of fiscal tightening.
The green bars in Figure 4 show the year-on-year increases in UK government funding over the next three years. The figure shows UK government funding increasing by around £200 million in real terms in 2026–27, and by an average of around £150 million in the following two years. As shown in Figure 5, this equates to real terms increases of 0.9% in 2026–27 and an average of 0.7% in 2027–28 and 2028–29. This is around a third of the average rate of growth in the period since 2019–20 and will necessitate difficult trade-offs in funding between different services – an issue we will explore in our next Welsh election briefing note on public service spending and performance.
Figure 4. Forecasted year-on-year real-terms changes in funding sources (£ million, 2025–26 prices)

Note: ‘Net tax, borrowing and reserves’ includes: net revenues from income tax, land transaction tax, land disposals tax; new resource borrowing minus debt servicing costs; net reserve drawdowns; and reconciliations from past forecast errors.
Source: Authors’ calculations using HM Treasury (2025a), Office for Budget Responsibility (2026) and Welsh Government (2025, 2026).
Figure 5. Forecasted year-on-year real-terms percentage changes in funding

Source: Authors’ calculations using HM Treasury (2025a), Office for Budget Responsibility (2026) and Welsh Government (2025, 2026).
The role of devolved policies and powers
Official forecasts show increasing devolved tax revenues partially offsetting the slowdown in UK government funding, despite no tax policy changes currently being planned, except for business rates.
After falling over the last six years, business rates revenues (in purple in Figure 4) are forecast to increase in real terms over the next three years, as funded-reliefs for the retail, hospitality and leisure sector are replaced largely by lower tax rates funded by higher bills on larger properties. The increase amounts to around £75 million (7%) in real terms by 2028–29.
The net contribution from other taxes (in yellow in Figure 4) is also forecast to increase in real terms each year over the next three years. This is driven by further increases in the net income tax revenue position, partially offset by a decline in the contribution of land transactions tax. The continued freezes in income tax thresholds by the UK government are forecast to increase the net contribution of devolved income tax revenues to £450 million by 2028–29 (up from £200 million initially forecast for this year). In addition, outturn data for 2023–24 and upwards revisions to forecast revenues in 2024–25 and 2025–26 mean positive reconciliation payments for past income tax revenue forecast errors: a confirmed £124 million in 2026–27, and a forecast £100 million and £94 million in the following two years. This is a reminder that tax devolution can affect the funding devolved governments receive even if they do not make changes to tax policy. In Wales’s case, this effect has and is forecast to continue to be positive, with threshold freezes boosting revenues faster than the offsetting BGAs. In Scotland, the effect is negative, reflecting slower growth in earnings since tax devolution (Brogaard and Phillips, 2026; Scottish Fiscal Commission, 2026), as well as a different approach to updating the BGAs.8
Overall funding outlook – and risks to it
Accounting for these devolved funding sources, Figure 5 shows that overall Welsh Government resource funding is currently forecast to increase by an average 1.1% a year in real terms over the next three years, with the increases front-loaded: 1.4% in 2026–27, and an average of 1.0% in the following two years. Unlike the Scottish Government, which has published high-level spending plans for the next three years as part of a Spending Review, the Welsh Government has not published plans for beyond 2026–27. We will examine the trade-offs the next Welsh Government will face when allocating spending in our next Welsh election briefing note (on public service spending and performance).
It is important to note that the funding outlook could change substantially. The UK government may change its spending plans, in turn affecting the funding the Welsh Government receives via the Barnett formula. IFS researchers have previously highlighted how tight UK government plans in 2028–29 and indicative overall spending totals in 2029–30 look, especially in the context of a UK general election taking place in summer 2029 at the latest.9 If the UK government topped up its spending plans, then this would help ease the fiscal trade-offs facing the next Welsh Government.
In contrast to Scotland, where forecasts for an increase in the net revenue contribution of income tax are driven largely by an implicit assumption that earnings growth will outpace growth in the rest of the UK (Brogaard and Phillips, 2026), forecast growth in the net income tax revenue position in Wales is driven by UK government policy: the continued freeze in tax thresholds. These freezes may raise more or less than currently forecast if inflation (and nominal income growth) is higher or lower than forecast, meaning there is both upside and downside risk. If the UK government decided to unfreeze thresholds before April 2031, then this would likely reduce the net revenue position for the Welsh rates of income tax.
This uncertainty means that if the next Welsh Government does undertake a multi-year spending review, it should build in some flexibility to respond to both upside and downside funding risks – perhaps by holding back some funding in reserve to allocate or remove when things become clearer down the line.
4. What about funding for capital investment?
So far we have focused on the Welsh Government’s resource funding – that is the funding it uses to pay for the day-to-day operation of public services and to pay benefits to households. Capital funding for investment in buildings, equipment, infrastructure and research has followed a different path over the past 15 years. And it’s set to fall slightly over the next few years – although will still remain at historically high levels.
This section focuses on standard capital funding, which can be invested in new infrastructure, facilities, equipment, and research and development. In addition, since 2012–13, the Welsh Government has received ‘financial transactions capital’, which is ring-fenced for lending to the private sector, including via the Development Bank of Wales, and schemes to support homebuyers and developers (such as the ongoing Help to Buy Wales scheme). The total financial transactions capital funding received between 2012–13 and this year is £3.4 billion in real terms. Of this, 80% will have to be repaid to the UK government, while the remainder can be recycled indefinitely into further loans as loans are repaid. Current plans imply an additional £0.6 billion of funding between 2026–27 and 2029–30, but changes in rules mean that this can all be recycled in to further loans in future (Feeney-Seale, 2026). This change will enable the Welsh Government to make increasingly large loans over time to the private sector (albeit subject to state aid rules).
Recent trends in capital funding
As with resource funding, Welsh Government capital funding was reduced in the (early) 2010s and has increased since the late 2010s – again driven largely by changes in UK government funding. Figure 6 shows that:
Figure 6. Welsh Government capital funding, 2010–11 to 2025–26, adjusted for inflation (2010–11 = 100)

Note: ‘Block grant’ includes City Deals and adjustments made for IFRS16 accounting changes.
Source: Authors’ calculations using HM Treasury (2014, 2018, 2025a), Welsh Government (2018–2026) and correspondences with the Welsh Government.
- Large cuts to capital spending by UK government departments meant block grant capital funding was reduced by a third in real terms between 2010–11 and 2013–14 (with most of this cut taking place in just one year, 2011–12) – a level it hovered just above during the mid-2010s.
- As the UK government ramped its investment spending back up in the late 2010s, block grant capital funding returned to 94% of its 2010–11 levels by 2019–20.10
- Increases over the last six years mean that block grant capital funding in 2025–26 is set to be around 29% higher than in 2019–20 and 21% higher than in 2010–11 – although as the figure illustrates there was a bit of a dip in capital funding between 2022–23 and 2024–25. This reflects two factors. First, the Welsh Government asked to switch a particularly large part of its UK government funding from resource to capital in 2020–21 and 2021–22, to avoid underspending its COVID-19 funding allocations (and avoid low-value resource spending). When these switches returned to more normal levels in 2022–23, capital funding fell back. Second is higher-than-expected inflation in 2022 and 2023: whereas UK government resource spending and hence the resource block grant was topped up to compensate for this, the same was not true for capital spending and funding. This will have stymied public investment, but topping up UK capital spending and capital block grant funding over this period would have increased UK government borrowing further.
The outlook for capital funding
Looking to the future, Welsh Government capital funding (excluding financial transactions funding) is set to increase by 2.6% in real terms in 2026–27.11 This is driven by an increase in UK government funding (2.4% in real terms).
From 2027–28 onwards, capital funding from the UK government is set to fall – by a total of 5.1% over the three years to 2029–30.12 The outlook for total capital funding is less clear as unlike the Scottish Government, the Welsh Government has not published even indicative plans for borrowing and reserve movements for years after 2026–27. Assuming that the Welsh Government makes full use of its borrowing powers (as it plans to in 2026–27), but make no use of capital reserve funding, total capital funding would be 7.4% lower in 2029–30 than in 2026–27. But it would still be at relatively high levels by historical standards.
Off-budget borrowing via public–private partnerships
Recent years have seen the Welsh Government utilise its so-called ‘Mutual Investment Model’ to utilise private sector borrowing to boost capital investment. Under this model, which shares some similarities with historic programmes such as the Private Finance Initiative (PFI), the private sector borrows to pay for new infrastructure and facilities, with the government covering the cost of this investment and annual service charges through resource budgets.13 Schemes funded by this approach include the dualling of 17.7 km of the A465 road from Dowlais to Hirwaun, a new cancer treatment centre in Cardiff, and a series of new education facilities across Wales (Welsh Government, 2024). These projects have a combined capital value of up to £1.4 billion. The A465 and cancer centre programmes had a capital value of £0.9 billion, with annual repayment and service charges initially set at £38 million and £34 million plus VAT, for 30 and 25 years, respectively (the service part of the charges will rise with inflation).
The cancer treatment and education facilities programme are ongoing. But it is unclear at this stage whether further investments will be made using this model in the coming years. If they are not, once the existing programmes wrap up, the total fall in publicly financed investment will be larger than the fall in capital funding outlined above (because some of the reduction would instead be reflected in reduced service charges paid for using future resource funding).
Given constraints on direct government borrowing under the Welsh fiscal framework, use of the Mutual Investment Model can help deliver such facilities more quickly. However, an official assessment for the Scottish Government prior to it deciding to use the model (Scottish Futures Trust, 2019) concluded that it was likely to entail higher costs than investments funded via either capital grant funding (1.7–2.2 times higher for an example educational building) or direct devolved government borrowing (1.0–1.6 times higher). These higher costs need to be covered using future resource budgets, squeezing the amount of funding available for other purposes. The Mutual Investment Model is therefore suitable for use if there are a sufficiently large number of investments with high enough returns to justify the additional cost. And it only makes sense at all in the context of the limits on Welsh Government’s direct borrowing, which prevent further use of this (generally cheaper) source of investment.
Why not provide the Welsh Government with substantially greater capital borrowing powers?
This begs the question as to whether limits on the devolved governments’ borrowing should be raised or even abolished. The Scottish Government has, for instance, called for a ‘prudential’ borrowing regime for capital borrowing, allowing it to set its own limits based on its assessment of affordability – similar to the regime councils operate under throughout Great Britain.14
Bell, Eiser and Phillips (2021) consider in depth the case for significantly increased borrowing powers for the devolved governments. They conclude that the impact of additional devolved government borrowing on overall UK fiscal policy and sustainability is likely to be limited given the fact that England represents almost 85% of the UK population and more than 85% of the UK economy.15 More important, though, is fairness between Wales (and the other devolved nations) and England.
The key point here is that there is no England-only borrowing, on top of that undertaken by English local government. UK government borrowing pays either for UK-wide services and benefits (such as defence or the state pension) or for England-only services (such as health and education), which generates funding for the devolved governments too under the Barnett formula. In addition, higher levels of funding per person than England (see the next section) mean that the devolved nations effectively benefit from a higher-than-population share of existing UK government borrowing (Office for National Statistics, 2024). One might argue that as long as the costs of the borrowing are borne only by the devolved governments and devolved taxpayers, that these fairness issues are minor. However, the ability to borrow is, in and of itself, valuable and the fact that the option to capitalise on it would be available only to some but not other UK residents could be seen as unfair.16
These fairness issues could be addressed with significant constitutional and fiscal reform – for example, separate England-only (or regional) budgets and borrowing. But in that case, additional borrowing on top of existing levels of UK government borrowing would pose more of a risk to overall fiscal sustainability (100% rather than 15% of the UK would have this power). Moreover, if it was expected that the UK government would step in and bail out a devolved or regional government facing severe fiscal difficulties, to prevent default and significant spending cuts or tax rises in that nation or region, devolved or regional governments may be tempted to over-borrow. Overall borrowing and the risk of fiscal crises is higher where subnational governments expect to be bailed out (Singh and Plekhanov, 2005).
As IFS researchers have highlighted in analysis of the UK fiscal outlook, there is already a risk of borrowing and debt ratcheting up due to asymmetric responses to ‘good’ and ‘bad’ fiscal news (Emmerson et al., 2023). And an ageing population and rising demands and costs of service provision will (without reductions in spending or increases in taxes) likely put significant upwards pressure on borrowing and debt in the coming decades (Office for Budget Responsibility, 2025). Reform of the UK’s fiscal architecture would therefore likely re-balance borrowing between tiers of government rather than create genuine fiscal space for additional borrowing.
5. How does funding compare to the rest of the UK?
Comparisons of funding levels between Wales and the other nations of the UK are complicated by the fact that UK government departments often spend money on both England-only and UK-wide responsibilities, and that different services are devolved to the Scottish, Welsh and Northern Irish governments. For example, while justice and policing are devolved to the Scottish Government and Northern Ireland Executive, the UK Home Office and Ministry of Justice is responsible for these services in Wales as well as England. Despite assessments of relative funding levels being a key part of the Northern Irish and Welsh fiscal frameworks (the operation of the Barnett formula for these countries depends on the level of relative funding), HM Treasury does not publish either its estimates of relative funding levels or the methodology it uses to assess relative funding levels.
However, the UK government does publish estimates of what fraction of each of its department’s spending is devolved to each nation for certain specific years in its Statement of Funding Policy, published alongside Spending Reviews (HM Treasury, 2010, 2020, 2025b). We can use this information to estimate funding for comparable areas of spending in England and compare this to funding for the devolved governments.
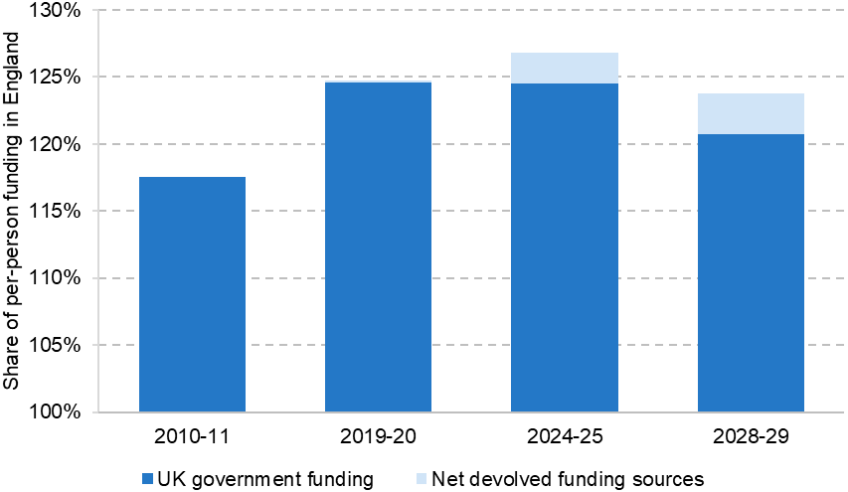
Doing this for 2024–25, the most recent year of outturn funding and spending data, Figure 7 (below) shows that UK government funding per person for the Welsh Government (plus business rates revenue) is equivalent to 24.5% higher than estimated comparable spending in England (including that funded by business rates). Devolved funding sources provided the equivalent of an additional 2.3 percentage points – reflecting largely the aforementioned net devolved tax revenues.
How do the higher levels of funding provided to the Welsh Government relative to England compare with the relative needs of the population of Wales?
Unfortunately, there are no official, up-to-date estimates of the relative spending needs of the Welsh Government to undertake this comparison. But we can compare them to estimates produced by the Holtham Commission (2010), which – while set up by the Welsh Government –is widely recognised as being an objective and comprehensive assessment of relative needs (Royal Society of Edinburgh, 2025). It estimated relative spending needs for the different nations of the UK using the relationship between spending and a set of geographic and socio-economic characteristics for 159 local areas (local authorities or groups of local authorities) across England, Scotland and Wales.17
Doing so, it estimated that the Welsh Government’s relative spending needs per person as of the late 2000s were 14% to 17% higher than England’s. Even if we take the upper end of this range, this would imply that Welsh Government funding is 6% higher than its relative needs would imply.18 That is a difference of £1.5 billion a year in today’s prices. Based on the latest assessments available, rather than gain from a needs-based funding formula, Wales would have lost the equivalent of around £460 per person in funding in 2024–25.
Several caveats to this are needed. First, being based on data almost two decades old means that these estimates may not accurately reflect current patterns of relative need of Wales and England. Second, it is also possible that the characteristics included in the analysis did not fully capture the particular needs of parts of Wales: the population sparsity measure takes account of the share of the population living in rural areas and settlements with fewer than 10,000 people but not travel times to larger settlements; and while the ethnic minority population share is accounted for (reducing Wales’s assessed relative spending needs), there is no account for any additional costs of Welsh language provision. And unlike for Scotland, where the gap between relative funding and assessed relative spending needs is very large (Brogaard and Phillips, 2026), it is possible to imagine an updated spending needs assessment significantly closing the gap between relative funding and relative spending needs in Wales – and perhaps, overturning it at some stage.
How is relative funding changing over time?
The funding advantage Wales enjoys relative to the Holtham Commission’s estimates of Wales’s spending needs is also set to be slowly eroded.
Comparing the Welsh Government’s relative funding over time is difficult given changes in responsibilities and in accounting rules. Bearing this in mind, Figure 7 includes not only the estimates for 2024–25 discussed above, but three further years: 2010–11, 2019–20 and 2028–29, adjusting as best we can for these factors.
Figure 7. Welsh funding per person as a share of comparable spending in England, selected years
Note: UK government funding includes business rates to allow for comparability between Wales and England (where part of business rates revenues is allocated to departments and part is retained directly by local government). Figure excludes post-Brexit agricultural funding for better comparability over time.
Source: Authors’ calculations using HM Treasury (2010, 2014, 2018, 2020, 2025a, 2025b, 2025c), Office for Budget Responsibility (2026), Office for National Statistics (2025c, 2025d) and Welsh Government (2018–2026).
It shows that UK government funding per person for the Welsh Government increased from 117.5% of English levels in 2010–11 to around 124.5% in 2019–20. Wales’s relative funding advantage has remained relatively stable so far in the 2020s according to our estimates, but is set to decline to 120.7% of English levels by 2028–29. That is still the equivalent of £0.9 billion higher than the upper end of the Holtham Commission’s range (114% to 117%).
Official forecasts imply that devolved funding will partly offset this ‘squeeze’ on Welsh Government funding toward the end of the decade. Whereas net devolved taxes and borrowing only contributed an additional amount equivalent to 0.2 percentage points of comparable spending in England in 2019–20, these sources are set to contribute the equivalent of an additional 3.0 percentage points of comparable spending in England in 2028–29.
What explains these relative funding trends?
The increase in the Welsh funding advantage during the 2010s and the decrease now set to take place is a result of the design of the Barnett formula (the formula used to allocate funding to the devolved governments based on changes in planned spending in England).
As discussed in Section 1, the main Barnett formula provides the devolved governments with a population-based share of the absolute (cash-terms) change in planned spending on comparable services in England. This population-based change represents a smaller percentage change in funding for the devolved governments than the percentage change in spending in England because the devolved governments have higher funding levels to begin with. For example, a £400 per person change in funding/spending represents a smaller percentage change in funding/spending if your initial funding/spending levels are £10,000 per person (a 4% change) than if your initial funding/spending levels are £8,000 per person (a 5% change). Since 2018–19, the changes in funding for the Welsh Government based on the Barnett formula have been increased by 5% (via the so-called needs-based factor), which partly but not fully mitigates the effect: a £420 per person change in funding/spending (5% more than the £400 in the example above) is still a smaller share of £10,000 (4.2%), than £400 is of £8,000 (5%).
During the early 2010s, UK government spending was being reduced. During this period, while the Barnett formula allocated the Welsh Government a population-based share of this cut, this was a smaller percentage decrease in funding than for England. And, while the Barnett formula takes account of population shares when allocating changes in funding, it does not update existing funding levels to account for differential population growth between Scotland and England. With population growth of 1.2% in Wales between 2010–11 and 2019–20, compared to 6.8% in England, the Welsh Government’s funding had to be spread over fewer additional people. This combination of factors therefore led to smaller reductions in funding per person than in England during the 2010s, leading to Wales’s relative funding advantage increasing.
Since 2019–20, as we have highlighted, spending in England and hence funding for Wales has been increasing. The Barnett formula has therefore generated a smaller percentage increase in funding for the Welsh Government than the increase in comparable spending in England – even with the additional 5% uplift in place. And while the Welsh population is projected to grow by less between 2019–20 and 2028–29 than the English population (5.1% versus 6.5%), the difference is expected to be smaller than during the 2010s. Therefore, the Barnett formula is now starting to generate smaller percentage increases in funding person per person than England, leading to Wales’s relative funding advantage shrinking.19
Whether this ‘Barnett squeeze’ continues in the longer term will depend on the rate of spending growth in England and the relative changes in the English and Welsh populations. Bigger increases in UK government spending in England would mean bigger increases in Welsh Government funding – but also a bigger squeeze on relative funding compared with England. The Welsh fiscal framework does state that if funding falls to below 115% of comparable spending in England, the additional increment the Welsh Government receives on top of the normal Barnett formula allocation would increase from 5% to 15%. That would prevent a further convergence in funding to English levels (and, indeed, lead to Wales’s funding advantage growing again if its population grows less quickly than England’s).
A new assessment of Wales’s relative spending needs is therefore both long overdue and increasingly vital going forwards. The UK and Welsh governments (and ideally other devolved governments) should jointly commission an independent analysis of the relative spending needs of the different nations of the UK. If this suggests that the relative funding provided to any of the nations is significantly different from its relative needs, it will be up to politicians to decide what, if any, changes to make to address this. But in the context of the ‘Barnett squeeze’, an updated assessment could inform not only political decisions, but also the public’s scrutiny of how their government and the services it is providing compare to those elsewhere in the UK. Is their government doing particularly well or badly? Or is it relatively over- or under-funded?
6. Concluding remarks
Before summarising our most important findings, an analyst’s gripe: it is exceedingly difficult to find key information on the Welsh Government’s devolved funding sources, which is needed for both our historic and forward-looking analysis. For Scotland, a series of ‘Fiscal Framework Outturn Reports’ and data annexes published by the Scottish Government (2024, 2025) and fiscal forecasts and updates published by the Scottish Fiscal Commission (2025, 2026) provide comprehensive data in a broadly consistent format. In contrast, the equivalent data for Wales are strewn across different publications for different years and different funding components. There is a particular paucity of information about future borrowing and reserves usage (and associated debt servicing costs). This may reflect, to some extent, the fact that the Welsh Government has set a one-year Budget rather than published a three-year Spending Review, as in Scotland – which is perhaps no bad thing given a potential change in government, with perhaps very different ideas about tax and spending. But making available better information about the funding outlook – on current policies – would help both current Senedd members and the wider public to better appreciate the challenges that lie ahead and to better scrutinise the proposals of different parties. We hope our report has helped fill this gap in official information.
We have found that the 2020s will be a decade of two halves. So far, the Welsh Government has seen substantial real-terms increases in both resource and capital funding – albeit in a context of rising costs and demands for both public services and capital investment. It is increases in UK government funding that have driven this increase in overall funding. But despite making no changes to devolved income tax rates, the UK government’s income tax threshold freezes have raised relatively more in Wales than England, meaning income tax revenues have also boosted the budget somewhat.
The second half of the 2020s will see much slower growth in resource funding and a fall in capital funding – implying tough choices between different areas of spending. And a difficult fiscal situation for the UK as a whole, combined with the restrictions of the Welsh fiscal framework, mean that borrowing substantially more is not sustainable at the UK level nor feasible at the Welsh level. Without increases in tax revenues – whether from faster economic growth, or increases in tax rates – the next Welsh Government will almost certainly have to make cuts to spending in some areas. That does not mean targeted boosts to spending or cuts to certain taxes are impossible, but they will require tougher trade-offs elsewhere in the Welsh Budget.
It is worth bearing in mind though that the Welsh Government is still set to receive more funding per person than is spent on England. Indeed, this gap is set to continue to be larger than the last assessment of Wales’s relative spending needs suggested would be required to address the nation’s older, poorer and sicker population’s needs – although that assessment was based on data that are now nearly two decades old.
In our subsequent Welsh Election Briefing Notes, we will look at which services the Welsh Government targets most of its additional funding, and how its priorities have changed over time and compare to the rest of the UK. Alongside this, we will assess the performance of key services, such as the NHS and education. We will also examine the Welsh Government’s devolved tax and welfare policies: who the winners and losers are; any common themes in the choices made; and the broader issues arising from these choices. Finally, as parties announce their plans and publish their manifestos, we will assess their proposals – who would win and lose from them, whether they are well designed to achieve the objectives they aimed at, and whether they are consistent with the funding outlook for the Welsh Government.
Appendix
This appendix describes adjustments we make to published funding figures to produce long-run series of Welsh Government resource and capital funding on as close to a like-for-like basis as possible.
As the starting point for our long-run funding series is 2010–11, we aim as far as possible to adjust reporting figures so that they are consistent with responsibilities and accounting treatments as of that year. This is our measure of consistent or ‘core’ resource and capital funding that we use for comparisons between 2010–11, 2019–20 and 2025–26.
Adjusting for changes in responsibilities
Our ‘core’ resource funding measure subtracts the following items:
- an estimate of the additional funding the Welsh Government received from 2013–14 onwards to cover the cost of localised council tax reduction schemes;
- the additional funding the Welsh Government received to replace European Union funding for agricultural support and fisheries support from 2020–21;
- the additional funding the Welsh Government received as a result of devolution of certain responsibilities from the UK government, including maintenance of the Valley Lines railways, Forestry and Cyber Security.
We have exact outturns and forecasts for the BGAs for devolved social security benefits for all years in question. We use the latest cash-terms figure available for all later years for the other adjustments: £222 million for council tax reduction schemes; £337 million and £2 million for agriculture and fisheries funding, respectively; and £19.3 million for resource funding and £20.7 million for capital funding for other shifts in responsibility.
We do not adjust for changes to pension costs or employer’s National Insurance Contribution costs as these relate to existing responsibilities. But changes in these costs (and any associated funding provided to address them) will affect the Welsh Government’s spending needs (and funding levels).
Adjusting for changes in accounting treatments
We make an adjustment to reflect an important accounting change that is not reflected in our source data: the move to IFRS16 accounting standards. From 2022–23 onwards, the UK and Welsh governments moved to this standard, which reflects the cost of leasing agreements up-front as capital spending, rather than over the duration of the lease as resource spending. To address this, additional capital funding has been provided since 2022–23, offset by reductions to resource funding. Specific adjustments have been made for the period 2022–23 to 2024–25, while the initial allocations for the year 2025–26 already account for this accounting change. To ‘undo’ the effect of this change and estimate funding on a consistent basis to previous accounting standards:
- we reverse the changes for the years 2022–23 and 2024–25 using the actual adjustments made by the government;
- we reverse the changes for 2025–26 onwards by assuming that the resource IFRS16 adjustment is the same share of overall resource funding as between 2022–23 and 2024–25, adding this back in to resource funding, and subtracting the equivalent amount from capital funding.
Chain-linking historic data
We utilise data from two editions of the UK government’s Public Expenditure Statistical Analysis (2018 and 2015) to construct longer-run series of funding prior to Block Grant Transparency data becoming available in 2016–17. Because of small changes in definitions between editions of the Public Expenditure Statistical Analysis, the figures for a given year can differ slightly between editions. We use a chain-linking approach to construct a long-run series without a break (using 2013–14 and 2016–17 as the ‘overlap’ years for the chain-linking).
Acknowledgements
This report is the first in a series of Welsh election briefings funded by the Nuffield Foundation (grant reference WEL /FR-000026348).
The Nuffield Foundation is an independent charitable trust with a mission to advance social well-being. It funds and undertakes rigorous research, encourages innovation and supports the use of sound evidence to inform social and economic policy, and improve people’s lives. The Nuffield Foundation is the founder and co-funder of the Nuffield Council on Bioethics, the Ada Lovelace Institute and the Nuffield Family Justice Observatory. Find out more at
www.nuffieldfoundation.org.
Co-funding from the Economic and Social Research Council (ESRC) through the Centre for the Microeconomic Analysis of Public Policy is also gratefully acknowledged (grant reference ES/Z504634/1).
The authors thank Anvar Sarygulov (Nuffield Foundation) and Ben Zaranko (IFS) for helpful comments and suggestions. All views expressed and any errors or omissions are the responsibility of the authors alone, and not necessarily representative of the views of the Nuffield Foundation or its trustees or staff.
References
Bell, D., Eiser, D. and Phillips, D., 2021. Options for reforming the devolved fiscal frameworks post-pandemic, https://ifs.org.uk/publications/options-reforming-devolved-fiscal-frameworks-post-pandemic.
Brogaard, M. and Phillips, D., 2026. Recent changes and the future outlook for Scottish Government funding. IFS Report, https://ifs.org.uk/publications/recent-changes-and-future-outlook-scottish-government-funding.
Emmerson, C., Stockton, I., Zaranko, B. and van de Schootbrugge, S., 2023. Chancellors’ responses to economic news. In C. Emmerson, P. Johnson and B. Zaranko (eds), IFS Green Budget October 2023, https://ifs.org.uk/publications/chancellors-responses-economic-news.
Feeney-Seale, A., 2026. Buy now, pay later: borrowing and the Scottish Budget. https://spice-spotlight.scot/2026/01/08/buy-now-pay-later-borrowing-and-the-scottish-budget/.
HM Government and Welsh Government, 2016. The agreement between the Welsh government and the UK government on the Welsh government’s fiscal framework. https://www.gov.uk/government/publications/the-agreement-between-the-welsh-government-and-the-united-kingdom-government-on-the-welsh-governments-fiscal-framework.
HM Treasury, 2010. Funding the Scottish Parliament, National Assembly for Wales and Northern Ireland Assembly: Statement of Funding Policy. https://im.ft-static.com/content/images/0c61d076-dc47-11df-a9a4-00144feabdc0.pdf.
HM Treasury, 2014. Public Expenditure Statistical Analyses: 2014. https://www.gov.uk/government/statistics/public-expenditure-statistical-analyses-2014.
HM Treasury, 2018. Public Expenditure Statistical Analyses: 2018. https://www.gov.uk/government/statistics/public-expenditure-statistical-analyses-2018.
HM Treasury, 2020. Statement of Funding Policy. https://assets.publishing.service.gov.uk/media/5fd3a7e58fa8f54d6249ea36/Statement_of_Funding_Policy_2020.pdf.
HM Treasury, 2025a. Block Grant Transparency: October 2025. https://www.gov.uk/government/publications/block-grant-transparency-october-2025.
HM Treasury, 2025b. Statement of Funding Policy. https://assets.publishing.service.gov.uk/media/684859e3d0ca5d7801e4e6f6/Statement_of_Funding_Policy.pdf.
HM Treasury, 2025c. Budget 2025. https://www.gov.uk/government/publications/budget-2025-document.
Holtham Commission, 2010. Final report. Fairness and accountability: a new funding settlement for Wales, https://www.gov.wales/sites/default/files/publications/2018-10/fairness-and-accountability.pdf.
Office for Budget Responsibility, 2025. Fiscal risks and sustainability – July 2025. https://obr.uk/frs/fiscal-risks-and-sustainability-july-2025/.
Office for Budget Responsibility, 2026. Welsh taxes outlook – January 2026. https://obr.uk/wto/welsh-taxes-outlook-january-2026/.
Office for National Statistics, 2024. Country and regional public sector finances, UK: financial year ending 2023. https://www.ons.gov.uk/economy/governmentpublicsectorandtaxes/publicsectorfinance/articles/countryandregionalpublicsectorfinances/financialyearending2023.
Office for National Statistics, 2025a. Population estimates. https://www.ons.gov.uk/peoplepopulationandcommunity/populationandmigration/populationestimates
Office for National Statistics, 2025b. Regional economic activity by gross domestic product, UK: 1998 to 2023. https://www.ons.gov.uk/economy/grossdomesticproductgdp/bulletins/regionaleconomicactivitybygrossdomesticproductuk/1998to2023.
Office for National Statistics, 2025c. Estimates of the population for the UK, England, Wales, Scotland, and Northern Ireland. https://www.ons.gov.uk/peoplepopulationandcommunity/populationandmigration/populationestimates/datasets/populationestimatesforukenglandandwalesscotlandandnorthernireland.
Office for National Statistics, 2025d. Low migration variant – Wales summary. https://www.ons.gov.uk/peoplepopulationandcommunity/populationandmigration/populationprojections/datasets/tableg15lowmigrationvariantwalessummary.
Ogden, K. and Phillips, D., 2024. How have English councils’ funding and spending changed? 2010 to 2024. IFS Report R318, https://ifs.org.uk/publications/how-have-english-councils-funding-and-spending-changed-2010-2024.
Phillips, D., 2014. Business as usual? The Barnett formula, business rates and further tax devolution. IFS Report, https://ifs.org.uk/publications/business-usual-barnett-formula-business-rates-and-further-tax-devolution.
Royal Society of Edinburgh, 2025. The financing of the Scottish Government. https://rse.org.uk/programme/advice-paper/the-financing-of-the-scottish-government/.
Scottish Fiscal Commission, 2025. Fiscal update – August 2025. https://fiscalcommission.scot/publications/fiscal-update-august-2025/.
Scottish Fiscal Commission, 2026. Scotland’s economic and fiscal forecasts – January 2026. https://fiscalcommission.scot/publications/scotlands-economic-and-fiscal-forecasts-january-2026/.
Scottish Futures Trust, 2019. An options appraisal to examine profit sharing finance schemes, such as the Welsh Mutual Investment Model, to secure investment for the National Infrastructure Mission and best value for taxpayers. https://www.scottishfuturestrust.org.uk/publications/documents/options-appraisal-model.
Scottish Government, 2024. Fiscal framework data annex: December 2024. Link to latest edition: https://www.gov.scot/publications/fiscal-framework-outturn-report-data-annex/.
Scottish Government, 2025. Fiscal framework outturn reports, 2018 to 2025. https://www.gov.scot/publications/fiscal-framework-factsheet/pages/fiscal-framework-outturn-report/.
Singh, R. and Plekhanov, A., 2005. How should subnational government borrowing be regulated? Some cross-country empirical evidence. IMF Working Paper WP/05/54, https://www.imf.org/external/pubs/ft/wp/2005/wp0554.pdf.
Welsh Government, 2018. Final Budget 2019-20. https://senedd.wales/media/3nkirovo/final-budget-explanatory-note-english.pdf
Welsh Government, 2020. Final Budget 2020-21. https://senedd.wales/media/bv5jcv5a/final-budget-explanatory-note-version-1-with-cover-english.pdf.
Welsh Government, 2021. Final Budget 2021 to 2022. https://www.gov.wales/final-budget-2021-to-2022.
Welsh Government, 2022. Final Budget 2022 to 2023. https://www.gov.wales/final-budget-2022-2023.
Welsh Government, 2023. Final Budget 2023 to 2024. https://www.gov.wales/final-budget-2023-2024.
Welsh Government, 2024a. Final Budget 2024 to 2025. https://www.gov.wales/final-budget-2024-2025.
Welsh Government, 2024b. Mutual Investment Model Report 2022-2024. https://www.gov.wales/sites/default/files/publications/2024-05/annual-mutual-investment-model-report-july-2022-to-march-2024.pdf.
Welsh Government, 2025. Draft Budget 2026 to 2027. https://www.gov.wales/draft-budget-2026-2027.
Welsh Government, 2026. Outturn reports. https://www.gov.wales/outturn-reports.
Endnotes
Authors

Martin Brogaard
Martin joined the IFS in 2025 and works in the IOD sector, researching consumer behaviour and nutrition. He also works on devolved government policy.

David Phillips
David is Head of Devolved and Local Government Finance. He also works on tax in developing countries as part of our TaxDev centre.
More from IFS
Understand this issue


Policy analysis


Academic research