
After falling sharply during the COVID-19 pandemic, productivity in English hospitals now seems to be growing again. NHS England reported earlier this year that hospital productivity grew by 2.7% in 2024–25, exceeding the government’s 2% target, and leading it to argue that its ‘reforms are bearing fruit’.1 Early estimates for the first part of 2025–26 suggest that this productivity growth is continuing, with NHS England’s measure recording 2.4% year-on-year growth in April to June 2025.
A key reason that productivity growth matters is that it should lead to more and better care for patients, even within relatively tight budgets. Yet over the last 18 months, progress against the government’s primary NHS target – cutting waiting times for pre-planned (elective) care – has been slow, or has even moved in the wrong direction. The percentage of patients on the elective waiting list for less than 18 weeks rose from 57.2% in March 2024 to just 59.8% in March 2025, before reaching 61.8% in September 2025, still far from the NHS constitutional standard of 92%. The size of the waiting list fell from 7.5 million to just 7.4 million between March 2024 and March 2025, and has not fallen meaningfully further since then.
This divergence between productivity and waiting times is happening not just at the national level, but also for individual hospital trusts. Figure 1 illustrates the relationship at the trust level between productivity growth (on the horizontal axis) and improvements to waiting times (on the vertical axis, measured using progress on the 18-week target) in 2024–25, compared with the previous year. Each point represents an acute trust. Although most trusts saw positive productivity growth in this period, with some recording growth over 10%, there is little relationship with the change in waiting time performance. Many trusts saw waiting times worsen, even as productivity improved, and few saw substantial improvements in waiting times.
Figure 1. Productivity growth and change in 18-week target performance in NHS trusts, 2024–25 compared with 2023–24
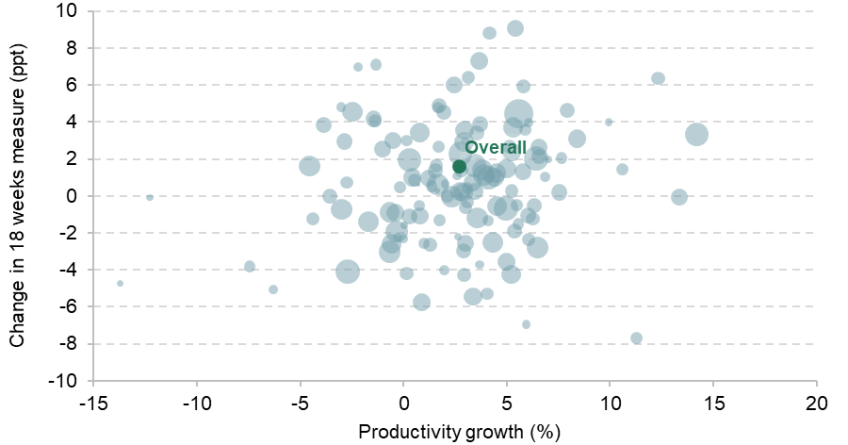
Note: Each point represents an NHS acute trust. Point sizes represent the number of completed elective waiting list pathways in 2024–25 (except in the case of ‘Overall’).
Source: Authors’ calculations using NHS Oversight Framework supplementary information; NHS England Referral to Treatment (RTT) waiting times.
So what is going on? In this comment, we examine why strong hospital productivity growth has not translated into falls in elective waiting times and the waiting list. We show that changes to funding, demand or emergency care do not explain the divergence. Instead, it seems that while hospitals are increasing the number of appointments and operations they are delivering, each patient is receiving more of this activity before they leave the waiting list.
Is higher productivity delivering more appointments and procedures?
Put simply, there are two ways to increase productivity as currently measured: you can deliver more activity with the same resources or you can deliver the same amount of activity with fewer resources. In the first case, we would expect increased hospital activity to translate to lower waiting times. But in the second case, increases to productivity would not affect waiting times, because the level of hospital activity is the same.
Relatedly, productivity is currently measured for the whole hospital sector, which includes pre-planned treatments from the waiting list, but also other areas of hospital care, such as treating emergency patients. Recent hospital-wide productivity growth could be entirely driven by the emergency sector delivering more activity, leaving pre-planned activity unchanged, which would also explain why there is limited improvement in waiting times.
However, Figure 2 illustrates that neither of these explanations matches the data. Two broad measures of hospital resources (the blue bars), including NHS England’s preferred measure (labelled ‘Acute trust resources’), saw significant growth over this period. Because the NHS has more resources, if productivity is up, this must mean that output – hospital activity – is up by more. Indeed, the rest of the bars show different measures of NHS hospital activity, all of which have increased. Productivity therefore has not just come from delivering the same activity with less resources.
Figure 2. NHS funding, resources and treatment volumes, 2024–25 compared to 2023–24

Note: Real day-to-day funding as measured by NHS England (NHSE) resource departmental expenditure limit (RDEL) excluding depreciation. Acute trust resources and overall hospital activity refer to the input and output measures used by NHS England to construct its measure of hospital productivity. Elective activity is measured for specific acute specialties, to match the scope of waiting list activity. Outpatient appointments are attended appointments. A&E arrivals are for type 1 major A&E departments.
Source: Authors’ calculations using HM Treasury Public Expenditure Statistical Analyses, table G.1; Department of Health and Social Care (2025); NHS England Recovery of Elective Activity statistics; NHS Digital monthly Hospital Episode Statistics for admitted patient care, outpatient and accident & emergency; NHS England RTT waiting times statistics.
Comparing different types of activity, it is clear that emergency activity (the red bars), far from driving all of this productivity growth, has only grown slowly. The amount of elective care delivered by hospitals (the yellow bars) did indeed grow rapidly over this period. Yet this activity failed to deliver significant reductions to the waiting list.
Is hospital activity having the effects we would expect on the waiting list?
The length of the waiting list (and, less directly, waiting times for patients) is determined by both the rate at which patients are treated and the level of referrals onto the list. If the number of people joining the waiting list is rising much faster than hospital activity, the waiting list is still likely to grow, even with strong productivity growth.
However, growth in the numbers joining the list – roughly, demand for care – has, if anything, been relatively slow. The purple bar in Figure 3 illustrates that the year-on-year increase in referrals, at 1.9%, will have absorbed some of the rise in hospital activity, but it is far too small to account for all of it. Indeed, this period has seen a significant expansion of the Advice & Guidance programme, in which patients who otherwise would have been referred to the elective waiting list are instead treated through their GP. This means that much of the growth in demand for elective care has been reduced before patients reach the waiting list.2
Figure 3. NHS treatment volumes and discharges from the waiting list, 2024–25 compared with 2023–24

Source: Authors’ calculations using NHS England Recovery of Elective Activity statistics; NHS Digital’s monthly Hospital Episode Statistics for admitted patient care, outpatient and accident & emergency; NHS England’s RTT waiting times statistics.
Given that hospitals are delivering more elective activity, and this is not being offset by rapid growth in the number joining the list, but the waiting list is barely falling, it must be the case that this care is not ending as many pathways as we would expect. The blue bars in Figure 3 show that this is indeed the case. Despite nearly 10% growth in elective activity over this period, only 4% more waiting list pathways were completed, with the gap driven mostly by pathways that do not require hospital admission. This must mean that patients are requiring more appointments, procedures or other activity before being discharged from the waiting list than they were previously.
It is not immediately clear why this is the case. If the average patient were presenting with more complex conditions, and thus becoming harder to treat, we might expect hospitals to need to deliver more activity to complete each waiting list pathway. But changes in this type of complexity are what ‘value-weighted elective activity’ is (at least partly) designed to measure. Unlike a simple count of elective hospital admissions, this metric weights different types of hospital activity according to cost and some of the expected benefits for patients. This means that more complex procedures are assigned a higher weight. If this measure were growing significantly faster than the other yellow bars, this would suggest that the average patient is becoming more complex to treat. However, the differences are in fact relatively small, suggesting that complexity has not changed sharply in this period. It also seems unlikely that there have been large changes to patient complexity over this one-year period, even if this could play a role in longer-term comparisons due to, for example, population ageing and the impacts of the COVID-19 pandemic on population health.
Instead, it appears that this divergence between delivering more activity and discharging more patients from the waiting list has changed over time, and has occurred for many different types of medical care. Figure 4 compares the growth in these two measures over time and between different clinical specialties. In these charts, if the yellow bar is larger than the green bar, the number of patients leaving the waiting list is growing more quickly than elective activity (that is, each patient is requiring a smaller amount of care before they leave the waiting list); larger green bars represent rising levels of activity per patient leaving the waiting list.
Figure 4. NHS treatment volumes and discharges from the elective waiting list

Note: Activity is constructed here as an index of elective procedures and outpatient appointments, with coarse cost weights for the average procedure or appointment taken from the 2024–25 National Cost Collection for the NHS. The four smallest specialties (oral surgery, neurosurgery, geriatric medicine, cardiothoracic surgery) are excluded.
Source: Authors’ calculations NHS Digital’s monthly Hospital Episode Statistics for admitted patient care, outpatient and accident & emergency; NHS England’s RTT waiting times statistics.
Panel A demonstrates that this trend is a relatively new one. In 2022–23, completed pathways grew much more quickly than activity levels, and the two were fairly similar in 2023–24. The increase in the number of appointments or procedures required for each waiting list pathway seems to have started only in 2024–25.
The decomposition in Panel B shows that almost every medical specialty saw this pattern in 2024–25, although with a large amount of variation. Ophthalmology and trauma & orthopaedics, for example, are both large, important specialties, and both saw around 3% growth in the number of patients they discharged from the waiting list. But they required very different levels of activity growth to deliver it, at around 4% for ophthalmology and 9% for trauma & orthopaedics. Strikingly, general surgery saw an overall fall in the number of completed pathways, despite delivering over 5% more activity.
These changes have had large effects on the government’s targets for cutting waiting lists. If the average patient in 2024–25 had needed only the average per-patient level of activity seen in 2023–24 to complete their pathways, the strong activity growth in this period would have led to more than 1 million additional pathways being removed from the waiting list, and so the waiting list being over 1 million pathways shorter. If this ratio were restored to its 2019–20 level, this figure would be over 2 million. In the context of a waiting list that has not fallen below 7 million cases since 2022, with a fall of just 200,000 in 2024–25, the scale of these differences is difficult to overstate.
The causes of this trend are difficult to identify. First, as mentioned previously, it is possible that the average patient on the waiting list is now sicker or requires more complex treatment. But it is not clear why the composition of patients on the waiting list would be changing so sharply now, rather than immediately after the pandemic or more gradually over the longer run – especially since value-weighted activity seems to be growing at a similar rate to the quantity of elective activity provided.
Second, it could be that the quality of NHS elective care is improving, and that higher levels of activity per patient will be worth it in terms of longer-term health outcomes. There is some evidence that patient satisfaction improved in this period, although the changes are not large.
Finally, hospitals faced strong incentives to increase activity and productivity in this period, with payments through the Elective Recovery Fund being in part linked to overall activity volumes, rather than completed pathways (although hospitals have also been incentivised to reduce their waiting times and waiting list). It is possible, then, that hospitals performed more activity per waiting list treatment pathway because they were financially incentivised to do so. Yet other policy efforts in this period acted in the other direction, with the expansion of patient-initiated follow-up appointments (PIFU) being intended to reduce the number of appointments each patient needed before leaving the waiting list. It may also be that hospitals have got less good at planning care pathways in a way that is unrelated to their financial incentives. We therefore cannot draw firm conclusions.
NHS England’s measure of hospital productivity does not, at the moment, take into account the number of patients discharged from the waiting list. If we measured the output of elective care using completed waiting list pathways, rather than by the quantity of elective hospital activity, measured productivity growth over the last year would likely be substantially lower. As we recently discussed in the IFS Green Budget, there are different approaches to measuring productivity, each of which tells you something different about how a system is performing. Measuring the amount of hospital activity delivered, which is close to what NHS England currently does, captures how efficiently hospitals can deliver units of treatment. But it also matters how valuable and useful these units of treatment are. Taking into account completed waiting list pathways, as well as other measures of quality, is important when thinking about the ultimate value of the output that hospitals are providing.
Conclusion
Over the last 18 months, the English NHS has managed to outperform many of its hospital productivity targets, whilst making limited progress on promises to cut waiting lists.
This divergence cannot be explained by a drop in funding, by rising demand or by the prioritisation of emergency care. Instead, the targets have come apart because the amount of activity delivered before patients are discharged from the waiting list has risen significantly, and by much more than can obviously be explained by changes to quality or to patient complexity. Without this rise, the extra activity delivered in 2024–25 would have led to a waiting list 1 million cases lower.
Reducing the ratio between activity and discharges, and understanding why it has risen so much, should be central to policy efforts to cut elective waiting times going forwards. If it continues to rise, even large increases in the amount of activity hospitals can deliver could risk having very little effect on waiting lists. However, the converse of this is that there are potentially dramatic improvements to be made to waiting list performance, even under relatively small increases to activity, if activity-per-patient ratios can be restored to even 2023–24 levels. Whilst the NHS is rightly focused on improving how productively it can deliver hospital activity, it should also ensure that the right activity is being delivered for patients to complete their pathways, rather than simply more activity.
Endnotes
Authors

Olly Harvey-Rich
Olly joined the IFS in 2024 and works in the Healthcare sector.

Max Warner
Max joined the IFS in 2020. His work covers health and social care, public spending and public sector productivity.
More from IFS
Understand this issue


Policy analysis


Academic research


