
Downloads
IFS Green Budget 2022
PDF | 4.07 MB
The IFS Green Budget 2022, in association with Citi and with funding from the Nuffield Foundation, takes stock of the economic and fiscal outlook following Kwasi Kwarteng’s mini-Budget and analyses the challenges ahead.
Below are summaries of each chapter. Click here to read chapters in full:
Chapter 1. Global economic outlook: heading for a fall?
Chapter 2. UK outlook: why we need to do things differently
Chapter 3. Outlook for the public finances
Chapter 4. Public spending, pay and pensions
Chapter 5. Reforms, roll-outs and freezes in the tax and benefit system
Chapter 6. Corporation tax and investment
Chapter 7. Quantitative easing, monetary policy implementation, and the public finances
Click here to read the full chapter >>>
Authors: Christian Schulz
New shocks are threatening to cut the global post-pandemic recovery short. This time last year, successful vaccination programmes, as well as a shift in strategy away from containing to living with the pandemic, had reduced the threat of health restrictions. Economies were expected to re-open, households were expected to deploy savings accumulated during the pandemic and, although it would take some time to restore global supply chains, strong growth was expected for all regions of the world.
Indeed, this picture broadly played out in the second half of 2021. Economies gradually reopened and the gaps between post-pandemic recoveries narrowed. By Summer 2022, Europe’s GDP recovery had nearly caught up with that of the US. However, especially in the US, the recovery may have been too fast for its own good.
US and Eurozone: real private consumption
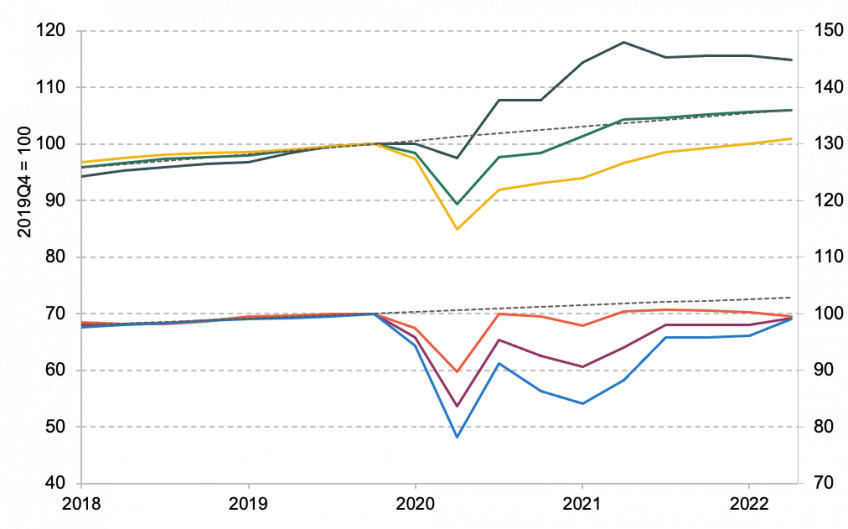
Source: BEA, Eurostat and Citi Research.
Turbocharged by the extremely generous post-election fiscal stimulus, the American economy began overheating to which, with hindsight, the Fed may have reacted too late. As a result of (belated) hikes in short-term policy rates, plus sharp increases in longer-term government and corporate borrowing costs, the US dollar strengthened against most other currencies and exported the US inflation problem to the rest of the world.
In these already challenging circumstances, a new and major speed bump appeared in the form of the conflict in Ukraine. Energy prices in general, and natural gas prices in Europe in particular, surged to extreme levels. This ‘tax’ on the economy is starting to take its toll on household real income and confidence. Europe looks set for a potentially deep recession. This will eventually probably reduce (and potentially eliminate) Europe’s inflation problem, leaving less for monetary policy to do. In the US, however, monetary tightening will likely have to go a lot further to restore the balance between supply and demand in the labour market and bring inflation under control. While potentially strengthening the dollar further, that will probably also imply a recession, albeit a milder and later one than in Europe.
Germany: pipeline gas inflow from Russia
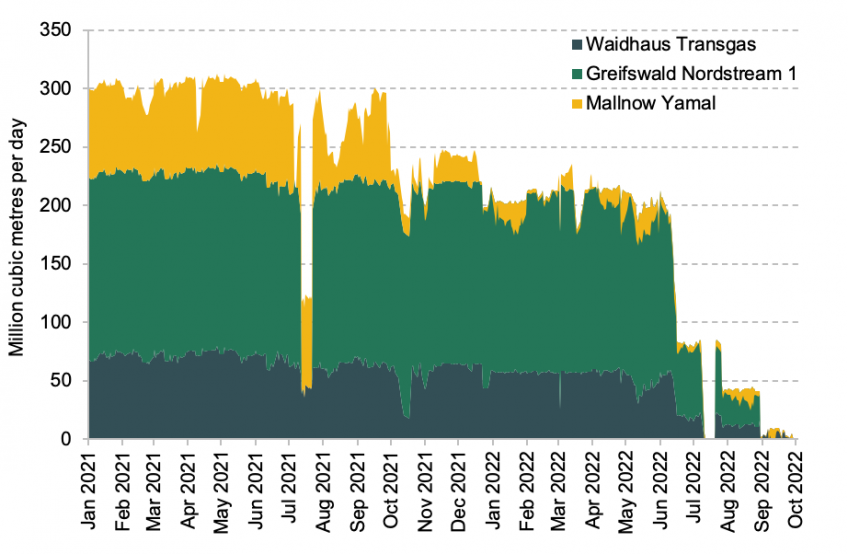
Source: Bloomberg and Citi Research.
Key findings
1. This year’s global economic outlook is far less rosy than in 2021. We expect the global economy to grow by 2.9% this year and 2.5% next year, both well below the long-run average of 3%. Europe, in the short term, and the US, later in 2023, are likely heading for recession.
2. Post-pandemic supply–demand imbalances have proved more severe and persistent than expected. Indicators of supply chain disruption such as shipping prices have declined, but not normalised. Expansive government policies have driven up public debt ratios by up to 20% of GDP and boosted money supply by 20–40%. Even leaving aside volatile food and energy prices, where, in our view, idiosyncratic shifts in supply and demand dominate, the ranking of the rises in core prices in the US, the UK and the Eurozone between 2019Q4 and 2022Q2 by 4%, 3% and 2% annualised, respectively, mirrors the ranking of the fiscal and monetary expansions.
3. The war in Ukraine and the stand-off with Russia have aggravated the inflation crisis by eliminating 40% of the EU’s gas supply, triggering a severe energy crisis in most of Europe. The increase in gas prices alone is imposing a burden of up to 8% of GDP on European households and firms. European gas prices peaked at double Asian rates and 10 times the US’s. This price shock is likely to trigger a recession, but also lead to structural changes in the European economy, weighing on growth for many years.
4. The Ukraine conflict also raises questions about the West’s reliance on China. Reducing dependence on the 22% of EU goods imports coming from China, including even higher shares for technology and consumer goods imports, may be an even greater challenge than reducing dependence on Russian energy. And unlike Russia, China remains tempting as an export market, absorbing 10% of EU exports and growing at triple the rate of overall exports. Improved resilience of supply chains may come at the cost of a permanent reduction in expected economic potential.
5. The series of supply shocks has driven global inflation to 7% this year. Recession, as well as base effects in energy and the gradual unwinding of supply chain disruptions, will likely bring inflation below 6% in 2023 and to 3.5% in 2024. But even that is still above the 3% long-run average. Inflation in energy and goods prices is being replaced by inflation in the price of food and services. High inflation looks set to stay and should trigger further significant interest rate hikes from central banks.
6. Governments can arguably be more effective in fighting inflation than central banks. They can invest and deregulate to boost energy supply and unclog supply chains, but also reduce demand by fostering industrial adaptation. Many are acting to preserve supply by guaranteeing loans or nationalising critical energy infrastructure, but also by supporting demand with tax cuts and subsidies. In the EU, fiscal measures related to the crisis amount to 3–4% of GDP already and are expanding rapidly. While direct interventions in energy prices have lowered measured inflation rates by 3 percentage points, some measures cause inflation elsewhere or in the future.
7. However, fiscal policy has to tread a fine line, as it can also distort incentives to save energy and raise the risk of blackouts as well as lower long-term incentives for the economy to adjust to potentially permanently higher energy prices and less efficient supply chains. So far, finance ministers are enjoying a tax revenue bonanza due to high inflation, but as they expand their support, risks to debt sustainability will grow and limit fiscal space, forcing hard choices.
Click here to read the full chapter >>>
Click here to read the full chapter >>>
Authors: Benjamin Nabarro
The UK is the talk of the town, and not in a good way. The coordinated sell off in both gilts and sterling reflect growing concerns about both the health of the economic recovery and the viability of the UK’s policy approach. With monetary and fiscal policy still at loggerheads, the risk of further financial disruption remains acute in the months ahead.
The UK begins in a relatively weak position. The UK is the only G7 economy not to have re-attained its pre-Covid level by the second quarter of 2022. And worse likely remains ahead, with our forecast suggesting that GDP will fall by 0.7% through 2023. The predominant driver of the economic outlook here is the large terms of trade shock. Recent increases in energy prices compound established increases in both food and core goods prices. In each case, this implies price pressures today and crimped incomes tomorrow. We expect that to mean a limited consumer driven recession over the coming quarters, despite additional support.
UK – Spending on Gas and Electricity (% GDP), 2017-2025
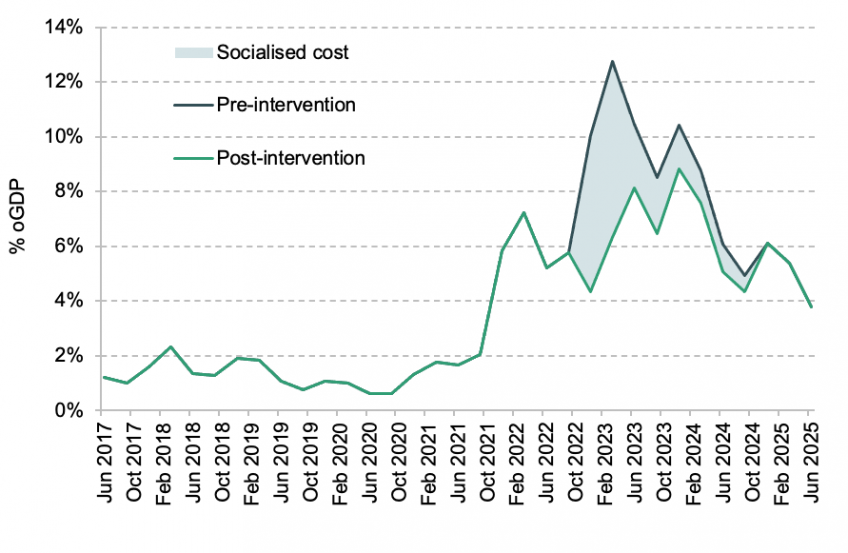
Notes: Figures are presented here as a share of quarterly nominal GDP. Spending is conditioned on a Citi VAR model of consumption substitution across sectors, alongside current market futures prices.
Source: ONS, Department for Business and Industrial Strategy, Bloomberg LLP and Citi Research.
For now, a weak demand side sits alongside a supply picture that is also heavily impaired. Here, a reduction in labour supply alongside ubiquitous matching challenges mean the UK labour market remains relatively tight. For the Monetary Policy Committee, the concurrence of a tight labour market and very strong imported inflation mean some action is necessary to reduce the risk of a de-anchoring of inflation expectations. But this will come at a longer-term cost. While a limited supply recovery seems likely, without carefully targeted support, the risk of material long-term economic scarring is growing.
UK – Business Investment (£ 2019 bn), 1965-2027
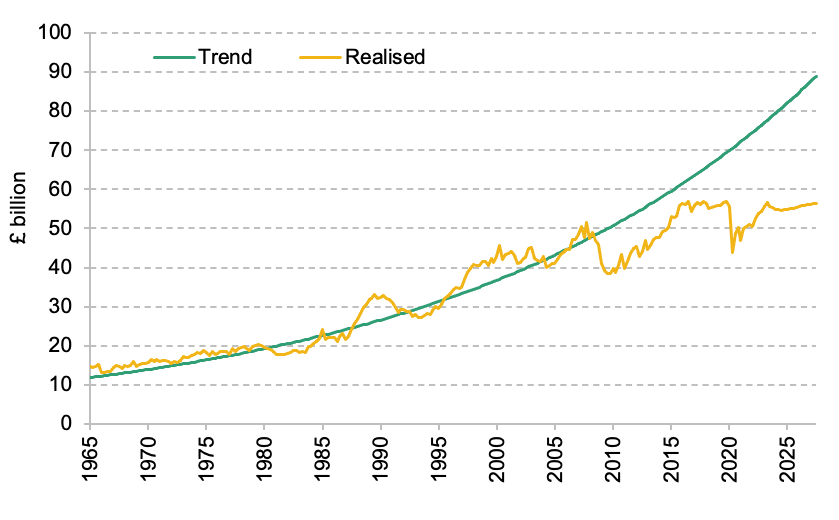
Notes: Trend business investment growth is based growth between 1965 and 2007.
Source: ONS and Citi Research.
Overall, policy faces a tricky trade-off between risks of a self-propagating recession on the one hand, and a nominal de-anchoring on the other. Sweeping fiscal stimulus is likely only to mean an outsized monetary response and a weaker long-term recovery. At the same time doing nothing is also far from optimal. The core conclusion we draw from recent experience is that policy would fare better by focusing more directly on managing the supply side of the economy. With structural shocks likely to grow more frequent in the decade ahead, that suggests a structural shift in approach.
Key findings
1. The UK can ill afford any more economic policy mistakes. After a lost decade, the government is right to focus on increasing growth. However, it must do so amidst two tightening constraints. The first is institutional credibility. The second is the need to develop appropriate tools to manage increasingly frequent adverse ‘supply-side’ shocks.
2. In the near term, the key challenge facing the UK economy is the terms-of-trade shock – an increase in the price of imports relative to exports. These effects are boosting inflation, but crimping domestic income. We expect these effects to weigh heavily on demand across both the household and corporate sectors over the coming year. The main upside economic risk remains a sweeping reduction in gas prices. Absent this, however, the UK economy is likely to be structurally poorer. The key policy question is how this loss is allocated.
3. For households, the looming cost shock will hit hardest those least able to bear it. Consumption is likely to be weighed down heavily by looming cost increases. The regressive nature of the shock risks exacerbating the near-term economic impact, particularly as consumer credit conditions continue to tighten. We think this should also argue against policies that transfer away from poorer households to their wealthier equivalents. ‘COVID savings’ also seem unlikely to come to the rescue given the mismatch between their accumulation and those suffering the largest real income shocks. In the medium term, sharp increases in mortgage costs may push any consumer recovery into 2024.
4. The weakness on the supply side of the UK economy is now an urgent concern. While output is 2.6% short of its pre-COVID trend, we estimate current excess demand in the order of 1.4% of GDP. Supply should gradually recover in the months ahead as capital and labour gradually reallocate. Targeted support has a key role to play in aiding reconfiguration and boosting incomes, but sweeping fiscal giveaways risk making a bad situation worse. The risk of a greater long-term scarring seems to be increasing.
5. We expect unemployment to increase from here as demand slows, but only gradually. Labour supply should continue to recover as cost-of-living concerns bite and NHS waiting times potentially begin to fall. However, in the near term, labour hoarding effects suggest redundancies are likely to materialise only slowly. Firm insolvencies may prove a key driver of slack in the near term. And in the medium term, unlike with the Great Financial Crisis, we think more persistent labour hoarding effects are likely to prove only limited.
6. Cost pressures remain intense. We expect CPI inflation to peak at 11.8% in the months ahead. While price growth should fall back during 2023, inflation is likely to stay relatively high for a while. And in the interim, the risks of a more nefarious feedback effect into domestic inflation dynamics will remain elevated. For now, we see the risks here as substantial, but contained. However, the sheer level of inflation means uncertainty is particularly high. More monetary tightening is almost certainly needed. De-anchored and expansionary fiscal policy remains the key upside risk to medium-term inflation.
7. The adverse market reaction to the ‘mini-Budget’ was qualitatively different from that to previous events. We think that reflects the now acute conflict between monetary and fiscal policy. In the near term, that calls the UK’s broader institutional credibility into question. In the medium term, it likely means weaker macroeconomic outcomes as the Monetary Policy Committee is forced to ‘overcompensate’ for continued fiscal stimulus. Historically, these shocks have tended to weigh on long-term output as tighter financial conditions weigh on investment.
8. Recent experience shows you cannot effectively manage supply-driven inflation via demand. Policy faces a tricky trade-off steering between the risk of a self-propagating recession on the one hand and the risk of de-anchoring inflation on the other. In our view, a different policy approach is not just desirable, but necessary. The fundamental challenge here stems from the supply-driven nature of the economic shock. Such shocks are likely to occur more frequently than in the past. The current approach risks hampering medium-term growth.
Click here to read the full chapter >>>
Click here to read the full chapter >>>
Authors: Carl Emmerson and Isabel Stockton
Just seven months after the last set of official forecasts for the economy and the public finances was presented at the Spring Statement in March, much has changed. Soaring inflation has pushed up debt interest spending and depressed growth prospects. Substantial permanent tax cuts leave borrowing elevated and debt on a rising path as a share of national income, even after short-term expensive energy support for households and businesses is expected to expire.
A clear lesson from the Global Financial Crisis, the Covid-19 pandemic and the current cost of living crisis is that there are emergency periods where government needs to provide temporary support and that it is appropriate for debt to rise during those times. Trying to prevent debt from rising during a sharp economic downturn would be wrong and, most likely, futile. But it is certainly unsustainable for policies to leave debt on a path where it relentlessly grows as a share of national income. And wanting the ability to raise debt when the next sizeable adverse shock hits provides a reason to aim to have debt falling outside of crises.
Uncertainty around any public finance forecast means that it is always possible that debt will fall as a share of national income. But unless – through luck or a concerted and successful policy effort – the economy grows at a substantially higher rate than under our current forecast, even just stabilising debt would require difficult decisions on some combination of spending cuts and tax rises.
Forecast borrowing, per cent of national income
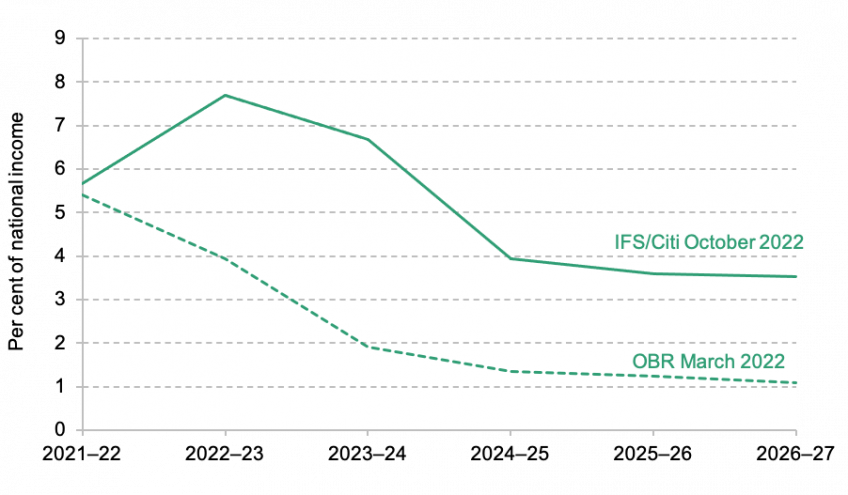
Source: Office for Budget Responsibility, Economic and Fiscal Outlook, March 2022; authors’ calculations.
Key findings
1. The most recent official economic and fiscal forecasts, from March 2022, had the government meeting its fiscal targets with a current budget surplus (i.e. total revenues exceeding day-to-day spending) from 2023–24 onwards and underlying public sector net debt on course to fall, albeit modestly, as a fraction of national income from the same year. The Office for Budget Responsibility (OBR) calculated that the government’s mandate to have debt forecast to fall was met by a margin of £28 billion.
2. Much has changed. Under Citi’s macroeconomic forecast, which underpins our analysis of the public finances, rising inflation and interest rates will add to public spending on working-age benefits, state pensions and debt interest. Recent policy decisions, such as the Energy Price Guarantee and the new government’s package of permanent tax cuts, will also add to borrowing. Overall, we forecast that borrowing this year will be £194 billion, which would be £94 billion higher than the £99 billion forecast in March. Of this increase, £68 billion is explained by support for energy bills announced since March (net of revenues from the new energy profits levy).
3. But more important for the sustainability of the public finances is the outlook for borrowing in the medium term. Even once the energy support packages are assumed to expire, borrowing remains elevated. There is huge uncertainty around the exact magnitude, but under a central forecast in 2026–27 we expect borrowing of £103 billion, which would be £71 billion higher than forecast in March. Much of this increase is uncertain – it will in particular depend on the path of the economy, inflation and interest rates – but less uncertain is £43 billion of the increase in borrowing, which is explained by the direct impact of the permanent tax cuts announced by the new Chancellor, Kwasi Kwarteng.
4. We forecast that spending on debt interest will be £103 billion in 2023–24, double the £51 billion forecast by the OBR in March and which was already an upwards revision on the £39 billion the OBR forecast in October 2021. Much of this increase in debt interest spending will dissipate as long as inflation falls back. But even in 2026–27 we forecast that debt interest spending will be £66 billion, some £18 billion higher than forecast by the OBR in March, £26 billion more than forecast in October 2021 and £9 billion more than was spent in 2021–22, as a result of higher interest rates and a higher level of accumulated debt.
5. In line with stated government policy, we assume that the government keeps broadly to the departmental spending plans set out a year ago. This is despite rising inflation eating into the implied real increases: restoring their generosity would require an additional £14 billion of spending in 2023–24 and £23 billion in 2024–25. Keeping to the existing cash spending plans is essentially imposing a rather hidden form of austerity on departments, and doing so in a rather arbitrary way, as it depends on the extent to which rising prices are adding to the spending pressures of each department – which will not be equivalent across the public sector.
6. The Chancellor has promised a ‘fully costed plan to get debt falling in the medium-term’. Pushing back the definition of the medium term from three years to five years could make this aim easier, but still far from easy, to meet. Under Citi’s central forecast, it would require a fiscal tightening of £62 billion in 2026–27 to stabilise debt as a fraction of national income – so even reversing all of the permanent tax cuts in Mr Kwarteng’s ‘mini-Budget’ would not be enough. Higher growth would help – but even if growth turned out to be 0.25 percentage points a year stronger than Citi expects, a fiscal tightening of £41 billion would be required to stabilise debt.
7. The government might be inclined to deliver any fiscal tightening through spending cuts. Supposing £62 billion of cuts were required, one way to achieve this would be as follows. Indexing working-age benefits to growth in earnings rather than prices in the next two years would cut spending by £13 billion, with most of the losses being felt by working-age households in the bottom half of the income distribution. A further £14 billion could come from cutting investment spending plans to 2% of national income, though this might be difficult to square with a government intent on boosting growth. The remaining £35 billion could come from a 15% cut to day-to-day spending on public services outside of the NHS and Ministry of Defence budgets, but this would require cutting spending in many areas where deep cuts were delivered between 2010 and 2019. Such spending cuts could be done, but would be far from easy.
8. Uncertainty around any public finance forecast means it is possible debt will fall as a share of national income. But being able to realistically expect it to fall requires a central view of economic growth and what tax and spending policies will actually be pursued. While we should hope for better growth, the rationale for an independent OBR is to ensure that politically motivated wishful thinking is not incorporated into economic and fiscal forecasts. The OBR should continue its practice of not incorporating hoped-for growth improvements arising from supply-side reforms until evidence of stronger growth starts to emerge.
9. Recent events have illustrated the importance of a credible strategy and plan for fiscal sustainability. Just as financial markets – which ultimately have to lend the money required to plug the gap in the government’s fiscal plans – might be unconvinced by plans underpinned by an assumption of a miraculous uptick in growth, so too might they be unconvinced by plans underpinned by vague promises of public spending cuts far into the future. We need to avoid the situation Mr Kwarteng wrote about in 2012 where ‘in each new budget the government promised their books would balance tomorrow – but tomorrow never seemed to arrive’. The OBR should therefore be very wary of a promise to cut spending in four or five years’ time without sufficient detail of where the axe would fall.
Click here to read the full chapter >>>
Click here to read the full chapter >>>
Authors: Bee Boileau, Laurence O’Brien and Ben Zaranko
The Chancellor faces a difficult range of trade-offs this autumn. Public sector pay awards must be higher than was assumed last October, when departmental funding was fixed in cash terms over the next three years. Affording these higher pay awards will require departments to make painful cuts to headcount or other budgets if settlements are not topped up. We estimate that pay awards of 5% on average – as were awarded public sector workers this July – impose additional costs of £5billion on departments, which could require workforce cuts of more than 100,000. These problems will only be amplified over the next two years.
5% pay awards are below inflation of around 10%, meaning public sector workers receive a 5% real-terms cut; they are also likely to fall behind pay growth in the private sector. Over the last decade, public sector pay has been falling relative to the private sector, and the public-private pay differential is now lower than it has been at any point in the last 30 years.
This chapter analyses the implications for public spending and employment of a range of potential public sector pay awards, both in this year and over the next two. We then move on to look at remuneration in the public sector in comparison to the private sector – how the differential has changed, accounting for workers’ characteristics, for a range of different groups over time. We estimate both the headline pay differential and the total remuneration differential, which takes employer pension contributions into account. Finally, we consider some longer-term policy implications, in particular the optimal balance between take-home and deferred pay in the public sector.
Average public–private hourly pay and remuneration differentials in 2021
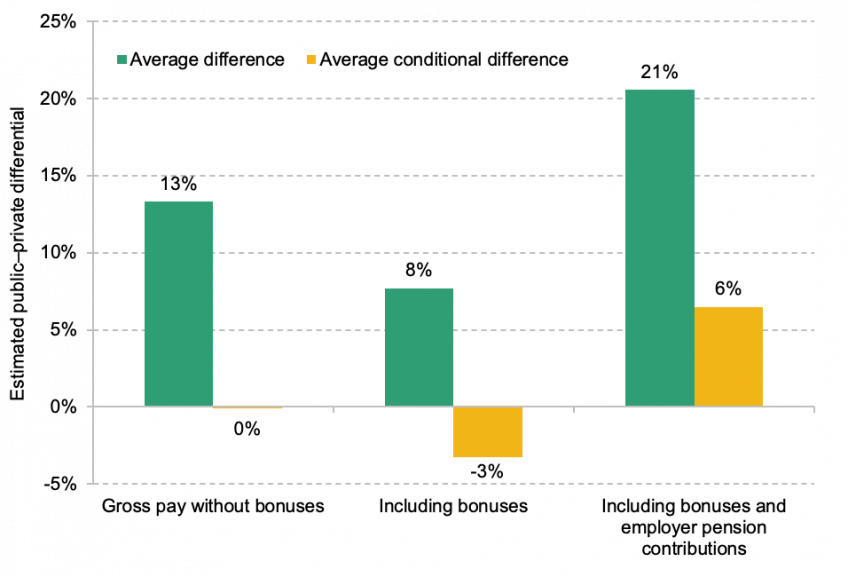
Notes and sources: see Figure 4.14 of Boileau, O’Brien, and Zaranko (2022).
Key findings
1. The public sector pay settlements announced this July will pose severe budgetary challenges for many areas of government. Overall funding for public services was fixed in cash terms for the next three years in last October’s spending review, at which this year’s double-digit inflation was not predicted. Departmental budgets were predicated on pay awards in the region of 3%, far below the current rate of inflation, and below the pay awards of roughly 5% (on average) announced over the summer. These pay awards are estimated to increase departmental staffing costs by around £5 billion this year, compared with the (approximate) 3% baseline built into existing spending plans. Offering an inflation-matching pay award to all public sector employees would add more like £18 billion.
2. Departmental funding settlements have not been increased to account for these additional costs. Meeting them from within existing budgets will be especially challenging given the context of sharply rising energy prices and elevated general inflation, which reduces the scope for savings elsewhere. If costs were met entirely through cuts to employment (i.e. to keep the total wage bill to what was expected when the spending settlements were made), a reduction of approximately 110,000 public sector workers (or 1.9% of the projected 2022–23 public sector workforce) would be necessary this year. Full inflation protection for public sector employees would increase that number to 390,000 (or 6.8% of the workforce). If some areas of government (e.g. the NHS) were exempt from any headcount cuts, the required cuts elsewhere would be deeper.
3. The challenge is, if anything, more acute in future years. Compensating departments for the additional costs of the pay awards this summer would mean an additional £5 billion or so this year (2022−23); if pay awards matched inflation after this year, that figure would rise to more than £10 billion by 2024−25. If no such compensation were forthcoming, the government would have to cut headcount by more than 220,000 by 2024−25 (or 3.8% of the projected 2024–25 public sector workforce) to stay within existing plans for the staff pay bill. If, instead, the government offered inflation-matching pay awards this year and each of the next two years, the additional costs would rise to around £25 billion by 2024−25, or the headcount reduction required to stay within existing budgets to 500,000 (8.6% of the public sector workforce).
4. The new Chancellor Kwasi Kwarteng must either top up those spending plans to fund these higher-than-expected pay awards or accept that the quality of public services will (further) deteriorate. This is one of the central fiscal choices for this autumn. Indeed, this could be among the defining decisions of the remainder of this parliament.
5. There is a case for reforming the fiscal framework to lessen the disconnect between the planning horizons for public sector pay (set annually) and departmental budgets (set on a multi-year basis). That could be achieved by setting the same planning horizons for both; longer-term horizons, though, would exacerbate pre-existing problems of public sector pay inflexibility, and shorter-term horizons might impede departments’ ability to budget effectively. Our preference would be to instead reform the spending framework, so that settlements are automatically reopened and reassessed in exceptional circumstances, defined as occurring when pay and/or other cost increases deviate sufficiently from the assumptions made (and published) when plans were originally set.
6. Even the higher-than-budgeted pay awards this year may not be enough to head off concerns around recruitment and retention – or widespread industrial action. The vast majority of public sector workers will experience a real-terms pay cut this year, and are likely to experience a bigger real-terms cut than their counterparts in the private sector. Public sector pay awards of 4–5% this year imply real-terms cuts of more than 5%, and are broadly similar to expected private sector pay settlements of around 6% (though may compare less favourably when bonuses, more widespread in the private sector, are taken into account).
7. The gap between pay growth in the two sectors this year is unlikely to be especially large, but comes after a decade in which public sector pay has been falling relative to the private sector and, for many public sector jobs, falling in real terms. The government needs to ensure it has the right number and mix of staff to provide its desired range and quality of public services. It is therefore essential to consider trends in public and private sector pay (and overall remuneration) together: the private sector helps define outside options for public sector workers. The continuing fall in public sector pay relative to the private sector poses recruitment and retention challenges for public services, and could threaten the government’s ability to deliver on its public service objectives (such as clearing the NHS backlog, ‘levelling up’ primary education and reforming adult social care funding).
8. The raw difference between public and private sector hourly pay levels, which does not take account of the different characteristics of employees in the two sectors, has fallen from 13% in 2007−08 to 7% in 2021−22. The conditional public–private pay differential, which controls for the fact that public sector workers tend to be more educated, older and more experienced, has fallen steadily from around 3% in 2007−08 to slightly below zero in 2021−22. This public–private pay differential is now less favourable to the public sector than at any point in the past 30 years. This is true of both men and women, though the estimated public–private pay differential for women in 2021−22 remains positive (+2.2%) and considerably higher than for men (−4.6%).
9. Alongside pay, employer contributions to pension schemes are an important part of the overall difference between public and private sector remuneration. Public sector workers are much more likely to be enrolled in a workplace pension (91% had a workplace pension in April 2021, compared with 75% of private sector employees) and more likely to be in – typically much more generous – defined benefit schemes (82% were in a defined benefit scheme in 2021, compared with 7% of private sector workers). Whereas almost half (47%) of public sector employees received an employer pension contribution of at least 20% of their pay in 2021, the same was true of just 2% of private sector employees.
10. The relative generosity of employer pension contributions in the public sector has been growing over time. The average employer contribution rate in the public sector grew by around 5 percentage points between 2012 and 2021, rising to 18% of pay in 2021. The average employer contribution rate in the private sector is considerably lower and has been growing more slowly: the average across all private sector employees (including those who do not participate in a pension scheme) rose by around 2 percentage points over the same period, reaching almost 6% of pay in 2021.
11. When taking an estimate of employer pension contributions into account, there was a raw difference of 21% between average public and private sector remuneration in 2021. When controlling for employee characteristics, we estimate the average public–private remuneration differential to be around 6% (meaning that public sector workers are paid roughly 6% more than their private sector counterparts on average, once pensions are accounted for). This total remuneration differential has fallen in recent years, but to a lesser extent than when considering pay alone, as a result of the increasing relative generosity of public sector pension contributions.
12. There is a strong case for rebalancing public sector remuneration away from pensions and towards pay. A far greater share of overall public sector remuneration is deferred, in the form of both employer and employee pension contributions, compared with the private sector (20.1% versus 7.6% on average in 2021), and this difference has been increasing over time. That means for a given level of remuneration, take-home pay is lower in the public sector. One option, as a starting point, would be to reduce employee pension contributions in the public sector, alongside a commensurate decrease in pension generosity. That would increase take-home pay for public sector employees with no change to the costs for their employers.
13. The public sector pay differential varies considerably across the UK, implying that regions may face varying levels of difficulty with recruitment and retention, and potentially creating unintended and undesirable variation in the quality of public services. The conditional public–private pay (and total remuneration) differential is lowest in London and the South East, and highest in Wales, Scotland and the North East. The average nurse in the North East earns 17% more than the average employee in the region, versus just 5% more in the East of England and 9% less in London. The average secondary school teacher in the North East or Wales earns over 50% more than the average in their region; a secondary school teacher in the South East earns 22% more than the average. Pay is not, of course, the only factor affecting the public sector’s ability to recruit and retain skilled workers, and it is not obvious that the areas with the lowest public–private differential are those facing the greatest difficulties with recruitment.
Click here to read the full chapter >>>
Click here to read the full chapter >>>
Authors: Tom Waters and Thomas Wernham
Much has been made about the mini Budget’s surviving high-profile tax cuts: the reductions in National Insurance contributions (NICs) and the 1p cut to the basic rate of income tax. Even without the additional rate abolition, these are very big tax cuts relative to plans, and are likely to be enough to put considerable strain on the public finances. But they come in the midst of a four-year freeze to income tax thresholds. Many other tax and benefit thresholds and values are also frozen indefinitely. This matters all the more in the high-inflation environment – and the more uncertain inflation environment – we now find ourselves in. In addition, other reforms (especially benefit changes) are often slowly rolled out, meaning that their impact grows over time.
This chapter shows how the size and shape of the tax and benefit system is set to change over the coming years, taking account of the various freezes, reforms, and discretionary changes. Freezes to thresholds, allowances and benefit amounts are increasing the number of taxpayers, and dragging more people into higher rates of tax, whilst also reducing families’ benefit entitlements.
Given current inflation forecasts, these freezes are set to more than offset headline tax cuts to National Insurance and the basic rate of income tax. By 2025, for every £1 households gain per year from these headline cuts, they lose £2 as a result of freezes. And freezes will dominate these tax cuts across the income distribution, not just on average.
Of course, from the Treasury’s perspective, one can see that undoing such freezes might not be appealing, given the state of the public finances. But that doesn’t change the fact that there are far less opaque and arbitrary ways to raise revenue. Worryingly, it seems like there is a growing trend towards introducing new parameters to the system that are indefinitely frozen. This smacks of lazy policymaking, and the government should kick the habit.
Changes in income by decile: freezes, roll-outs and planned discretionary tax changes to 2025–26
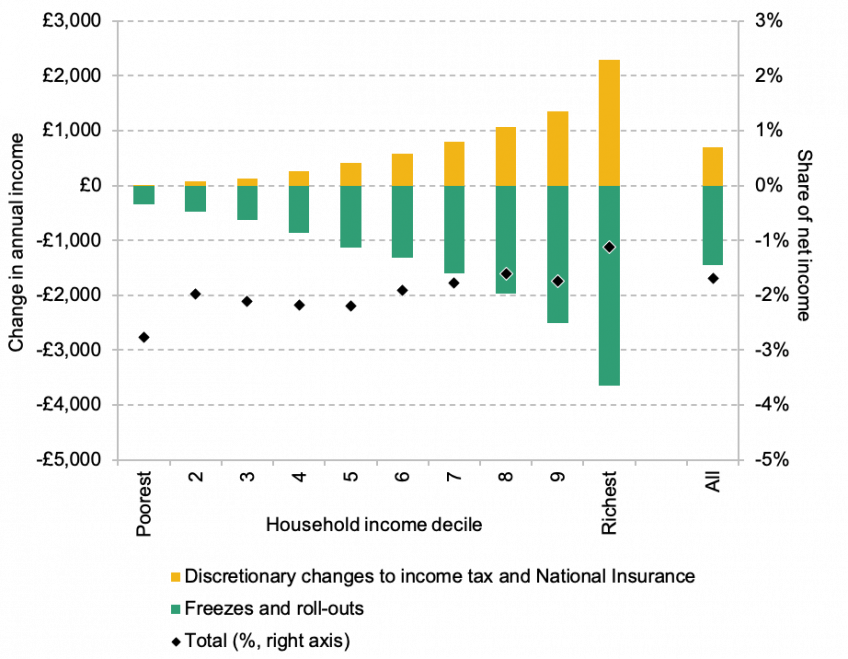
Source: Authors’ calculations using the FRS 2019–20 and TAXBEN, the IFS tax and benefit microsimulation model.
Key findings
1. Many tax and benefit thresholds, allowances and amounts (‘parameters’) are by default uprated every year in line with prices or in some cases earnings. But others are frozen in cash terms, sometimes temporarily by explicit policy choices but often indefinitely. Compared with uprating, such freezes reduce household incomes and strengthen the public finances – all the more so in the high-inflation environment we currently find ourselves in. These freezes – which represent a stealthy and arbitrary way to raise tax revenue – often have a bigger impact on household incomes than more eye-catching discretionary measures. Several benefit reforms are also being rolled out over the coming years, which also overall act to reduce household incomes.
2. The range of frozen parameters is wide, covering many aspects of the tax and benefit system. For example, we are one year into a four-year freeze in the income tax personal allowance and higher-rate threshold, which is set to raise the government £30 billion per year when finished. But other parameters are frozen indefinitely – including the £100,000 threshold where the personal allowance begins to be withdrawn, the benefit cap, the maximum assets that universal credit claimants can have, and local housing allowance rates which cap recipients’ housing benefit.
3. Freezes to personal tax parameters alone will reduce households’ income by £1,250 on average by 2025–26. Adding in freezes to benefits and gradual policy roll-outs brings that figure to £1,450, or 3.3% of income, and means a £41 billion boost to the exchequer. That is double the £20 billion gain in household income (and loss to the exchequer) from the high-profile personal tax giveaways – the reduction in National Insurance contributions and 1p cut to the basic rate of income tax. In other words, on average for every £1 households gain from high-profile cuts to rates of income tax and National Insurance, they lose £2 from the freezes and policy roll-outs. Not only does this hold in total, but in every income decile the average impact of gradual roll-outs and freezes outweighs the impact of the explicit discretionary policy changes.
4. The combined impact of headline tax changes, policy roll-outs and frozen taxes and benefits by 2025–26 is broadly regressive, with the poorest seeing income falls of 2.8% of income and the richest falls of only 1.1%. Headline cuts to income tax and National Insurance will benefit higher-income households who are more likely to get more of their income from employment, while the poorest tenth of households will gain only £13 per year from these measures. Because some tax thresholds and – especially – benefits values are indefinitely frozen, the impact of freezes only grows over time. As a result, by 2030–31 the total changes to the tax and benefit system are more clearly regressive, with the highest-income tenth seeing a 1.3% fall in income and the lowest-income tenth a 4.7% fall.
5. Freezes to tax thresholds and benefit values combined with higher-than-expected inflation change the shape of the tax and benefit system. The four-year freeze to the personal allowance and higher-rate threshold (scheduled to run to March 2026) is expected to increase the share of adults paying income tax to 66% (35 million) and the share paying the higher rate to 14% (7.7 million), compared with 63% (34 million) and 11% (6.1 million) today. The point at which the personal allowance begins to be tapered away (£100,000) and the additional-rate threshold (£150,000) have both been frozen since their introduction in 2010. By 2025–26, 3% of adults (1.6 million) will have some of their personal allowance withdrawn, and 1.4% (760,000) will pay additional-rate tax – in both cases around triple the equivalent number in 2010 when the thresholds were created.
6. The freezing of the £50,000 threshold at which child benefit begins to be withdrawn has led to 26% of families with children (2 million) now losing some or all of their child benefit – double the proportion when the policy was introduced a decade ago. In addition, the frozen benefit cap means the number of families with capped benefits could hit around quarter of a million in 2025–26 – double the current figure, and three-and-a-half times as many as when the cap was last actively reformed in 2016.
7. Freezes mean the shape and size of the tax and benefit system change in an uncertain and arbitrary manner, depending on unpredictable changes in inflation. Millions more are set to be paying higher tax rates by 2025–26 than the government could have predicted when income tax thresholds were frozen in April 2021, purely because prices have increased at an unexpectedly high rate. These problems are worse in a high-inflation environment, but even in times of lower inflation, freezes reduce the transparency of tax and benefit reforms, allowing the size of the system to be changed by stealth. All tax and benefit parameters should be uprated by a sensible index. If the government wants to raise taxes or cut benefits, it should tell us what real value it thinks the parameter in question should be, and not let it be unpredictably buffeted around by inflation.
Click here to read the full chapter >>>
Click here to read the full chapter >>>
Authors: Stuart Adam, Isaac Delestre and Vedanth Nair
UK business investment is the lowest in the G7 and among the lowest in the developed world.
Tax has a role to play in shaping investment incentives, and the UK’s corporate tax system is one of extremes. While the rate of corporation tax (19%) is exceptionally low, UK investment allowances are amongst the developed world’s least generous. As a result, effective tax rates in the UK (a measure which accounts for the generosity of allowances as well as the headline rate) are middling by international standards. But they vary hugely across different kinds of investment, favouring investment in some assets over others and encouraging borrowing to finance investment.
In this chapter we look closely at the nature of these distortions. We consider how the large package of corporate tax reductions announced in the recent ‘mini-Budget’ is likely to shape incentives to invest and what balance it strikes between encouraging domestic investment and attracting profitable ventures from overseas.
Finally, we consider the road ahead. We examine the likely impact of rising inflation and interest rates. We emphasise the importance of stability and of setting out a clear long-term plan. And we set out a case for genuine structural reform of corporation tax, which could address distortions to the allocation and financing of investment as well as its level.
This chapter was finalised in the wake of the ‘mini-Budget’ delivered to the House of Commons by Kwasi Kwarteng on 23 September 2022. Since then, the main corporation tax announcement in the mini-Budget has been reversed and both Chancellor Kwarteng and Prime Minister Truss have resigned. These developments came too late to be integrated into the chapter before publication. A brief postscript (Section 6.8) acknowledges their implications.
Figure 1. Corporate investment in OECD countries, 2019
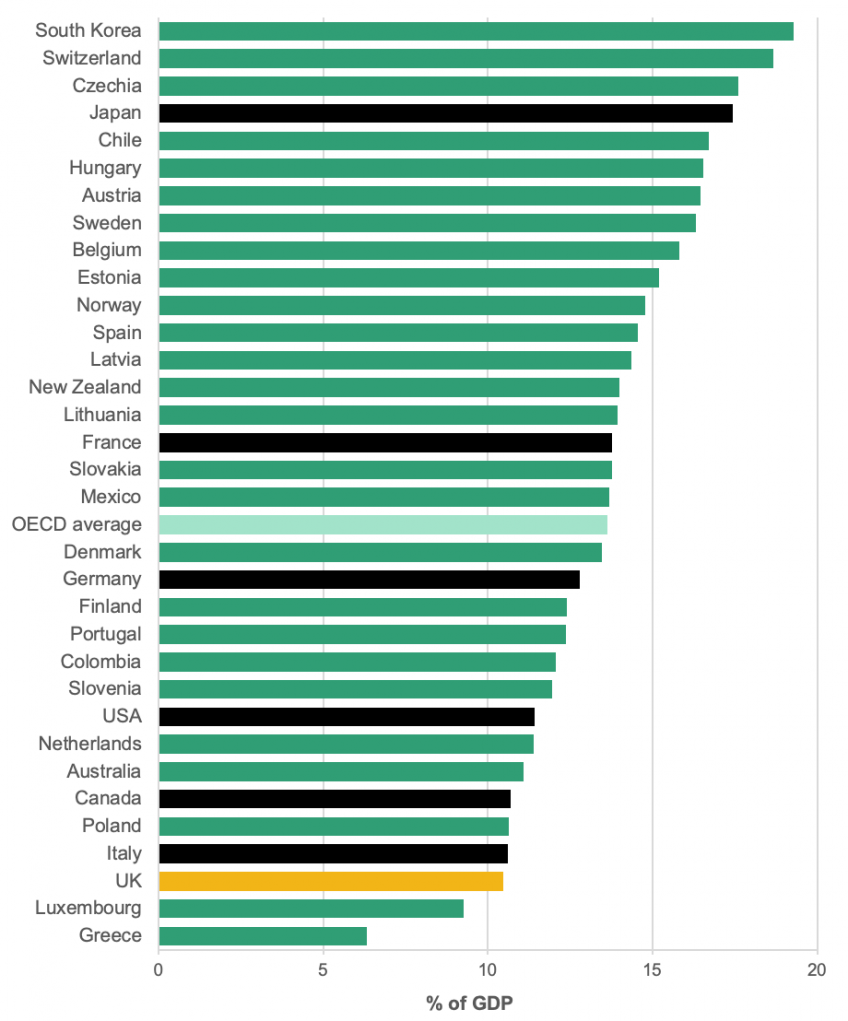
Note: Ireland excluded due to the large volatility of its investment statistics. OECD average is the unweighted average of OECD countries for which data are available (excluding Ireland). G7 countries shaded black.
Source: OECD, National accounts of OECD countries: corporate investment, https://doi.org/10.1787/abd72f11-en
Key findings
1. UK rates of corporate investment are among the lowest in the developed world. In 2019 the UK had the lowest level of business investment in the G7 and the third-lowest in the OECD: 10.5% of GDP compared with an OECD average of 13.6%.
2. The UK’s approach to taxing corporate investment is one of extremes. The UK’s headline corporation tax rate (19%) is one of the lowest of any advanced economy. At the same time, however, UK investment allowances are some of the least generous in the OECD. As a result, effective tax rates in the UK (a measure that accounts for both the tax rate and the generosity of allowances) are middling by international standards.
3. Just as importantly, effective tax rates vary drastically between investments. Investing in some assets is penalised much more than investing in others. Meanwhile, investments financed by borrowing can receive substantial subsidies, encouraging firms to take on more debt and to invest in low-return projects that would otherwise be unviable.
4. As inflation rises, these distortions are exacerbated, increasing the premium on achieving genuine structural reform that rationalises the system and reduces such distortions.
5. Kwasi Kwarteng’s dramatic September ‘mini-Budget’ announced the cancellation of a previously planned increase in the rate of corporation tax from 19% to 25%, a decision HM Treasury said would cost a substantial £15 billion a year in forgone revenue (in 2022–23 terms). Alongside this came a (more fiscally modest) increase in the permanent level of the annual investment allowance (AIA), from £200,000 to £1 million, allowing firms to deduct more of their investment spending from taxable profits immediately.
6. Cutting the rate of corporation tax will reduce all of the distortions associated with the tax. However, the tax reduction would be largest for more profitable investments: it would be less effective at reducing the tax on the borderline investments that are most likely to be discouraged by tax. While reducing the rate reduces the distortions to the level, allocation and financing of investment, unless it is reduced to zero, it cannot fully eliminate those distortions.
7. Increasing the AIA, meanwhile, is more cost-effective as a way to encourage investment domestically – it eliminates the disincentive for equity-financed investment in qualifying assets – though not necessarily as a way to increase the UK’s international competitiveness. It also increases subsidies for low-return investments funded by debt – investments that come at a cost to the exchequer but do little for growth.
8. There is strong evidence that, all else being equal, such cuts to corporation tax would be expected to increase investment in the UK. But they will do so only if they are expected to last. Investment decisions are long-term by their nature and the current political environment – and a long history of policy instability – will probably make it harder for the Chancellor to increase investment through the tax system (at least in the short term).
9. While tax matters for investment, it is not all that matters. If interest rates are pushed upwards, or if the UK is seen as providing an unstable environment in which to do business, that could easily outweigh any beneficial effects of lower corporation tax. In other words, corporation tax changes need to be situated within a sensible and credible fiscal framework and broader policy environment if they are to be effective in boosting investment.
10. Only genuine structural reform of how investment is treated by the tax system – as opposed to tweaking individual features – can eliminate distortions to the level, allocation and financing of investment. There is more than one way to achieve this, but it must involve reforming the treatment of debt and equity finance as well as headline tax rates and capital allowances.
11. What is needed is a coherent plan for the future of corporation tax as part of a wider fiscal strategy, clearly communicated, that companies and investors can use as a credible guide to what to expect in the future. There are certainly improvements that could be made. Short of that, some stability would be nice.
Click here to read the full chapter >>>
More from IFS
Understand this issue


Policy analysis


Academic research


