
Downloads
UK outlook: why we need to do things differently
PDF | 1.15 MB
Summary
The UK is the talk of the town, and not in a good way. The coordinated sell off in both gilts and sterling reflect growing concerns about both the health of the economic recovery and the viability of the UK’s policy approach. With monetary and fiscal policy still at loggerheads, the risk of further financial disruption remains acute in the months ahead.
The UK begins in a relatively weak position. The UK is the only G7 economy not to have re-attained its pre-Covid level by the second quarter of 2022. And worse likely remains ahead, with our forecast suggesting that GDP will fall by 0.7% through 2023. The predominant driver of the economic outlook here is the large terms of trade shock. Recent increases in energy prices compound established increases in both food and core goods prices. In each case, this implies price pressures today and crimped incomes tomorrow. We expect that to mean a limited consumer driven recession over the coming quarters, despite additional support.
UK – Spending on Gas and Electricity (% GDP), 2017-2025
Notes: Figures are presented here as a share of quarterly nominal GDP. Spending is conditioned on a Citi VAR model of consumption substitution across sectors, alongside current market futures prices.
Source: ONS, Department for Business and Industrial Strategy, Bloomberg LLP and Citi Research.
For now, a weak demand side sits alongside a supply picture that is also heavily impaired. Here, a reduction in labour supply alongside ubiquitous matching challenges mean the UK labour market remains relatively tight. For the Monetary Policy Committee, the concurrence of a tight labour market and very strong imported inflation mean some action is necessary to reduce the risk of a de-anchoring of inflation expectations. But this will come at a longer-term cost. While a limited supply recovery seems likely, without carefully targeted support, the risk of material long-term economic scarring is growing.
UK – Business Investment (£ 2019 bn), 1965-2027
Notes: Trend business investment growth is based growth between 1965 and 2007.
Source: ONS and Citi Research.
Overall, policy faces a tricky trade-off between risks of a self-propagating recession on the one hand, and a nominal de-anchoring on the other. Sweeping fiscal stimulus is likely only to mean an outsized monetary response and a weaker long-term recovery. At the same time doing nothing is also far from optimal. The core conclusion we draw from recent experience is that policy would fare better by focusing more directly on managing the supply side of the economy. With structural shocks likely to grow more frequent in the decade ahead, that suggests a structural shift in approach.
Key findings
1. The UK can ill afford any more economic policy mistakes. After a lost decade, the government is right to focus on increasing growth. However, it must do so amidst two tightening constraints. The first is institutional credibility. The second is the need to develop appropriate tools to manage increasingly frequent adverse ‘supply-side’ shocks.
2. In the near term, the key challenge facing the UK economy is the terms-of-trade shock – an increase in the price of imports relative to exports. These effects are boosting inflation, but crimping domestic income. We expect these effects to weigh heavily on demand across both the household and corporate sectors over the coming year. The main upside economic risk remains a sweeping reduction in gas prices. Absent this, however, the UK economy is likely to be structurally poorer. The key policy question is how this loss is allocated.
3. For households, the looming cost shock will hit hardest those least able to bear it. Consumption is likely to be weighed down heavily by looming cost increases. The regressive nature of the shock risks exacerbating the near-term economic impact, particularly as consumer credit conditions continue to tighten. We think this should also argue against policies that transfer away from poorer households to their wealthier equivalents. ‘COVID savings’ also seem unlikely to come to the rescue given the mismatch between their accumulation and those suffering the largest real income shocks. In the medium term, sharp increases in mortgage costs may push any consumer recovery into 2024.
4. The weakness on the supply side of the UK economy is now an urgent concern. While output is 2.6% short of its pre-COVID trend, we estimate current excess demand in the order of 1.4% of GDP. Supply should gradually recover in the months ahead as capital and labour gradually reallocate. Targeted support has a key role to play in aiding reconfiguration and boosting incomes, but sweeping fiscal giveaways risk making a bad situation worse. The risk of a greater long-term scarring seems to be increasing.
5. We expect unemployment to increase from here as demand slows, but only gradually. Labour supply should continue to recover as cost-of-living concerns bite and NHS waiting times potentially begin to fall. However, in the near term, labour hoarding effects suggest redundancies are likely to materialise only slowly. Firm insolvencies may prove a key driver of slack in the near term. And in the medium term, unlike with the Great Financial Crisis, we think more persistent labour hoarding effects are likely to prove only limited.
6. Cost pressures remain intense. We expect CPI inflation to peak at 11.8% in the months ahead. While price growth should fall back during 2023, inflation is likely to stay relatively high for a while. And in the interim, the risks of a more nefarious feedback effect into domestic inflation dynamics will remain elevated. For now, we see the risks here as substantial, but contained. However, the sheer level of inflation means uncertainty is particularly high. More monetary tightening is almost certainly needed. De-anchored and expansionary fiscal policy remains the key upside risk to medium-term inflation.
7. The adverse market reaction to the ‘mini-Budget’ was qualitatively different from that to previous events. We think that reflects the now acute conflict between monetary and fiscal policy. In the near term, that calls the UK’s broader institutional credibility into question. In the medium term, it likely means weaker macroeconomic outcomes as the Monetary Policy Committee is forced to ‘overcompensate’ for continued fiscal stimulus. Historically, these shocks have tended to weigh on long-term output as tighter financial conditions weigh on investment.
8. Recent experience shows you cannot effectively manage supply-driven inflation via demand. Policy faces a tricky trade-off steering between the risk of a self-propagating recession on the one hand and the risk of de-anchoring inflation on the other. In our view, a different policy approach is not just desirable, but necessary. The fundamental challenge here stems from the supply-driven nature of the economic shock. Such shocks are likely to occur more frequently than in the past. The current approach risks hampering medium-term growth.
2.1. Introduction
The UK is the talk of the town, and not in a good way. The coordinated sell-offs in both gilts and sterling reflect growing concerns about both the health of the economic recovery and the viability of the UK’s policy approach. With monetary and fiscal policy still at loggerheads, the risk of further financial disruption remains acute. This engenders a downside skew to the risk profile in the months ahead, and risk of weaker long-term economic outcomes.
The UK begins in a relatively weak position. The UK is the only G7 economy not to have re-attained its pre-COVID level by the second quarter of 2022. And worse likely remains ahead, with our forecast suggesting that GDP will fall by 0.7% through 2023. The predominant driver of the economic outlook here is the large terms-of-trade shock. Recent increases in energy prices compound established increases in both food and core goods prices. In each case, this implies price pressures today and crimped incomes tomorrow. We expect that to mean a limited consumer-driven recession over the coming quarters, despite additional support.
For now, a weak demand side sits alongside a supply picture that is also heavily impaired. Here, a reduction in labour supply alongside ubiquitous matching challenges means the UK labour market remains relatively tight. For the Monetary Policy Committee, the concurrence of a tight labour market and very strong imported inflation means some action is necessary to reduce the risk of a de-anchoring of inflation expectations. But this will come at a longer-term cost. While a limited supply recovery seems likely, without carefully targeted support, the risk of material long-term economic scarring is growing.
Overall, policy faces a tricky trade-off between risks of a self-propagating recession on the one hand and a nominal de-anchoring on the other. Sweeping fiscal stimulus is likely only to mean an outsized monetary response and a weaker long-term recovery. At the same time, doing nothing is also far from optimal. The core conclusion we draw from recent experience is that policy would fare better by focusing more directly on managing the supply side of the economy. With structural shocks likely to grow more frequent in the decade ahead, that suggests a structural shift in approach.
Below, we begin by discussing the near-term outlook for the UK economy, including the drivers behind the looming terms-of-trade shock, and the implications for households, firms and the UK’s external balances (Section 2.2). We then turn to the challenges around supply and the labour market (Section 2.3), before turning to the outlook for costs and inflation (Section 2.4). We conclude with both a summary of the overall pattern of economic adjustment and the potential alternative scenarios (Section 2.5), before turning lastly to the policy implications and challenges (Section 2.6).
2.2. The near-term outlook
Economic activity has slowed sharply in recent months. As recently as May, much of the soft economic activity data continued to indicate a robust expansion. But in the months since, cost increases across the economy have begun to weigh. Despite considerable fiscal support, we still anticipate a shallow recession over the coming months. Real GDP, we think, will fall by 0.7% year on year (YY) at the trough in 2023Q3. This is already from a relatively weak starting point, with the UK now the only G7 economy not to have recovered to its pre-pandemic level.
Historically, when annual growth falls below 1.5% in a given quarter, this tends to increase significantly the risk of a subsequent further reduction in growth two quarters ahead – on average implying a further reduction of 0.8%.1 For much of the forecast horizon, we do not expect the UK economy to escape this ‘stall speed’.
The risks are increasingly skewed towards a larger and more protracted downturn. On the demand side, that reflects the risk lower incomes could collapse into a period of more protracted weak demand. On the other hand, there is a risk that, by loosening too far, policy could engender a de-anchoring of expectations, much higher rates and a disorderly, inadvertent tightening of financial conditions.
In this section, we focus on the risks to demand. Both households and firms look set to be hit hard by the looming terms-of-trade shock.
For households, we argue below that cost increases in areas such as food and fuel are likely to weigh heavily on aggregate consumption – despite discretionary support. As these effects fade, we also expect higher mortgage rates to constitute a notable headwind, pushing any meaningful recovery into the second half of 2024. Robust balance sheets should provide some support in the medium term. However, household wealth inequality seems to have widened sharply through COVID. This means less resilience. It also suggests a particularly low multiplier on policies that reduce transfers in order to fund tax cuts.
For firms, the primary challenge over the coming months relates to both acute margin compression, and increases in the cost of capital. In both cases, we think that implies only a very gradual recovery in business investment, even from its current low base. The latest data point to large ‘revaluation’ effects as the structure of the economy is beginning to pivot. These write-downs risk casting a longer shadow without more medium-term economic clarity.
The terms-of-trade shock
The primary driver behind the near-term economic outlook is a once-in-a-generation, adverse ‘terms-of-trade shock’ (an increase in the price of imports relative to exports). The constituents here are threefold. First, in the latter half of 2021, large increases in imported consumer goods prices drove inflation higher (see Section 2.4). Large increases in energy prices have since increased this further. And, in more recent months, food prices have also picked up sharply. In total, the relative price of exports versus imports has fallen by a little over 3% in the past 11 months, the largest reduction since 2016. Worse, we think, lies ahead (Figure 2.1).
Figure 2.1. UK: aggregate terms of trade, 1960–2027
Note: Terms of trade in this case measured as the ratio between the export price deflator and the import price deflator.
Source: ONS and Citi Research.
The key drivers from here are likely to be food and energy (specifically gas). Both items are heavily imported. Food imports, for example, amounted to around £50 billion in 2021, while the equivalent exports amounted to just £21 billion (Office for National Statistics, 2022d). Around 50% of UK gas is also imported, primarily from Norway (via pipeline) and Qatar (via LNG) (Donnarumma, 2022a). While the UK has been a net energy exporter in decades past, this ceased to be true around the turn of the millennium. In the years since, the associated energy deficit has grown episodically (see Figure 2.2). The conflict in Ukraine, alongside broader disruption to Russian gas supplies into Europe, has resulted in a very large increase in prices. Compared with the middle of 2021, futures prices for wholesale gas are now four to five times higher for 2023.
Figure 2.2. UK: net trade in non-oil energy, 1980–2026
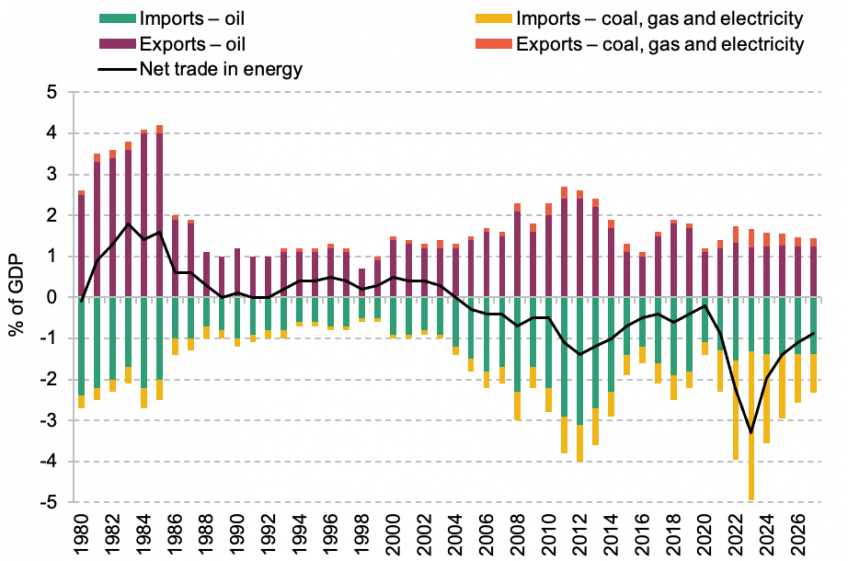
Note: Figures are presented here as a share of nominal GDP. Figures for 2022 onwards are a Citi forecast.
Source: ONS, Bank of England, Thomas and Dimsdale (2016) and Citi Research.
How will this affect the economy?
In essence, this is a large, net, economic loss for the UK economy. Typically, an increase in import prices adds to inflation in the near term, but then crimps real incomes, demand and domestic inflation thereafter. An increase in energy prices is especially destructive economically. This adds to the relative cost of imports, but it also drives a revaluation between the energy producing and consuming parts of the domestic economy. Income tends to have a much higher multiplier in the latter case than in the former. In the past decade or so, we estimate that a sustained 10–15 pence increase in the price of a ‘therm’ of gas deducted roughly 0.2 percentage points from UK GDP over the subsequent 18 months. Given the 250p increase since the middle of 2021, a simple extrapolation of these effects alone would therefore suggest a hit of around 2.5ppt.
Of course, the reality here is a little more complicated. The scale of the shock means that these simple ‘rules of thumb’ do not likely do analytical justice to the current outlook. Instead, a more in-depth look is required.
In our view, the overall economic impact of a set of price increases such as this depends on three factors:
- the extent to which the consumption of specific (and more expensive) items can fall (in this case, energy and food);
- the extent to which demand imports can be reduced more generally, and the trade balance restored – via offsetting foreign exchange depreciation and trade substitution elsewhere;
- the speed at which the economy can adjust to produce more imported items domestically.
Unfortunately, in each of these three respects, the prognosis for the UK is not good.
Beginning with demand, food and energy are particularly price-inelastic elements of the UK import basket. The change in import volumes associated with a shock to the trade-weighted exchange rate, for example, is especially low among these categories.2 These effects are likely to be compounded by the government’s decision – made for understandable reasons – to cap prices for both firms and households.3
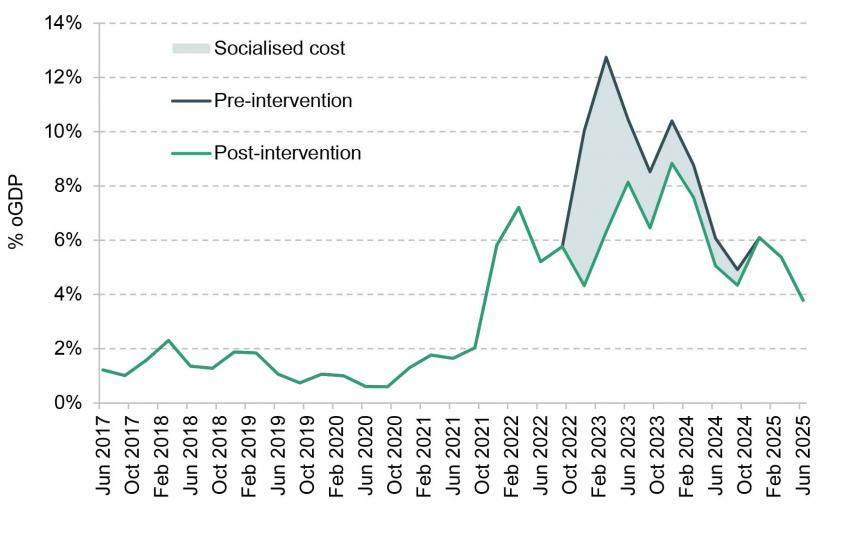
Adjustment is unlikely to be predominantly, or even largely, confined to the UK energy market. Instead, we think the current account deficit for energy alone could widen to over 3.5% of GDP. On the domestic side, we also note that electricity and gas consumption combined could also increase to well over 10% of GDP, from 1–2% in 2015–19 (Figure 2.3).
If macroeconomic adjustment cannot be contained within the energy sector, the burden is likely to shift to the broader trade deficit. The sharp deterioration in aggregate terms of trade will, we think, weigh on both the nominal and real exchange rate, slowing growth and, in the UK’s case, reducing demand for imports.4
Figure 2.3. UK: spending on gas and electricity, 2017–25
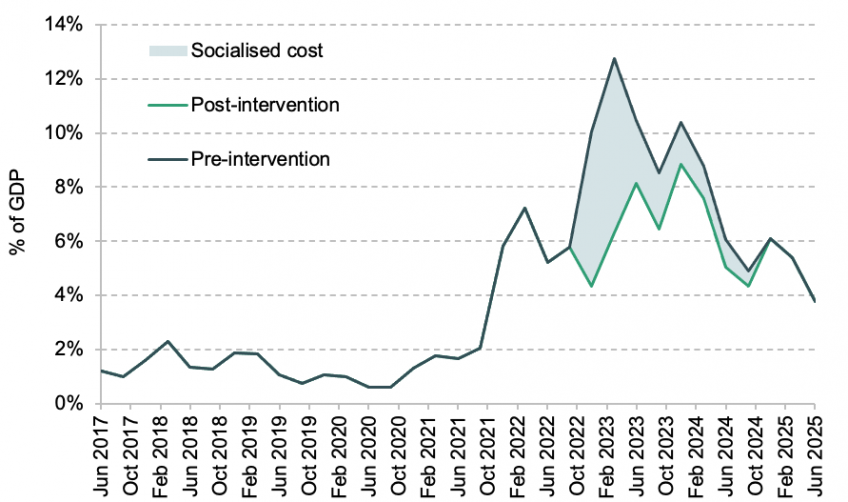
Note: Figures are presented here as a share of quarterly nominal GDP. Spending is conditioned on a Citi VAR model of consumption substitution across sectors, alongside current market futures prices. These data are not seasonally adjusted. Forecast runs from 2022Q2 until 2025Q2.
Source: ONS, Department for Business and Industrial Strategy, Bloomberg LLP and Citi Research.
Figure 2.4. UK and Eurozone: impact of exchange rate depreciation on the level of nominal imports, 1997–2019
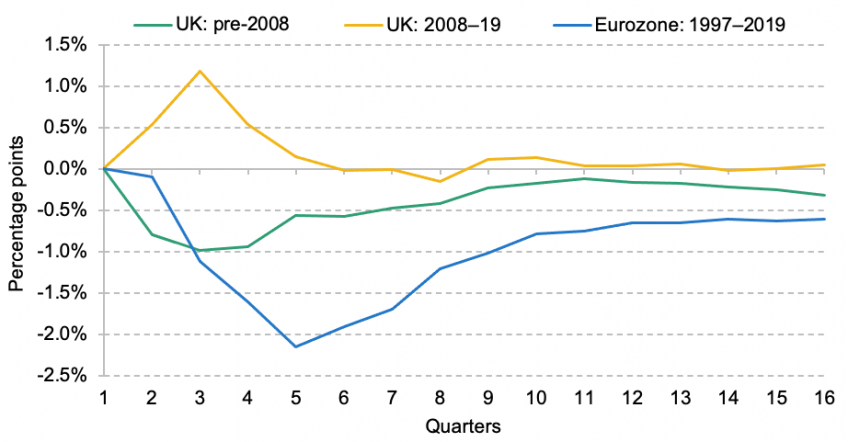
Note: This figure shows the impact of a one-standard-deviation shock to the exchange rate on nominal imports.
Source: ONS, Eurostat, Bloomberg and Citi Research.
Here, however, we think adjustment could also prove tricky. For one, UK imports overall seem to have become less sensitive to changes in the exchange rate.5 Another important consideration relates to the scale of the domestic ‘tradable’ production versus the current account.6 The challenge for the UK is that the share of tradables in the UK economy remains well down on its pre-Great-Financial-Crisis level.7 The ‘tradable share’ is also now considerably smaller than the overall current account deficit, further complicating any economic adjustment (Calvo, Izquierdo and Talvi, 2003).
In both cases, these arguments suggest domestic output may have to do more ‘heavy lifting’. This means more downward pressure on output. One of the ways this could materialise is via a larger drop in the ‘real effective exchange rate’8 – the nominal exchange rate multiplied by the ratio of UK prices versus those abroad – and an associated drop in domestic demand. While domestic output in the UK is about as sensitive to real effective exchange rate depreciation as, for example, the Eurozone, if the shock is larger this would suggest a larger hit to growth.
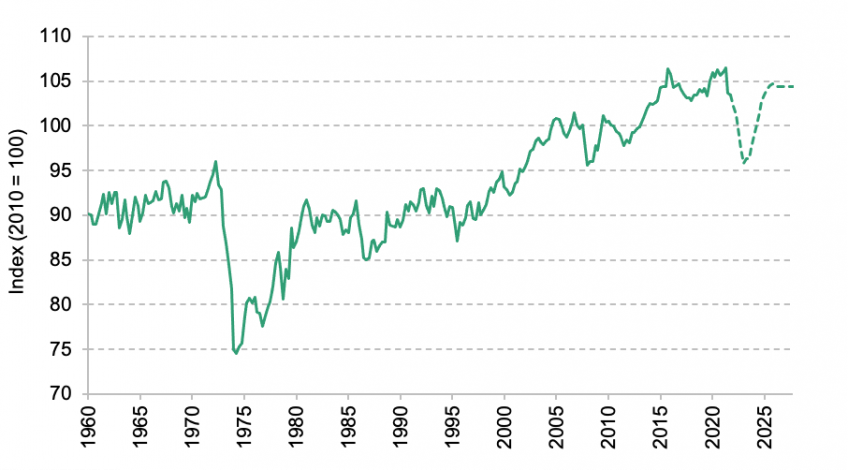
This, however, gets to the nub of the issue. That is, it is no longer clear this kind of shock is sufficient to return the UK economy to rude health. Whereas the Eurozone has tended to recover over time from an adverse real effective exchange rate shock, the UK seems to have experienced some permanent scarring. In part, this relates to some statistical challenges around the Great Financial Crisis (GFC).9 However, when the real effective exchange rate depreciates, this should mean the tradable sector grows as a share of overall GDP. Pre-2008 that does indeed seem to have been the pattern. However, in the period since, the rate of reallocation has fallen (see Figure 2.5).
For now, many of these themes are ‘on ice’. By implementing a cap for both the household and corporate sector, the UK government has stepped in to securitise inflation at scale – absorbing the loss from higher energy prices, and for now preventing these driving domestic prices higher. This is protecting domestic incomes. And if the shock to gas prices does indeed prove temporary, then the widening of the current account deficit should prove only temporary, and broader adjustment unnecessary. This, however, is little more than ‘chancing your arm’, and at macroeconomic scale. If changes do prove necessary, currency depreciation is likely a central part of any associated adjustment. But what the above suggests is that this is no magic bullet. Instead, these effects always leave UK households and firms worse off. These effects are likely to be large, while the slowing rate of substitution between tradable and non-tradable parts of the economy also suggests economic adjustment seems likely to prove considerably more painful than, for example, in the early 1990s, when depreciation alone was sufficient to deliver growth.
Figure 2.5. UK: tradable share of gross value added, 1990–2022
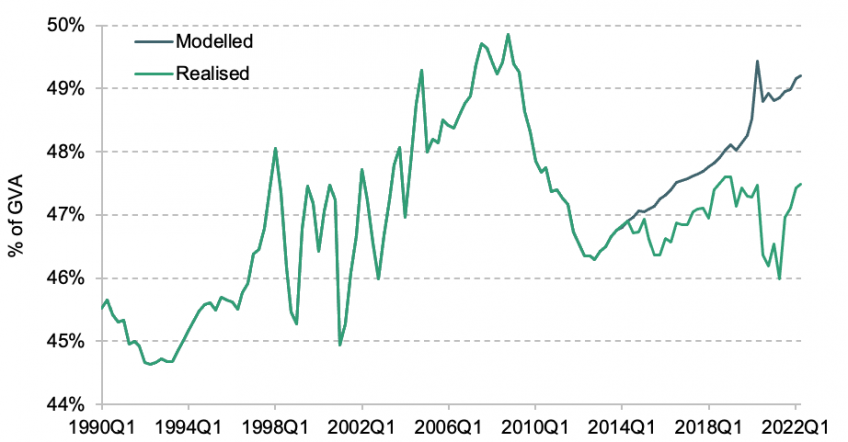
Note: Model here reflects BVAR model of the change in traded share of GVA estimated between 1990 and 2007.
Source: ONS, Eurostat, Bloomberg and Citi Research.
The outlook for household consumption
Households face a challenging few months ahead. Even with significant support, many are still facing up to a large income squeeze.
Here, the recent economic data have already showed a softening outlook. In contrast to most downturns, consumer confidence has led the downturn in both the UK and Europe. Many of the price increases associated with the terms-of-trade shock affect households directly. And as increases in food and energy bills have piled up, households’ view of their own financial situation has deteriorated especially quickly.10 Household consumption growth has decelerated from 0.6–0.7% QQ at the end of 2021 to 0.2% in 2022Q2. Retail sales have contracted by 5.5% cumulatively since October 2021. While reductions here were previously offset by a rotation towards consumer services, these effects seem to have faded during 2022. Recent CHAPS spending data showed overall nominal consumer spending still 4–5ppt below February 2020 levels. These data also now seem to be easing.
Figure 2.6. UK: components of GfK consumer confidence, 2010–22
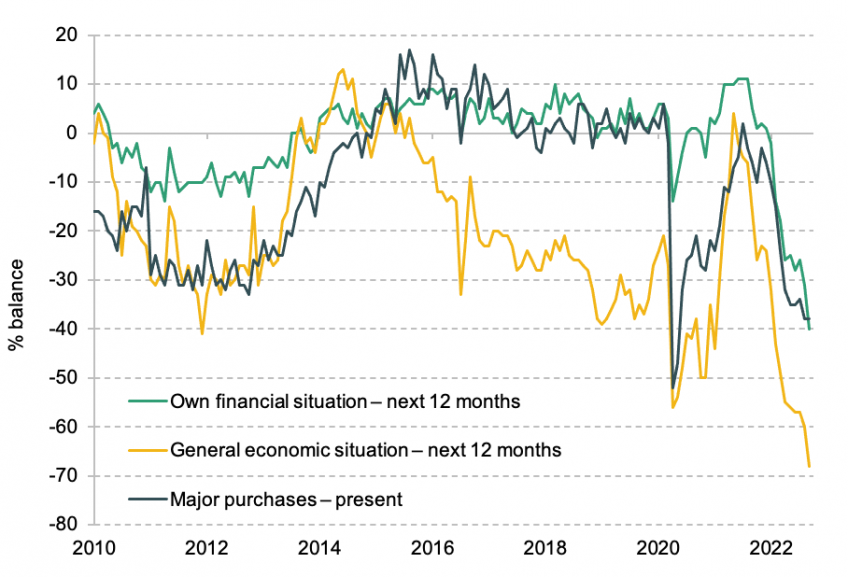
Source: Citi Research and GfK.
As cost-of-living pressures intensify, we expect household consumption to fall by 3% over 2023. Three factors are central to the outlook here:
First, even with significant fiscal support, households are already facing up to a crushing set of price increases. As we explain below, wage and employment growth should remain relatively buoyant in the months ahead in nominal terms. However, even with the cap to household energy bills, wage increases are still likely to remain well short of rates of inflation. We think real household disposable income seems set to fall back by a little under 2% on average over 2022 and 2023 (see Figure 2.7).
Figure 2.7. UK: real household disposable income (RHDI) growth, 1957–2025
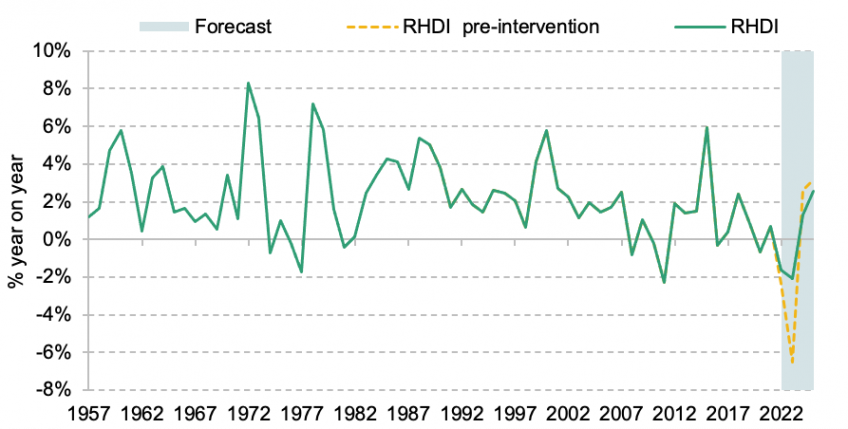
Note: The difference between the pre-intervention and current RHDI reflects measures announced since the March Spring Statement.
Source: ONS and Citi Research.
Breadth, as much as depth, of the price increases matters here. We count challenges on five fronts:
- Household energy bills. Ofgem confirmed a 54% increase in household dual-fuel energy bills in April, with the standard tariff increasing £693 from £1,277 to £1,971. Even with additional support, this still left UK households absorbing £19.5 billion in additional household energy costs. A further £500 increase associated with the price cap increase in October will still leave households a further £14 billion worse off in annualised terms – although these effects should be initially offset by the previously announced £400 rebate. In early September, 48% of households reported they were struggling to pay their energy bills, versus 35–40% in 2022H1.11
- Fuel prices. Despite recent reductions, diesel and petrol prices are still both up 33% and 26% respectively compared with the same month in 2021. The impact of these increases on spending is compounded by compositional normalisation as the economy has reopened – with spending on commuting and other day-to-day travel returning to its pre-COVID range in volume terms. Price increases here over the past 12 months amount to around £330 in additional annual spending for the average UK household. Nominal spending on fuel reached twice the level observed in February 2020 in July, according to data from Revolut (Office for National Statistics, 2022b).
- Food prices. Food prices have already contributed to the squeeze on household incomes. Kantar data show the typical UK household is paying £571 more for food annually than it was this time last year,12 with the latest ONS Opinions and Lifestyle Survey noting this has been the primary driver of the crunch on incomes to date (with 95% of respondents noting food was now significantly eating into household incomes).13 We expect food inflation to accelerate to roughly 17% by 2023Q1, up from 10.8% in August. This is primarily owing to higher food, commodity, energy and import prices.
- Housing costs. House prices have grown sharply so far during the pandemic, with the latest Nationwide data pointing to roughly a 10% annual increase over the last few months. We expect these increases to feed into higher rental prices over 2023.
- Lagging benefits uplift. Last, many of those on the lowest incomes have also been struggling with a relatively low increase in core benefit payments. UK benefits are generally uprated by CPI in September of the previous year. This meant a 3.1% increase from April. However, this is juxtaposed by an increase in annual CPI of 9.9% in August – a 6.2% real terms fall. Though some of these effects were also offset by the large share of the May support package paid to those on means-tested benefits.
In an economy whose median post-tax household disposable income is roughly £30,000, this is a crushing squeeze. Compared with the UK’s longer-term economic history, this would still be among two of the weakest years on record, one after another, although the price cap, the £15 billion May package and the further £22 billion in personal tax cuts do reduce the risk of what would have been a much worse outlook (Figure 2.7).
Second, we think the scope for dissaving is likely to prove limited. Household income of course does not translate one-to-one into consumption. Given the large accumulation of saving during the pandemic, the hope for some time has been that some of this accumulated saving could be used to smooth over the looming shock. Unfortunately, we think the scope for dissaving is limited. We expect household saving rates to fall to 7.2% at the trough, versus 3.5% in the latest Bank of England estimates.
As we noted in last year’s Green Budget (Nabarro, 2021), if widespread dissaving is to materialise, one of three arguments will have to hold: (1) deferred demand; (2) changes in credit constraints; or (3) a large improvement in the net asset positions of households, and robust forward-looking optimism. While we think there is some evidence of deferred demand effects over the summer, many of these effects now seem to be fading.
Figure 2.8. UK: household saving rate by income decile, 2020–22 (forecast)
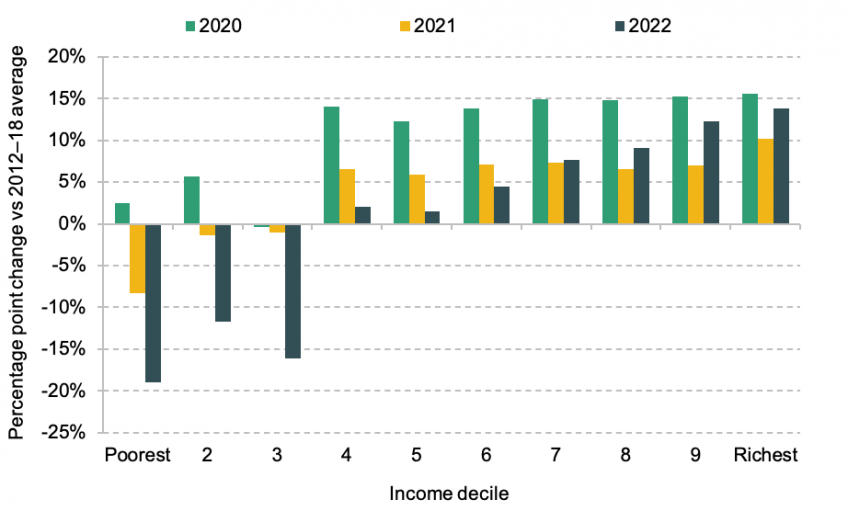
Note: These data measure income minus expenditure, divided by income. They are therefore not directly comparable to the headline household saving rate. These data are a forecast based on Citi’s household income decile model. The data show the deviation in the savings rate from the 2012–18 average. All of these data are Citi forecasts.
Source: ONS and Citi.
Instead, we think that if dissaving is to accelerate, this will relate primarily to changes surrounding credit constraints. The issue here is while household savings accumulated during the pandemic were extensive, they were heavily skewed towards those at the upper end of the income distribution. Our modelling would suggest net household saving became increasingly regressive (see Figure 2.8) – backing up survey data suggesting a strong positive association between income and ‘active’ wealth accumulation (Leslie and Shah, 2021). These higher income groups are suffering a smaller real income squeeze since less of their budgets are spent on energy and food. This suggests a more limited ongoing boost compared with a conventional baseline.
There are several signs of this in the recent data. The share of households claiming they cannot manage an unexpected £850 expense has been climbing (Office for National Statistics, 2022a), for example, while the overall level of outstanding deposits has remained steady. This suggests that these cash balances are in the ‘wrong place’ macroeconomically speaking. In other cases – for example, towards the middle of the income distribution – there may be scope to borrow on the back of improved housing equity. But this also speaks to the wider issue: while the use of deposits is relatively limited, the use of debt to try to smooth over recent price increases does indeed seem to be on the rise. The ONS Opinion and Lifestyle Survey shows the share of households now leaning on credit to cover day-to-day costs has increased 7 points since the end of 2021, with these data still on an upward trajectory. The Bank of England consumer lending data show similar increases in credit card balances.14
While there is scope for consumer debt to grow further, the issue in our view is that as monetary policy is tightened, the availability and cost of credit are likely to make this more and more difficult. This means a mechanical widening in credit spreads. Affordability metrics in many parts of the unsecured consumer credit market are coming under strain. The latest data from the Bank of England’s Credit Conditions Survey suggest one of the most abrupt tightening episodes for unsecured consumer credit,15 even as demand is picking up. This, we think, is likely to limit the scope for further dissaving.
Overall though, net household balance sheets have improved through the pandemic. In comparison with the pre-COVID trend, the total increase in household deposits, as well as the reduction in unsecured consumer credit, amounts to around 7% of GDP. Looking at the total change in household net assets since the start of 2020 overall, we think the ‘real’ net increase amounts to 14.2%. Although net increases seem to have been concentrated almost exclusively among those in the top half of the income distribution (Leslie and Shah, 2021).
Dissaving is likely to offset some of the adverse shocks looming in 2023, if to a limited degree. One notable question here is whether dissaving could provide a more persistent tailwind further out. We do expect a small net boost from these effects in the latter years of the forecast. In the near term, uncertainty regarding the persistence of some of the recent price increases we think will reduce the incentive to dissave (Bunn et al., 2017).16 And with more of these positive wealth effects driven by increases in real asset values, we think the marginal propensity to consume out of such increases will be low (Figure 2.9). But unlike the GFC period, households are unlikely to go through a painful and protracted period of deleveraging. And in the medium term that should provide a small relative boost.
Figure 2.9. UK: growth in ‘real’ net household wealth, 1990–2022
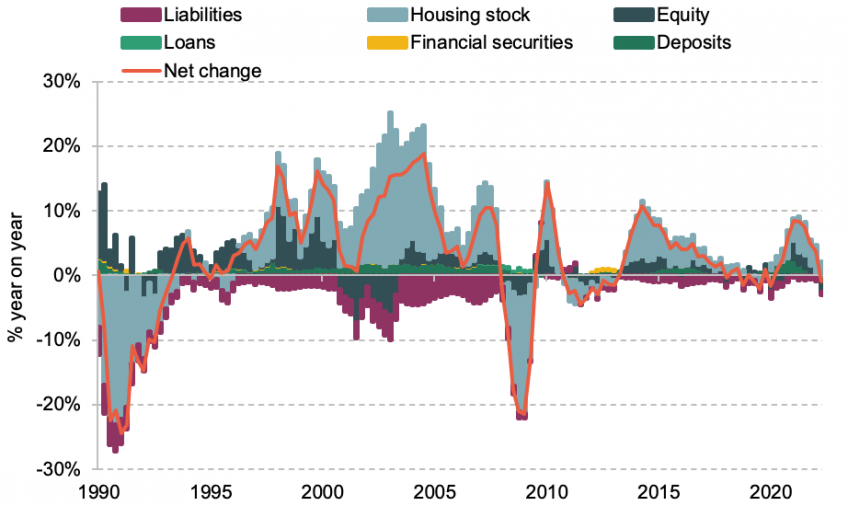
Note: Real household wealth is derived by deflating total nominal household wealth by the consumption deflator.
Source: ONS and Citi Research.
One implication of the argument above is that household wealth inequality has likely widened further through the pandemic (see Figure 2.10). Among lower-income households, we think a limited bout of borrowing over the coming months is likely to worsen further their net assets position. For higher-income households, the boost associated with the pandemic years seems likely to be preserved. With shocks to areas such as food and energy prices likely to grow more common, widening inequalities here reflect a worrying erosion in macroeconomic resilience. Improving the wealth share of those outside of the top income decile is likely essential to allow these shocks to be effectively weathered in the years ahead.
Figure 2.10. UK: real net household wealth by income decile, compared with median, 2007–22
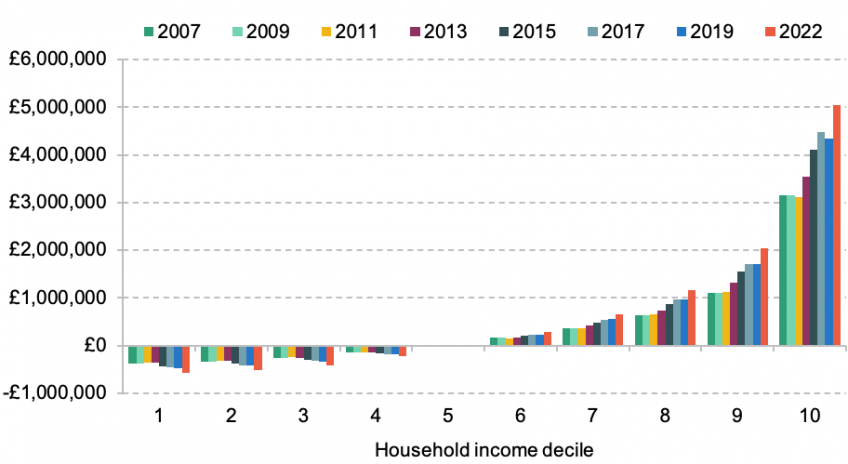
Note: Findings are based on the ONS Wealth and Assets Survey. Deflated based on CPI inflation for the given income group. Chart shows real household net wealth minus the median in the same period. 2022 is a forecast.
Source: ONS and Citi Research.
Third, we expect higher rates to weigh meaningfully from 2023H2. The Monetary Policy Committee has engaged in the fastest monetary policy tightening since Bank independence. It seems certain more is to come (see Section 2.6). As we explained above, we think changes here are already feeding into the availability of riskier consumer credit products. But pass-through into mortgage costs also seems likely to drag.
Compared with previous tightening cycles, the impact on household finances is attenuated by the shift towards fixed-rate mortgages. Whereas these made up just 40% of all outstanding mortgage lending in the early 2010s, today the equivalent proportion is roughly 85%. However, whereas in other economies where mortgages can be fixed in long durations (10 years +), in the UK the vast majority (95%+) of all mortgage lending is fixed at either a two- or five-year duration. Increases in Bank Rate therefore still feed through into household debt servicing costs relatively quickly.
Over the coming months we see this as an increasingly important headwind for household consumption. With Bank Rate set to increase to 4.5% in the months ahead under our central forecast, we expect quoted mortgage rates on two- and five-year fixed-rate tariffs to increase by roughly 5ppt versus their trough in early 2020. This would suggest an annual increase in debt servicing of roughly £8,500 for a household with the average outstanding mortgage balance of £181,000.17 Mortgaged owner-occupiers make up just over 30% of households – meaning a smaller aggregate impact on demand overall. But even so, this would still suggest a multi-thousand-pound increase in average household costs.
These effects will not materialise all at once. But while some households took the opportunity to refinance at the start of 2022, there is still a large glut of fixed-rate mortgage tariffs that are likely to roll off over the coming months. These reflect the surge in activity following the introduction of a stamp duty holiday in 2020. We expect the effective interest rate on outstanding mortgage lending effectively to double over the coming months from a trough of 2.0–2.1% in the early part of 2022 to 5.0% at the start of 2024, weighing on household disposable income by roughly £1,600 on average per household.
Figure 2.11. UK: effective interest rates, 2005–25
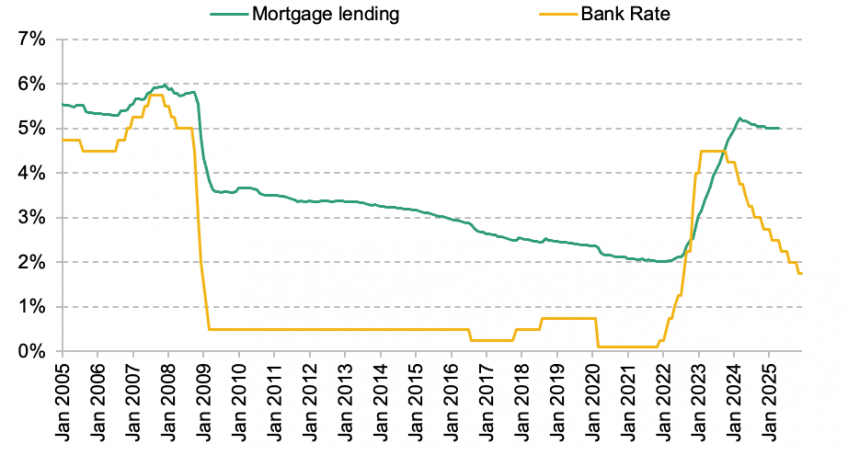
Source: Bank of England and Citi Research.
In order to meet these higher debt servicing burdens, we think the hit to consumption will be relatively large, constituting a further headwind through 2023 and 2024.18 Despite the robust position of better-off households, we also expect UK house prices to fall by roughly 7% by 2023Q3. Last month’s cut to stamp duty will provide some offsetting support to prices, if not activity. But we think rates at these levels will be sufficient to drive some forced selling among owner-occupiers, particularly those in the middle of the income distribution.
We expect these effects to be compounded by vulnerabilities in the private rented sector. In recent years, mortgage lending within the buy-to-let sector has made up 10–15% of all new mortgage advances.19 Given the growing share of the private rental sector overall (HM Government, 2021), we see some potential for forced selling here too. For the first time, landlords may have to manage with mortgage rates notably above average annual rental income (as a share of the property value). Recent restrictions surrounding tax deductibility on mortgage interest income add to the risks.
Combined, this outlook suggests any meaningful recovery in household consumption is likely some years away. While, as we have noted in previous years, it is always dangerous writing off the UK consumer, we think the headwinds here are likely insurmountable. In the near term, price increases associated with the terms-of-trade shock seem likely to weigh. From the second half of next year, increases in mortgage costs are likely to become the key headwind. More policy support could offset these effects in the near term, though as we discuss below that would likely only push the downturn further out.
We should stress that such a protracted period of consumer weakness has been a rarity for the UK, certainly since the 1950s. In the near term, the implication of the household saving discussion suggests that any efforts to boost incomes for lower-income households would have a particularly high multiplier. From a macroeconomic perspective, cutting benefits in order to finance cuts to direct taxes seems likely to only weigh on the outlook.
The looming challenge for firms
While consumer sentiment has deteriorated sharply in recent months, the business equivalents have generally proven more resilient. The latest business sentiment surveys are on average 0.8 standard deviations below their long-term average – soft, but substantially better than the record lows observed for consumer confidence. Indeed, some had suggested that business investment could take over responsibility for driving the recovery, even as consumption begins to slow (Bank of England, 2022a). This would have some notable advantages. After years of consumption-driven growth, some recovery here is likely necessary if any economic recovery is to prove sustained.
Note: Each series is normalised over the 2010–19 period. The swathe shows the range of soft activity indicators.
Source: Citi Research, ONS, CBI, BCC, BRC, IHS Markit, Deloitte CFO Survey, Lloyds and Nowcasting Economics.
Unfortunately, we think the relative resilience in business sentiment primarily reflects a handful of transitory effects. In particular, intense supply disruption during COVID had resulted in record backlogs across both the consumer- and business-facing sectors. The latest data show these are now decelerating. Weakening demand within the consumer-facing economy is broadening. New work balances within the Purchase Managers Index are now at a 20-month low. Business optimism has also fallen to its lowest level since May 2020.
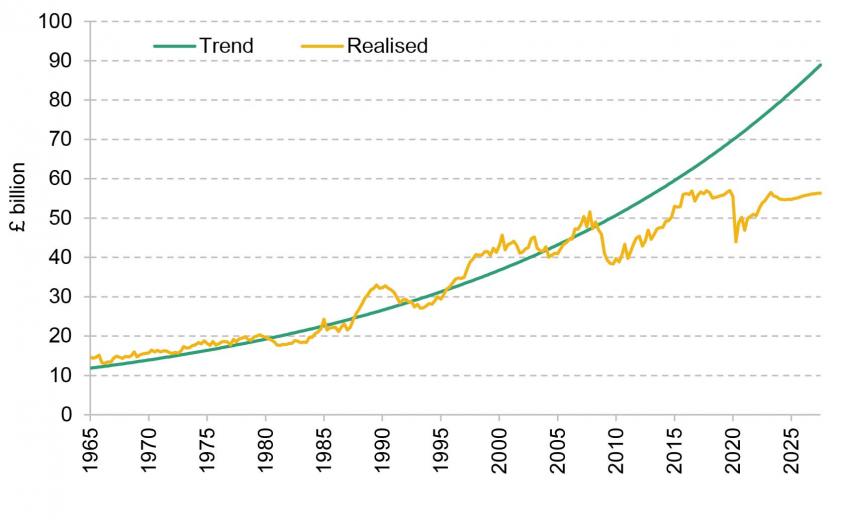
The outlook for investment merits special attention in our view (see Figure 2.13). Productive investment has been the key blemish for the UK economy not just since 2016, but even prior to that – where rates of investment have increasingly diverged from historical user costs of capital. In part, these trends reflect (1) a large substitution into intangible investment (Haskel and Westlake, 2018) and (2) evidence in some cases of capital rationing – especially in the period post-GFC. But even so, some residual ‘under-investment’ seems to remain (Bailey et al., 2022). Unfortunately, near-term prospects are likely to remain weak. We expect investment to be weighed down by three headwinds:
Figure 2.13. UK: business investment, 1965–2027
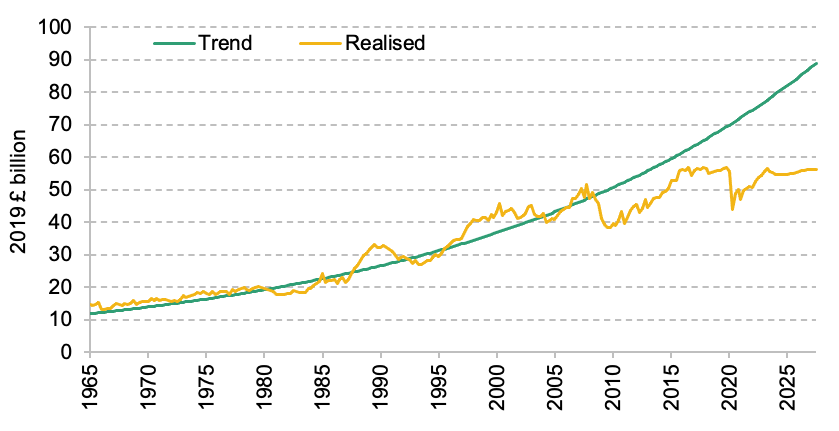
Note: Trend business investment growth is based on growth between 1965 and 2007. Forecast period is from 2022Q3.
Source: ONS and Citi Research.
First, margins are likely to come under extensive and sustained pressure. Firms face challenges on two fronts. First, cost pressures are likely to intensify further. While government support announced to date should offer firms considerable help, electricity remains a particular issue.20 Recent increases would still suggest total corporate energy spending increasing from around £5 billion per quarter in 2021 to £10 billion per quarter through the end of this fiscal year, and potentially to £20 billion when support is unwound. This sits alongside a range of other imported cost pressures.
On the other hand, softening demand also means firms are increasingly struggling to pass on further cost increases to customers.21 So far, dynamics here have been relatively healthy. Within consumer-facing sectors, output prices have roughly kept pace with their input equivalents. While this has been relatively asymmetric across sectors (Bunn et al., 2022), firms have generally reported stronger pricing power than usual.22 But broader signs of stress have begun to emerge in recent months. Within the PMI data, for example, the spread between input and output prices widened to a record extent through the start of 2022. Output price growth has also moderated seven months in a row. PPI inflation – charged to firms – has continued to accelerate among manufactured goods, even as CPI inflation has eased back.
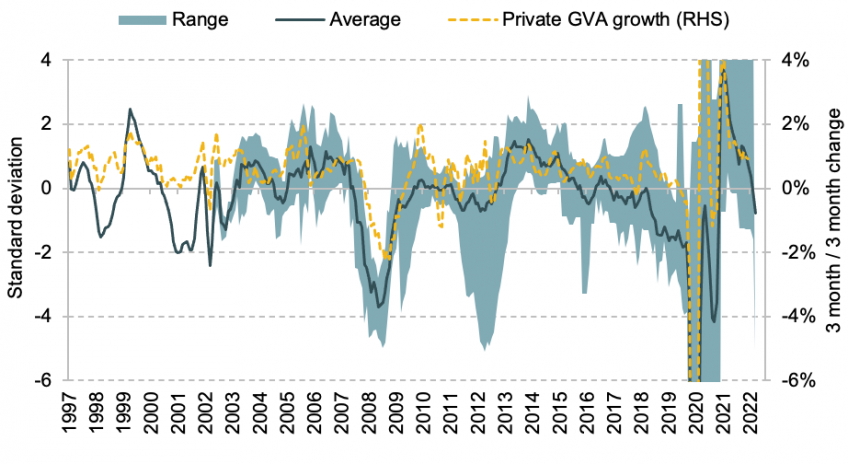
The latest survey data show profitability expectations among their weakest on record (see Figure 2.14). Our own models would also suggest gross operating surplus falling by 1ppt by the middle of next year. This need not in all cases be a mark of low investment, especially when capacity utilisation rates are high – as they are today. However, the impact on investment tends to hinge on business optimism, and the associated growth backdrop. For example, within the CBI Service Sector Surveys, there is little clear correlation between costs and investment intentions, but during periods of softer growth the correlation tends to be much stronger, and negative. In the current circumstances, we would expect a reduction in profitability to have a negative impact on investment.23
Figure 2.14. UK: survey indicators of capacity utilisation, investment and profitability, 2007–22
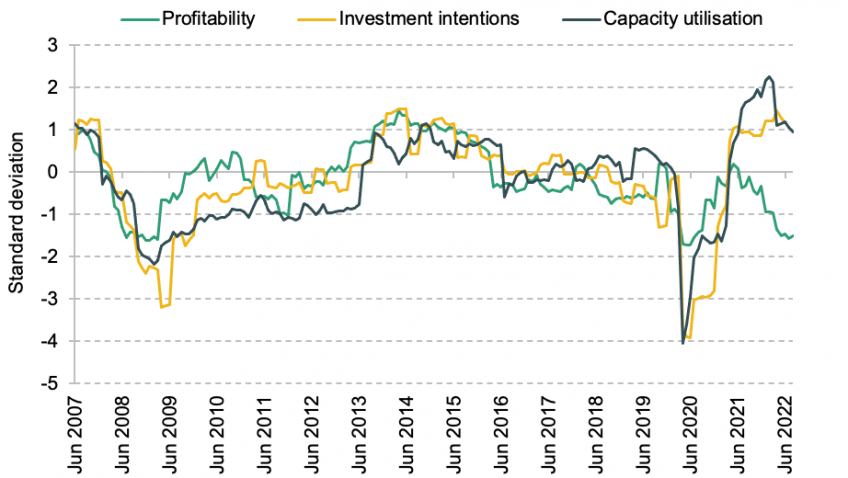
Note: Data are normalised over the 2007–22 period.
Source: Citi Research, Bank of England, BCC, CBI and Deloitte.
Second, firms are facing higher financing costs. We expect Bank Rate to increase to 4.5% in the months ahead. Markets have priced in an even larger increase. Whereas households have insulated themselves somewhat via the shift towards fixed-rate mortgages, corporates remain heavily exposed. Some shorter-duration money market and floating loans have been refinanced at longer, fixed terms. The issue is that that is not sufficient to compensate for legacy financial agreements. As a share of bank lending, therefore, over 75% of the outstanding balance is still payable on a floating rate. This amounts to just under 41% of all corporate debt. Among SMEs the share is similar – around 70% – despite the fixed-term lending under the Bounce Back Loan Scheme.
Higher rates are therefore likely to bite hard. Lending rates on outstanding non-financial corporate sector lending have already increased by 90bp since March 2021 – a much larger increase than that on outstanding mortgage lending. Recent volatility on both equity and corporate lending markets suggests the increase in the total weighted average cost of capital is likely somewhat greater. The latest survey data show firms are now beginning to adjust their plans in the face of higher rates. The proportion of services firms, for example, noting the cost of capital as a constraint in investment decisions is up 9 points on average compared with the end of 2019 (CBI, 2022). We expect this to weigh on investment through 2023 and 2024.
Figure 2.15. UK: net rate of return and cost of capital, 2004–24
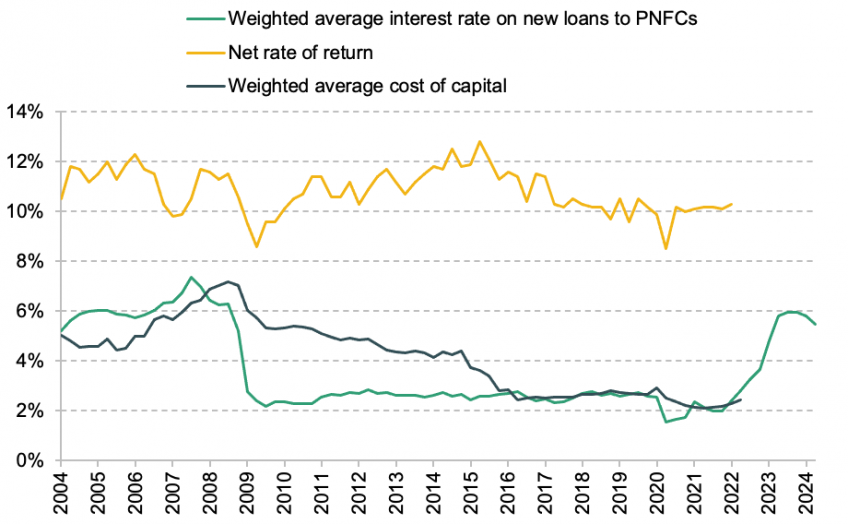
Note: PNFCs are private non-financial corporations. Net rate of return is measured here as gross operating surplus, net depreciation and revaluation, as a share of total assets.
Source: ONS, Bank of England, Cunliffe (2017) and Citi Research.
One important issue here has been a notable widening between the cost of capital for many firms and the rate of return on investment (see Figure 2.15). Some have argued that in the years to come this ‘additional risk premium’ could begin to narrow (Haldane, 2021). We are less sure. Many of the factors that contributed to these effects, including growing economic tail risks (Vlieghe, 2019), and broader increases in economic uncertainty, remain as salient today as they were in the years post-GFC.
Third, and last, we think firms are also likely paring back their investment plans in light of a weaker medium-term economic outlook. One notable feature of the current data is the marked divergence between the ‘effective rate of return’ on current capital assets including and excluding valuation effects (Figure 2.16).24 What this effectively means is that the future productive potential of many assets is being written down. While such divergences are common during sharp downturns, in general the two series tend subsequently to converge. However, write-downs seem to be increasing, rather than beginning to fall back. This points to a more structural revaluation.
Figure 2.16. UK: effective rate of return including and excluding revaluation, 1960–2022
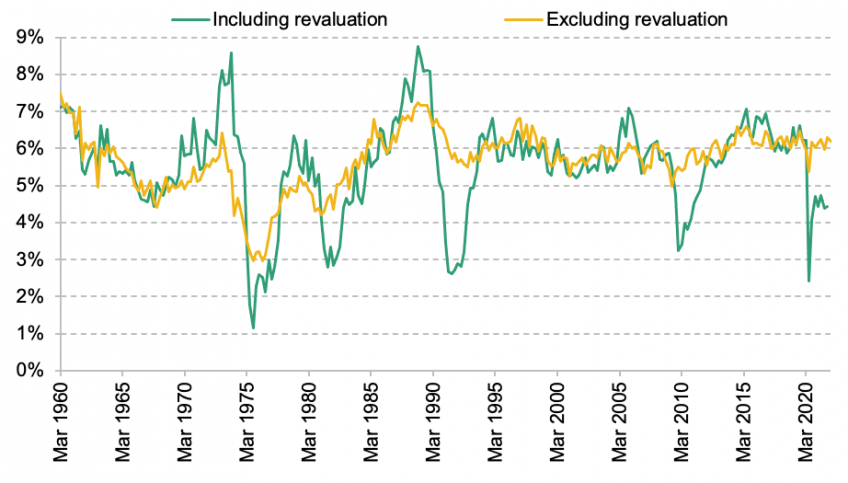
Note: The effective rate of return is calculated as the gross operating surplus divided by the overall stock of capital. Revaluation effects are calculated in the conventional fashion, based on the approach of Hall and Jorgenson (1967).
Source: ONS and Citi Research.
Why does this matter? There are two issues here. The first, and more direct, concern is when assets are written off this can weigh directly on business investment – which is calculated as a net measure. The second, and perhaps more interesting, implication relates to firms’ willingness to invest. Usually this is a function of returns, as well as interest rates, expected depreciation and the expected change in the value of the asset. If asset prices are falling, this can make firms considerably more cautious. However, this also points to the potential for better investment outcomes if policymakers are able to separate expected returns from a weak contemporaneous reality. For now, the UK seems locked on a more pessimistic trend.
Figure 2.17. UK: survey indicators of investment and lagged business investment growth, 2007–24
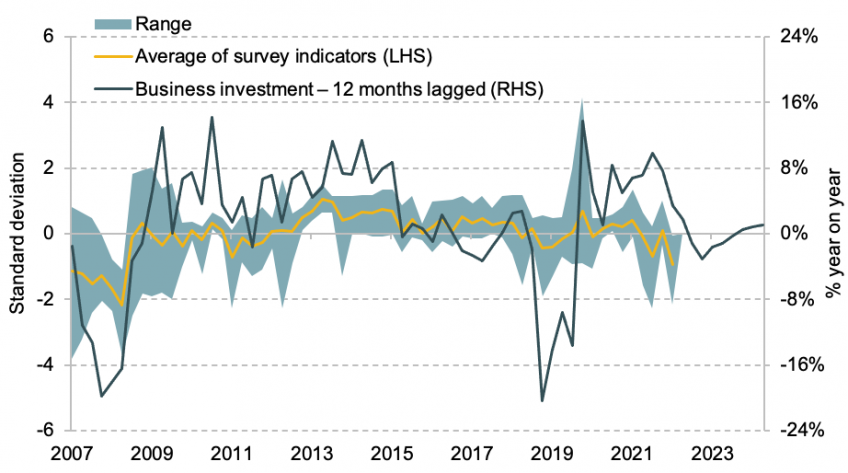
Note: Data normalised over the 2007–22 period. The swathe displays the range of soft indicators. Forecast period is from 2022Q3.
Source: Bank of England, CBI, Deloitte, ONS and Citi Research.
We should stress here the near-term outlook is of course not pure doom and gloom. In the very near term, investment is likely to be supported by the 130% ‘super deduction’ implemented by former Chancellor Rishi Sunak.25 Alongside the 50% first-year allowance, we think these changes alone imply a reduction in the user cost of capital of 1.5–2.0ppt. Ordinarily, this would suggest an increase in investment of 10–15%. With the offsetting increase in the rate of corporation tax now dropped, we expect this policy to offer a stronger near-term boost to investment in March, before softening back thereafter. Several specific supply constraints – especially surrounding labour – should also ease.
However, investment itself is also relatively energy intensive. Recent increases in energy prices are therefore likely to weigh. And given the UK government has also chosen to prioritise consumption over investment, we think that also implies further weakness on the investment side. With investment in 2022Q2 still 5.7% below its pre-COVID (2019Q4 level), we expect this level to be surpassed only now in 2026. This is likely to leave the UK in a worse medium-term position.
Is the current account sustainable?
The external side of the UK economy is now an urgent concern. As we noted above, the government’s response to the current energy crisis seems likely to weigh further on the current account. In Q1 of 2022, the external deficit already widened to 7.2% of GDP – a new record. We expect a further widening to over 8% in the months ahead, before moderating thereafter. A due dose of humility is required here. The UK trade data are volatile at the best of times. And the most recent estimates are especially uncertain. The current account deficit for Q1 alone was revised by 2.8ppt.26 However, in our view, the underlying data here remain very weak.
As in 2017, UK trade has once again failed to capitalise on a buoyant global environment through 2021. Instead, total goods exports to both EU and non-EU countries are around 15–20% off G7 averages. A synthetic control unit that seeks to control for the industrial composition of UK trade would suggest UK trade is lagging its pre-Brexit/COVID benchmarks by around 25–30% overall.27 Differences between UK and EU trade data suggest volumes are likely to continue to fall somewhat – with the UK still a conduit for goods produced elsewhere in the world into continental Europe. Compared with G7 peers, the UK is becoming a less open economy.
Figure 2.18. G7: total trade, 1980–2022
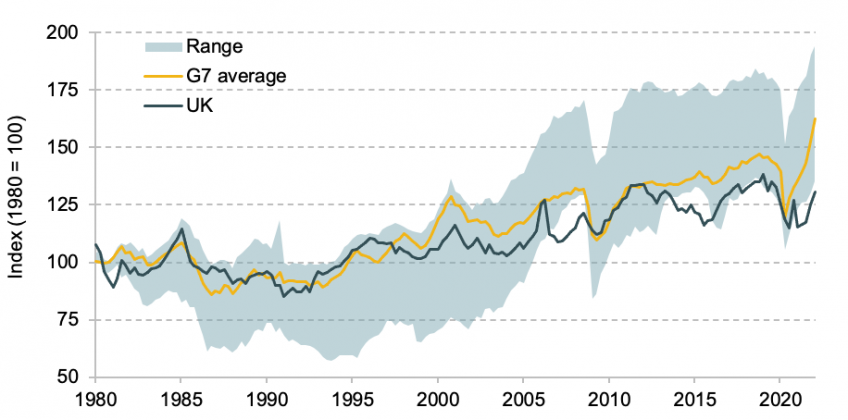
Note: Range here reflects G7 performance excluding the UK.
Source: ONS, national statistical offices and Citi.
Overall volumes here should continue to recover somewhat. The combination of both Brexit and COVID seems to have generated a series of compounding disruptions. This seems to be especially true of imports where border disruption and reported delays have been especially severe. In the months ahead, we expect these transitional difficulties to continue to fade.28
As volumes normalise, we expect the associated recovery to drive a further widening in the UK trade deficit.29 Among exporters, there seem to be signs of structural adjustment. A larger share of exporters – for example – report a more persistent shift away from EU markets. This is corroborated by Freeman et al. (2022), who have shown a sharp fall in the number of firms exporting to the EU in 2021 not matched by fewer UK residents importing. In our view, these structural changes are a key signal. Exiting international markets can be expensive. When temporary disruption adds to trading costs, firms tend to respond by reducing trade volumes overall. This is the pattern observed among imports. But when a shift is more structural, this tends to drive acute changes in composition. As demand and supply conditions normalise further in the years ahead, we think this implies persistent downward pressure on net trade.
One area of particular concern is exports of professional and financial services. COVID has weighed on services trade in general in recent years – with services imports and exports lagging their pre-COVID levels in July 2022 by 21% and 13% respectively. However, looking under the surface, the drivers in each appear quite different. Services imports in particular tend to be more heavily focused in areas that depend on the movement of people. In total, 45% of all UK services imports are via so-called mode 2 and mode 4 of services trade which depend on the movement of people (versus 12% of services exports). This we think points to a stronger recovery in imports as conditions normalise. In financial and professional services in particular, much of the relative weakness has been driven by weaker export growth to the EU (Barfield, 2022). With regulatory divergence set to gather steam in the years ahead, these effects seem likely to worsen.
Figure 2.19. UK: changes in services exports (difference in growth 2018–21 between EU and rest of world)
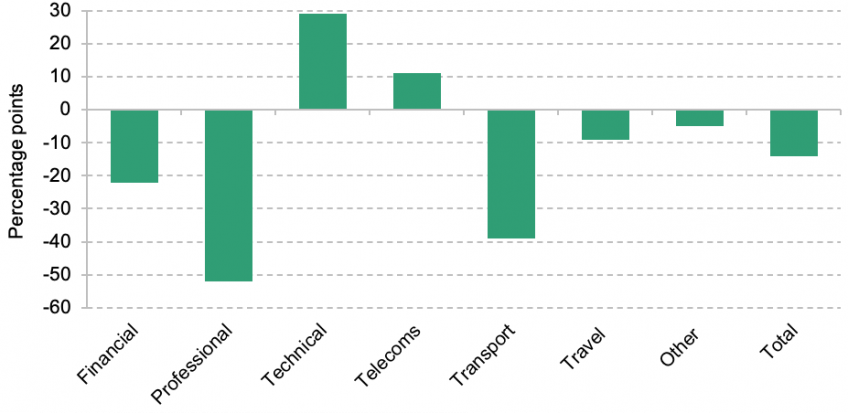
Note: The value here shows the percentage point difference in cumulative growth 2018–21 between services exports to the EU and those to the rest of the world.
Source: ONS, Barfield (2022) and Citi Research.
A large and persistent trade deficit opens a second question – namely how is the UK likely to fund itself?
In recent years the UK’s net investment position has continued to deteriorate (now at 123% of GDP). Unlike in the years pre-GFC where the UK generally recycled portfolio flows into foreign direct investment (FDI), these processes have ceased – at least in net terms. The UK has instead been increasingly using inflows to fund its own domestic consumption.
In the months ahead, we think the UK may find this increasingly difficult. Unlike in the years post-GFC, the UK will also have to secure funding in a context where the share of incoming FDI is much lower, and competition for capital across the transatlantic economy is likely to be considerably greater. The outlook here is directly linked to the outlook for government borrowing, with international portfolio inflows increasingly focused on the purchase of government debt.
This, we think, is a more structural concern for the UK. While the UK has run large current account and fiscal deficits for some time, the scale of these seems set to grow. Most of the UK’s net liabilities are focused in portfolio debt instruments. That means that should the UK economy shrink, there is no fall in the nominal value of the instrument. That shifts more of the burden of adjustment onto the exchange rate.
Figure 2.20. UK: net financial account, 2011–22
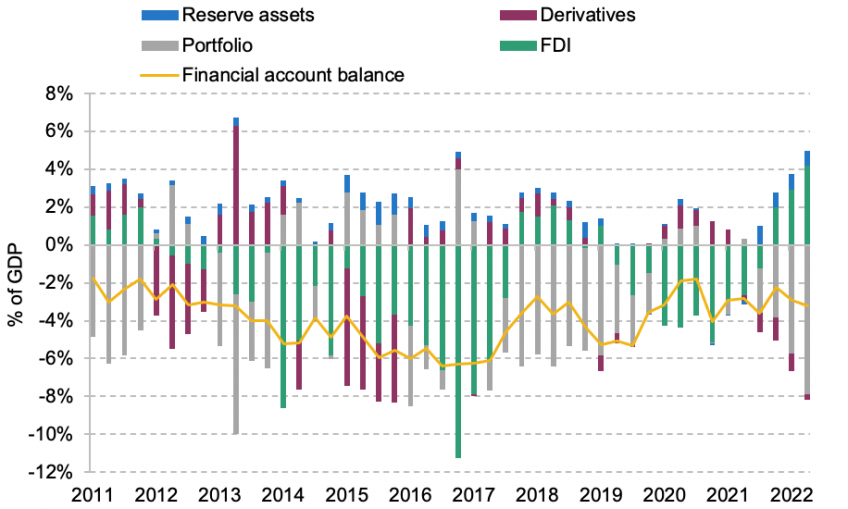
Note: Data show four-quarter moving averages.
Source: ONS and Citi Research.
Neither of these factors means the UK is at immediate risk of a ‘sudden stop’ with respect to capital inflows. However, they highlight the risks. With a large fiscal and current account deficit, UK monetary and fiscal credibility are likely to be under particular scrutiny. These effects point to another interdependence, namely that associated with domestic household saving. If dependence on foreign capital is to be reduced, the easiest way of doing so would be to encourage more household saving. However, as we noted above, that would come at the expense of near-term growth.
2.3 Supply, capacity and adjustment
The UK has been subject to a series of large, successive supply shocks. By virtue of both their scale and the fact they have occurred in quick succession, the impact has been especially severe. While UK GDP is currently 2.6% below its pre-COVID trend, we therefore think the economy is currently around 1.4ppt above capacity (see Figure 2.21). In the months ahead, we expect adjustment to accelerate, driving a gradual if meaningful recovery. However, we see substantial challenges ahead with respect to both labour and capacity mismatch. With rates of economic reconfiguration likely to accelerate, we think these challenges constitute a more structural challenge for economic policy over the coming decade.
Figure 2.21. UK: GDP and capacity utilisation, 2000–26
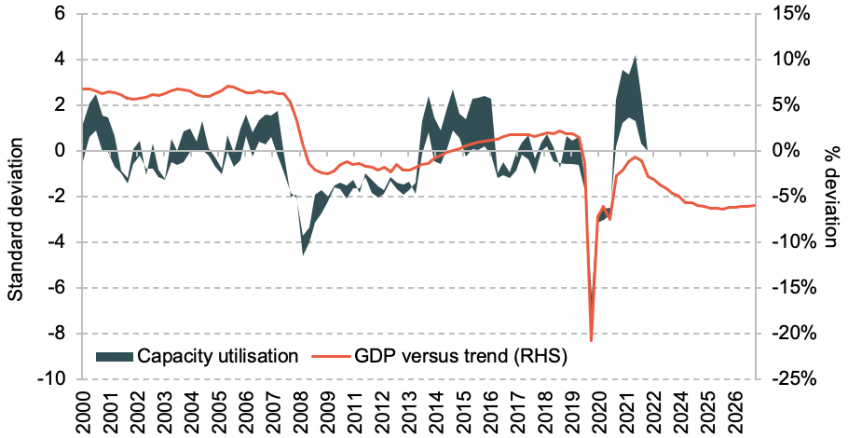
Note: The GDP deviation is taken as the gap between realised GDP and the level implied by medium-term trend growth, divided by the latter. The trend series is based on output in 2014, where the deviation is zero. The capacity utilisation measure is normalised across the period as a whole. Forecast period is from 2022Q3.
Source: ONS, Bank of England, CBI, BCC and Citi Research.
As we explain in Section 2.6, we think this necessitates a change in policy approach. While the previous section highlights the risk of doing too little, this section highlights the risk of doing too much – at least via conventional means. Simply stoking demand risks aggravating the underlying supply challenges, worsening inflation. Policy must support incomes where essential. But this also suggests efforts to foster effective reconfiguration must be more central to the UK’s policy response. This requires supply-focused policy. For now, the current fiscal discussion remains a long way away.
Mismatch: challenges for both labour and capital
While the composition of demand across the UK economy has normalised significantly, we are still working through a series of structural economic changes. Today, these relate in part to efforts to adjust to higher energy prices. They also reflect changes associated with a sharp depreciation in the exchange rate, and legacy changes associated with both Brexit and the pandemic. While rates of sectoral reallocation have decelerated in recent quarters, these remain around double the rate seen just before the pandemic, and we see potential for some modest further acceleration in the months ahead.
Ordinarily, structural economic change should not play a major role in conventional macroeconomic discussions. Economic reconfiguration is assumed to be ubiquitous and continuous, but largely irrelevant for policymakers thinking about the overall stance of fiscal and monetary policy. One sector may grow at the expense of another, but the net result for macroeconomic aggregates should be relatively limited. The problem when these effects are both large and sudden is that such an assumption is clearly false. Some employees and capacity are fixed in place – at least for a period. That weighs on supply in the interim (Broadbent, 2021a).
One way of examining these effects is to look at dispersion in price growth across sectors. As we explained in last year’s Green Budget (Nabarro, 2021), reallocative challenges would tend to mean prices rising faster in certain parts of the economy as strong demand clashes with warped supply. Earlier in the pandemic, there was clear evidence for these effects within output prices – with price growth through 2021 heavily focused in those areas with the strongest demand (Bunn et al., 2022). These effects tend to add to inflation overall as downward nominal rigidities preclude offsetting reductions elsewhere.
While these effects have begun to ease, we think there is still some evidence of the same ‘reallocative’ challenges both in the labour market and across various capital services.
On the capital side, price dispersion has increased sharply since the start of the pandemic (see Figure 2.22). Here we look at user costs across two-digit industrial sectors. Since 2020Q2, there has been a marked increase in dispersion in capital costs across sectors of the economy – more so than in the aftermath of the GFC (Broadbent, 2012). This, we think, points to some misallocation of capital. Of course, there is a question of how easily capital can be effectively redeployed. Looking instead across different assets, dispersion has also grown. But the scale of price dispersion here is actually somewhat less than in the aftermath of the GFC. This offers hope that capital can be reallocated, not scrapped.
Figure 2.22. UK: capital services costs across various capital forms, GFC and COVID
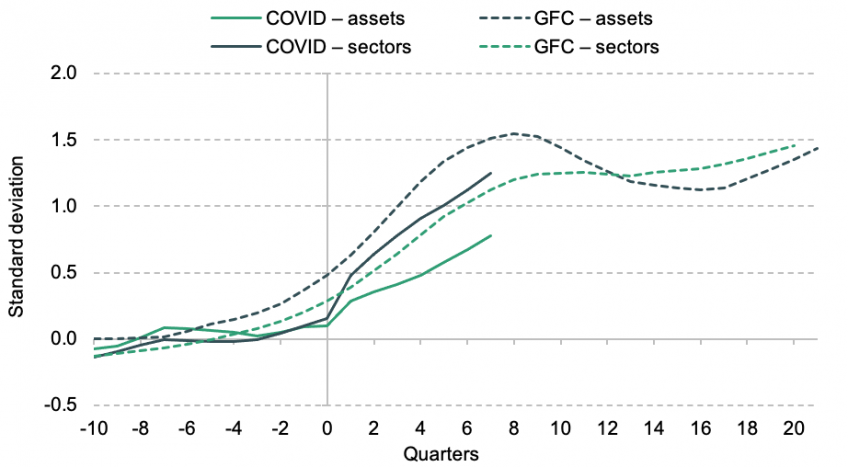
Note: On the horizontal axis, 0 reflects 2008Q3 in the case of the GFC and 2020Q1 in the case of COVID. The measure here is based on the normalised change in capital services user costs compared with the pre-GFC or pre-COVID period. The cross-sectional dispersion of these normalised series is shown.
Source: ONS and Citi Research.
In comparison with the GFC, perhaps the starker difference is within the labour market. While during the GFC there was a moderate pickup in wage dispersion – primarily owing to a sharp drop in income within financial services – across the economy overall growth remained subdued, but relatively uniform. In part that reflected that the shock initially affected those at a higher skill level disproportionately. That eased any associated matching challenge.30
Outcomes since the pandemic remain a little more disrupted. Dispersion in wage growth has jumped sharply across both sectors and regions. Increases have been greater in those areas enjoying stronger demand. In Figure 2.23, we look at the total changes in hours worked between 2016 and the end of 2021 by occupation. We then decompose those changes by the average task composition.31 This provides an indication of whether the task composition of the jobs that have been lost is similar to the task composition of those that have been created. Demand for non-routine tasks seems to be greater, and we see a skew towards human capital intensity. These data in our view suggest the potential for a more lasting mismatch issue. Wage growth has been strongest in capital-intensive sectors since 2020.
Figure 2.23. UK: task composition of job shedding versus new hiring, 2016–21
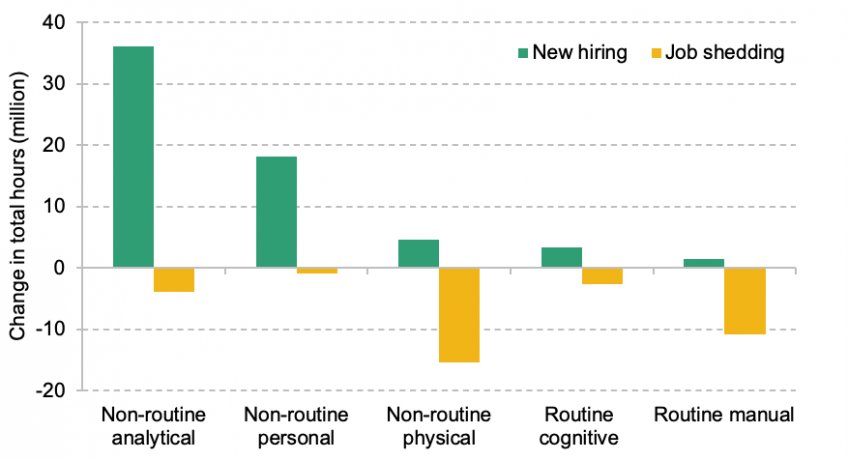
Note: These data show the change in the total number of hours worked between 2016 and 2021, broken down by task of those roles that have disappeared and those roles that have been created.
Source: Citi Research, ONS, Resolution Foundation (2022), O*NET and Acemoglu and Autor (2011).
This we think poses a more lasting policy challenge for the UK economy. In particular, whereas post-GFC the UK could adjust through differential and lower wage growth, the challenge now is to build new skills in order to plug these matching issues. This task is likely made more urgent by lower rates of immigration, with many firms previously filling these ‘skills gaps’ from overseas.32 Despite the skills-intensive nature of the recovery, labour market outcomes in recent years have been characterised by a further acceleration in ‘de-skilling’. This suggests some need to generate not just more but different skills.
Further supply shocks likely lie ahead. After two decades in which reconfiguration rates have proven mercifully low, this is likely to pose a challenge for labour market policy. Historically, this has placed much greater weight on how effectively institutions are able to reallocate workers in demand sectors (Wells, 2022). The UK has a mixed record with such policies. Notable reconfigurations through the late 1960s did little to add to unemployment – in part reflecting the intensive work of Employment Exchanges. By contrast, outcomes in the 1980s and early 1990s were considerably worse.
Figure 2.24. UK: rate of sectoral change in employment, 1958–2022
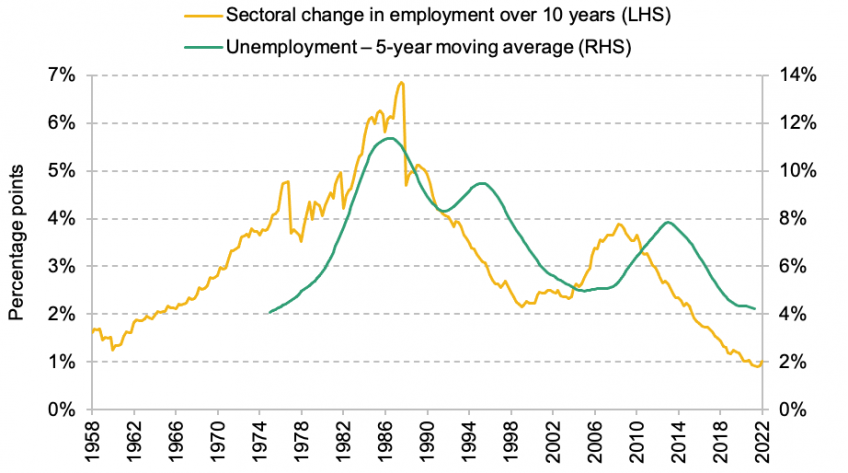
Note: Sectoral reallocation here is measured as the weighted average of the change in employment share. Measure based on Chodorow-Reich and Wieland (2020).
Source: Citi Research, ONS, Bank of England, and Thomas and Dimsdale (2016).
On the capital side, these effects mean the orderly management of insolvency is likely to become more important. In some respects, the UK is relatively well positioned here. A relatively lightly regulated economy in both product and labour market terms is helpful.33 The UK also has relatively accommodative insolvency laws, making it easier to recognise and reallocate where economical (Adalet, Andrews and Millot, 2017). Post-GFC, factors such as the weakness of banks’ balance sheets was seen as an impediment to effective reallocation, with fewer banks willing to recognise when firms were likely unviable, and their loans subsequently written down. These effects have been less severe through COVID – reflecting widespread macro-prudential reforms over the past decade. Although in recent months we think there has been some evidence of ‘diabolical sorting’ that could cause concern (Acharya, Lenzu and Wang, 2021). There may also remain some issues with the recognition of Bounce Back Loan losses (Leslie, 2022).
However, rates of business dynamism (firm formation and closure) have fallen in recent years.34 One factor that could increasingly weigh in reallocation rates is the increase of intangible capital. These assets have grown significantly as a share of the UK’s capital base. They also often constitute firm-specific capital – meaning they are harder to reallocate in a case of insolvency. This should not mean losses are not recognised ultimately. However, it does increase the risk financial firms are slower in winding down. And in recent years it does seem that intangible-intensive sectors have contributed most extensively to the slowdown in productivity.35
Will labour supply stay low?
The UK also faces a more specific associated issue – a shortage of labour. While the UK is not alone in seeing participation drop post-pandemic, the effects do now appear especially sevThe UK also faces a more specific associated issue – a shortage of labour. While the UK is not alone in seeing participation drop post-pandemic, the effects do now appear especially severe. Total labour activity is roughly 900,000 (2.4%) below where it would be had growth observed since 2012 continued (Figure 2.25). Total hours worked are even weaker – around 3.7% below, versus a shortfall of 2.6% for GDP. ere. Total labour activity is roughly 900,000 (2.4%) below where it would be had growth observed since 2012 continued (Figure 2.25). Total hours worked are even weaker – around 3.7% below, versus a shortfall of 2.6% for GDP.
Figure 2.25. UK: workforce, 2012–26
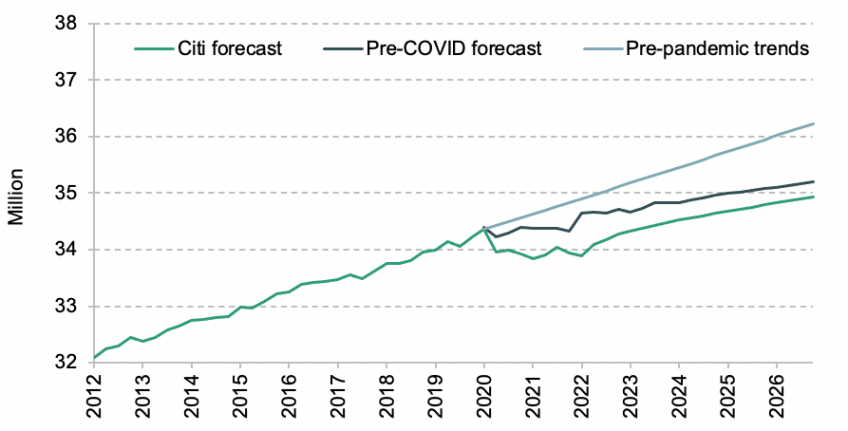
Source: ONS and Citi Research.
Over time, the impact of these changes should attenuate. A shortfall in total labour supply of 3.7% would usually mean long-term scarring of 2.1% in the medium term as production rebalances. In reality, the contribution versus our pre-pandemic baseline is a little less, around 1.0ppt, as we had already assumed a reduction in EU migration would weigh on workforce growth in the medium term. But when these shocks occur quickly, the supply side of the economy struggles to rebalance. This weighs more heavily, at least for a time.
A more important question for the outlook here is whether this hit to supply does indeed prove permanent. We think there are some grounds for optimism.
First, we think the size of the workforce should recover some of the losses that have emerged so far during the pandemic. We have been encouraged by the pickup in non-EU migration. Visa approvals in total were up 50% in 2022 above levels in 2019–20, with skilled applications up 66%.36 Strong EU applications to the UK’s settled status scheme suggest further EU net emigration is likely only limited – a finding corroborated by the ONS’s initial estimates. We also see potential for further increases in non-EU immigration, even beyond our 2019 assumptions. These primarily relate to the decision to reintroduce the ‘Skilled Worker Route’ – a substantially more liberal system than the Tier 2 visa it replaced.
Second, we think participation should also gradually recover. Since the start of the pandemic the increase in inactivity has been concentrated among two groups: (1) older workers between the ages of 50 and 64 (who have added a net ~400k inactive) and (2) (younger) working-age men (~180k). These effects are generally limited to those who claim they currently do not want to work. The most common reason is either long-term sickness (~460k) or retirement (~80k). Despite an offsetting 250k drop in inactivity owing to more flexible working, these effects still amount to a 2.1ppt hit to the UK workforce (690k workers) – equivalent to the reduction in employment relative to trend.
Figure 2.26. UK: change in inactivity by reason, 2020–22
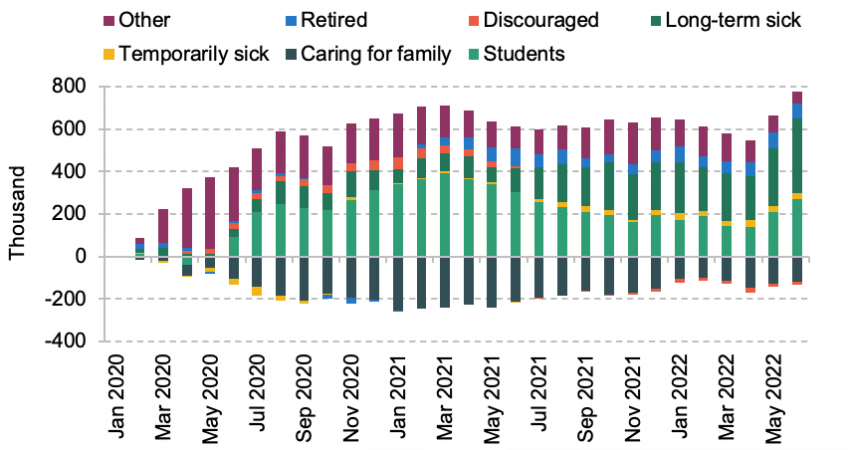
Note: Numbers are given relative to January 2020.
Source: ONS and Citi.
Superficially, the prognosis here is not good. The concentration of older workers in particular would ordinarily suggest a slower rate of return to the workforce, and a more persistent subsequent labour supply challenge (Office for National Statistics, 2022e). Two further developments compound the risk:
· Growing numbers suffering long-term sickness. This trend precedes the pandemic, with the number suffering from long-term sickness increasing from around 6 million in 2017 to 7 million today – 17% of the workforce. The participation rate amongst this group, while increasing between 2014 and 2018, has also since begun to stall (Haskel and Martin, 2022). In total, increases amongst this group now amount to half the total increase in inactivity, with students the next-largest contributor.
· A significant increase in house prices. This rise has been the main factor in the aggregate net increase in household wealth. Ordinarily, one would expect this to have a larger marginal effect among older workers who are closer to retirement. Indeed, Disney and Gathergood (2016) note that a local 10% jump in house prices can drive a reduction in participation among older men of around 4%.
The first issue is the main concern. House prices, and changes in nominal household wealth, seem unlikely to weigh on a persistent basis.37 Long-term sickness, by contrast, may well prove a trickier issue. While flows from inactivity to activity amongst this group narrowed somewhat in the mid 2010s, the gap here has increased since – indeed to record levels in recent quarters. This suggests higher levels of inactivity amongst this group seem likely to prove persistent.
On the one hand, reduced COVID incidence and a gradual recovery in the health service should, we think, mean the net increase in inactivity associated with longer-term illness should fall back to around 200–250k above its pre-COVID level. One notable change in recent years has been a reduction in the average age of those reporting long-term sickness, with a particular increase in the density of those suffering under the age of 35 (Haskel and Martin, 2022). We think this suggests more hope for a recovery in the medium term as NHS waiting times come down. However, further setbacks could yet drive these data higher still.
While this issue is rightly the focus of extensive policy discussion, we would note that it accounts still for only half of the overall increase in inactivity since the start of the pandemic. Instead, as Boileau and Cribb (2022) have noted, many of these more recent reductions reflect economic rather than health decisions. Here we think the picture may prove more positive, at least from a labour supply point of view.
And elsewhere the picture seems more positive.
First, reductions in COVID cases have driven a marked reduction in the number temporarily off work with COVID. In Q4 of 2021, as many as 376k workers – 1.5% of the UK workforce – were either sick or self-isolating at any one time owing to the pandemic. Reduced rates here should also weigh on fears amongst older groups. Of those over the age of 50 who have exited the workforce since the start of the pandemic, COVID was still identified by 15% as a reason why they have not returned to work as late as March (Office for National Statistics, 2022e). This can help to explain the bounce in participation amongst the over-65s in recent months.
Second, the reversal of the IR35 (off-payroll working) reforms of 2017 and 2022 will likely drive a notable improvement in participation among the previously self-employed. This had been a key area of growth for the UK labour market since the GFC, in part because of its lower effective tax rate. Since the beginning of the last fiscal year, that changed with the IR35 tax reform. Reduced take-home pay disincentivises work (a ‘substitution effect’). In a range of high-profile sectors – including HGV drivers – these tax changes seem to have been instrumental in shortages (Zangana, 2021). Previously we thought these effects could have meant a net loss of 250k in participation. While it is unlikely all of these will return, these effects should now be less severe.
Third, high inflation in the months ahead is also likely to push more back into the labour market. The impact here hinges on what exactly is driving prices higher. When driven by discretionary components of the consumption basket, higher inflation can weigh on the incentive to work – similar to the increase in taxation. However, as we discuss in Section 2.4, price rises are currently being driven by necessities such as energy and food. In this case, an increase in the price level is better thought of as a reduction in income (Nabarro, 2022a). This increases the incentive to work.
We therefore expect the recent surge in non-core costs to add to labour supply. Generally, given energy and food tend to be larger shares of the budgets of not only poorer but older households, the effect may be especially large. For these households, there are unfortunately few alternatives but to work in order to plug the gap in non-discretionary consumption. For the same reason, monetary tightening tends to have the largest positive impact on labour supply amongst mortgaged and lower-income households (see Bunn et al. (2021) and Cantore et al. (2022) respectively). The asymmetric distribution of household savings suggests these effects should remain relatively large. Historically, the effect associated with non-core inflation has also been focused amongst older age groups (see Figure 2.27).
Figure 2.27. UK: impact of non-core inflation shock on headline participation rates by age
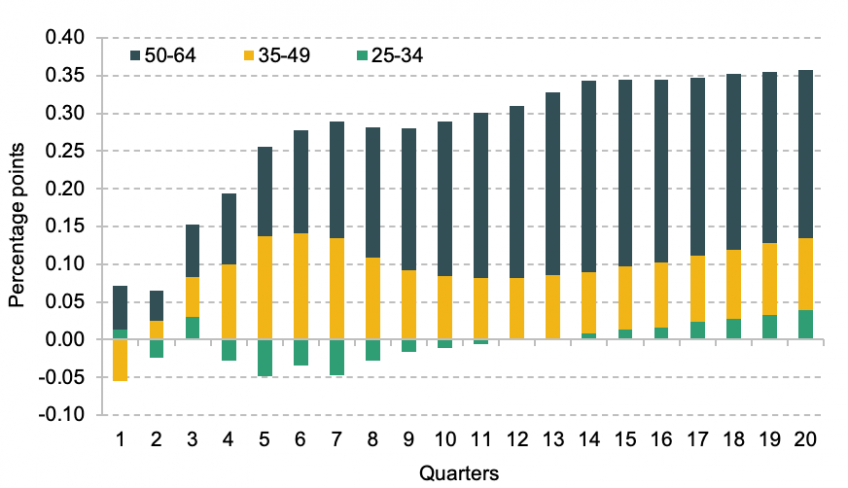
Note: Product of Citi's BVAR participation model. Shock reflects a five-standard-deviation shock to non-core inflation, roughly equivalent to that the UK faces over the next 12 months.
Source: ONS and Citi Research.
How large could this effect be? There are two channels to consider here. The first is participation itself, where we estimate a 4ppt surge in non-core (food and energy) inflation is usually sufficient to push the headline participation rate up by around 0.1ppt all else equal. We currently expect annual non-core inflation here to accelerate to just under 25% over the coming twelve months, enough to add 0.4–0.5ppt to the headline participation rate. As important is the effect of such inflation on net desired hours. When inflation is driven by discretionary spending inflation, these tend to fall. But when driven by energy and food, the effect is large and positive. Alongside the impact of higher participation rates, this could further ameliorate the impact. Across recent survey data, working longer hours is one of the most common responses to the current cost of living shock – with 23% of households citing this as one of their top three actions (Bank of England, 2022b).
The outlook for unemployment
What might this mean for slack? The starting point here is unambiguously tight. Unemployment fell to 3.6% in the three months to July, the lowest rate since 1974. Short-term unemployment has fallen by 161k compared with pre-pandemic levels, meaning that the average duration of unemployment is now roughly 0.9 months above that in the period immediately before the pandemic began. Headline unemployment therefore likely overstates the degree of slack. Other measures, such as marginal attachment and net additional desired hours, have also fallen to record lows. The net number of workers wanting fewer hours (for less pay) in their current jobs is at its second-highest level since 2004 – at least before some of the effects above have had a chance to materialise. Perhaps most notable, and emphasised by the Monetary Policy Committee, the unemployment to vacancy ratio has also fallen to record lows – suggesting an especially severe mismatch between the strength of labour demand, and spare capacity.
Figure 2.28. UK: Beveridge curve
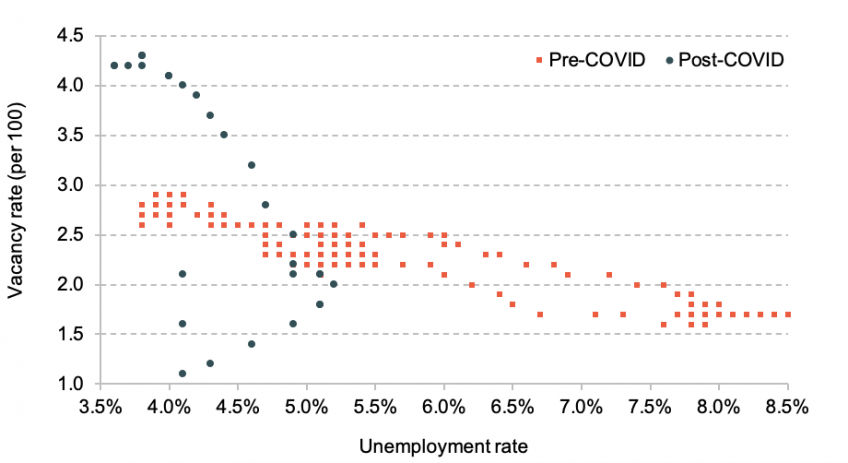
Source: ONS and Citi Research.
We expect the labour market to now begin to soften, albeit gradually. While the Beveridge curve – the relationship between vacancies and unemployment – appears to have shifted outwards (Figure 2.28), we think the scale of this effect is likely to fade over time.
The point of departure here is that labour markets are always to some degree dysfunctional. Significant heterogeneity means there are always some searching for the right job, and others searching for the right employee – giving rise to frictional unemployment. These effects also mean that should a large backlog of hiring accumulate, this will not be immediately cleared.
The legacy impact of furlough through 2021 has, we think, resulted in just such a backlog. The UK is somewhat unique in cross-national comparison. Rates of job churn are relatively high – around 15% versus 18% in the US and 8.2% in the European Union.38 However, the policy response to the pandemic favoured protecting existing employment relationships. The implication, especially when extending the scheme in 2021, was the accumulation of a very large backlog of hiring. Alongside the drop in participation, this helps explain why the supply side of the UK labour market appears quite so tight, even as GDP is so weak.
These effects are hard to differentiate from more conventional labour market tightness.
The reason why we think these ‘backlog’ effects may be playing at least some role is that, looking across sectors, levels of pre-COVID ‘churn’ tend to be a much stronger indicator of growing tightness than the change in aggregate demand (Nabarro, 2022a). If the current shock was being driven primarily by a conventional excess of supply versus demand, one would expect the largest increase in tightness to be observed within those sectors with the strongest net growth. However, this does not seem to be the case. Instead those sectors with the largest increase in their vacancy to unemployment ratio (versus 2019Q4) include both those with very strong demand – such as professional services – and others where demand is weak – such as hospitality. While it is not the sole driver we think, some of these effects reflect the hiring backlog associated with the pandemic.
Of course, this is not to say the UK labour market is not currently tight. These effects are in essence a further adverse labour supply disruption. But this logic does suggest that some of the current tightness will take some time to abate.
In the interim, three further factors are likely instrumental in determining the speed at which the labour market loosens.
First is the rate at which weak aggregate demand feeds into labour demand. Traditionally vacancies have tended to follow growth with around a three-month lag. It has been a similar story through 2022, with growth peaking in January and vacancies in April. In the months since, much of the soft data have also pointed to a softening demand outlook. In recent months the KPMG–REC survey, for example, has pointed to marked reductions in both hiring and open adverts. Net hiring is now below its long-term average, though outstanding vacancies are a little above. In the months ahead we think the acute margin squeeze we noted in Section 2.2 will weigh on labour demand as well as investment.
Vacancies may be sticky on the way down. Acute skill shortages are evident in several sectors. High vacancies and poorer matching are likely to prove a little more structural. In some cases the shift towards online job advertising should also mean the cost of advertising is structurally lower, adding to the number of adverts. Both could mean higher rates of ‘fishing’ whereby firms keep vacancies open in the hope of finding the right skills (Saunders, 2017).
But overall, we think the net trajectory of UK vacancies is downwards. The latest timely data from Adzuna and indeed.com show vacancies now at their lowest level since 2021Q2. As the margin squeeze intensifies, we expect the rate of new job postings to decelerate. One important driver here is likely to be the rate of firm formation. Ordinarily this accounts for 30–40% of all gross hiring. With credit conditions now tightening, uncertainty rising and demand softening, we expect demand here to now begin to drop back more quickly.
The second question concerns labour hoarding, and in particular the extent to which firms feel both able and willing to hold onto uneconomical staff. In the period post-GFC, this played a key role in attenuating the labour market impact of the downturn. The key feature of that shock was that the adverse hit to GDP was focused in sectors with relatively skilled workers, and often those who were initially working more hours than they would ideally like to (Daly et al., 2014). Many employees were therefore willing to reduce their hours. Employers also often had an incentive to hold onto valuable skills.
In the current shock, we think there is also evidence firms have worked hard to retain staff. We think this reflects three drivers. First, during the acute phase of the pandemic, was by design. Labour hoarding was actively encouraged in the early part of the pandemic as part of the furlough scheme. This aimed to maintain labour relationships that were themselves immediately uneconomical in the expectation that longer term many were worth preserving. Second, in the period since, we think uncertainty added to the incentive to retain staff. This included both uncertainty over demand, market share and pricing power. Third, and last, has been the scale of market dysfunction and the subsequent hiring challenges. As the labour market has tightened – especially in certain occupations – we think firms have held onto employments for longer than they otherwise might for fear of the potential costs of re-hiring.
The question now is whether we could see some of these effects persist into a more lasting element of the looming economic adjustment. This could be a plausible narrative for unemployment remaining low, even as supply gradually recovers. Here we are relatively sceptical. Current redundancy intentions do remain low. But unlike the GFC, the current crisis isn’t concentrated in sectors that saw widespread overworking or a concentration of higher skilled people (Crawford et al., 2013). With living costs also now increasing, we find it hard to explain why those in more affected sectors might be willing to work fewer hours. Similarly, for employers, there is not an obvious rationale as to why they may want to reduce average working hours at the benefit of more employees. Ordinarily, higher fixed costs would lean in the opposite direction. We expect some of these effects, but only to a limited extent.
Figure 2.29. UK: hours worked and output, post-COVID recovery and previous recessions
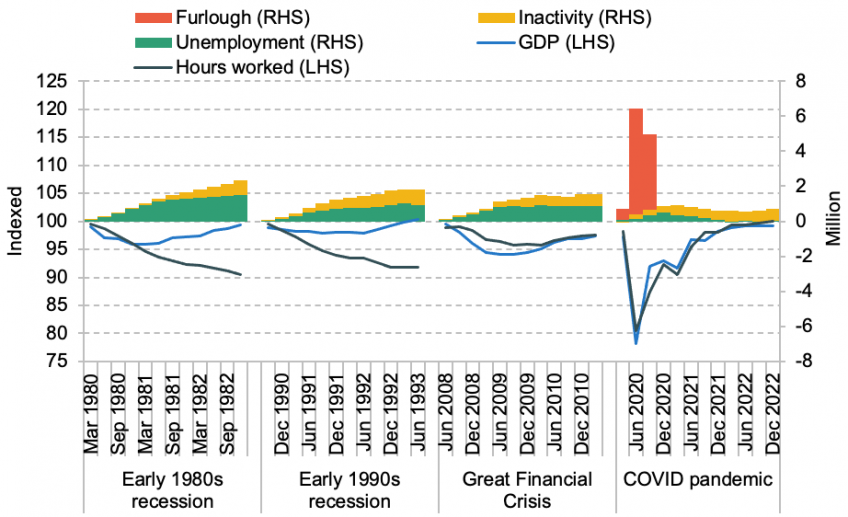
Source: ONS.
One important issue here concerns ‘involuntary’ hoarding – namely firms holding onto staff when they themselves are fundamentally insolvent. In recent weeks we have begun to see the faster moving data here suggest some deterioration. Insolvencies, having already reached a new record in Q2, seem to have picked up further in Q3, even as firm formation rates have fallen back. In the months ahead, we expect weak demand, higher cost burdens and higher rates to all add to the rate of insolvencies here. In Q2, the level of job destruction associated with firm insolvencies exceeded the rate of job creation for only the third time on record (Figure 2.30). We expect more such quarters ahead.
Figure 2.30. UK: job creation and destruction as a result of firm formations, 2017–22
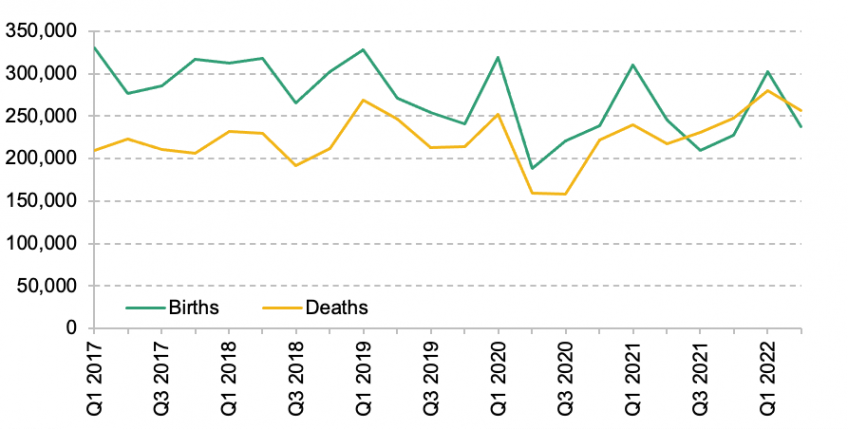
Source: ONS.
The third factor concerns developments in the public sector. Employment growth has been massive here since the start of the pandemic. Looking just at PAYE employees, for example, of the net 750k increase since before the pandemic, 460k is made up of workers within sectors dominated by the public sector, with 240k of this accounted for by health alone. Actual public sector employment has increased by 220k. But in many cases workers, while not directly working for the state in these sectors, do depend on public spending. In 2021, total public sector staff costs were 23% higher than their equivalent in 2019 and consumption was 25% higher.
Figure 2.31. UK: change in PAYE employees since December 2019, 2020–22
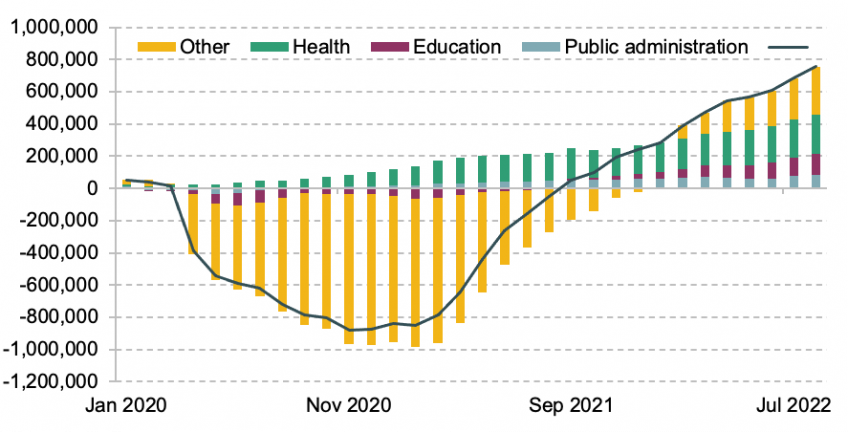
Much will depend here on how public spending decisions develop over the coming year. If, as currently suggested, allocations to government departments are not topped up, staffing levels are likely to fall (see Chapter 4). The unwind of further temporary pandemic interventions also seems likely to mean some employment – particularly that based on contracted rather than directly employed staff – will also ease. However, we are sceptical all of this increase will unwind anytime soon. Total public sector employment is only now back to similar levels to 2013. With service demands continuing to grow, it is not clear to us that a meaningful reversal is likely in the near term.
Summary
Overall, we expect unemployment to increase in the months ahead, but only gradually. From here, we expect headline unemployment to increase from 3.6% to 4.6% in the second half of 2023, and a peak of 5% in 2024H1. The risks here are probably to the upside. The most plausible drivers here would be if some labour market softening drives a simultaneous unwind of labour hoarding, or public sector employment falls faster than we currently expect.
2.4 Inflation, costs and wages
With inflation already at multi-decade highs, the key risk in the months ahead is that the large relative price change that has characterised inflation to date transitions into a more problematic, self-sustaining, domestic inflation problem. The risks here are greater than at any time in the last 30 years, and relate to three dimensions of the current inflation outlook: (1) scale; (2) length; and (3) the recent strength of coincident domestic demand conditions. The first-order impact of recent energy interventions means the risks associated with the first dimension are now somewhat less. However, the second and third remain highly problematic.
For now, the inflationary surge in the UK primarily reflects particularly large, and widespread, relative price changes. These relate primarily to the increase in imported energy and food prices, but also to residual revaluations associated with structural changes post-pandemic. When such adjustments occur quickly, downward nominal rigidities across wages and prices mean these almost invariably feed into headline price increases. These are an inevitable part of the reconfiguration process.
In the months ahead, we think the risks remain skewed towards a largely self-correcting inflation shock. The key risk in our view is fiscal policy. If this seeks to offset the adverse shock to incomes and demand – chasing the slowdown – then this risks tipping the UK into a much more challenging inflation and policy environment.
A sequence of severe price shocks
The combined impact of the COVID pandemic and war in Ukraine has unleashed three large cost shocks on the UK economy:
First was a surge in traded goods prices. Since the start of the pandemic, a combination of production interruptions (especially in China), supply chain disruption and a coordinated global rotation of consumer demand away from services and towards goods has bid up the prices of traded goods. The UK, as a large net importer of many of these items, has been especially exposed. Trade disruption associated with the transition to the Trade and Cooperation Agreement with the EU has also likely added.
Second has been the remarkable spike in household energy prices. Both oil and gas prices accelerated as the global economy has reopened. Petrol reached record levels in July – but has fallen back marginally since. Gas shortages and the conflict in Ukraine are, however, now the main drivers. While the UK is not dependent on Russian gas, its energy mix leaves it exposed to changes in European wholesale prices. We think energy could have added as much as 8–9ppt to headline CPI in January absent the government intervention. Even so, households are still looking at a near-doubling of their electricity and gas bills, alongside sharp increases in fuel costs. We expect annual energy inflation to reach 62% in October, adding 3.5ppt to headline inflation.
Third, and last, have been sharp increases in global food prices. Price discipline here seems to have effectively broken in recent months, with rates of pass-through seemingly accelerating. Increases in energy prices tend to have significant effects on UK food prices with a lag of 6–12 months. In recent months we think the feedback effects here have been exacerbated by the specific impact of the gas shortage. Food production uses inputs such as CO2 gas relatively intensively.39 These supplies have come under growing pressure across Europe in recent months as gas shortages have continued to bite. In our view, the transition to the Trade and Cooperation Agreement is likely having a further effect here, with 35% of foodstuffs imported from continental Europe.
Food is now an increasingly pressing concern. Costs here are increasingly being driven by industrial inputs, rather than soft commodity prices overall. While many of these firms should now receive some notable support as a result of the corporate price cap announced on 23 September, we still see scope for some substantial second-round effects. One particularly concerning development in our view here is less the scale of food inflation, but its breadth (see Figure 2.32). We suspect that may mean faster and more complete pass-through in the months ahead as substitution effects that would ordinarily weigh are effectively priced out. We now expect food inflation to peak at around 20% YY in 2023Q1.
Combined, these effects would suggest a peak in CPI of 11.8% YY in October.
Figure 2.32. UK: composition of the headline CPI inflation overshoot, 2018–26
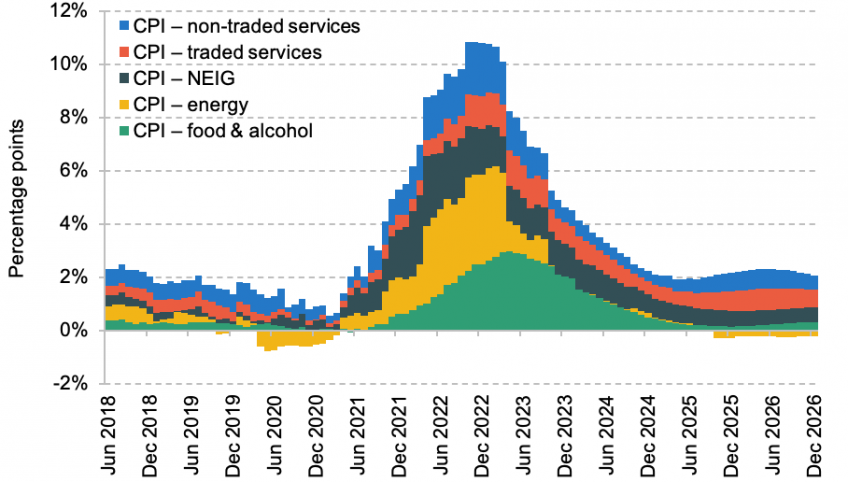
Note: NEIG is non-energy industrial goods.
Source: ONS and Citi Research.
Sticky, but not persistent
Inflation is also unlikely to be here today but gone tomorrow. In the period post-GFC, it took two years for high inflation to break. We think a similar timescale is appropriate here too. Hence while we expect inflation to peak in October of this year, we think it will now only fall below the 2% target in 2025. Here, we see three propagating factors at work.
The first is the second-round effect from very high energy inflation. The first-order impact of energy will, we think, be heavily attenuated by the household energy price cap. Previously energy prices suggested a particularly high peak to inflation in the coming months, but subsequent disinflation as prices subsequently came down – at least based on the current futures curve. Capping prices at £2,500 means this effect is more effectively smoothed out. This does not mean a lower price level in the medium term, only lower inflation volatility. Inflation in October 2024 is also clearly sensitive to the level at which gas and electricity prices settle. On the basis of the current futures curve, electricity and gas prices would fall below the current cap threshold through the middle of 2024 – suggesting a relatively smooth roll-off. However, if one adopts the Bank of England’s forecasting convention of assuming prices follow their futures curve for the first six months, and are then flat, this would point to a 1–2ppt jump in 2024Q4.
Regardless of the direct effect here though, the primary drivers of persistence associated with the current price shock are the result of so-called ‘second-round’ effects. We think these may prove unexpectedly large. Historically, an increase in energy prices – especially oil – has tended to add to food and goods inflation, but then weigh on services inflation. This reflects the tendency of such shocks to weigh on demand, and subsequent pricing power. In this case though, we think the scale of the shock is simply too large for firms to absorb the impact in margins. There is likely to be something of a ‘non-linearity’. Rather than weighing on existing firm margins, these effects are more likely to come through via inflation and insolvencies.
Looking at food and energy inflation in particular, these suggest relentless upward pressure on service firms’ input prices. There are signs here that these effects are already coming through – with core services inflation currently running at 5.9% YY versus the 2.5-3.0% range observed pre-pandemic. Of this, we think 2.8ppt is accounted for by second-round effects from both energy and food. While services inflation seems likely to accelerate to well over 6.5% in the months ahead, we expect a majority of this reflects second-round effects (see Figure 2.33).
Figure 2.33. UK: headline and underlying services inflation, 2009–25
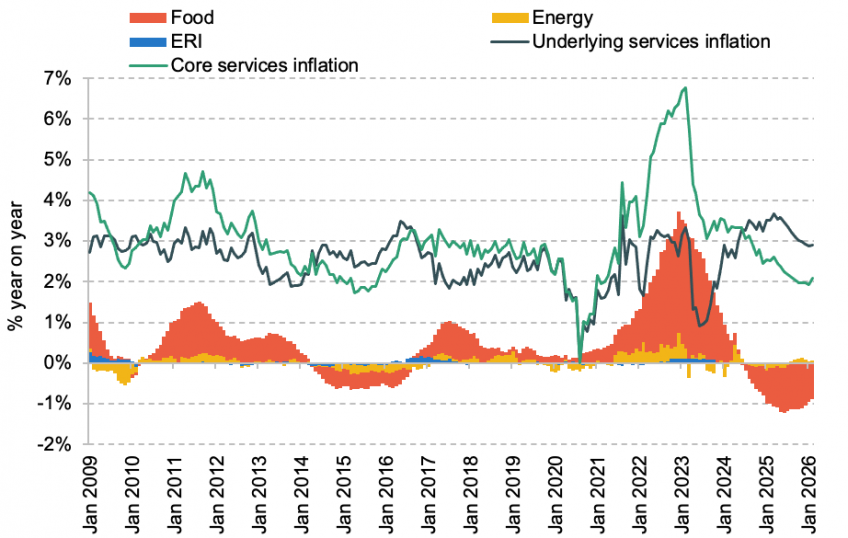
Note: ERI is the sterling effective exchange rate index.
Source: ONS and Citi Research.
The second propagating mechanism here is the exchange rate. Since the start of 2022 the UK has seen a steady depreciation in sterling. This has been most acute versus the dollar – where sterling has fallen roughly 20% since late February. Versus the Euro, sterling has depreciated by a more modest 6% – leaving the trade-weighted index down by roughly 7.5%. Ordinarily, that would suggest a 1.5ppt boost in the CPI price level over the coming three years, with around 0.7ppt in the first 12 months. However, the disproportionate role of the dollar in the current shock implies slightly faster pass-through than we would otherwise expect. We expect a marginally larger 0.8–0.9ppt impact over the coming 12 months as a result. Second, while pass-through into domestic prices tends to be strongly related to domestic demand conditions, in the current circumstances we think pass-through is likely to remain strong. That reflects first the fact that margins are already heavily compressed, and that many firms are likely to perceive the current shock as at least semi-structural.
Third, we expect indexation to also exert a considerable impact on headline inflation over the coming months. Prices in roughly 20% of the UK inflation index tend to be at least partly linked directly to inflation either in the previous September or, in some cases, the previous July. This includes components such as mobile phone bills (which are often linked to RPI), rail fares and some education services. As we saw in the period post-GFC, this can contribute to some persistent high inflation 12–24 months after the initial shock. We expect those trends to continue through next year – adding around 80bp to the divergence from target. Ultimately we think inflation will then fall back further, but only through 2025–26.
What are the risks of embedded inflation?
The obvious question here is, given the scale and persistence of the current shock, how large is the risk that this could yet morph into a more nefarious self-sustaining inflation problem? For now, we think the probability here is relatively contained; however, if this were to materialise, it would be incredibly costly – both in the near and medium term.
In recent months, the essence of the current price surge has been a very large relative price shock. As very large increases in energy, food and import prices have filtered through to the economy at a record rate, these effects have tended to add to the overall price level – as downward nominal rigidities preclude offsetting reductions elsewhere. With domestic allocation issues layered on top, this has resulted in additional ‘convexity’ effects where prices have jumped sharply in areas seeing strong demand, but only softened marginally in those areas seeing weak demand (Broadbent, 2021a). These effects have also added to headline inflation. In each case, this has meant a particularly large jump in the price level. However these effects would not in and of themselves imply a more persistent shift in price growth. Instead, if left alone, these effects should ultimately fall back.
For now, we think these effects broadly summarise the nature of the UK’s current inflation issue. While price growth is indeed high, it remains characterised by very high rates of growth in certain sectors. CPI inflation has been broadening, reflecting some of the second-round effects above, but broadly the vast majority of the current inflation overshoot remains concentrated in sectors well away from those more domestically driven areas of inflation. This suggests only limited medium-term momentum (Figure 2.34).
Figure 2.34. UK: CPI inflation overshoot decomposed by labour intensity, 2012–22
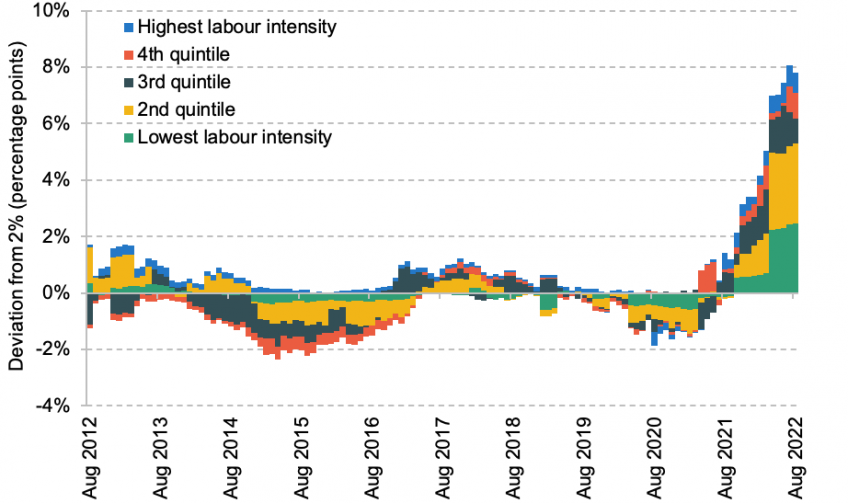
Note: Inflation here decomposed across single-digit industrial codes. Labour intensity is derived using the supply and use tables. For each quintile, the plot shows its contribution to the inflation deviation from 2%.
Source: ONS and Citi.
However, we are still in only the early stages. Historically, many of the feedback effects into more persistent inflation are highly non-linear, with these effects often becoming more pervasive once a certain threshold is breached (Rudd, 2021). At this stage, real rigidities can become much more pervasive.
"… there appears to be some threshold at which the rate of change in living costs becomes a pervasive factor of which account has to be taken in wage decisions … It is when the upward movement of prices quickens, and extends substantially throughout the whole range of consumer goods and services, that wages begin to respond directly to price movements."
Douty, 1975
How severe is the risk of more persistent inflation as we stand today? There are three factors that are especially important here in our view.
The first is the rate of pass-through. If there are signs that cost shocks were being passed through into other price inflation at a faster-than-usual rate, then there could be a sense in which services firms were acting to not just offset the cost shock, but expand their margin. Robert Lucas noted this dynamic when thinking about relative price changes, noting that when inflation expectations were de-anchored, this could easily transition into a more generalised dynamic (Lucas, 1972). In recent months, pass-through has indeed remained strong (see Figure 2.35).
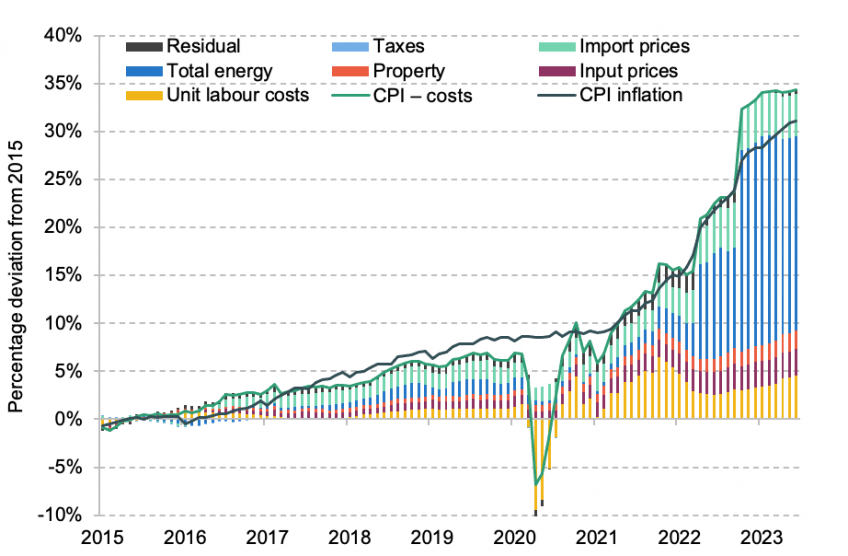
Note: Unit costs are reweighted by exposure across consumer-facing firms. Unit labour costs (ULC) include the cost of furlough, which was not actually incurred by firms. Unit labour costs are discounted by 15% for the duration of the furlough scheme.
Source: Citi Research, ONS and Tenreyro (2020).
For now though, most of the data here point to risks that are relatively well contained. While some survey data, such as the Bank’s Decision Maker Panel (DMP) survey, point to strong continued expectations, these data also seem to be overstating inflation out-turns. And looking more systematically across the matrix of CPI categories, pass-through from energy and food inflation into other – particularly services – categories is generally a little more subdued than what would conventionally be expected based on the UK’s post-1992 experience,40 deteriorating alongside profit expectations. While firms seem to be securing higher prices to offset cost shocks where they can, for now there is very little sign of firms being successful. This is in contrast to, for example, the situation in the United States where pass-through is stronger (Bank for International Settlements, 2022).
The second issue here concerns wage growth. The question here is whether workers, alongside domestic firms, are able to secure compensation for higher prices and offset the shift in relative prices. For now, the evidence suggests not. Regular private sector pay growth in July accelerated to 6.0% on a 3M YY, up from 5.1% in the three months to May. These data are now at their third-highest level on record. However, this remains a long way off the rate of inflation. Overall, underlying nominal pay growth also remains broadly in line with pre-COVID models of the UK wage Phillips curve – at least for now.
In the months ahead, wage growth is likely to accelerate. The DMP survey shows wage expectations picking up further into August. The updated Agents’ data also show wage expectations for the coming 12 months continuing to accelerate (Bank of England, 2022c). And with unemployment a long way below long-run equilibrium, we think this is likely to add to the inflationary pressure. The important issue here is that at present the level of unemployment that would be needed to prevent these kind of feedback effects is likely significantly greater than the long-run equilibrium. This reflects (1) the matching and supply challenges we noted in Section 2.3, but also (2) the very low level of real wages and the associated divergence from conventional growth norms (Broadbent, 2014). We expect regular pay to accelerate to around 7% by Q4.
Figure 2.36. UK: wage Phillips curve, 2001–24
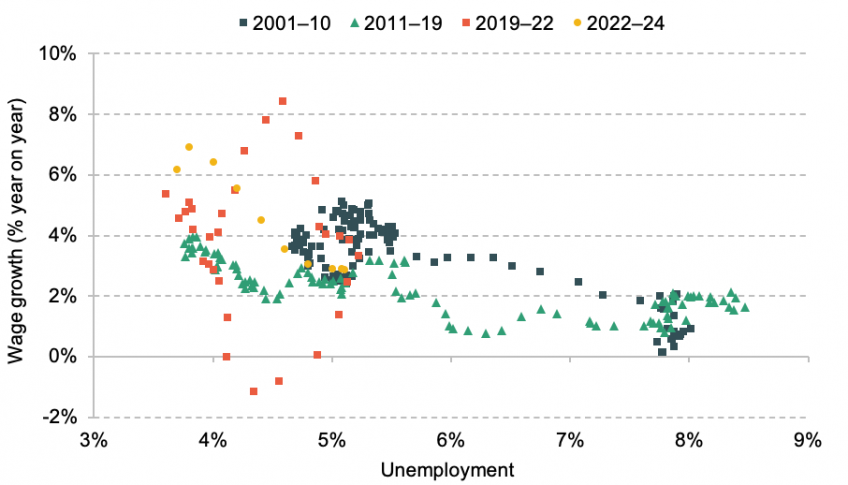
Note: Forecast is from 2022Q3.
Source: Citi Research and ONS.
The important point in our view is that this is unlikely to last. While workers have been securing bonus top-ups in recent months to cope with higher living costs, these interventions have generally been temporary. And more generally, there is little evidence of ‘anticipatory effects’ whereby workers rebase expectations to a higher inflation rate – we think this would at least be necessary if a more nefarious wage dynamic was beginning to develop. Instead, most expectations reflect moderate catch-up demands. Elsewhere, there are also growing signs of moderation, especially in the KPMG–RECs starting salaries. Xpert HR and IDR data have also suggested pay growth has begun to stabilise, if at high levels.41 Overall, we think stronger wage growth in the second half of 2022 will add around 20–30bp to headline CPI in 2023, but little beyond as growth subsequently falls back.
The outlook here will continue to merit vigilance. However, we think the risks here remain contained for now. To secure sweeping offsets, workers must be focused on higher inflation, and have the ability to secure immediate and widespread increases. This is rare. In the 1970s, it was made possible by collective wage bargaining and the loss of a credible monetary anchor. In the current circumstances, workers can secure pay rises by making (tacit) threats to leave. Power here is a function of tightness in the labour market and consumer confidence. The latter is already fading, with the quit rate likely to fall from here, reducing worker bargaining power.
Third, and last, we think, are inflation expectations. Given the discussion above, changes here are central to a more persistent inflationary shock – facilitating the shift from ‘catch-up effects’ to a more persistent inflationary process. Changes here are therefore likely sufficient, rather than necessary – at least in the near term. In recent months, the data here have shown signs of stabilisation. Three measures are especially important: (1) financial market expectations, (2) household surveys and (3) professional forecasters. In the last case, longer-term expectations remain relatively well anchored. Market expectations have also fallen. The data here are likely to remain sensitive to further shocks. Indeed the Citi/YouGov measure of expectations accelerated sharply in August, as a result of inflation-focused headlines, only to then fall in September. For now, these data show signs of pressure, but no immediate red flags.
Summary
The inflation forecast we discuss above is effectively one of two halves. Initially, inflation is overwhelmingly driven by the impact of the current terms-of-trade shock, with CPI inflation accelerating to just shy of 12% in October. Thereafter, the sticky profile on the way down is a product of more gradual second-round effects as these initial shocks permeate through the wider matrix of domestic prices.
In this context, inflation should be primarily thought of as an allocative mechanism – reflecting the economic implications of the terms-of-trade shock. The implication is that, at present, high inflation still reflects inflationary dynamics that should prove largely self-correcting. However, this will take time. And uncertainty is high – given the continued risk of propagation into wages and domestic price setting. In our view, policymakers should be especially wary of policies that drive blanket indexation. These risk only perpetuating the underlying inflation problem.
2.5 Dimensions of adjustment: how to understand the current shock?
The implication is that we expect wages and real household incomes once again to bear the brunt of another supply shock. Despite the scale and suddenness, this is not materially different from the manner by which the UK economy adjusted to a weaker economic reality following the Great Financial Crisis. In this case, this reflects: (1) the large adverse terms-of-trade shock; 2) the associated hit to consumer demand; (3) a limited retrenchment of capacity; and (4) downward pressure on domestic input prices. The more fundamental point here is that the large increase in import prices reflects a fundamental impoverishment of the UK economy. This, we expect, will leave real wages lower than pre-pandemic, in line with overall output but in stark contrast to the 1970s experience (Figure 2.37).
Figure 2.37. UK: real wages and productivity, 1971–83 and 2019–25
(a) 1971–83
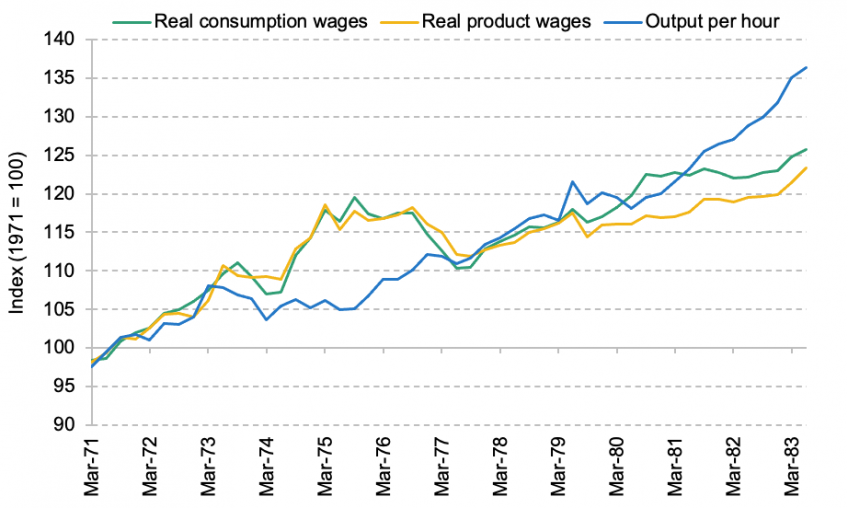
(b) 2019–25
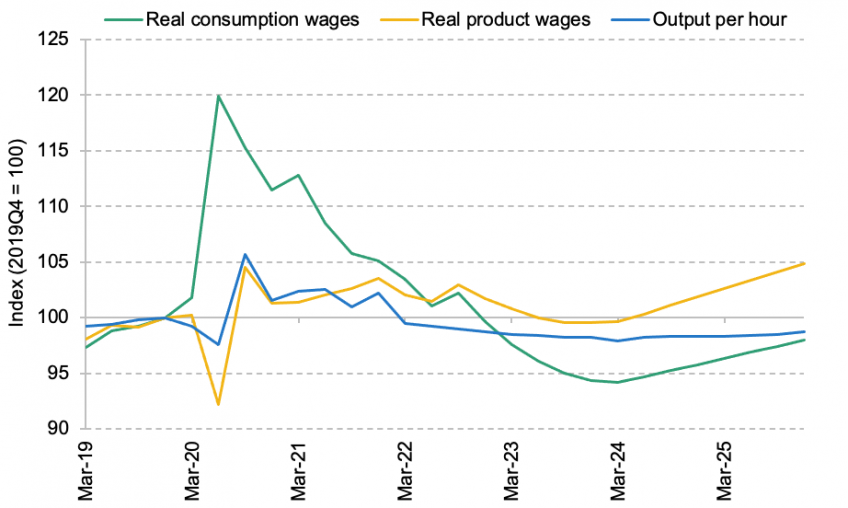
Note: Real consumption wages reflect employee and mixed income, divided by the number of hours worked and the private consumption deflator. Real product wages reflect the same calculation minus net household subsidies, and deflated by the GVA deflator.
Source: Citi Research, ONS and Haskel (2021).
It is worth emphasising the extent of uncertainty here. To the degree supply challenges drive more persistent labour market tightness, this could facilitate greater momentum on the wage side of the economy. We also have no good analogy as to how labour market institutions behave when realised inflation climbs to these sorts of levels. In the above, we effectively emphasise (1) that consumers do not expect to be compensated for higher inflation, and so pull back on demand, and (2) that absent effective collective bargaining, it is difficult to envisage wages keeping up with inflation, let alone accelerating beyond. The shift to a higher-pass-through, wage economy therefore seems something of a stretch.
However, we should not dismiss the idea that wage dynamics could prove different from those that went before. We do expect the wage Phillips curve to steepen somewhat in the years ahead. And a broader regime shift cannot be ruled out. The largest risk here is likely fiscal policy. If the government responds to the current inflation shock with widespread demand stimulus, wage and benefit indexation, and broader efforts to offset the shock, then more embedded inflation is a very real risk. More persistent inflation in the current environment therefore reflects less an inevitable tendency of domestic economic institutions, and more the failure to find an acceptable means to allocate the economic loss associated with the shock.
Indeed, alongside our basic forecast, we see two other potential, and significantly weaker, scenarios for the UK economy in the months ahead:
· Dislodged expectations. In this scenario, the scale of the current inflation shock means some downward real rigidities do begin to emerge. Real wages and profits are initially better protected – meaning stronger economic momentum into the second half of 2022. However, more persistent inflation subsequently emerges – with CPI inflation settling at around 5–6% YY. Policy is forced to respond by aggressively tightening. This would mean rates accelerating up to 6–7% in our view, with the result a much longer, and more protracted, policy recession. In this case, we have modelled the scenario by assuming a similar Phillips curve behaviour to that evidenced through the 1970s and 1980s. In this scenario, unemployment may have to increase to around 8% in order to pull inflation back down.
· Policy capitulation. In this scenario, similar embedded inflation emerges, but the Bank of England fails to credibly manage inflation back down. The associated loss of institutional credibility means a sharp increase in long-term yields and a 20% knee-jerk sterling depreciation, as the UK’s large external deficit comes under pressure. Much would of course depend on the fiscal response – and the subsequent willingness of policymakers to run a large primary surplus. In the first instance, however, the immediate challenge for monetary policy would be securing the external position. This means increasing Bank Rate sharply so as to weigh on domestic demand, and imports, while also offering global investors an unambiguously positive real yield. We should stress we do not see this as likely, but we do not think this can be dismissed entirely.
Each of these scenarios is materially weaker than our current baseline expectation, with GDP falling peak to trough by 6.6% and 11.2% in each case respectively (versus 0.9% in our current baseline).
Figure 2.38. UK: real GDP in various scenarios, 2021–28
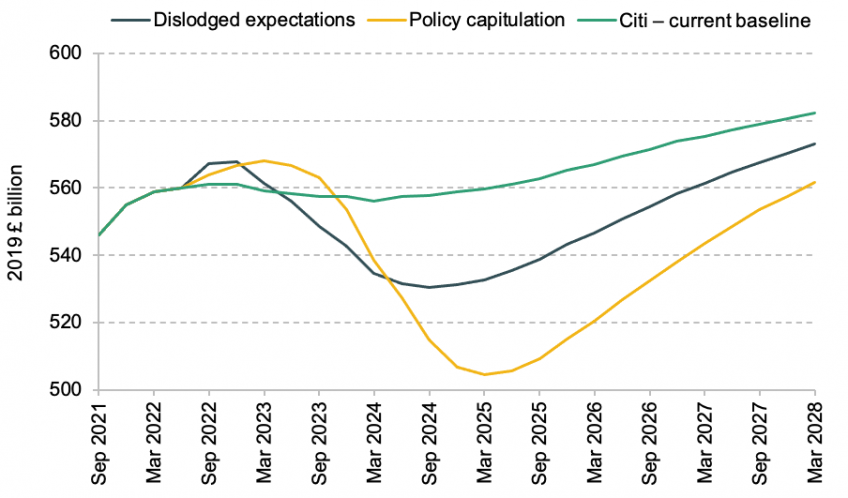
Figure 2.39. UK: unemployment rate in various scenarios, 2021–28
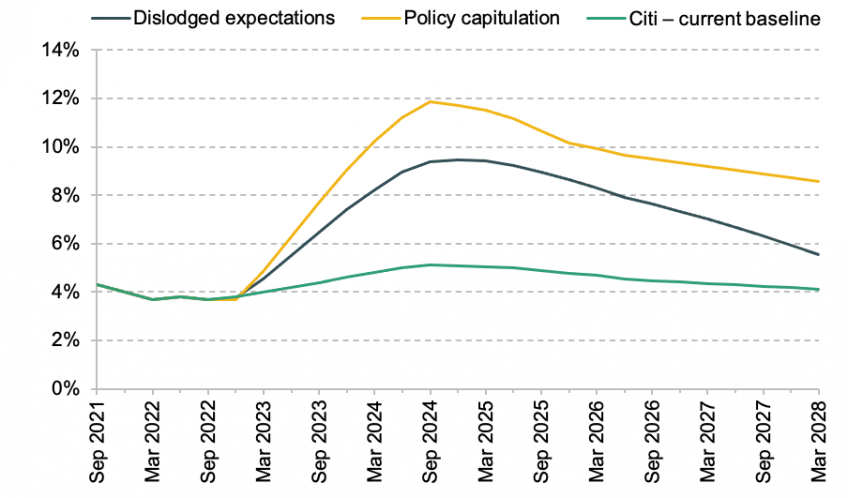
Source: ONS and Citi Research.
2.6 Policy conclusions: is this the best we can do?
It has been a periodic mistake to assume policy institutions that underpin monetary stability in one period have solved the ‘inflation problem’ ad infinitum. Efforts, for example, to reimpose the gold standard after the First World War proved misconceived as it turned out its success had in fact been contingent on unusually strong growth in the gold supply (Eichengreen, 2003), and certain assumptions about broader political economy. The Bretton Woods system proved similar. In the main, such shifts reflect changes faced by policymakers. For large swathes of the 20th century, this has been primarily an issue of demand. During the post-1990 period in particular, global economic supply has grown strongly. Supply has also been relatively stable. This left policy focused on managing demand to ensure both remain in balance.
However, in the sections above, we described a fine equipoise between the need to avoid both self-perpetuating adverse income dynamics on the one hand and a more embedded inflation on the other. For conventional ‘demand management’, this is effectively an impossible choice. This, we think, reflects more acute challenges on the supply side of the economy. More specifically, we think policymakers increasingly have to grapple with a period of structural adjustment. These themes we think are well evidenced by recent UK experience. But with both the geopolitical and ecological transition that now loom, policymaking has to adjust to a global supply environment that is likely to be considerably more volatile.
The maintenance of medium-term price stability will still be essential. But if supply shocks are set to be more frequent – for example, owing to the ecological transition, and deglobalisation – we think this will require a revolution in the balance between monetary and fiscal policy, as well as profound changes to the manner in which the latter is executed. In the face of the supply challenges to come, changes here are likely to prove central in determining whether we face a ‘GRIM’ economic decade across Europe (Growth Retrenching, Inflation Mitigation) or a ‘VIABLE’ one (Variable Inflation, Adjustment Boosting, Limited Expansion).
The recent actions of the Monetary Policy Committee
In the face of a conventional bout of supply-driven inflation, the empirical and theoretical learning since the Great Financial Crisis is that monetary policy should do as little as possible. Exogenous price shocks mean acute changes in relative prices – and increases in the overall price level. However, a shock such as a devaluation in the exchange rate or an increase in energy prices is unlikely to fuel inflation more than two years out. There is therefore a limit to how much monetary policy can offset the shock on the one hand (Broadbent, 2021b). On the other, there is a justifiable question regarding how desirable such a move would be, given the associated further hit to output (Carney, 2017).
For the Bank of England, these various ‘trade-offs’ pushed the Monetary Policy Committee (MPC) to strike a relatively cautious tone when hiking rates during the first half of 2022. In February, for example, Andrew Bailey noted the increase in Bank Rate to 0.5% was not ‘a standard demand-driven rise in Bank Rate’, adding it would be ‘a mistake to extrapolate simplistically from what we have done today and assume that rates are now on an inevitable long march upwards’ (Bailey, 2022). What instead pushed the Bank of England to act, initially at least, was the coincidence of very high exogenous inflation with a tight domestic labour market. That complicated the outlook in two respects:
· First, absent policy action, a more persistent domestic supply shock did pose a risk of persistent economic overheating.
· Second, given the risk high realised inflation could feed back into domestic wage and price setting, this meant acting relatively quickly to forestall such feedback effects.
In both cases, that meant returning policy rates to neutral – the level consistent with the economy running consistently at potential – relatively quickly. But not going much beyond.
In the months since, however, the Bank has had to become more and more aggressive. This was reflected in the decision to hike by 50bp in August and September. We now expect a 100bp and 75bp hike in the coming two meetings. The market expects something even more aggressive.42
In part, this has reflected a continued intensification of the supply-based challenges facing the UK. The conflict in Ukraine meant imported inflation effects took a further leg higher. The labour market has remained stubbornly tight. This has meant an intensification of the same risks. However, for the MPC, we think the current circumstances pose two additional challenges:
· Very high uncertainty. As inflation has climbed to levels not just well above target, but well above any recent experience, the feedback effects into domestic inflation have become more uncertain. While post-GFC higher uncertainty engendered more ‘dovish’ policy as the costs of further disinflation (owing to limits on policy) were greater than those of higher inflation, in current circumstances the additional risk of a de-anchoring has meant these ‘cost’ considerations have essentially inverted. This means more of a focus on near-term inflation, and greater willingness to be aggressive.
· Institutional credibility. The second concern is that with fiscal policy now likely to add to inflation over the coming 18 months, this has forced the Bank to send a clear signal it remains committed and able to offset the impact. The urgency here is especially acute given the external vulnerabilities we noted in the third scenario above (Section 2.5). But this also forces the MPC to be especially forceful, especially in light of recent uncertainties. One mark of these developments in recent months has been the concurrent sell-off in both UK gilts and the pound. This suggests some risks are at least beginning to grow.
Figure 2.40. UK: five-year gilt yields and cable, 2010–22
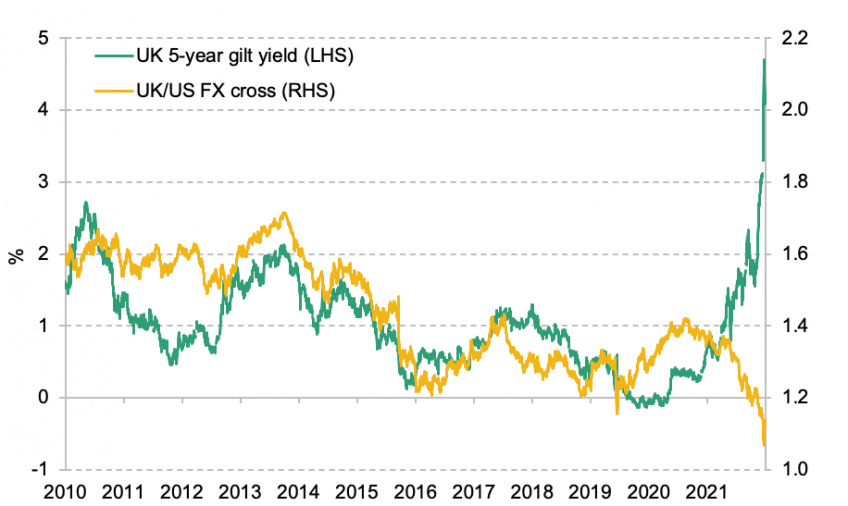
Source: Bloomberg and Citi.
Combined, we think these concerns will drive the MPC to hike to 4.5% in the months ahead.
In the context of elevated inflation uncertainty, we think fiscal policy is now a key driver in pushing the MPC. The scale of the market reaction on the day of the ‘mini-Budget’ itself was qualitatively different from that seen in previous years. This is not an issue of the market failing to anticipate a small additional series of tax cuts; it more reflected deeper institutional concerns with the trajectories of fiscal and monetary policy so clearly in conflict.
Is this really the best we can do?
We must stress here that we find it hard to argue with much the MPC has done given (1) the current circumstances and (2) its mandate. Indeed given the current institutional framework, we see little the MPC would have been able to do differently. However, the current policy mix in the UK betrays two key errors: one narrow, the other more institutional.
The narrow, discretionary error is to have monetary and fiscal policy pulling in opposite directions. Given the longer outside lags for monetary policy, that almost inevitably forces a more aggressive reaction on rates to offset the impact. The trade-off is likely especially poor in current circumstances given (1) the risk of near-term de-anchoring and (2) the scale of the uncertainty. The implication is that whatever benefit is delivered by fiscal policy, if it has the effect of boosting demand it is likely to be more than offset by additional monetary tightening – as we show in our forecast.
The second, and more involved, challenge is institutional. To begin here, it is worth taking a step back to consider the basis of the current institutional economic set-up. We would characterise this as consisting of: (1) an operationally independent, inflation-targeting, central bank; (2) (generally) passive fiscal policy; and (3) a floating exchange rate. This works well when changes in interest rates / asset purchases are sufficient to manage demand and managing demand is also sufficient to manage inflation. In an economy with sticky prices but no real rigidities, these conditions are satisfied – at least as long as equilibrium rates are well away from the effective lower bound. In this context, an operationally independent inflation-targeting central bank can be both necessary and sufficient to maximise macroeconomic welfare (Blanchard and Galí, 2007).
The issue today is we are of course a world away from this ‘idealised’ framework. Inflation is not being driven by an excess of demand, but by specific imported price shocks and extensive real rigidities. When inflation is driven in this way, price changes are both an essential and inevitable part of the adjustment process. Monetary policy can in effect only offset the impact of specific price shocks by weakening growth ex post. But even if these shocks are perfectly anticipatable, this means a large softening of the domestic economy, and generalised disinflation, in order to offset the impact. In reality, these shocks are of course rarely predictable. But even if they were, this would be demonstrably suboptimal.
What does this mean?
First, managing demand (and rates) is probably no longer sufficient to manage inflation. Perhaps more specifically, monetary policy alone cannot reduce inflation volatility. Whereas policymakers can anticipate and forestall increases in demand-driven inflation, when working with these kinds of supply shocks it is much harder for policymakers to do much other than react. This could reduce the risk of de-anchoring today, but at the expense of the recovery thereafter. This trade-off is only likely to get worse. As inflation overshoots become more common, central banks are likely to come under greater pressure to respond, and more quickly.
Generally, inflation expectations bear the scars of previous inflationary episodes. COVID is no different. During the pandemic, inflation expectations have shifted higher, but the distribution of expectations has also shifted – with the emergence of an increasingly pronounced ‘negative skew’. Historically, this has been an indication of a growing risk of de-anchoring in the years ahead (Reis, 2021). The current overshoot is likely to cast a long, vulnerable, shadow.
Figure 2.41. UK: mean, dispersion and skew of household long-term inflation expectations, 2007–22
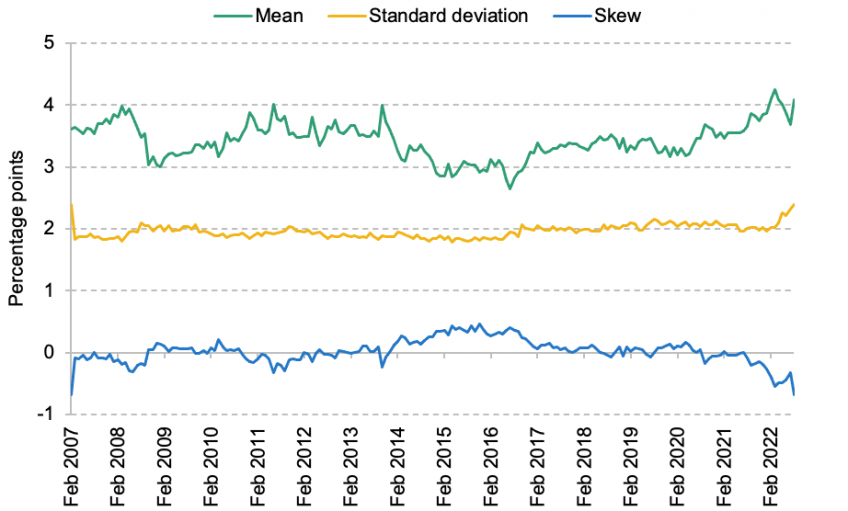
Note: Inflation here is left undefined, so should not be benchmarked to any specific index.
Source: YouGov and Citi Research.
Second, the trade-off between managing inflation, via demand, and the strength of the overall recovery is likely much greater. If, as in current circumstances, policymakers are forced to react to higher spot inflation, they are effectively taking out an insurance policy against a more persistent price growth by further weakening demand and slowing the recovery. This may be prudent. But it does not mean it is not expensive – especially given these shocks should ultimately resolve themselves alone, at least theoretically.
In the current circumstances, the latter point is especially important. The Bank’s decision to hike rates, while justified, will weigh on the recovery through 2024 and 2025. More important, we think this also implies a weaker long-term recovery. The intuition here is that as these supply shocks materialise, the key economic focus should be to accelerate the process to reallocation. This requires investment. By hiking rates, monetary policy slows the process. This means more supply drives inflation for longer. As policymakers still try to bear down on inflation, this can push the economy into a worse medium-term equilibrium.43
The observation that unwarranted monetary tightening can have long-term macroeconomic impacts is nothing new. Indeed, Jordà, Singh and Taylor (2020) have shown that these effects during the Bretton Woods era weighed on long-term output by 3–4%, primarily owing to lower capital accumulation. The argument here is that these long-term effects risk proving even more extensive as demand is pulled down to a lower level of supply, rather than vice versa. Given the inflationary dynamics above, these effects are likely to grow worse and worse.
This, by definition, leaves monetary policy in a much more precarious position. The social costs of price stability – at least via this mechanism – are likely to grow. By reacting to specific price shocks with generalised disinflation, the distributional implications of monetary policy also become more acute. That leaves monetary policy more politically exposed.
Even if central banks are initially allowed to do what is necessary, in the medium term we think that leaves credibility subject to greater doubt. Already, the weakness of real income growth over the last decade is causing problems – including around household resilience, as we noted in Section 2.2. If these effects are compounded by an episodic monetary policy battering, we are not at all sure that the current set-up will prove either politically or fiscally viable.
Figure 2.42. UK: real household disposable income, 1955–2030
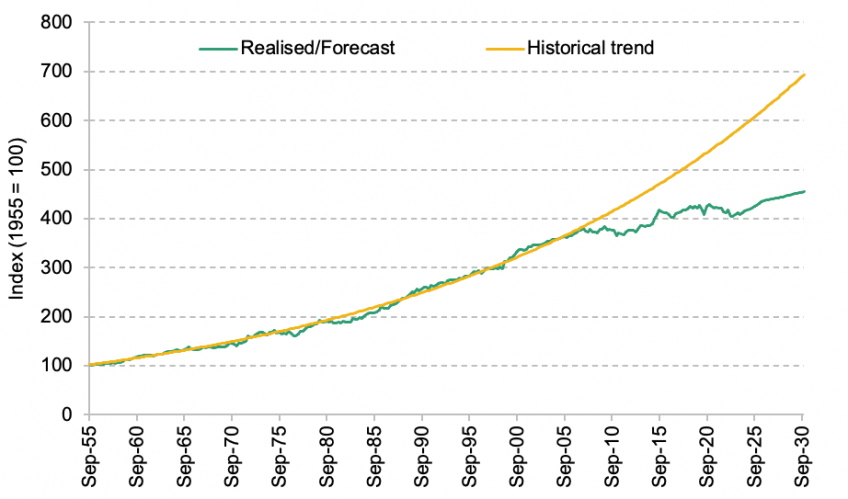
Source: ONS and Citi Research.
Institutional not policy failure
In no circumstances do we think the loss of medium-term price stability would serve UK interests. In that sense, whatever the response, credible ‘monetary dominance’ – the primacy of medium-term price stability – must remain. The question is how to secure that, at the lowest possible cost.
The crucial point here is that in the decade ahead, these kinds of supply-driven shocks are likely to become more frequent. The ecological and geopolitical transitions imply profound changes to the way the international and UK economies will work. Reductions in international collaboration also suggest more supply volatility, and associated inflation (Kahl and Wright, 2021). The weak starting point for the UK economy means that allowing repeated pivots to the ‘weaker’ equilibrium is likely not viable. One way of addressing this is of course an effort to boost trend real growth – which is a ‘no-brainer’. But given the headwinds, the question here is whether we should change the way we manage economic shocks.
There are potential, if challenging, chances for reform here. Specifically, rather than managing inflation via demand, institutions could manage supply-driven inflation ex ante. In this scenario, when faced with a price shock, policy could (1) support adjustment and (2) smooth over the price shocks temporarily. This would limit the risks to inflation expectations, while also aiding (rather than inhibiting) economic adjustment.
What would this imply in the current context?
Well, rather than attempting to offset and absorb the economic pain associated with the increase in energy prices in a blanket fashion, this approach would suggest targeted income support, but also maintaining a high marginal cost of energy – especially for higher earners – in order to encourage reconfiguration. Of course, to do this we would need to ensure the levers were in place so that support could be appropriately targeted.
Given investment itself is relatively energy intensive, this could suggest public support for some ‘investment-producing’ sectors – including construction and some heavy manufacturing. While they of course also have to adjust, they also offer ‘adjustment capacity’ to other sectors in the economy. Controlling prices here, at least initially, may therefore be important to ensure those elsewhere in the economy are still incentivised to shift tack. It would also suggest much greater emphasis on structural interventions to drive behavioural change – for example, targeted subsidy schemes or government-backed finance.
Last but perhaps most important, it would also suggest a broader shift in mindset – dialling up efforts to identify potential structural vulnerabilities ex ante, and offering targeted investment in scalable potential responses. As the UK found both during the pandemic and in light of the recent energy cost shock, these vulnerabilities are numerous. Building a sense of how capacity can be best redeployed in the event of foreseeable shocks, and plugging potential bottlenecks, could be highly effective in terms of reducing supply volatility.
There is a broader point here. The implication of these very sudden supply shocks is what Mares (2022) has described as ‘destructive creation’.44 Many of the shocks to come – including, for example, the ecological transition – require the cession of some economic activity. But this comes without an obvious sense of what might replace it. If left unattended, this means a large aggregate loss.
From a policy perspective, avoiding this requires two things:
·The first is a clear industrial strategy in order to ensure broader social priorities are respected and to guide innovation, in some cases directly when the adjustment is obvious.
· Second is a reduction in the cost of capital, and the protection of liquidity, to ensure the best possible environment for innovation.
As we noted above, no one – least of all the state – can know what the innovative replacement to this kind of shock is. Instead, monetary, fiscal and regulatory policy must work in tandem to foster private innovation as effectively as possible.
We should stress that coordination here must not compromise price stability. Instead the central bank must maintain both the means and authority to do what is necessary here – so-called ‘monetary dominance’. However, this does not necessitate isolation. A high degree of institutional trust and a broad associated commitment to ‘monetary dominance’ is instead likely key to making this agenda work.
This shift is, of course, fiendishly difficult:
· For one, this will require much closer coordination between monetary and fiscal policy, a break with recent policy practice and a shift that poses new challenges in terms of protecting ‘monetary dominance’.
· Second, this would require vast improvement in fiscal policy design, and a new set of supply-orientated subsidy instruments.
· Third, and perhaps most important, this also requires the effective differentiation between necessary price ‘smoothing’ and more permanent (supply-destructive) controls and/or political interventions.
One factor that risks complicating the outlook here is the political context in which these efforts will likely take place. A period of economic reconfiguration implies intense investment will be required to stop output falling back, rather than necessarily sustaining strong growth. This reflects writing-down of assets elsewhere in the economy. Politically, as well as economically, this is likely to be tricky. The historical impulse – as was the case during the 1970s – is towards preservation, rather than innovation.
However, in our view there is little alternative but to try. In the face of a decade of supply disruption, we think reform here may prove the difference between an environment characterised by repeated policy-driven recessions to offset bouts of inflation – a ‘GRIM’ economic decade – and a ‘VIABLE’ one.
Endnotes
Authors

More from IFS
Understand this issue


Policy analysis


Academic research


