
Downloads
Outlook for the public finances
PDF | 577.53 KB
Key findings
1. The most recent official economic and fiscal forecasts, from March 2022, had the government meeting its fiscal targets with a current budget surplus (i.e. total revenues exceeding day-to-day spending) from 2023–24 onwards and underlying public sector net debt on course to fall, albeit modestly, as a fraction of national income from the same year. The Office for Budget Responsibility (OBR) calculated that the government’s mandate to have debt forecast to fall was met by a margin of £28 billion.
2. Much has changed. Under Citi’s macroeconomic forecast, which underpins our analysis of the public finances, rising inflation and interest rates will add to public spending on working-age benefits, state pensions and debt interest. Recent policy decisions, such as the Energy Price Guarantee and the new government’s package of permanent tax cuts, will also add to borrowing. Overall, we forecast that borrowing this year will be £194 billion, which would be £94 billion higher than the £99 billion forecast in March. Of this increase, £68 billion is explained by support for energy bills announced since March (net of revenues from the new energy profits levy).
3. But more important for the sustainability of the public finances is the outlook for borrowing in the medium term. Even once the energy support packages are assumed to expire, borrowing remains elevated. There is huge uncertainty around the exact magnitude, but under a central forecast in 2026–27 we expect borrowing of £103 billion, which would be £71 billion higher than forecast in March. Much of this increase is uncertain – it will in particular depend on the path of the economy, inflation and interest rates – but less uncertain is £43 billion of the increase in borrowing, which is explained by the direct impact of the permanent tax cuts announced by the new Chancellor, Kwasi Kwarteng.
4. We forecast that spending on debt interest will be £103 billion in 2023–24, double the £51 billion forecast by the OBR in March and which was already an upwards revision on the £39 billion the OBR forecast in October 2021. Much of this increase in debt interest spending will dissipate as long as inflation falls back. But even in 2026–27 we forecast that debt interest spending will be £66 billion, some £18 billion higher than forecast by the OBR in March, £26 billion more than forecast in October 2021 and £9 billion more than was spent in 2021–22, as a result of higher interest rates and a higher level of accumulated debt.
5. In line with stated government policy, we assume that the government keeps broadly to the departmental spending plans set out a year ago. This is despite rising inflation eating into the implied real increases: restoring their generosity would require an additional £14 billion of spending in 2023–24 and £23 billion in 2024–25. Keeping to the existing cash spending plans is essentially imposing a rather hidden form of austerity on departments, and doing so in a rather arbitrary way, as it depends on the extent to which rising prices are adding to the spending pressures of each department – which will not be equivalent across the public sector.
6. The Chancellor has promised a ‘fully costed plan to get debt falling in the medium-term’. Pushing back the definition of the medium term from three years to five years could make this aim easier, but still far from easy, to meet. Under Citi’s central forecast, it would require a fiscal tightening of £62 billion in 2026–27 to stabilise debt as a fraction of national income – so even reversing all of the permanent tax cuts in Mr Kwarteng’s ‘mini-Budget’ would not be enough. Higher growth would help – but even if growth turned out to be 0.25 percentage points a year stronger than Citi expects, a fiscal tightening of £41 billion would be required to stabilise debt.
7. The government might be inclined to deliver any fiscal tightening through spending cuts. Supposing £62 billion of cuts were required, one way to achieve this would be as follows. Indexing working-age benefits to growth in earnings rather than prices in the next two years would cut spending by £13 billion, with most of the losses being felt by working-age households in the bottom half of the income distribution. A further £14 billion could come from cutting investment spending plans to 2% of national income, though this might be difficult to square with a government intent on boosting growth. The remaining £35 billion could come from a 15% cut to day-to-day spending on public services outside of the NHS and Ministry of Defence budgets, but this would require cutting spending in many areas where deep cuts were delivered between 2010 and 2019. Such spending cuts could be done, but would be far from easy.
8. Uncertainty around any public finance forecast means it is possible debt will fall as a share of national income. But being able to realistically expect it to fall requires a central view of economic growth and what tax and spending policies will actually be pursued. While we should hope for better growth, the rationale for an independent OBR is to ensure that politically motivated wishful thinking is not incorporated into economic and fiscal forecasts. The OBR should continue its practice of not incorporating hoped-for growth improvements arising from supply-side reforms until evidence of stronger growth starts to emerge.
9. Recent events have illustrated the importance of a credible strategy and plan for fiscal sustainability. Just as financial markets – which ultimately have to lend the money required to plug the gap in the government’s fiscal plans – might be unconvinced by plans underpinned by an assumption of a miraculous uptick in growth, so too might they be unconvinced by plans underpinned by vague promises of public spending cuts far into the future. We need to avoid the situation Mr Kwarteng wrote about in 2012 where ‘in each new budget the government promised their books would balance tomorrow – but tomorrow never seemed to arrive’. The OBR should therefore be very wary of a promise to cut spending in four or five years’ time without sufficient detail of where the axe would fall.
3.1 Introduction
Rishi Sunak’s March 2022 Spring Statement feels like a long time ago. Economic growth was forecast to be steady, although unspectacular. Significant tax-raising measures – in particular a four-year freeze to income tax thresholds, the introduction of the health and social care levy, and a big rise in the rate of corporation tax – meant that planned real-terms spending increases were still consistent with borrowing being forecast to fall. Overall government revenues were forecast to exceed day-to-day government spending from 2023–24 onwards (i.e. the current budget was forecast to return to surplus) and debt, which had climbed to levels not seen since the early 1960s, was forecast to fall as a share of national income.
Two Chancellors later and much has changed. Soaring inflation has pushed up debt interest spending and depressed growth prospects. The settlements for departmental spending made just one year ago now look much more challenging than they did at the time. Support for rising energy bills was announced by Mr Sunak on 26 May and by the new Prime Minister Liz Truss on 8 September. This provides welcome help to households and non-domestic users and will support the economy in coming months, but at a considerable cost to the public finances in 2022–23 and 2023–24. Also substantial, and intended to be permanent, were the new Chancellor Kwasi Kwarteng’s other measures announced on 23 September. This ‘mini-Budget’ confirmed the abolition of the health and social care levy and the scrapping of the planned big rise to the main rate of corporation tax – both of which had been committed to by Ms Truss when she sought leadership of the Conservative Party – alongside some other big tax cuts, such as cuts to stamp duty land tax and bringing forwards a planned 1p cut to the basic rate of income tax, that had not featured in that campaign. The subsequent announcement (3 October) by Mr Kwarteng that the additional 45p rate of income tax is now not to be abolished from April 2023 makes little difference to the overall picture: the planned permanent tax cuts, relative to Mr Sunak’s Spring Statement plan, now total around £43 billion a year rather than around £45 billion a year by 2026–27.
This chapter starts by setting out the path of the public finances since the turn of the millennium and the bequest left by Mr Sunak (Section 3.2). We then turn to discuss the outlook for revenues (Section 3.3) and spending (Section 3.4) in light of Citi’s latest forecast for the UK economy, and the substantial policy measures that have been announced since March. In Section 3.5, we set out what this would mean for the path of government borrowing and government debt and the extent to which the government’s own fiscal mandate, to be on course to have debt falling as a share of national income in three years’ time (which was only legislated in January 2022), would now be missed by a considerable margin. In Section 3.6, we assess the Chancellor’s options given his stated desire of ‘ensuring that debt falls as a share of GDP in the medium term’. Section 3.7 concludes.
3.2 How did we get here?
The Global Financial Crisis and the COVID-19 pandemic inevitably had huge impacts on the public finances. The path of government spending and revenues since the turn of the millennium is shown in Figure 3.1. A decade after the financial crisis and on the eve of the COVID pandemic, total government spending had returned to its 2006–07 level as a share of national income. In 2018–19, revenues were sufficient to cover day-to-day (‘current’) spending for the first time since 2001–02, meaning that the government was only borrowing for investment spending. In other words, the current budget – borrowing excluding investment spending – was in surplus, rather than in deficit.
Even before the huge increase in spending to mitigate the economic impact of the pandemic and associated lockdowns on households, businesses and public services, the 2019 Spending Round had ‘ended’ – though by no means undone – austerity for public services. Following the pandemic, plans for non-virus budgets were topped up in the autumn of 2021. The March 2022 forecasts implied current spending and total public spending settling at a higher share of national income after the pandemic than they had been in 2019–20.
Figure 3.1. Government revenue and spending: out-turn and official March 2022 forecasts
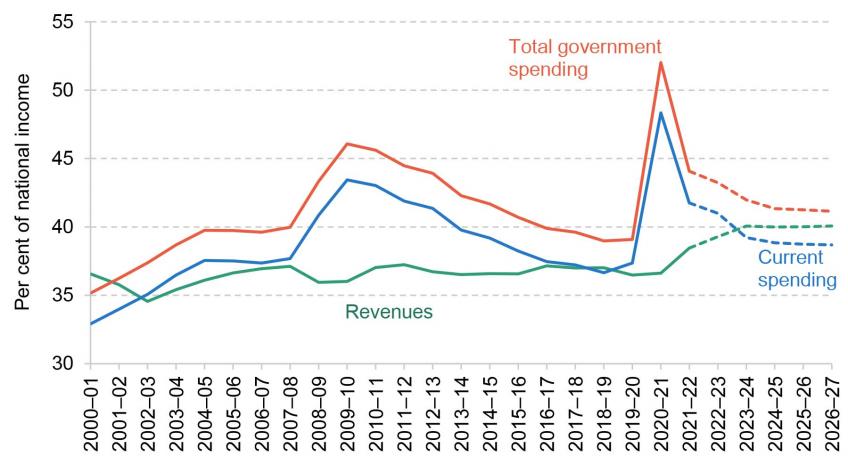
Note: Current expenditure including depreciation.
Source: Office for Budget Responsibility, Public Finances Databank, obr.uk/data/.
Figure 3.2. Government borrowing: out-turn and official March 2022 forecasts
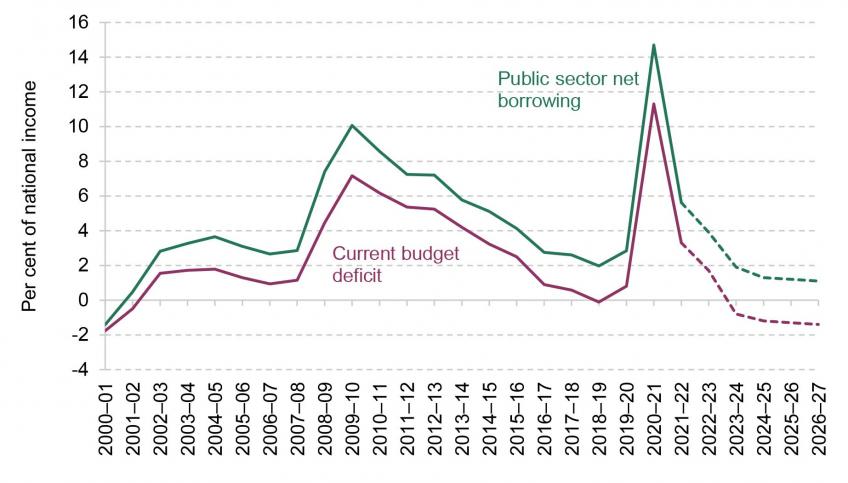
Source: Office for Budget Responsibility, Public Finances Databank, obr.uk/data/; Office for National Statistics, ‘Public sector finances, UK: August 2022’.
Figure 3.3. Government debt and debt interest: out-turn and official March forecast
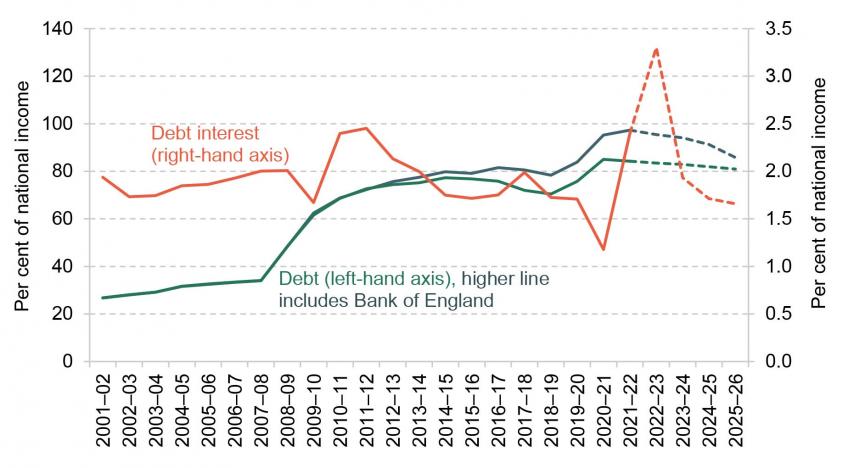
Note: Central government debt interest net of income from the Asset Purchase Facility shown.
Source: Office for Budget Responsibility, Public Finances Databank, obr.uk/data/; Office for National Statistics, ‘Public sector finances, UK: August 2022’.
A relatively strong recovery in revenues as the economy reopened and substantial tax rises (in particular a four-year freeze in income tax thresholds from April 2022 alongside, from April 2023, the introduction of the health and social care levy and a sharp rise in the rate of corporation tax) meant that tax revenues were forecast to increase as a share of national income. Total government revenues (i.e. from taxes and non-tax revenues) were forecast to reach 40% of national income which would be their highest level since 1982–83.
As a result, borrowing – the gap between what the government spends and what it raises in taxes and other revenues – fell by more than half from its pandemic peak in 2020–21 to 5.6% of national income in 2021–22, as shown in Figure 3.2. This is still high compared with the pre-pandemic long-run average of 2.5% of national income. Under official forecasts at the time of the March 2022 Spring Statement, borrowing was set to continue to fall – to 3.9% of national income in 2022–23, to below 2% of national income in 2023–24, and to below the pre-pandemic (March 2020) forecast by the end of the forecast horizon.
The peacetime record levels of government borrowing in response to the financial crisis and the COVID-19 pandemic pushed up government debt as a share of national income. This is shown in Figure 3.3. In 2021–22, headline debt (i.e. including the Bank of England) reached 97% of national income, its highest level since 1962–63 and three times as high as it had been at the turn of the millennium. Despite this large increase in debt, low gilt rates and the fact that an increasing part of the debt was effectively borrowed at (very low) Bank Rate through the Bank of England’s programme of quantitative easing (see Chapter 7) kept debt interest spending at an extremely low level by historical standards.
In recent months, rises in Bank Rate, gilt rates and high inflation – which directly feeds into the government debt interest bill through the quarter of the debt that is index-linked – have pushed up debt interest spending. In 2022–23 it will exceed the March 2022 Spring Statement forecast of 3.3% of national income by a considerable margin. If inflation returns to target quickly and sustainably after its current spike, as OBR forecasts typically assume, then growth in the RPI will return to a more normal rate and debt interest will fall sharply in turn – although it would still remain above the level expected pre-pandemic.
Figure 3.4. International comparison of spending and revenue in 2022 (June 2022 forecast)
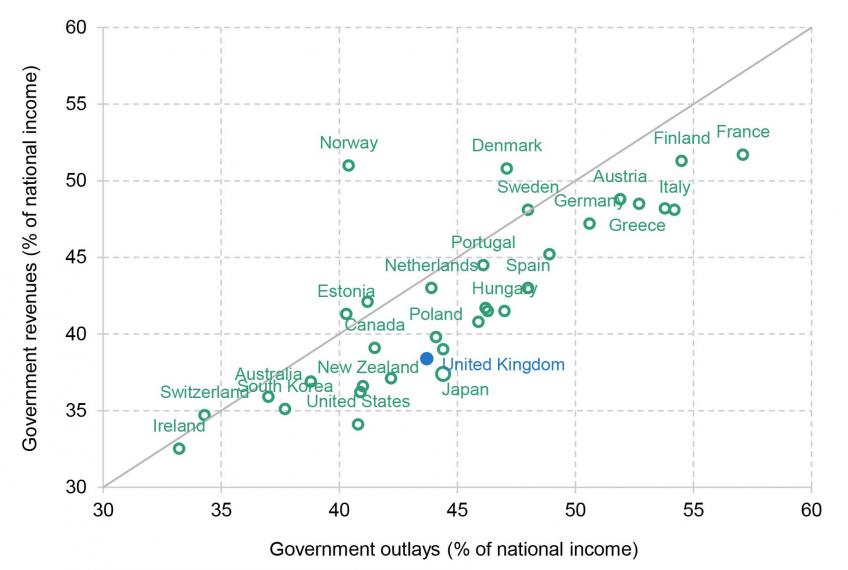
Note: OECD projection for 2022 shown. The measures are general government total receipts and outlays, which differ slightly from the measures shown in other figures for international comparability. Ireland’s ratios increased by 1.42 since its GDP is currently running 42% above GNP and using the latter might be considered a better indicator of the size of the state.
Source: OECD Economic Outlook June 2022 database; Irish GDP and GNP from https://www.cso.ie/en/releasesandpublications/ep/p-na/quarterlynationalaccountsquarter22022/data/.
An international comparison of government revenues and government spending, as a share of national income, is shown in Figure 3.4. These forecasts were produced in June and therefore pre-date many of the expensive interventions in energy markets that have been announced (see Chapter 1) – and therefore give a better sense of the position excluding interventions that are intended to be temporary. Most countries have higher government spending than government revenues (i.e. most countries are located below the 45-degree line in the figure). One noticeable exception is Norway, which generates substantial revenues from oil and gas reserves that it is choosing to save. The size of the state in the UK is around the average of OECD countries. But it is lower than most of its European neighbours: in 2022, the OECD expects (or, at least, in June did expect) the UK’s spending to be 7 percentage points lower, and its receipts 8 percentage points lower, than the Eurozone average. But it also expects receipts and spending in the UK to be much larger than in many other English-speaking countries such as Australia, Ireland, New Zealand and the United States.
3.3 The outlook for revenues
This section sets out our latest forecast for revenues, which is much lower than that forecast in the March 2022 Spring Statement. This is due to a combination of a weaker outlook for the economy and the substantial package of permanent tax cuts announced by the new government in September 2022.
Changes to the economic outlook
A crucial determinant of tax revenues is the size of the economy. The OBR forecast that accompanied the March 2022 Spring Statement was for the UK economy to grow steadily over the next five years from 2021–22 to 2026–27. With an average real rate of growth of just 1.9% a year this was unspectacular, and especially so given that in the early part of this period the economy would still be bouncing back from the pandemic.
This forecast had been prepared prior to Russia’s invasion of Ukraine and the subsequent sharp increase in European gas prices (see Chapter 1). These price rises led the Bank of England, in August, to forecast a protracted recession, with the economy starting to contract at the end of this year and not returning to growth until the middle of 2024. This represented a material deterioration from previous forecasts, as shown in Figure 3.5.
This Bank of England forecast was produced prior to Ms Truss announcing the Energy Price Guarantee. This is a huge intervention in energy policy. Household energy prices are to be capped substantially below expected market rates for up to two years, while non-domestic prices will be held down for six months with a promise of more targeted support to follow. By cushioning the impact of the rise in energy prices on households and businesses, the Energy Price Guarantee will lead to a much shallower recession.
Figure 3.5. Forecast growth in real-terms national income
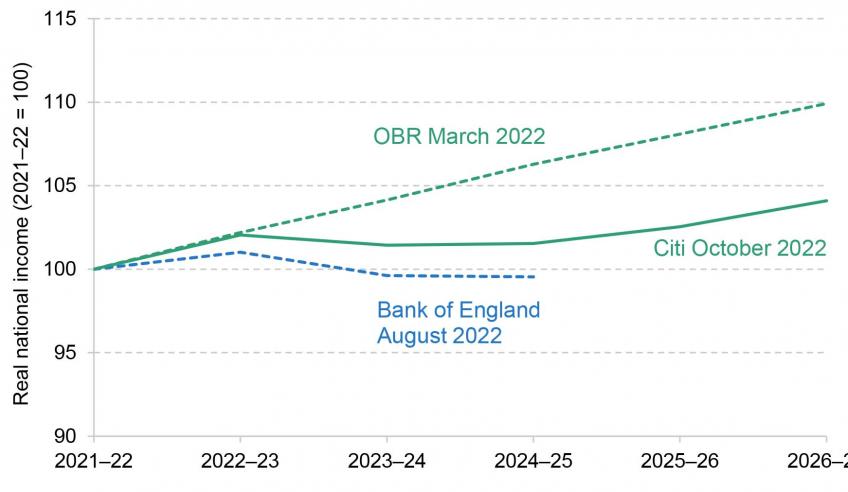
Source: Office for Budget Responsibility, Economic and Fiscal Outlook, March 2022; authors’ calculations.
The latest Citi forecast therefore has the UK economy performing more strongly than forecast by the Bank of England in August. But Citi’s forecast still implies the UK economy only growing by an average of 0.8% a year over the five years from 2021–22 to 2026–27 – slightly less than half the growth rate forecast by the OBR in March. If correct, this would leave the UK economy almost 5% smaller than forecast by the OBR by 20261. In some part, this reflects a long-standing difference in judgements about the medium-term real growth outlook, not just the impact of the recent crisis. Back in autumn of 2021, Citi already expected cumulative real growth over the four years to 2024–25 to be 0.4% of national income lower than the OBR did. However, this accounts for only a small part of the difference between the OBR’s March forecast and Citi’s current one.. Of course there is considerable uncertainty around these – and any – forecasts for the size of the economy. For example, the most recent survey of independent forecasts published by HM Treasury has September forecasts for growth in 2023 from nine different forecasters; these vary from a contraction of 1.9% to growth of 2.1%, i.e. a range of 4%2. The degree to which the outlook has changed since March also only serves to illustrate this.
Inflation is now forecast to run at a much higher rate than forecast in March, although the peak in measured inflation is forecast to be much lower than it would have been without the Energy Price Guarantee. This means that the outlook for the cash size of the economy will not be nearly as depressed as the weaker outlook for the real economy (shown in Figure 3.5) alone would imply. But the boost to economy-wide inflation – the GDP deflator – will be smaller than the increase in the Consumer Prices Index (CPI). This is for a range of reasons (for a discussion, see paragraph 2.27 of Office for Budget Responsibility (2022)). For example, spending on private consumption is about two-thirds of GDP, with much of the remainder being government consumption (loosely day-to-day spending on public services) and investment. In both these areas, inflation is not expected to be as high as it is for households. As the UK is a net importer of energy, rising energy prices also increase household inflation but not the GDP deflator. Despite this, Citi forecasts that faster growth in the GDP deflator will be sufficient to offset most of the forecast weaker outlook for real GDP. As shown in Figure 3.6, by 2026–27 the Citi forecast is for the cash size of the economy to be only about ½% lower than forecast by the OBR in March.
This matters for the public finances as taxes are levied on nominal rather than real amounts (most importantly, earnings, profits and household spending). They will therefore depend more strongly on the path of cash national income than that of real national income.
It must be emphasised that there is also a considerable amount of uncertainty around the forecast for the size of the economy over the medium term and this will translate into considerable uncertainty around the path of revenues and therefore borrowing and debt.
Figure 3.6. Forecast growth in nominal national income
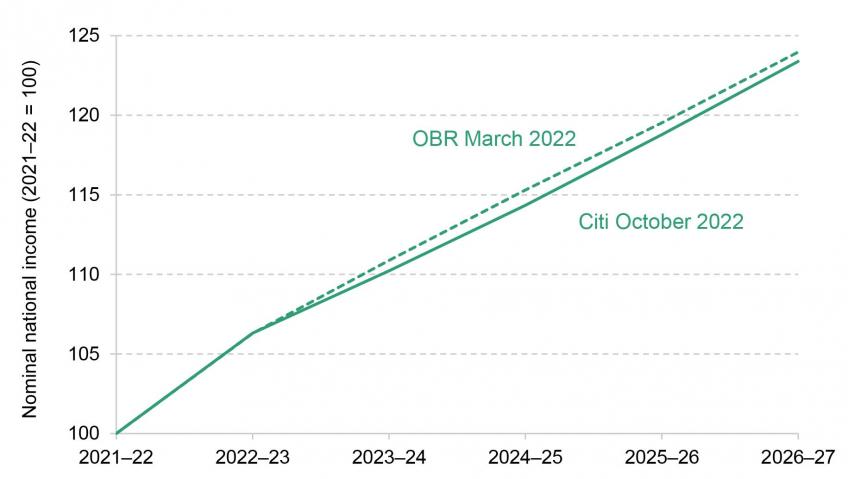
Source: Office for Budget Responsibility, Economic and Fiscal Outlook, March 2022; authors’ calculations.
Tax policy changes since March
The outlook for revenues will also be affected by the substantial new tax policies announced since the March Spring Statement. In May 2022 Mr Sunak announced additional support for households for the rising cost of living, with increases in payments to households worth a total of £15 billion. This energy package also included a new temporary energy profits levy, widely dubbed a windfall tax. At the time, the Treasury said that this ‘will raise around £5 billion over the next year’3. However, with energy prices subsequently rising substantially, the estimated yield has also increased: the latest Treasury estimate is that this measure will now raise £7.7 billion in 2022–23 and a total of £28 billion over the four years from 2022–23 to 2025–26 (HM Treasury, 2022b).
In a move in the opposite direction, Mr Kwarteng’s ‘mini-Budget’ of September 2022 contained a substantial package of permanent tax cuts. These included the two high-profile tax cuts that Ms Truss had committed to in her campaign to become leader of the Conservative Party – reversing the planned rise in the rate of corporation tax (discussed in more detail in Chapter 6) and scrapping the health and social care levy – at a combined estimated cost of £34 billion in 2026–27. In addition, Mr Kwarteng announced other tax cuts such as the abolition of the additional 45p rate of income tax, a cut to stamp duty land tax, and the reintroduction of VAT-free shopping for tourists. The total cost of this package, as estimated by HM Treasury, was put at £45 billion in 2026–27. The subsequent decision, announced by Mr Kwarteng on Twitter on 3 October 20224, not to go ahead with the abolition of the additional rate of income tax reduces the size of the new permanent tax cuts announced since March to £43 billion in 2026–27. Table 3.1 sets out in more detail the main tax measures that have been announced since the March 2022 Spring Statement.
There are other tax-cutting policies that are likely to happen but have not yet been formally announced. Formally, under current policy, the temporary 5p cut to rates of fuel duties expires at the end of March, and rates are to be increased each year by growth in the RPI. But far more likely is that the 5p cut is made permanent and that rates are also frozen at this lower level throughout the forecast horizon. This would reduce revenues in 2026–27 by £9 billion. Another possible tax cut is to business rates: absent any new announcements, many business rate bills will increase sharply due to the current elevated CPI, the revaluation that comes into force in April, and the end of temporary relief for retail, leisure and hospitality. It seems more likely than not the government will produce additional support on at least a temporary basis for those who would otherwise see big increases5.
Table 3.1. Tax policy measures announced since March 2022
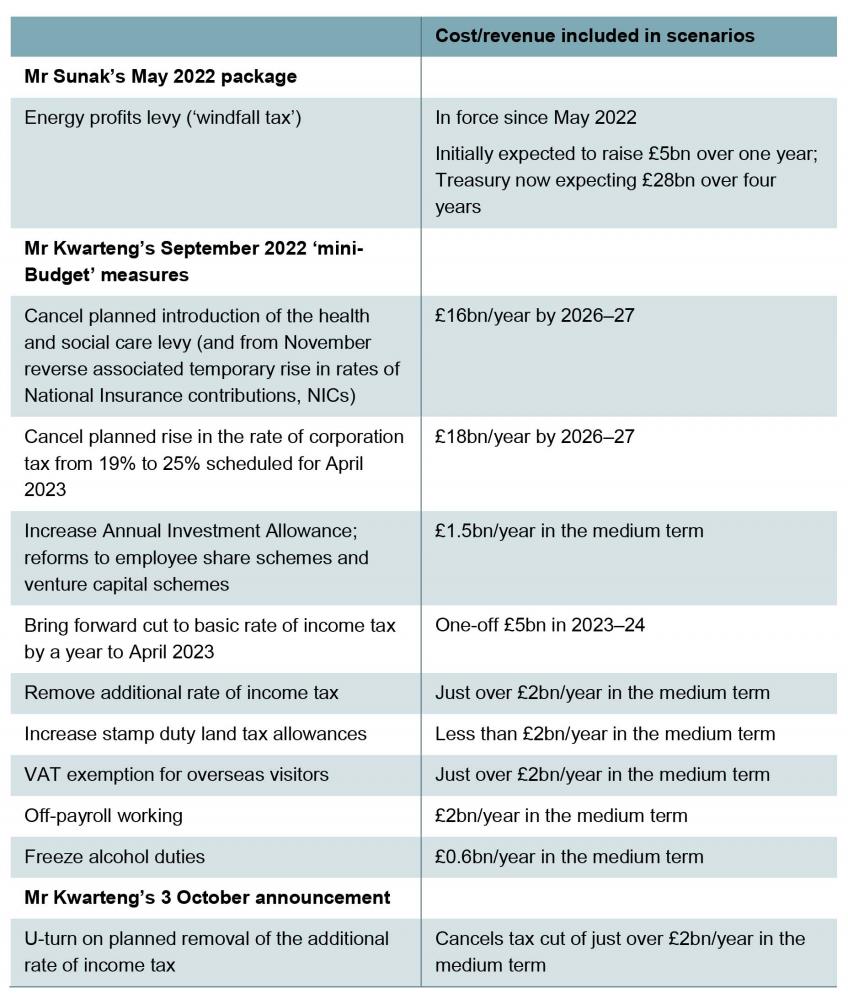
Note: Costing for health and social care levy includes associated changes to dividend tax. Costing for corporation tax includes associated changes to the bank surcharge.
Source: Table 4.2 of HM Treasury (2022b).
Forecast revenues
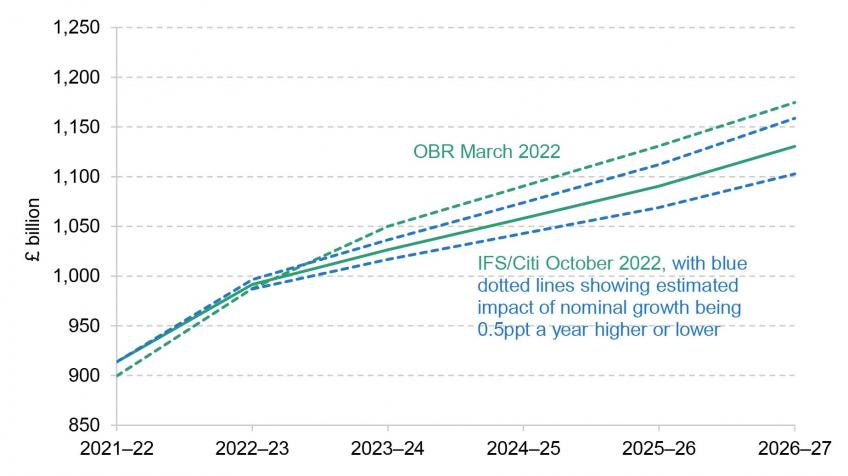
The large permanent tax cuts announced by Mr Kwarteng in September (Table 3.1) and the very modestly weaker outlook for growth in the cash size of the economy, as implied by Citi’s forecast (Figure 3.6) combine to depress forecast government revenues. This is shown in Figure 3.7. Under Citi’s central forecast for the economy, we forecast that revenues in 2024–25 would be £32 billion lower than forecast by the OBR in March (£1,058 billion compared with £1,090 billion) while by 2026–27 the gap is forecast to increase to £44 billion (£1,130 billion compared with £1,175 billion). This is almost entirely explained by the £43 billion cut to taxes announced by Mr Kwarteng in September 2022 (net of the subsequent U-turn on the plan to abolish the additional rate of income tax). The remainder is the net effect of a slightly weaker outlook for cash national income being partially offset by an upwards revision to forecast receipts from interest income. There is, of course, particular uncertainty around the path of the cash size of the economy and therefore the revenues that this will deliver: the blue dotted lines on Figure 3.7 show that revenues in 2026–27 would be expected to be £28 billion higher were growth to be 0.5 percentage points a year stronger, and £28 billion lower were growth to be 0.5 percentage points a year weaker.
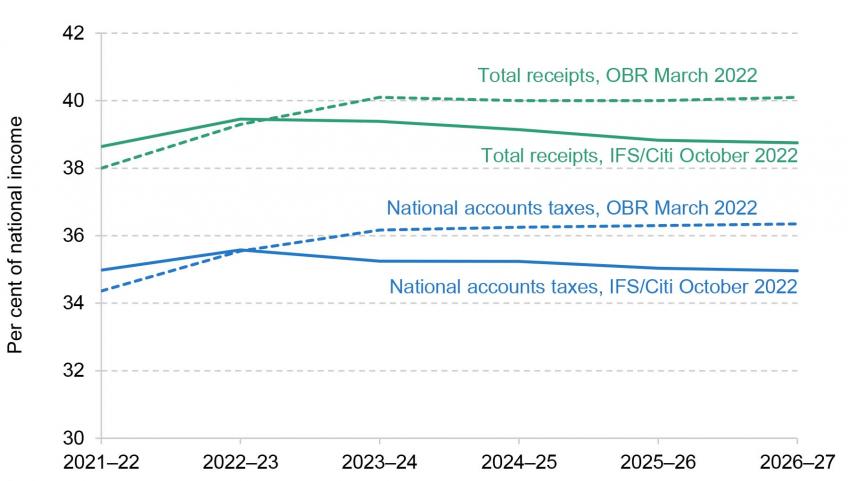
These tax cuts come after a substantial rise in taxes as a fraction of national income since the pandemic, when revenues held up relatively well given the damage to the economy, and substantial discretionary tax rises introduced by the then Chancellor Rishi Sunak in an effort to consolidate the public finances (while increasing spending on health and social care, and not cutting spending in other areas). Despite this trend now beginning to reverse, as shown in Figure 3.8, total receipts are still forecast to amount to more than 38% of national income at the end of the forecast period. Receipts from national accounts taxes (that is total tax receipts, and not including other income received by the government) are also now forecast to fall rather than rise. But they would still remain around the highest sustained level seen in the UK.
Figure 3.7. Forecast revenues, £ billion
Source: Office for Budget Responsibility, Economic and Fiscal Outlook, March 2022; authors’ calculations.
Figure 3.8. Forecast revenues, % of national income
Source: Office for Budget Responsibility, Economic and Fiscal Outlook, March 2022; authors’ calculations.
3.4 The outlook for spending
We now turn to describe how our forecasts for spending differ from the March 2022 Spring Statement, with big increases arising from higher inflation, higher interest rates, and the large spending increases announced in May 2022 and September 2022 intended to provide temporary support with rising energy bills.
State pensions and working-age benefits
One way in which household inflation feeds directly into the public finances is through its impact on the normal uprating of most working-age benefits and state pensions. Specifically, by default each April most working-age benefits increase by the rate of the CPI measured the previous September. The OBR estimates that a 1 percentage point rise in CPI inflation will push up welfare spending by about £1.6 billion a year from the following April (Office for Budget Responsibility, 2021). In addition, when prices are growing faster than earnings (and more quickly than 2½%) a higher September CPI will also push up cash spending on state pensions via the triple lock (under which the basic state pension and the new state pension are increased by the greater of growth in earnings, inflation or 2½%). The OBR estimates that a 1 percentage point increase in triple-lock uprating increases spending on state pensions in the subsequent year by about £0.8 billion.
Figure 3.9. Spending on pensions and working-age benefits
Source: Office for Budget Responsibility, Economic and Fiscal Outlook (October 2021, March 2022); authors’ calculations.
So higher inflation in September 2022 than previously forecast, and with this running above growth in earnings or 2½%, will increase cash spending on working-age benefits and state pensions in April 2023. The March 2022 Spring Statement forecast was for inflation in September to be 7½%, whereas it is likely to be around 10%. In addition, with inflation expected to remain elevated in September 2023 and September 2024, cash spending on benefits and state pensions will be pushed up further in both April 2024 and April 2025 under our forecast. To the extent that higher inflation is expected to result in a permanent increase in the price level (rather than being offset by subsequent deflation), it will lead to permanently higher cash spending in these areas. This is appropriate: unless active decisions are made to do otherwise, working-age benefits and state pensions should not see their real value fall from one year to the next.
A comparison of our forecast for spending on working-age benefits and state pensions, with those published by the OBR in March 2022, is shown in Figure 3.9. We forecast that higher inflation will push up spending by £4 billion in 2023–24, by £11 billion in 2024–25 and by £13 billion in 2025–26.
New spending measures announced since March
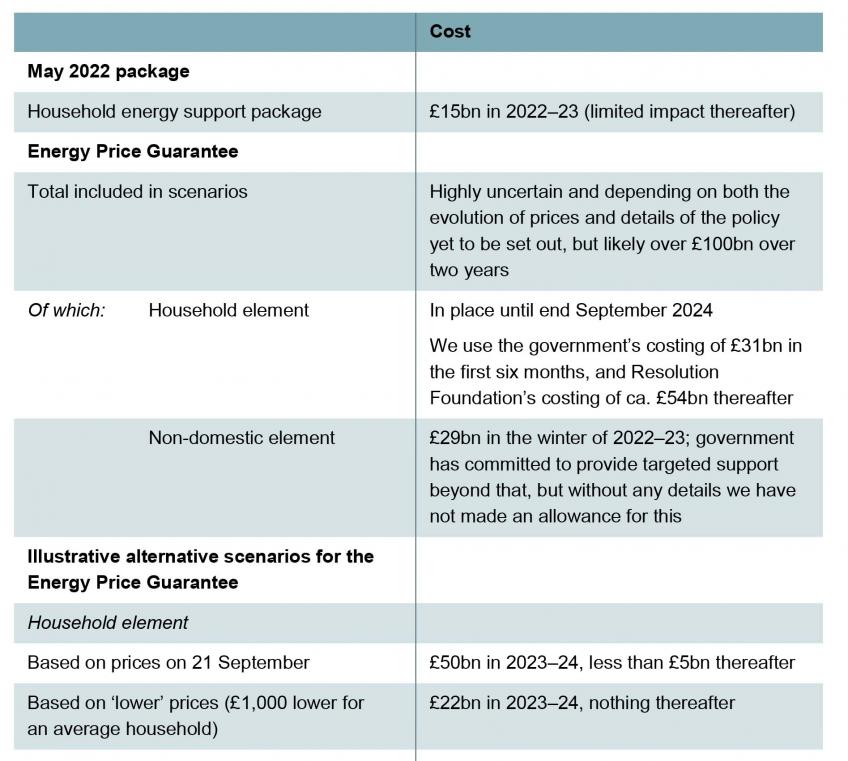
The energy support packages announced in May and September 2022 will also add to spending. While these packages are substantial, especially so in the case of the September measures, both are intended to be temporary. The costings we include in our forecasts are set out in Table 3.2.
Table 3.2. Cost of the energy support packages announced in May and September 2022
Source: Table 4.2 of HM Treasury (2022b); authors’ calculations using Bell et al. (2022).
Mr Sunak’s May 2022 household energy support package – which increased the payment to all households to £400 with additional targeted support for pensioners and those in receipt of certain disability or means-tested benefits – is estimated to cost £15 billion in the current year but not to add directly to spending in subsequent years.
The new government’s Energy Price Guarantee, announced last month, is even more substantial. But because it places a cap on the price of each unit of energy purchased by households for two years, and for non-domestic users for six months, its cost is also extremely uncertain. The higher energy bills would have been absent this reform, the more it will cost, and gas prices have been extremely volatile in recent months.
The government has costed the non-domestic element at £29 billion in 2022–23. While it has committed to providing more targeted support beyond this point, no details are yet available on how this scheme might work and therefore it is not possible to cost. Therefore we make no allowance for this in our forecasts.
The government has costed the household element at £31 billion in 2022–23 but declined to provide a costing beyond that on the basis it is too uncertain. This is a poor reason not to provide a costing. Rather, the government should have provided a central costing alongside estimates of how the cost might vary under different plausible scenarios for gas and electricity prices. For 2023–24 and 2024–25, we take the Resolution Foundation’s costing (as of 24 September) of £54 billion over those two financial years. This gives a total cost of £85 billion. For comparison, Cornwall Insight (2022) costs the policy at £89 billion.
As shown in Table 3.2, while our costing allows for the household element to cost about £85 billion over the two years from October 2022 (£31 billion in 2022–23 and £54 billion over the subsequent 18 months), the cost could easily be much higher or lower than this. As an illustration, rather than costing £50 billion in 2023–24, were energy prices to end up higher by the equivalent of £1,000 per household, the exchequer cost would increase to £78 billion. In contrast, were energy prices to end up lower by the equivalent of £1,000 per household, the exchequer cost would fall to £22 billion in that year.
Spending measures not announced since March
The final area of spending is departmental spending on the delivery and administration of public services. Spending plans for each department were set in the October 2021 Spending Review for the three years 2022–23, 2023–24 and 2024–25, with separate cash limits for day-to-day spending and for investment spending. The government has been clear that it intends to keep to these cash limits, stating on 26 September that it ‘is sticking to spending settlements for this spending review period’6.
Therefore we assume that these spending plans will be kept to, with one exception. The plans included a provision for spending on overseas aid to return to the legislated target level of 0.7% of national income in 2024–25 from its current level of 0.5% of national income. This was on the basis that the government was forecasting that by then it would no longer be running a current budget deficit and that public sector net debt would be falling as a share of national income. Given that our forecasts imply a persistent current budget deficit with debt continuing to rise as a share of national income (see Section 3.5), we assume that overseas aid remains at the lower level of 0.5% of national income. This 0.2% of national income reduction in planned spending is equivalent to £5 billion in today’s terms.
The assumption that, other than overseas aid, spending will remain at the same cash levels as those planned in the October 2021 Spending Review is questionable. Departments are facing higher rates of inflation than expected when those plans were set, reducing their real-terms generosity. For example, while the non-domestic component of the Energy Price Guarantee will help considerably, energy costs will still be higher than expected a year ago. More significantly, public sector pay awards are being set at a higher rate than was planned for when budgets were set (see Chapter 4 for more details). Keeping to the existing cash spending plans is essentially imposing a rather hidden form of austerity on departments, and doing so in a rather arbitrary way, as it depends on the extent to which rising prices are adding to the spending pressures of each department – which will not be equivalent across the public sector. To give three examples: social care is both more labour intensive and more energy intensive than many public services; schools – and in particular special needs schools, which employ more teaching assistants – are also very labour intensive; while the Ministry of Defence will be particularly exposed to rising costs associated with the weakening of the pound against the dollar. Even if the government wanted to keep to the same overall cash spending limit, there would be a case for reviewing whether these funds remain allocated appropriately across departments.
An alternative scenario might be one where the government decided that rather than keep to the existing cash spending plans, it wanted to restore them to the same real-terms level of generosity as intended in last October’s Spending Review. This would have the advantage of helping public sector employers manage the cost of elevated public sector pay awards. But it would come at the cost of adding considerably to spending. On Citi’s forecasts for the GDP deflator, this would require an additional £5 billion in 2022–23, £14 billion in 2023–24 and £23 billion in 2024–25.
Debt interest
Spending on debt interest, put simply, will depend on how much debt the government has and what the rate of interest is on that debt. With our forecasts implying more borrowing due to large permanent tax cuts (Table 3.1), increased spending on working-age benefits and tax credits (Figure 3.9) and a substantial temporary package of support with energy bills (Table 3.2), this will, all else equal, inevitably push up debt and thus forecast subsequent spending on debt interest.
The effective interest rate paid by the public sector depends on how debt has been financed. The cost of new borrowing will depend on the prevailing gilt rate when the borrowing occurs. Where gilts have subsequently been purchased from the open market by the Bank of England through its programme of quantitative easing, interest is instead immediately incurred at the contemporaneous Bank Rate set by the Bank of England7. Finally, roughly a quarter of government debt is index-linked, meaning that after being issued the cost of servicing will vary according to growth in the Retail Prices Index.
Alongside increased inflation, recent months have also seen big rises in both gilt rates and Bank Rate. The Citi forecast is for these to continue to run ahead of what was forecast by the OBR in March 2022. As a result, we forecast that debt interest spending will be pushed up further in coming years. This is shown in Figure 3.10. The bottom (green) section of the chart shows the OBR’s March 2022 forecast for debt interest spending. Separated out on top of this are the increases in debt interest spending that we forecast will occur from Bank Rate, gilt rates, growth in the RPI, and additional borrowing.
Figure 3.10. Spending on debt interest, £ billion
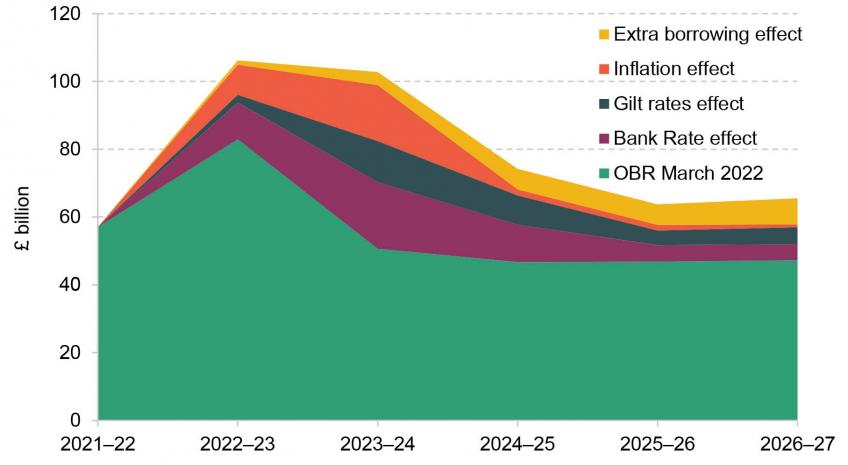
Note: Central government debt interest net of income from the Asset Purchase Facility shown. 2021–22 figure relates to the latest out-turn rather than the OBR’s March forecast.
Source: Office for Budget Responsibility, Economic and Fiscal Outlook, March 2022; Office for National Statistics, ‘Public sector finances, UK: August 2022’; authors’ calculations.
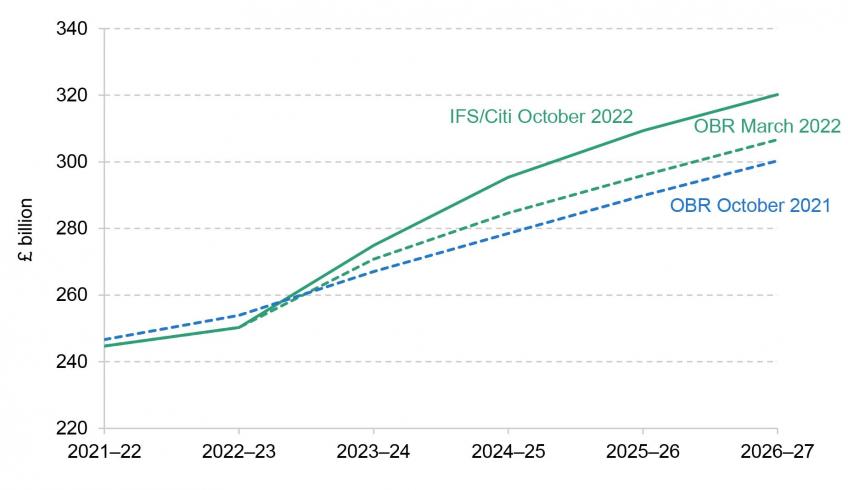
The overall impact is substantial. In the current financial year we forecast that debt interest spending will be £106 billion, which would be £23 billion higher than the £83 billion forecast by the OBR in March. This OBR forecast already represented a substantial upward revision: its previous forecast, from a year ago in October 2021, was for debt interest spending in 2022–23 to be £42 billion. The increase in forecast debt interest spending in 2023–24 is even bigger: we forecast that spending will be £103 billion, which would be twice that forecast by the OBR in March (£51 billion). After that point, the increases in forecast debt interest, while still substantial, are not as enormous. In 2026–27 we forecast debt interest spending of £66 billion, which would be £18 billion higher than the £47 billion forecast by the OBR in March and £26 billion more than the £40 billion forecast in October 2021.
As detailed in Figure 3.10, the extent to which each factor pushes up forecast debt interest spending varies across the forecast horizon. The role of increased borrowing adding to debt, and therefore higher debt interest spending, increases throughout the horizon. The other components, which affect the interest rate paid on the debt, contribute more to the increase in the forecast for debt interest spending in the next two years than they do for subsequent years. For index-linked debt, this is because the impact of higher RPI on debt interest spending will only persist for the period in which the RPI remains elevated. The impact of higher gilt rates and higher Bank Rate is bigger in the next two years than subsequently because, while the Citi forecast is for these to run ahead of the OBR’s forecast over the next two years, they are then forecast to drop back. In 2026–27, while the increase is smaller, both higher Bank Rate and higher gilt rates are still adding £5 billion each to debt interest spending (i.e. £10 billion in total).
This outlook for debt interest has increased since the 23 September ‘mini-Budget’. This is because the permanent tax cuts were bigger than had been expected and because Bank Rate and gilt rates have risen in the intervening period, with some of this increase expected to persist. A comparison of the forecast we published two days prior to the ‘mini-Budget’ with our latest forecast for debt interest spending is shown in Table 3.3. In 2023–24 we now forecast that debt interest spending will be £10 billion higher than we thought just prior to Mr Kwarteng’s statement. By the end of this forecast horizon, as the difference in assumed Bank Rate and gilt rates between the two forecasts decreases, the increase in forecast debt interest spending is just £1 billion. The large changes in the forecast for debt interest over the space of just a few weeks reflect not just the scale of the ‘mini-Budget’ but also the sensitivity of such projections to market conditions.
Table 3.3. Successive vintages of forecasts suggesting higher debt interest spending
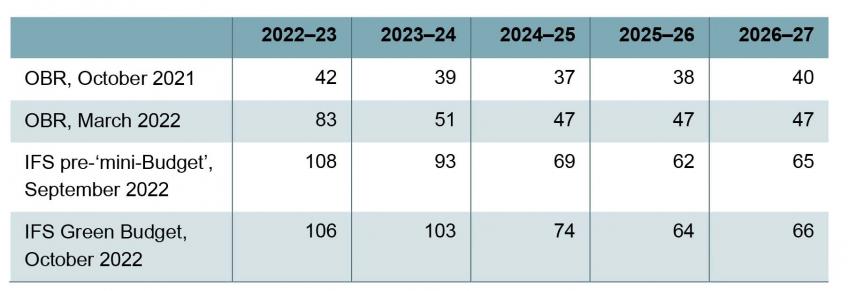
Note: October 2021 restated from the March 2022 Economic and Fiscal Outlook.
Source: Office for Budget Responsibility, Economic and Fiscal Outlook, March 2022; Emmerson and Stockton (2022); authors’ calculations.
Our forecast is for substantially more debt interest spending in 2022–23 and 2023–24 than forecast by the OBR in March. While most of the increase then dissipates, we still forecast that debt interest spending will remain at an elevated level. Our forecast implies debt interest spending in 2026–27 running at about 2.2% of national income. This would, as shown in Figure 3.11, be slightly above that seen over the 20-year period from 2001 to 2020 but still below what was typically spent over the 20-year period from 1981 to 2000.
Figure 3.11. Spending on debt interest, % of national income
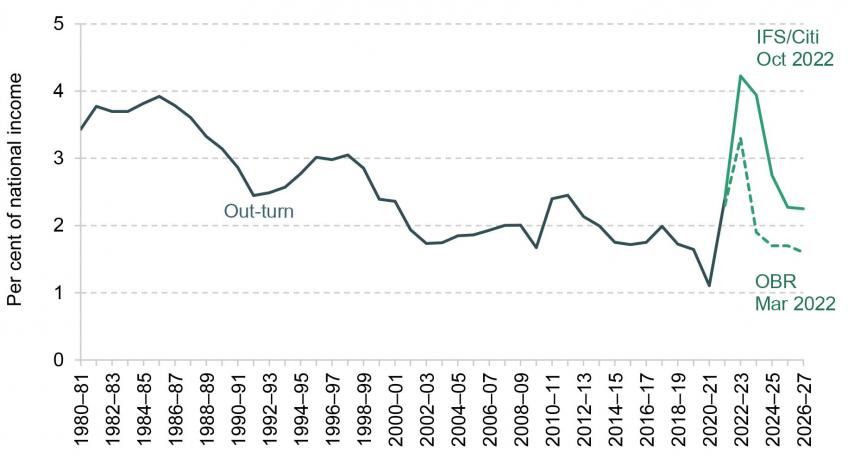
Note: Central government debt interest net of income from the Asset Purchase Facility shown.
Source: Office for Budget Responsibility, Public Finances Databank, obr.uk/data/; Office for National Statistics, ‘Public sector finances, UK: August 2022’.
Table 3.4. The OBR’s debt interest ready reckoner
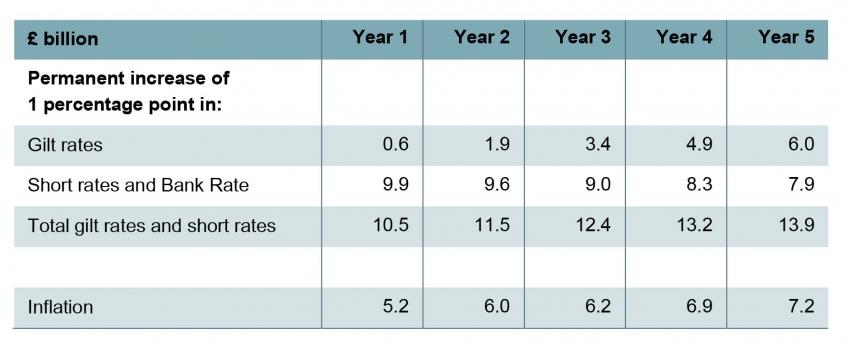
Source: Table 3.21 of Office for Budget Responsibility, ‘March 2022 economic and fiscal outlook – supplementary fiscal tables: expenditure’, https://obr.uk/download/march-2022-economic-and-fiscal-outlook-supplementary-fiscal-tables-expenditure/.
While debt interest spending is forecast to drop back after 2023–24 (Figure 3.10), a combination of elevated debt (Figure 3.3) and the fact that a large proportion of this debt is effectively financed at the contemporaneous Bank Rate means that the public finances remain more exposed to the risk that debt interest spending will again end up higher than forecast8. Were higher interest rates associated with higher productivity growth then this should not be problematic, as the associated boost to tax revenues would likely be more than sufficient to outweigh increased debt interest spending. But recent months have seen an increase in interest rates which – at least under our forecasts – is not associated with a stronger outlook for growth, and therefore has contributed to a weaker outlook for the public finances.
An estimate of the sensitivity of debt interest forecasts to different interest rates and inflation rates can be found in the OBR’s debt interest ‘ready reckoner’, which is reproduced in Table 3.4. A one-year increase in gilt and short rates of 1 percentage point would add just over £10 billion to debt interest spending in the coming year. If interest rates then dropped back, this impact would dissipate. But if interest rates remained 1 percentage point higher, the impact would increase over time (to almost £14 billion by the fifth year of the forecast). This is because more of the gilts in issuance would have been refinanced by the Debt Management Office at higher gilt rates, and this effect would outweigh the fact that the impact of elevated Bank Rate is expected to fall as the Bank of England unwinds its programme of Quantitative Easing (both through not replacing tranches of gilts as they expire and through active gilt sales). Recent rapid increases in gilt yields, alongside market expectations for Bank Rate to rise further and faster than previously thought, highlight the risks of substantially and permanently increasing borrowing and putting debt on an ever-increasing path.
Forecast spending
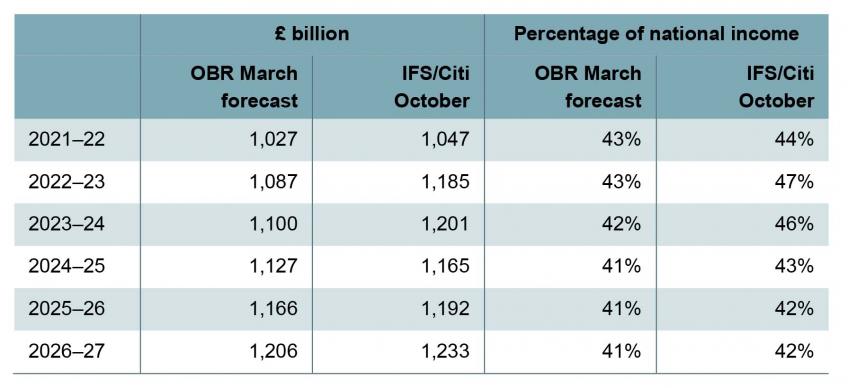
Our central forecast for spending, both in cash terms and as a share of national income, is shown in Table 3.5. Over this year and next, the temporary responses to high energy prices add considerably to spending, which is pushed up further through higher spending on working-age benefits, state pensions and debt interest. In total we forecast that spending will be just over £100 billion higher than forecast in the March 2022 Spring Statement in 2022–23 and 2023–24. Just under half of this increase is from energy-related policies. Once these are assumed to expire, we forecast that spending will continue to run above the March forecast, by almost £30 billion in 2026–27. With higher cash spending and a slightly smaller cash size of the economy under our forecast, spending is a bigger share of national income, at 42% of national income in 2026–27 compared with the 41% forecast by the OBR in March.
Table 3.5. Government spending
Source: Office for Budget Responsibility, Economic and Fiscal Outlook, March 2022; authors’ calculations.
It is important to note here that while we project total spending to be higher both in cash terms and as a fraction of national income, that spending will be buying us less than previously expected. The increases are entirely down to higher inflation pushing up spending on working-age benefits and state pensions, and higher spending on debt interest. The real value of spending on public services in 2026–27 would actually be 5% less than expected back in March. Economic failure means the state will be bigger than intended as a fraction of national income but services will be worse than intended.
3.5 Medium-term outlook under two scenarios
In this section, we take the forecasts for government revenues and government spending presented in the previous section and set out what they would imply for borrowing and debt. As well as presenting our forecasts under the central Citi scenario, we also present the outlook for borrowing and debt under Citi’s more pessimistic ‘dislodged expectations’ scenario (see Chapter 2 for more details). Under this scenario, inflation becomes more embedded and persistent; interest rates increase further and faster than in the central scenario as a result, and remain higher throughout the forecast horizon. This adds further to debt interest spending, while the protracted recession which results leads to reduced revenues9. Of course higher growth – such as the 2½% growth target set by Mr Kwarteng – would deliver a better outlook for the public finances. The next section discusses the contribution that higher growth could make.
Forecasts for borrowing
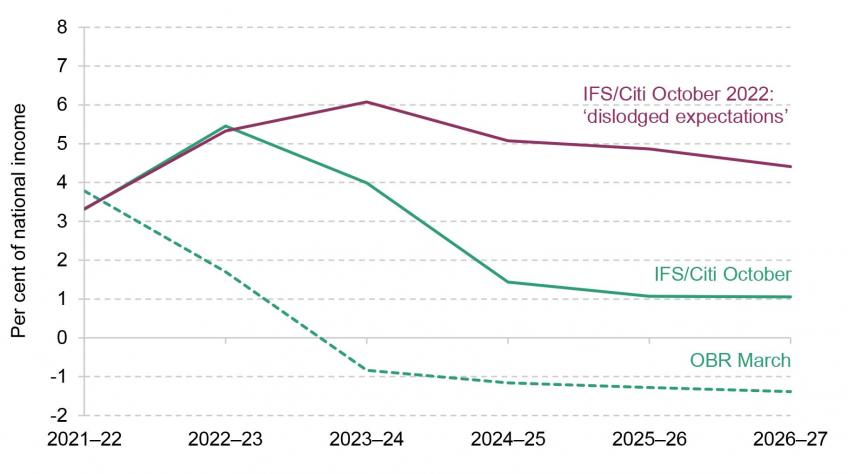
The forecast for borrowing under each of these two Citi scenarios (the central and the ‘dislodged expectations’ scenarios), alongside the OBR’s March 2022 Spring Statement forecast, are shown in Figure 3.12. In 2022–23 under both Citi scenarios we forecast that borrowing would be around 7½% of national income, considerably higher than the 4% of national income official March forecast. Borrowing of this scale would be the third-highest peak in UK borrowing since the Second World War, after the Great Financial Crisis and the COVID-19 pandemic (as was shown in Figure 3.2). Under our central forecast, borrowing would then fall as the energy price measures announced in May and September are assumed to expire. But from 2024–25 it would settle at around 3½–4% of national income, considerably above the level under the March 2022 forecast. It should be stressed that there is a considerable amount of uncertainty around this. One indication of this is how different the outlook for borrowing looks now compared with the situation in March. Another is provided by the ‘dislodged expectations’ scenario, under which borrowing is forecast to rise in 2023–24 and even by 2026–27 would be running at around 7% of national income.
Figure 3.12. Forecast borrowing

Source: Office for Budget Responsibility, Economic and Fiscal Outlook, March 2022; authors’ calculations.
We assume investment spending to be unchanged, in cash terms, from plans at the March 2022 Spring Statement. As a result, under our scenarios, borrowing would comfortably exceed planned investment spending, meaning a forecast current budget deficit (see Figure 3.13). In March, the OBR forecast that the current budget deficit would fall, moving into a current budget surplus in 2023–24 (which would only be the second current budget surplus since 2001–02). These surpluses were forecast to increase slightly throughout the forecast horizon, reaching 1.4% of national income in 2026–27. In contrast, under our central scenario, there would be sizeable current budget deficits in 2022–23 and 2023–24, and even once the packages of support for energy bills are assumed to expire the current budget is forecast to remain in deficit. The government would be consistently borrowing not just for investment, but also to fund day-to-day spending. In 2026–27 under our central scenario, the current budget is forecast to be in deficit by 1% of national income. As well as being bigger than forecast in March, it would also be bigger than prior to the pandemic and also bigger than the long-run average (as shown in Figure 3.2). As with overall borrowing, there is considerable uncertainty around the outlook for the current budget deficit.
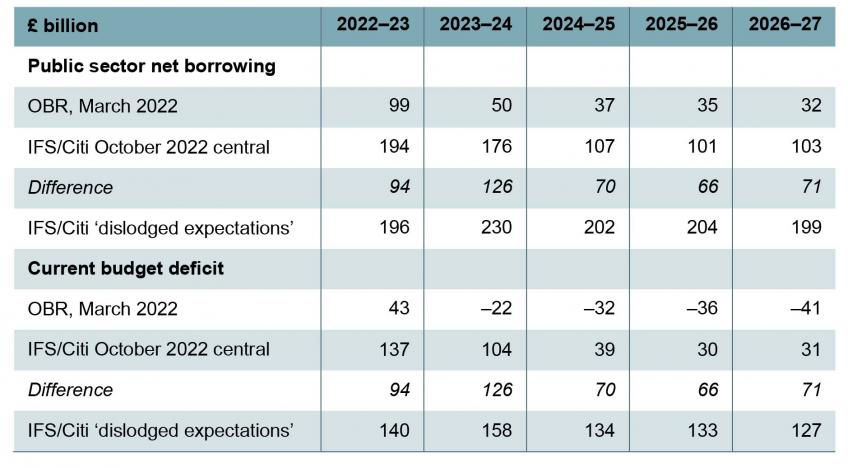
A comparison of the headline forecasts for borrowing and the current budget deficit in billions of pounds is presented in Table 3.6. Under our central forecast, borrowing this year will be £194 billion, which would be £94 billion higher than the £99 billion forecast by the OBR in March. Of this increase in borrowing, £68 billion would be explained by the support for rising energy bills, net of revenue from the new energy profits levy, announced in May and September 2022 (as shown in Table 3.2). Under the ‘dislodged expectations’ scenario, borrowing in 2026–27 would – at £199 billion – be almost twice as high as under our central scenario.
Figure 3.13. Forecast current budget deficit
Source: Office for Budget Responsibility, Economic and Fiscal Outlook, March 2022; authors’ calculations.
Table 3.6. Comparison of forecast borrowing and forecast current budget deficit
Source: Office for Budget Responsibility, Economic and Fiscal Outlook, March 2022; authors’ calculations.
Even once these schemes are assumed to have long expired, our central forecast is for borrowing to remain much above that forecast by the OBR. In 2026–27 our forecast is for borrowing to be £103 billion, which would be £71 billion above the OBR’s March forecast of £32 billion. Of this increase, £43 billion would be the direct result of the permanent tax cuts announced by Mr Kwarteng (see Table 3.1) and the remainder due to the unpleasant combination of higher inflation and higher interest rates without a stronger outlook for the cash size of the economy. Under our assumption that cash investment plans remain unchanged, this leads to a forecast current budget deficit of £31 billion in 2026–27 (rather than a surplus of £41 billion). Under the ‘dislodged expectations’ scenario, the current budget would be in deficit in that same year by £127 billion.
Forecasts for public sector net debt
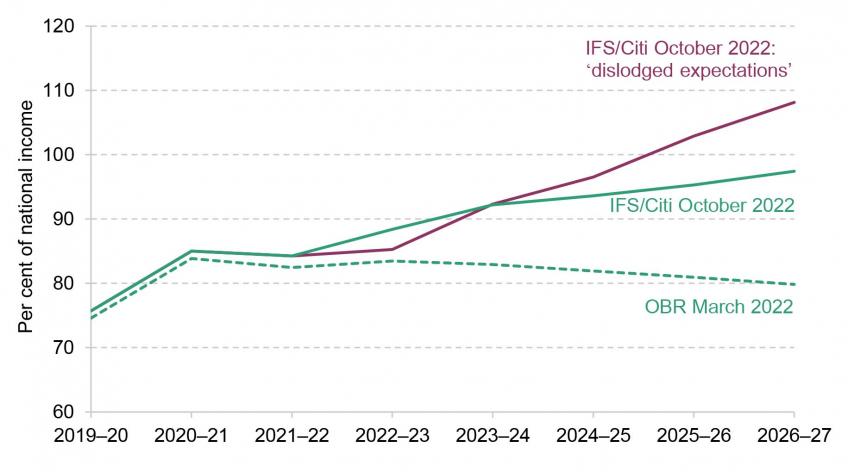
Under our central forecast, with higher borrowing and lower cash national income, public sector net debt is forecast to be above that forecast in the March 2022 Spring Statement – and by an increasing amount each year. In fact, as shown in Figure 3.14, debt in our central forecast continues to rise throughout the forecast horizon; that is, to rise even once the big packages of support for rising energy prices are assumed to have expired. Under the ‘dislodged expectations’ scenario, debt is forecast to grow as a share of national income at an even faster rate. While the optimal level of debt is not known – and will depend on a wide range of factors – having debt relentlessly rising as a share of national income would at some point become unsustainable.
Figure 3.14. Forecast underlying public sector net debt (i.e. excluding Bank of England)
Source: Office for Budget Responsibility, Economic and Fiscal Outlook, March 2022; authors’ calculations.
3.6 Fiscal targets and options for the Chancellor
Following the commitments made in the Conservative Party’s 2019 general election manifesto, in January 2022 legislation was passed updating the Charter for Budget Responsibility. The Treasury’s objectives for fiscal policy were set as ‘to ensure sustainable public finances, economic growth and stability, value for money for the taxpayer, a strong balance sheet, and intergenerational fairness’ (HM Treasury, 2022a). In this section, we describe the government’s fiscal targets and the degree to which they are now on course to be missed. We then turn to the question of what action could lead to them being met.
Missing the fiscal targets
To achieve the government’s fiscal objectives, the Charter set out two main fiscal targets: first, the fiscal mandate ‘to have public sector net debt (excluding the Bank of England) as a percentage of GDP falling by the third year of the rolling forecast period’; and second, a supplementary target to aim to ‘balance the current budget by the third year of the rolling forecast period’10. A detailed discussion of the design of fiscal targets in general, and these in particular, can be found in chapter 4 of last year’s Green Budget (Emmerson and Stockton, 2021).
At the time of the March 2022 Spring Statement, both these fiscal targets were met under the OBR’s forecast. The OBR was forecasting that public sector net debt would fall between 2023–24 and 2024–25 (by a margin of £28 billion) and that there would be a current budget surplus in 2024–25 (of £32 billion). At the time of the next Budget (expected in Spring 2023), the rolling nature of the targets means that the requirement for debt to fall would apply to the change between 2024–25 and 2025–26, while the requirement to have a current budget balance would apply to 2025–26. Had the forecasts remained unchanged from Spring 2022, both would be met with an increased margin: debt was forecast to fall by a margin of £28 billion and the current budget was forecast to be in surplus by £36 billion.
These margins may sound big, but relative to the errors in public finance forecasts they are not. The margin with which debt is expected to fall is particularly sensitive to the forecast for growth in nominal national income in that year. On unchanged policies at the time of the Spring Statement, the OBR judged – on the basis of forecast errors made in the past – that there was a one-in-three chance that the current budget would actually end up in deficit in 2024–25 and a four-in-ten chance that debt would rise rather than fall as a share of national income between 2023–24 and 2024–25.
So delivering a current budget surplus and falling debt was never a given. On the forecasts presented in Section 3.5, both rules would be missed. Public sector net debt would be rising as a share of national income between 2024–25 and 2025–26 by a margin of £48 billion and there would be a forecast current budget deficit in 2025–26 of £30 billion. In other words, under our forecast, a combination of tax rises and spending cuts totalling £48 billion (1.7% of national income) would be required in 2025–26 to be on course for debt to be stable as a share of national income between 2024–25 and 2025–26. Reversing the entirety of the £43 billion of permanent tax cuts announced by Mr Kwarteng would therefore not be quite sufficient, on our forecast, to have debt falling in 2025–26. And of course this course of action seems unlikely.
How might falling public sector net debt be delivered?
Rather than meeting the fiscal targets that were legislated in January, it seems much more likely that they will be scrapped. This follows a pattern: as we described in last year’s Green Budget, following the announcement by then Chancellor George Osborne of his second set of fiscal targets in 2014, the following seven years saw a total of 11 fiscal targets being announced. Many were missed (or on course to be missed) before they were dropped. The new Chancellor has stated that in a Medium-Term Fiscal Plan to be released on 23 November he will ‘set out further details on the government’s fiscal rules, including ensuring that debt falls as a share of GDP in the medium term’14.
So how might Mr Kwarteng ensure that public sector net debt does fall as a share of GDP? The short answer is that this cannot be ensured over the next five years. A clear lesson from the Global Financial Crisis, the COVID-19 pandemic and the current cost-of-living crisis is that when severe adverse shocks hit, it can be appropriate – and desirable – for government to provide substantial additional support and for this to be financed through increases in debt. That is precisely why it matters that, in normal times, debt should be falling as a share of national income over the longer term. Most obviously, doing this can help create ‘fiscal space’ to allow debt to rise when the next severe adverse shock hits. We cannot have a situation where, relative to national income, debt increases during bad years but is not reduced at any other time.
Under the current set of fiscal targets, the government’s fiscal mandate is to have debt falling by the third year of the forecast horizon. One obvious strategy would be for the public sector to sell assets (either physical assets or long-run financial assets that do not net off public sector net debt, such as the student loan book). This should be avoided. Decisions on asset sales should be motivated by whether these assets would be better managed in the public or private sector, not by a desire to reduce the headline level of debt. The previous government – following the recent balance sheet review (HM Treasury, 2020) – committed to focusing on ‘public sector net worth’ which considers the balance between public sector assets and public sector liabilities. This is the right approach to take. The flip side of this argument is that debates around the merits (or otherwise) of nationalisation should not centre on the additional public debt that nationalisations would entail, but instead on whether those assets (companies) would be better managed in the public sector.
Another obvious thing that the Chancellor could do is to push the target year back so that debt only needs to be on course to fall by the final (fifth) year of the forecast horizon, rather than the third year. So in the forthcoming Medium-Term Fiscal Plan this would be between 2026–27 and 2027–28. Extending the horizon would allow more time either for any improvement to the outlook for growth to feed through, or for any discretionary fiscal tightening, such as a squeeze on public spending, to come into effect. There was nothing sacrosanct about aiming to have debt falling in three years’ time, and therefore one could reasonably argue that a longer time frame would be appropriate. However, it is not clear that the economic case for a longer time horizon is any stronger now than it was in the spring: in particular, while the government’s new energy market interventions will add considerably to debt, they are intended to expire in two years’ time and therefore do not make it harder to deliver a fall in debt by the third year. If anything, they make it easier.
While our forecasts only extend forwards four years (as they build up the OBR’s March 2022 forecasts which run to 2026–27), it is clear that pushing back the requirement to have debt falling as a share of GDP to five years out would, on our forecasts, still mean the fiscal mandate being missed under current policy. In the final year of our forecast horizon – between 2025–26 and 2026–27 – we have public sector net debt rising by a margin of £62 billion. And our central forecast is for the current budget to still be in deficit by £31 billion in 2026–27. This gives a sense of the scale of the challenge if the Chancellor is to restore some semblance of fiscal sustainability.
To achieve his desired fall in debt, the Chancellor would therefore need a combination of: (1) the underlying public finances to be stronger than our forecasts suggest; and (2) new policy measures that boosted revenues or cut spending. Now there is much uncertainty around the public finances and therefore it is not implausible that even on unchanged policies debt could end up falling as a share of national income. Some good news might turn up, in other words. But in our view it is also not implausible that debt ends up considerably higher. Given that it is important that debt starts falling in the medium term, it would be risky indeed simply to assume that ‘something will turn up’.
Stronger growth would definitely help. What matters here is not the headline amounts of growth that we get over the next year or two (which reflect temporary changes in demand in the economy) but rather the underlying, sustainable, level of growth forecast into the medium term. Finding a way to somehow boost this would change the picture for the better and make easier some of the trade-offs facing the Chancellor. And it could be that the OBR takes a more optimistic view of the outlook for growth than Citi does.
The degree to which higher growth would reduce the scale of fiscal tightening needed to stabilise debt is presented in Figure 3.15. Each line shows the trade-off between tax rises and cuts to working-age benefit or state pension spending (on the vertical axis) against the required percentage cut to public service spending (on the horizontal axis), relative to current plans, that would be required to stabilise public sector net debt in the final year of the forecast horizon. Under our central forecast, a fiscal tightening of £62 billion would be required in the final year of the forecast horizon. This could be done by a combination of tax rises and cuts to working-age benefit spending of this amount; or it could be done through an 11% cut to spending on public services and no change to taxation or social security policy. This is shown by the outermost line in Figure 3.15 and would lead to debt being stabilised at 95% of national income.
Figure 3.15. Trade-off between changes to taxes/benefits and to public service spending in order to have debt falling in 2026–27 under our central forecast
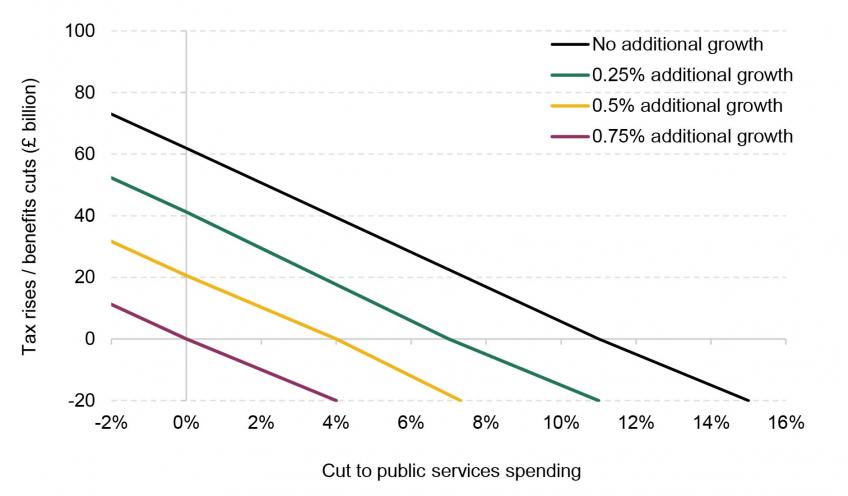
Note: Public service spending is TDEL as planned in the March 2022 Economic and Fiscal Outlook. All £ billion are cash terms. Additional growth is from 2022–23 to 2026–27.
Source: Office for Budget Responsibility, Economic and Fiscal Outlook, March 2022; authors’ calculations.
Higher sustainable growth could make a big difference. Adding 0.75 percentage points to growth would mean that no additional fiscal tightening would be required to have debt stabilised in the final year of the forecast horizon. This is shown by the innermost line in Figure 3.15. Essentially, a combination of higher growth, the erosion of the margin built into the March 2022 forecast, and pushing back the requirement to have debt falling as a share of national income to 2026–27 would be enough to cover the deterioration of the public finances seen since March (including the £43 billion cost of the permanent tax cuts set out in the September ‘mini-Budget’).
To put such an increase in context: on average over the quarter of a century from 1983 to the financial crisis in 2008, the UK economy grew by 2.8% a year, whereas over the 2010s it grew by an average of just 2.0% a year. So the difference between these periods is 0.8% a year. This shows that it might be possible that we get an extra 0.8% a year of growth. But under current policy settings, and current forecasts, it remains more likely than not that we will not. In our judgement, the OBR is unlikely suddenly to become so much more optimistic about the outlook for growth.
The middle lines in Figure 3.15 show scenarios where better growth (of an additional 0.25 and 0.5 percentage points per year) emerge. Such outcomes would be extremely welcome, and perhaps (if one is optimistic) lie within the realms of possibility – certainly more so than a sudden jump in growth of 0.75% a year. But under these scenarios a fiscal tightening of £41 billion (0.25ppt growth increase) or £21 billion (0.5ppt) would still be required to stabilise debt as a share of national income.
Higher growth could emerge through luck. Or it could emerge as a result of a concerted effort across government to deliver supply-side reforms that bring about higher growth. Such an effort would be welcome. But often these policies individually could at best only make very incremental – and very gradual – improvements to sustainable growth. Reducing the main rate of corporation tax and abolishing the health and social care levy are examples of where the impact on growth might well be positive, but relative to the overall size of the economy it could only be small.
A government serious about boosting growth would implement reforms across tax policy, liberalise planning, improve regulation and competition policy, refine immigration policy, enhance trade opportunities, and increase investment in education and infrastructure. In some areas – most obviously tax policy and planning – it would mean implementing reforms that previous governments have shied away from. Even if the government intends to do better than its predecessors, that does not necessarily mean the reforms will actually follow or that they will be implemented in a way that realises the desired effects. The OBR should continue its longstanding policy of not incorporating speculative improvements in productivity growth into its forecasts until hard evidence of such improvements starts to emerge. For example, in 2011, following a government growth review which announced measures such as changes to the planning system and regulation policy, the OBR sensibly decided that:
Such measures could affect growth. For example, a number of studies point to a link between productivity growth and the operation of planning systems. However, there remains significant uncertainty around the size of these effects. In the event that these measures have an impact on growth, there is likely to be some lag before the effects are realised; the effects will also depend on how the measures are implemented.
As a result, identifying the quantitative impact of such policies may not be possible for some time. Set against this uncertainty, we judge there is insufficient evidence at this stage to adjust our trend growth assumptions in light of these measures. It is also important to bear in mind the considerable uncertainty that surrounds the baseline estimate of trend productivity growth. To make a small and precisely calibrated change to this estimate would involve a spurious degree of precision.
Box 3.1, page 39 of Office for Budget Responsibility (2011)
Despite this, over the subsequent five years it turned out that the OBR had been too optimistic rather than too pessimistic in its forecast of productivity growth. In short: a policy of ‘show, not tell’ remains appropriate.
Would pencilling in a future fiscal tightening be credible?
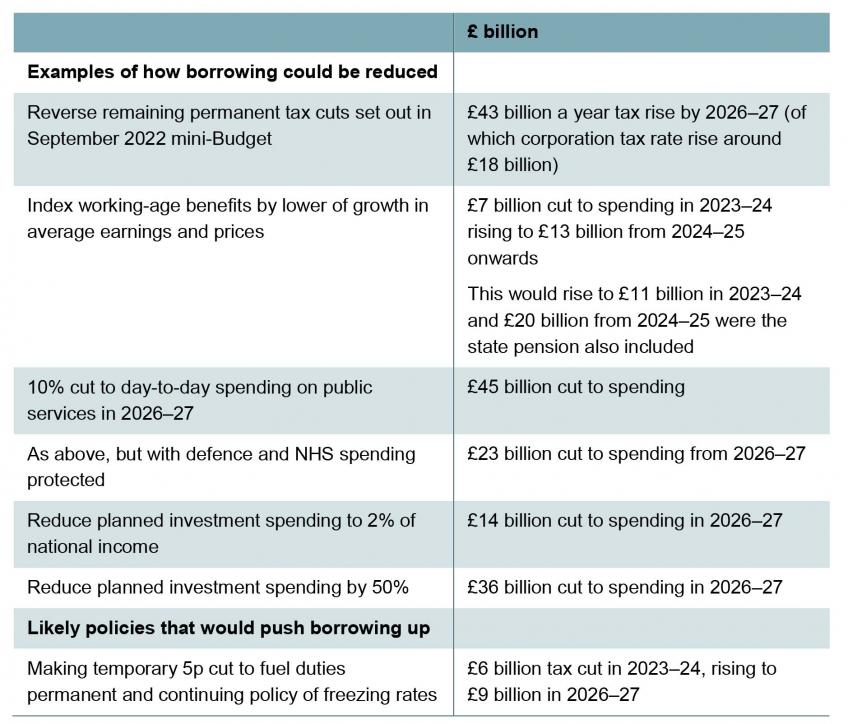
Delivering a fiscal tightening of the size implied above would be far from easy. Absent any improvement in the outlook for growth, a fiscal tightening of £62 billion would, under our central scenario, be required to have debt stabilised at the end of the forecast horizon. To give a sense of how difficult this would be, Table 3.6 provides a costing for some illustrative options. The first is the largest: to reverse all of the remaining permanent tax cuts set out by Mr Kwarteng, which would raise £43 billion. The opposition Labour Party has said that it is opposed to abandoning the planned rise in the main rate of corporation tax. Going ahead with this rise might raise around £18 billion in 2026–27. So were a fiscal tightening of £62 billion required, this would make a sizeable contribution but would still leave some way to go.
A credible plan to restore the health of the public finances could also be rewarded with a lower cost of financing debt. But even if gilt yields and Bank Rate were lower than expected, and this knocked £10 billion off debt interest in every year (the increase in our estimate for 2023–24 between 21 September and today), this would still require a major tightening. There are also areas where further tax cuts are likely: for example, making the 5p cut to fuel duties permanent and then freezing rates in cash terms would reduce revenues in 2026–27 by £9 billion.
A tax-cutting government might be expected to focus instead on measures that reduce spending. After all, the only way to deliver a sustainable cut in the tax burden is to ensure that public spending represents a smaller share of national income. Recent speculation has focused on the possibility of uprating working-age benefits (but notably not the state pension) in April 2023 in line with average earnings (5.5%) rather than prices (10%). This would reduce spending in 2023–24 by £7 billion, with this rising to £13 billion if it were extended to April 2024. Of course, most of these savings would come from the bottom half of the working-age income distribution and it would lead to some of the poorest households in the country seeing a fall in their real incomes. Including the state pension would increase the cut to spending to £11 billion in 2023–24, rising to £20 billion from 2024–25 onwards.
Rather than cuts to benefits (or for that matter increases in personal taxes) which directly hit household incomes, the other alternative would be to implement a fresh squeeze on public service spending. As was set out in Figure 3.15, a £62 billion cut to spending could, in principle, be delivered by an 11% cut to spending on public services in 2026–27.
One option could be to rein back planned investment spending, not least because this is running – and forecast to continue running – at a rate that is high by UK standards of the last 40 years. Cutting back investment spending to 2% of national income would reduce planned spending by £14 billion in 2026–27, while going further and halving planned spending – which would return it to its lowest share of national income since 2001–02 – would reduce spending by £36 billion. Of course it might be difficult to square such a deep cut to investment spending with the government’s stated determination to focus on boosting growth.
Planned day-to-day spending on public services could also be cut. As set out in Table 3.7, a 10% cut would deliver a cut of £45 billion. One area where this would seem particularly unlikely to occur is the NHS. The fact that health services are struggling post-pandemic has been well documented. In addition, while spending plans for 2021–22 and 2022–23 have been topped up to help the NHS deal with post-pandemic pressures, no additional allowance has yet been made for subsequent years (Warner and Zaranko, 2021). On top of this, the large cohort born in the years following the Second World War are reaching ages where they put additional demands on the NHS. Any promise to ‘balance the books’ via large cuts to the NHS budget might, to put it lightly, be looked upon with some doubt.
Table 3.7. Reductions in borrowing from illustrative measures
Source: Office for Budget Responsibility, Economic and Fiscal Outlook (March 2022) and Tax and Spending Ready Reckoners (October 2021); HM Treasury, ‘Fuel duty rates 2022-23’ (policy paper, March 2022); authors’ calculations.
Another area where cuts to spending seem unlikely is the defence budget. The UK is one of the few countries that complies with the NATO commitment to spend at least 2% of national income on defence. The Russian invasion of Ukraine has led to many countries – most notably France and Germany – pledging to increase spending. Following this pattern, Ms Truss has committed to increase defence spending to 3% of national income by 2030 (with an increase from 2% of national income to 3% of national income representing an annual budget increase of £25 billion in today’s terms). Given the intent to deliver such a large budget increase by 2030, it would be odd and inefficient to cut spending in the interim period. Ramping up defence spending from 2% to 3% of GDP between 2024–25 and 2029–30 could require real-terms budget increases well in excess of 10% per year, which could pose efficiency challenges of its own.
Excluding the NHS and defence from public service spending cuts would reduce the scope for savings to come from that source. As set out in Table 3.7, implementing a 10% cut to day-to-day public service spending in 2026–27 and exempting these two public services would reduce the resulting cut to spending to £23 billion (down from £45 billion if these two services were included). And many of these public services saw big cuts to their budgets during the ‘austerity’ years of 2010 to 2019: in particular, spending in areas such as prisons, policing and services provided by local government saw deep real-terms cuts of in excess of 20% over this period.
Delivering big additional cuts in these areas would be far from easy. And finding further efficiencies would be harder still: this would require either the delivery of efficiencies that could not be found or, at least, could not be realised over the period of ‘austerity’ or that new inefficiencies have emerged since. This is not impossible, but like claims that economic growth will be increased, it is easier said than done. It also ignores the fact that departments are already being asked to find efficiencies, just to stay within existing budgets in the face of higher cost pressures (especially from higher-than-budgeted pay awards – see Chapter 4).
Of course a combination of the measures above could – and perhaps most likely would – be deployed. Suppose a £62 billion cut to planned spending in 2026–27 is required. £13 billion could come from indexing working-age benefits to growth in earnings rather than prices in the next two years. A further £14 billion could come from cutting investment spending plans to 2% of national income. The remaining £35 billion could come from a 15% cut to day-to-day spending on public services outside of the NHS and Ministry of Defence budgets. Such spending cuts could be achieved, but would be far from easy.
It is possible that the Chancellor, having extended the time horizon for when debt needs to be falling, chooses to achieve this in the OBR’s forecast by cutting back on planned spending growth in 2025–26 and 2026–27. Since this is beyond the current spending review period, this would not have to affect any of the allocations already made to spending departments, and the Chancellor could avoid specifying where the cuts would fall. But the risk here is obvious. As we put it in last year’s Green Budget, extend fiscal targets forwards ‘too long and governments may have more scope to promise future tax rises or spending cuts that they do not intend – or are perhaps unable – to implement’ (Emmerson and Stockton, 2021). Mr Kwarteng is aware of this concern. Writing in 2012 (with Jonathan Dupont), he critiqued Gordon Brown’s golden rule, describing a situation where ‘spending plans were based on over-optimistic forecasts’ and that forward-looking targets risked an environment where ‘in each new budget the government promised their books would balance tomorrow – but tomorrow never seemed to arrive’ (Dupont and Kwarteng, 2012). We agree.
We need the OBR to do what it can to protect against this scenario. In the past it has tended to accept the Treasury’s planning assumption for spending on public services beyond the current spending review period, and to highlight what this would mean in a historical context and relative to public spending in other comparable advanced countries. It should extend this analysis as far as it can: at the very least, it should compare spending growth in years beyond the spending review settlement in its medium-term forecast with the pressures for additional spending. Notably, this includes spending pressures arising from factors such as changing demographics and net zero commitments that the OBR typically focuses on in its long-term fiscal analyses. Certainly the OBR should be very wary of a promise to cut spending in four or five years’ time without sufficient detail of where the axe would fall.
3.7 Conclusion
Uncertainty around any public finance forecast means that it is always possible that debt will fall as a share of national income. But no Chancellor can claim, as Mr Kwarteng has said he will, that they will ensure debt will fall over a specific future period. A clear lesson from the Global Financial Crisis, the COVID-19 pandemic and the current cost-of-living crisis is that there are emergency periods where government needs to provide temporary support and it is appropriate for debt to rise. Trying to prevent debt from rising during a sharp economic downturn would be wrong and, most likely, futile.
But it is certainly unsustainable for policies to leave debt on a path where it relentlessly grows as a share of national income. And wanting the ability to raise debt when the next sizeable adverse shock hits provides a reason to aim to have debt falling outside of crises. Doing this can open up more ‘fiscal space’, giving greater capacity for the government to step in when it needs to. But being able to realistically expect public sector net debt to fall requires the government – and other forecasters – to form a central view of the outlook for economic growth and what tax and spending policies will actually be pursued.
We should not forget that all this will become harder over the coming decades as the population ages and spending on pensions, health and social care is likely to be forced upwards. If we cannot balance the current budget and get debt under control over the next few years, we will only leave ourselves with an even harder task in the years after that.
While we should hope for better growth, the rationale for an independent OBR is to ensure that politically motivated wishful thinking is not incorporated into economic and fiscal forecasts. The OBR should continue its practice of not incorporating hoped-for growth improvements arising from supply-side reforms until evidence of stronger growth starts to emerge. Saying reforms will happen does not mean they will be legislated, and even if enacted it is still unclear what real change they will deliver. Quite often policies can be likely to boost growth on the margin, but their effects will be very modest.
We also need to avoid the situation Mr Kwarteng wrote about in 2012, when critiquing the performance of the last Labour government, where ‘in each new budget the government promised their books would balance tomorrow – but tomorrow never seemed to arrive’. If the government wishes to turn to spending constraint to finance its recent tax cuts, and still have public sector net debt falling as a share of national income, then that is a valid choice. But cutting spending in areas where such large cuts were made between 2010 and 2019 will not be easy. The NHS is quite clearly already under much strain. Demographic pressures are adding to the demands on both health and social care. And Ms Truss has made a clear commitment to increase spending on defence significantly by 2030. Therefore the OBR should be very wary of a promise to cut spending in four or five years’ time without sufficient detail of where the axe would fall.
Finally, it is not possible to say exactly when fiscal policy becomes unsustainable. It likely is possible to run persistent current budget deficits and have debt growing for a number of years. The rules we have been talking about are rules of thumb, not hard-and-fast economic necessities. But as we have seen in recent weeks, there are constraints that can bite. And it looks as if we are running up against them, perhaps for the first time in a long time. We have seen the warning shots. This would not be the right moment to abandon fiscal discipline. The Chancellor needs to set out a credible path to fiscal sustainability. He has a tough job on his hands.
References
Bell, T., Broome, M., Cominetti, N., Corlett, A., Fry, E., Handscomb, K., Judge, L., Leslie, J., Murphy, L., Shah, K., Slaughter, H., Smith, J., Thwaites, G. and Try, L., 2022. Blowing the budget. Resolution Foundation, Briefing, https://www.resolutionfoundation.org/app/uploads/2022/09/Blowing-the-budget.pdf.
Cornwall Insight, 2022. Energy Price Guarantee – counting the costs. 5 October 2022, https://www.cornwall-insight.com/energy-price-guarantee-counting-the-costs/.
Dupont, J. and Kwarteng, K., 2012. Binding the hands of government – a credible fiscal rule for the UK. Institute of Economic Affairs, Current Controversies Paper 36, https://iea.org.uk/publications/binding-the-hands-of-government-a-credible-fiscal-rule-for-the-uk/.
Emmerson, C. and Stockton, I., 2021. Rewriting the fiscal rules. In C. Emmerson, P. Johnson and B. Zaranko (eds), The IFS Green Budget: October 2021, https://ifs.org.uk/books/rewriting-fiscal-rules.
Emmerson, C. and Stockton, I., 2022. Reversing NICs and corporation tax rises would leave debt on an unsustainable path. Institute for Fiscal Studies, Report, https://ifs.org.uk/publications/reversing-nics-and-corporation-tax-rises-would-leave-debt-unsustainable-path.
HM Treasury, 2020. The Balance Sheet Review Report: improving public sector balance sheet management. https://www.gov.uk/government/publications/the-balance-sheet-review-report-improving-public-sector-balance-sheet-management.
HM Treasury, 2022a. Charter for Budget Responsibility: Autumn 2021 update. https://obr.uk/docs/dlm_uploads/Charter_for_Budget_Responsibility_FINAL.pdf.
HM Treasury, 2022b. The Growth Plan 2022. https://www.gov.uk/government/topical-events/the-growth-plan.
Office for Budget Responsibility, 2011. Economic and fiscal outlook – March 2011. https://obr.uk/efo/economic-and-fiscal-outlook-march-2011/.
Office for Budget Responsibility, 2021. Tax and spending ready reckoners, October 2021. https://obr.uk/monthly-profiles-and-ready-reckoners/.
Office for Budget Responsibility, 2022. Economic and fiscal outlook – March 2022. https://obr.uk/efo/economic-and-fiscal-outlook-march-2022/.
Warner, M. and Zaranko, B., 2021. Pressures on the NHS. In C. Emmerson, P. Johnson and B. Zaranko (eds), The IFS Green Budget: October 2021, https://ifs.org.uk/books/pressures-nhs.
Endnotes
Authors


Isabel Stockton
Isabel works in the Healthcare sector, and on the public finances. Their research focuses on retaining and developing the NHS workforce.
More from IFS
Understand this issue


Policy analysis


Academic research


