
Downloads
Global economic outlook: heading for a fall?
PDF | 340.68 KB
Key findings
1. This year’s global economic outlook is far less rosy than in 2021. We expect the global economy to grow by 2.9% this year and 2.5% next year, both well below the long-run average of 3%. Europe, in the short term, and the US, later in 2023, are likely heading for recession.
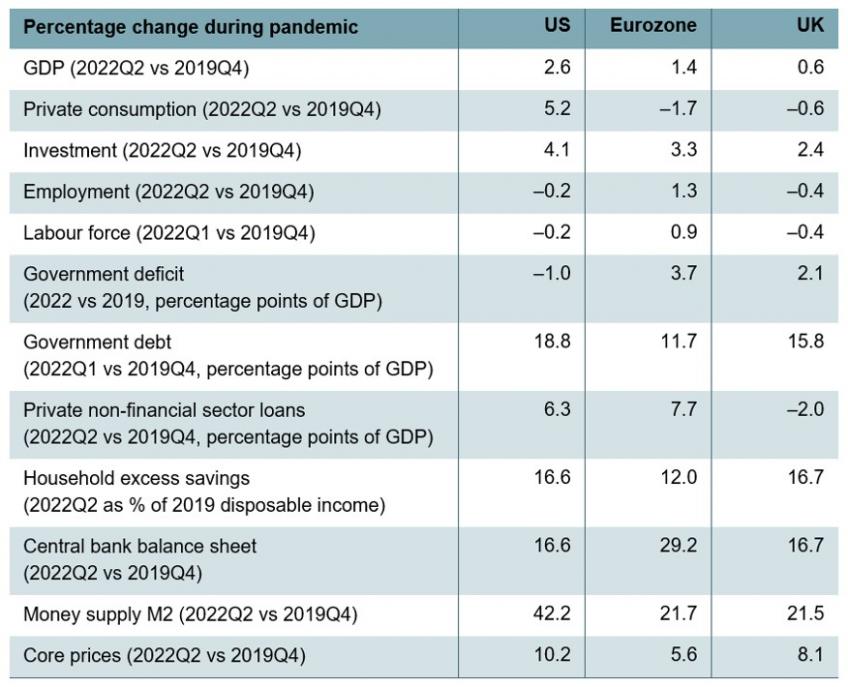
2. Post-pandemic supply–demand imbalances have proved more severe and persistent than expected. Indicators of supply chain disruption such as shipping prices have declined, but not normalised. Expansive government policies have driven up public debt ratios by up to 20% of GDP and boosted money supply by 20–40%. Even leaving aside volatile food and energy prices, where, in our view, idiosyncratic shifts in supply and demand dominate, the ranking of the rises in core prices in the US, the UK and the Eurozone between 2019Q4 and 2022Q2 by 4%, 3% and 2% annualised, respectively, mirrors the ranking of the fiscal and monetary expansions.
3. The war in Ukraine and the stand-off with Russia have aggravated the inflation crisis by eliminating 40% of the EU’s gas supply, triggering a severe energy crisis in most of Europe. The increase in gas prices alone is imposing a burden of up to 8% of GDP on European households and firms. European gas prices peaked at double Asian rates and 10 times the US’s. This price shock is likely to trigger a recession, but also lead to structural changes in the European economy, weighing on growth for many years.
4. The Ukraine conflict also raises questions about the West’s reliance on China. Reducing dependence on the 22% of EU goods imports coming from China, including even higher shares for technology and consumer goods imports, may be an even greater challenge than reducing dependence on Russian energy. And unlike Russia, China remains tempting as an export market, absorbing 10% of EU exports and growing at triple the rate of overall exports. Improved resilience of supply chains may come at the cost of a permanent reduction in expected economic potential.
5. The series of supply shocks has driven global inflation to 7% this year. Recession, as well as base effects in energy and the gradual unwinding of supply chain disruptions, will likely bring inflation below 6% in 2023 and to 3.5% in 2024. But even that is still above the 3% long-run average. Inflation in energy and goods prices is being replaced by inflation in the price of food and services. High inflation looks set to stay and should trigger further significant interest rate hikes from central banks.
6. Governments can arguably be more effective in fighting inflation than central banks. They can invest and deregulate to boost energy supply and unclog supply chains, but also reduce demand by fostering industrial adaptation. Many are acting to preserve supply by guaranteeing loans or nationalising critical energy infrastructure, but also by supporting demand with tax cuts and subsidies. In the EU, fiscal measures related to the crisis amount to 3–4% of GDP already and are expanding rapidly. While direct interventions in energy prices have lowered measured inflation rates by 3 percentage points, some measures cause inflation elsewhere or in the future.
7. However, fiscal policy has to tread a fine line, as it can also distort incentives to save energy and raise the risk of blackouts as well as lower long-term incentives for the economy to adjust to potentially permanently higher energy prices and less efficient supply chains. So far, finance ministers are enjoying a tax revenue bonanza due to high inflation, but as they expand their support, risks to debt sustainability will grow and limit fiscal space, forcing hard choices.
1.1 Introduction
New shocks threaten to cut post-pandemic recovery short
In the 2021 Green Budget, we painted quite a rosy outlook for the global economy. Successful vaccination programmes as well as a shift in strategy away from containing the pandemic to living with the pandemic had reduced the threat of health restrictions. We expected strong growth in all regions of the world for the rest of 2021 and 2022 as economies reopened and households deployed the savings accumulated during the pandemic. It would take some time to restore global supply chains and inflation was expected to remain high and volatile (Citi’s global inflation forecast for 2021 was 3.2% and for 2022 3.0%, close to the long-term average of 3%) but we thought central banks would patiently look through the inflation spike and only tighten monetary policy gradually. Strong growth and gradually rising borrowing costs would then also allow governments to normalise fiscal policy without the premature and sometimes excessive tightening seen after the global financial crisis in 2008–09.
Indeed this picture broadly played out in the second half of 2021. Our growth projections for 2021 proved largely correct (see Table 1.1). Economies gradually reopened and the gaps between post-pandemic recoveries narrowed. By Summer 2022, Europe’s GDP recovery had nearly caught up with that of the US (see Figure 1.1). However, especially in the US, the recovery may have been too fast for its own good. Turbocharged by the extremely generous post-election fiscal stimulus, the American economy began overheating to which, with hindsight, the Fed may have reacted too late. To be sure, the market partly did the tightening for the Fed. Longer-term government and corporate borrowing costs started rising sharply well before central banks started hiking short-term policy rates, as investors priced in expected rate hikes early on. As a result, the US dollar strengthened against most other currencies and exported the US inflation problem to the rest of the world.
Table 1.1. Real GDP growth forecasts, Green Budget 2022 and Green Budget 2021
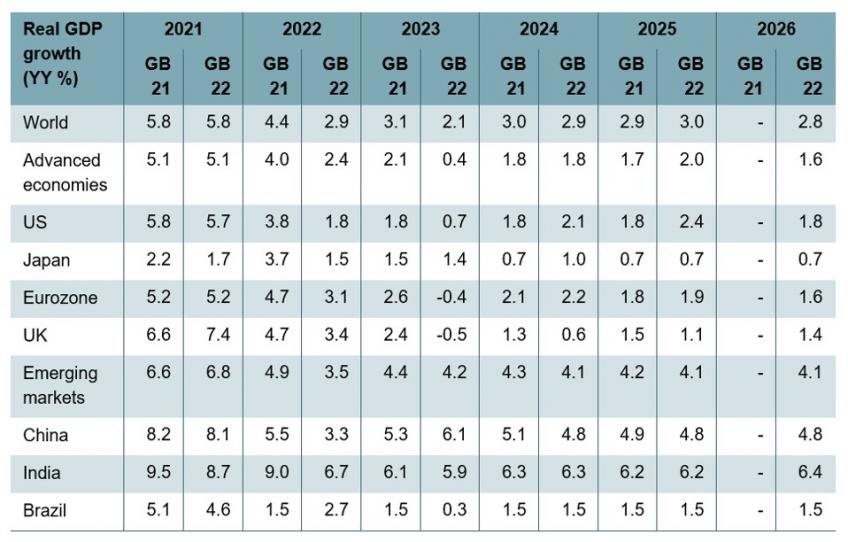
Source: IFS Green Budget 2021, and Citi Research forecasts as of 21 September 2022.
Figure 1.1. US, UK and Eurozone: real GDP
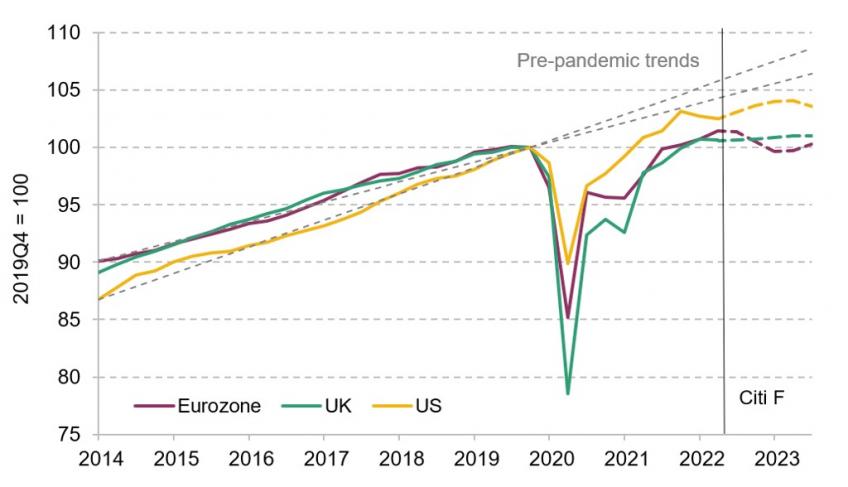
Source: BEA, ONS, Eurostat and Citi Research.
In these already challenging circumstances, a new and major speed bump appeared in the form of the conflict in Ukraine. With the West sanctioning some Russian energy exports and Russia cutting the rest, energy prices in general, and natural gas prices in Europe in particular, surged to extreme levels. This ‘tax’ on the economy is starting to take its toll on household real income and confidence. Europe looks set for a potentially deep recession. This will eventually probably reduce (and potentially eliminate) Europe’s inflation problem, leaving less for monetary policy to do. In the US, however, monetary tightening will likely have to go a lot further to restore the balance between supply and demand in the labour market and bring inflation under control. While potentially strengthening the dollar further, that will probably also imply a recession, albeit a milder and later one than in Europe.
As a result of aggressive monetary policy tightening and the consequences of the Ukraine conflict, our forecasts in the Green Budget for this year and next look a lot weaker than last year. We expect the global economy to grow by merely 2.9%, despite the reopening of many economies, in 2022 and 2.1% in 2023 despite a strong performance by China, both below the long-run trend of 3% per year. Among advanced economies, we still expect fairly stable GDP growth rates in the US (1.8% in 2022 and 0.7% in 2023), while Eurozone growth may fall from 3.1% this year to –0.4% in 2023. This sharp slowdown in the industrialised West should be mirrored in most emerging markets, with one major exception. In China, we expect an end of COVID-19 restrictions paired with significant stimulus to boost growth from just 3.3% in 2022 to 6.1% in 2023. Without this idiosyncratic Chinese cycle, global economic growth could fall below 2% and thus into global recession territory.
1.2 The pandemic has left big imbalances
In the last two years, the global pandemic outlook was a key driver of macroeconomic forecasts. At the time of the 2020 Green Budget, the first wave had just passed, raising hopes that the worst might be over – a view which unfortunately proved premature. In the summer of 2021, the pandemic was not over, but western governments had made much progress with their vaccination programmes, raising hopes that inevitable future waves would no longer have the impact on mobility and the economy. Indeed, while case number have remained high, the death toll is now much lower (see Figure 1.2).
Improved health outcomes have allowed governments to phase out social distancing measures and travel restrictions. Oxford University’s health restrictions stringency index has dropped sharply as the US, the UK and continental Europe reopened international travel, domestic hospitality and public transportation (see Figure 1.3). Meanwhile, the remaining restrictions – for example, face masks in public transportation or test or vaccination requirements in international travel – no longer do much harm to economic activity.
Figure 1.2. US, UK and Eurozone: deaths related to COVID-19
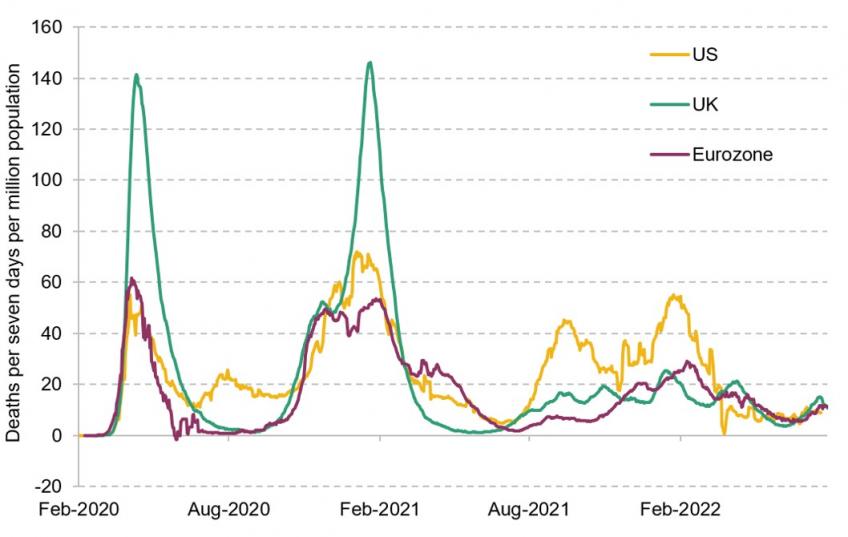
Source: Johns Hopkins and Citi Research.
Figure 1.3. US, UK and Euro-3: health restrictions
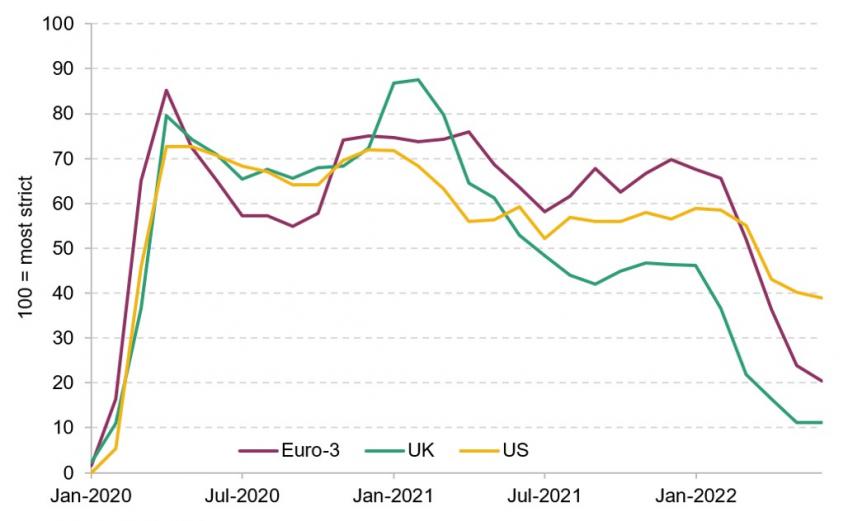
Note: Euro-3 = average of Germany, France and Italy.
Source: Johns Hopkins and Citi Research.
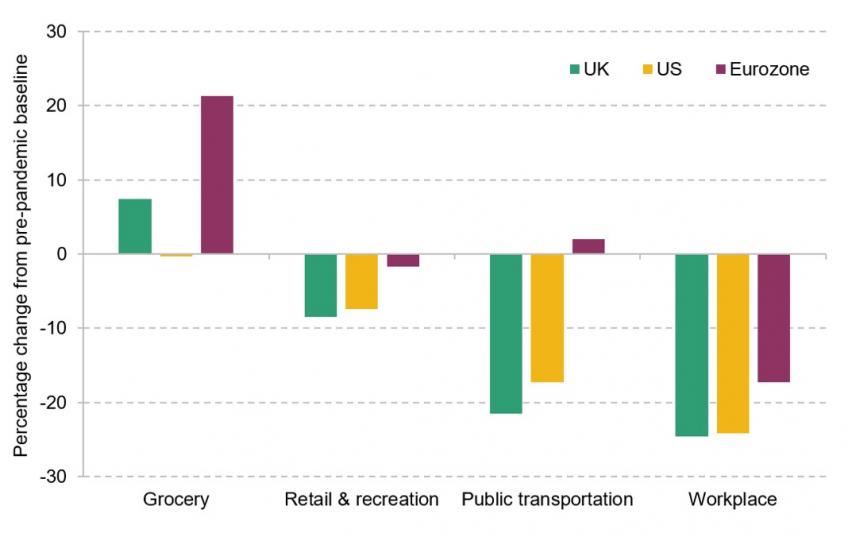
Figure 1.4. US, UK and Eurozone: Google mobility
Source: Google and Citi Research.
The lifting of restrictions, but also the much-reduced risk of serious illness, triggered a normalisation of households’ work and leisure behaviour. Mobility data taken from Google Android phones suggest a rebound in activity across western economies. However, mobility data also point to potentially more-lasting shifts in economic behaviour. For example, while Android users in the UK, the US and continental Europe could be found grocery shopping and enjoying leisure activities in similar frequencies to those pre-pandemic, they were far less present at their workplaces or in transit to work, especially so in the US and the UK (see Figure 1.4). It may be that working from home has made an irreversible breakthrough during the pandemic, but this could of course also reflect other factors, such as fewer working hours for health reasons or due to increased parental care for children, for example.1
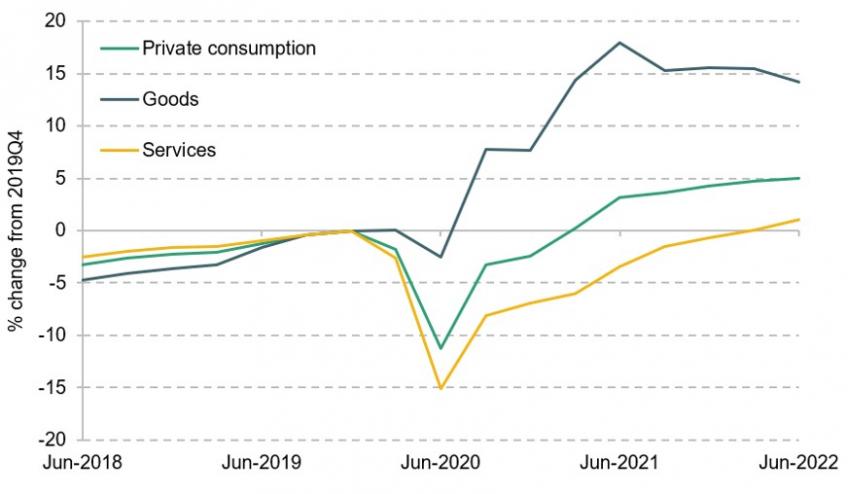
Figure 1.5. US and Eurozone: real private consumption
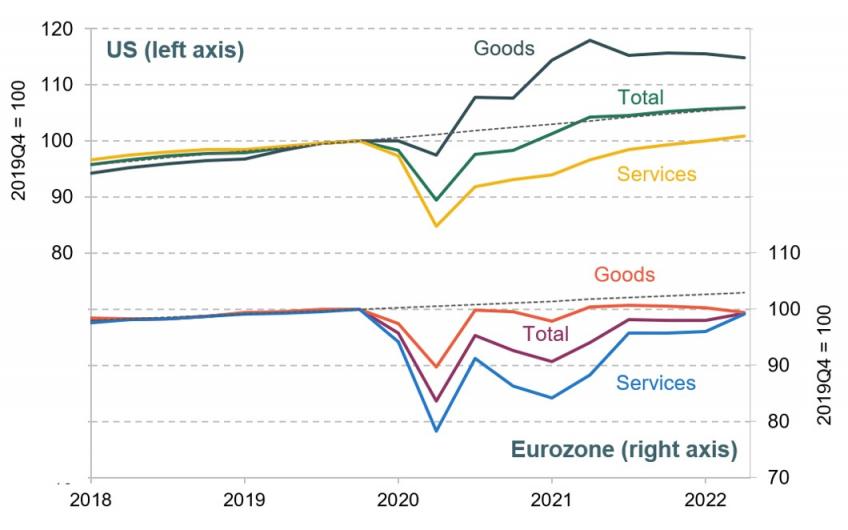
Source: BEA, Eurostat and Citi Research.
Besides lasting changes to where we spend our time, economic data also suggest that how much and what we consume has not fully normalised (yet), especially in the US. In Europe, private consumption remains well below trend, but the mix of goods and services consumption has normalised to roughly the pre-pandemic half-and-half split. In the US, in contrast, the consumption-friendly fiscal stimulus during the pandemic pushed real private consumption back to its pre-pandemic trend much earlier. However, while goods consumption remains far above the pre-pandemic trend (see Figure 1.5) even after the expiry of stimulus checks and beefed-up unemployment benefits, the share of services consumption has fallen from 65% pre-pandemic to 60% by the summer of 2022. Services consumption is no closer to trend than in Europe, suggesting the consumer rotation still has a long way to run.
Longer-lasting or even permanent changes in economic behaviour due to the pandemic may be one explanation why the US, EU and UK economies all remain somewhat off their pre-pandemic trend (see Figure 1.1), although temporary factors such as disrupted supply chains, a lack of investment or shifts in the labour force probably play a larger role.
Which brings us to a topic which already took up plenty of last year’s global outlook chapter in the Green Budget, namely supply chain disruption. Clearly, supply chain disruptions have proved more persistent than we expected last year. In part this is due to the impact of health restrictions in countries pursuing ‘zero COVID strategies’ such as China, which also happen to be the manufacturing hubs and thus goods suppliers of the world. In part it is also new disruptions triggered by the Ukraine conflict and high energy prices, which we discuss further below. For example, the Harper Petersen container ship charter rate index is still at the extraordinarily high levels it reached last year. In Europe, the energy crisis seems to be particularly holding back manufacturing production, with firms slowing production to save energy. The gap between manufacturing orders and production in Germany has hardly declined since last year (see Figure 1.6).
Figure 1.6. Germany: factory orders and industrial production
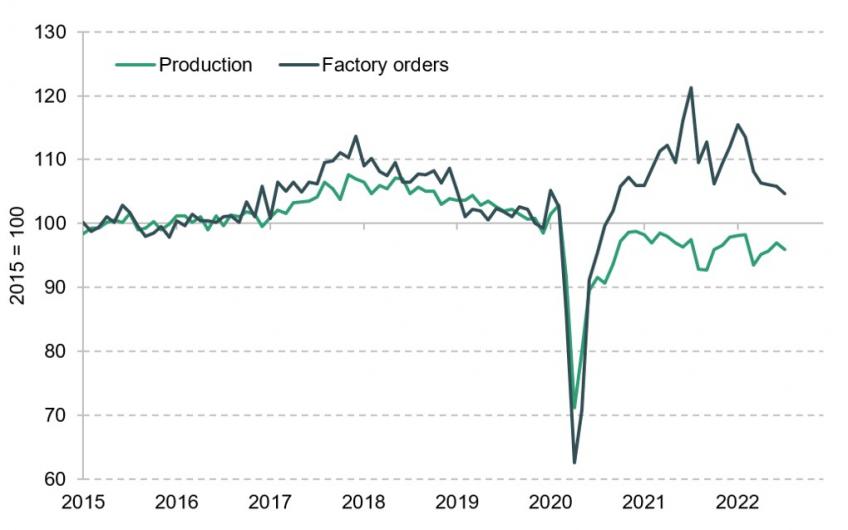
Source: Destatis and Citi Research.
Figure 1.7. Global: supply chain disruption measures
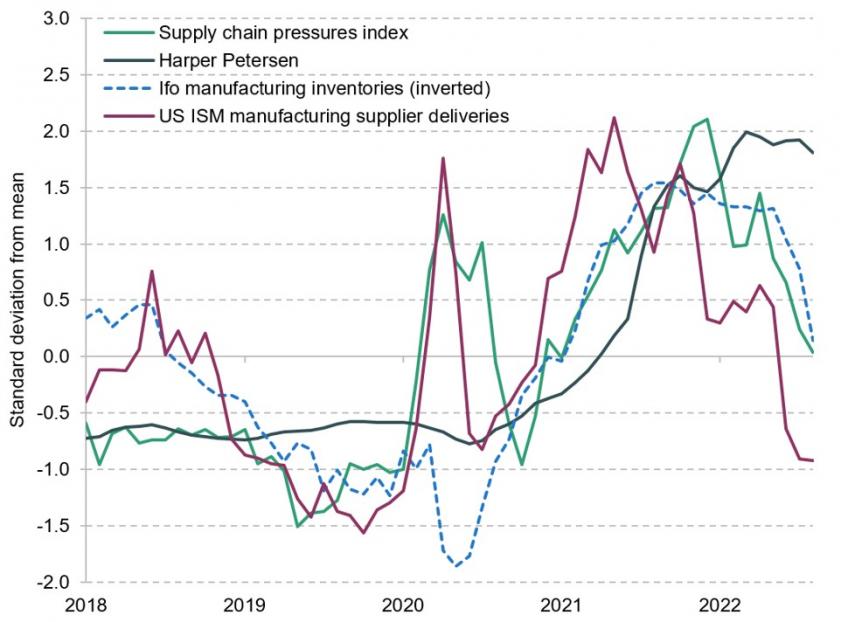
Source: Harper Petersen, NY Fed, Ifo and Citi Research.
However, overall, there are significant signs that some supply chain pressures are easing, albeit not yet to pre-pandemic levels (Figure 1.7). Outside container shipping, freight prices have fallen sharply from their 2021 peaks. Manufacturers as well as traders are reporting shortening supplier lead times and growing inventories. In some industries, such as US discretionary retailers, even excess inventories are building up.
Part of the normalisation is probably also due to the aforementioned gradual rotation of consumer demand from goods back to services. That has meant that shortages have migrated from goods to the labour market. Unemployment rates have fallen to or below pre-pandemic levels, with the US unemployment rate in August 2022 at 3.7% (same as the 2019 average of 3.7%), the UK at 3.6% in July (down from 3.8% in 2019) and the Eurozone at 6.6% (down from 7.6%). Nominal wage growth has picked up sharply, at least in the UK and the US (see Figure 1.8).
Figure 1.8. US, UK and Eurozone: wage growtha
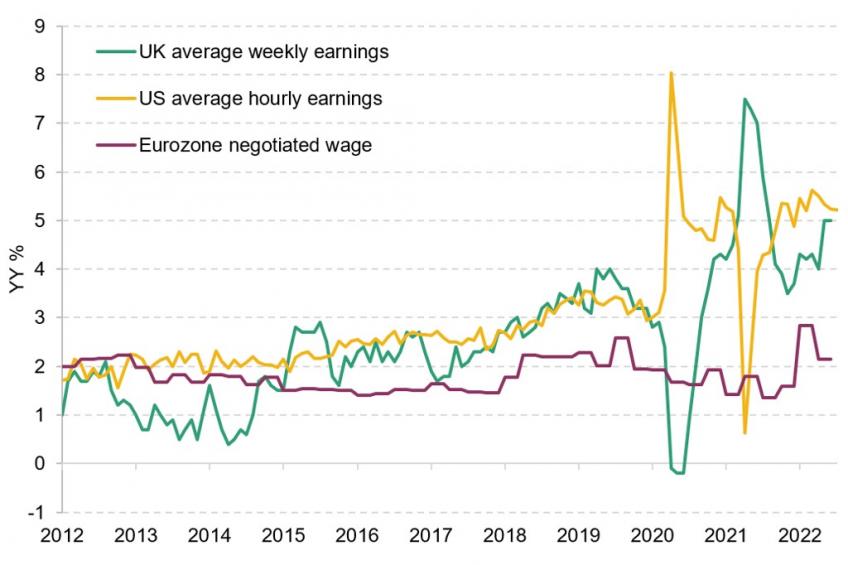
Source: BEA, ONS, Eurostat and Citi Research.
However, labour shortages and wage pressures are not just driven by rebounding demand for services (see Figure 1.5). With GDP and thus aggregate demand still below pre-pandemic trend levels, a lack of labour supply has emerged, too, especially in the US and the UK. In those two economies, the labour force in 2022Q1 was still smaller than in 2019Q4 (Table 1.2). In the Eurozone, the labour force was 1% larger than before the pandemic but still smaller than pre-pandemic trends would have suggested. Among the reasons for the shrinkage in the pool of available workers are lower immigration and increased prevalence of early retirements (Citigroup, 2022). These should normalise – and potentially at an accelerated pace given the wage gains and heightened inflation – and ease tightness eventually as more people return to the labour force. In the UK, there is some evidence of this normalisation already (see Chapter 2).
Table 1.2. US, UK and Eurozone: overview of post-pandemic data
Source: BEA, ONS, Eurostat, Federal Reserve, BoE, ECB, BIS and Citi Research.
Another consequence of the pandemic is the increase in public and, mostly, private debt. Governments borrowed to support the economy, firms borrowed to offset the shock to their incomes, households leveraged their savings to purchase larger homes for teleworking, for example. Non-financial private sector loans-to-GDP increased by 6.3 percentage points in the US and by 7.7ppt in the Eurozone between 2019Q4 and 2022Q2, for example, with around 2ppt in each case coming from households and the rest from corporates. Note that the UK is an outlier because debt in the corporate sector actually shrank by around 3% of GDP between 2019Q4 and 2022Q2.
Households overall still sit on their post-pandemic savings, accumulated because incomes rose and spending fell during the lockdowns. While in the US households clearly started to spend some of their savings as expenditure has risen substantially more above pre-pandemic levels than incomes, European households were still hanging on to pandemic-era excess savings worth around 12% of one year’s disposable income by 2022Q2.
Figure 1.9. Selected economies: change in household gross savings
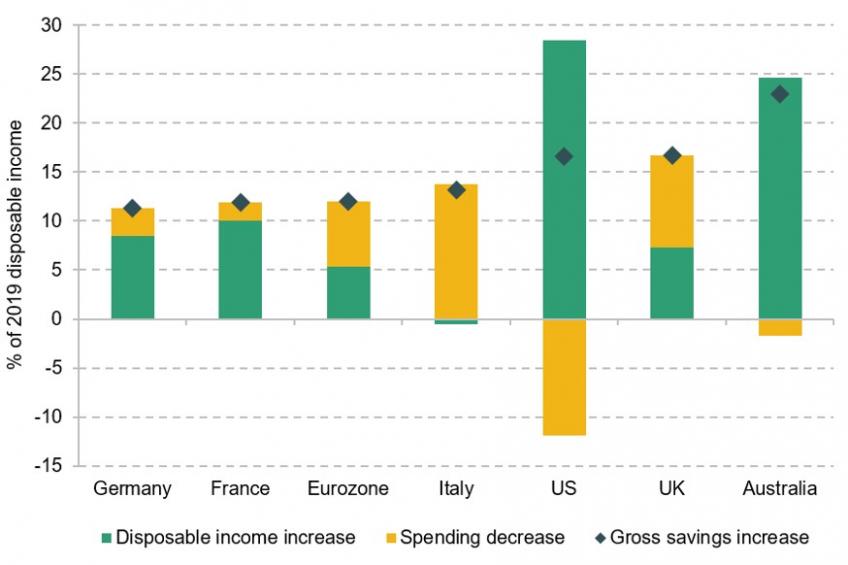
Note: Cumulative change in quarterly savings compared with the 2018–19 quarterly average, as a percentage of 2019 disposable household income.
Source: National statistical offices and Citi Research.
The rise in private debt is modest compared with the debt expansion on the government side. Appropriately, governments borrowed to help tide the economy over the lockdowns and health restrictions, funding furloughing programmes, guaranteeing bank loans, supporting household incomes, and of course also expanding healthcare and purchasing vaccines. On the IMF World Economic Outlook’s methodology, the US general government deficit was 14.5% of GDP in 2020 and 10.7% of GDP in 2021. In the UK, deficits were not much smaller at 12.8% of GDP and 8.0% of GDP respectively, while in the Eurozone they were 7.2% of GDP and 5.5% of GDP. By coincidence, the order of magnitude of these deficits was almost identical to those in 2009 and 2010, in the aftermath of the global financial crisis. Now as then, continental Europe proved most frugal, which could be one of the reasons for the growth underperformance.
As a result, government debt ratios rose sharply, by 19% of GDP in the US (to 121% of GDP, Federal Reserve data) between 2019Q4 and 2022Q1, by 16% of GDP in the UK (to 100% of GDP, ONS data) and by 12% of GDP in the Eurozone (to 96% of GDP, Eurostat data). For the current year, the IMF in its July 2022 World Economic Outlook was predicting similar deficits for the US, the UK and the Eurozone of 4–5% of GDP, which would be an improvement of 1% of GDP compared with pre-pandemic levels for the US, but deteriorations of 2% of GDP for the UK and 4% of GDP for the Eurozone, which had a nearly balanced budget before the pandemic. Given inflation is pushing up government revenue, but also expenditure – aggravated by the growing number of measures to support the economy with the energy crisis – these forecasts are obviously subject to major uncertainty.
These rises in government debt may not have been possible without the determined interventions of central banks, which acknowledged the interdependence of monetary and fiscal policy in delivering price stability in the circumstances. Large-scale bond purchase programmes inflated the balance sheets of the Federal Reserve and the Bank of England by 17% of GDP each between 2019Q4 and 2022Q2, and the ECB’s by an even larger 29% of GDP. Monetary–fiscal coordination meant that, unlike during previous episodes of quantitative easing in the aftermath of the financial crisis, not just central bank balance sheets but also broader money supply rose, in the Eurozone and the UK by just over 20% between 2019Q4 and 2022Q2, and in the US by more than 40%.
This monetary–fiscal expansion, in combination with supply shortages, also drove up prices. Leaving aside volatile food and energy prices, where in our view idiosyncratic shifts in supply and demand dominated, the ranking of the rises in core prices in the US, the UK and the Eurozone between 2019Q4 and 2022Q2 by 4%, 3% and 2% annualised, respectively, mirrors the ranking of the fiscal and monetary expansions. Thus we would argue that the current bout of high inflation in the US is driven to a far greater degree by demand supported by aggressive policy action than in Europe.
1.3 Geopolitics returns with a vengeance
Russia’s invasion of Ukraine has caused a shock to Europe’s energy supply, confidence and trade. Geopolitical tensions and events are always a source of macroeconomic risk, which often transmit via commodity prices. The current crisis reinforces the trend to shorter, more resilient, supply chains and more diversified, less external-dependent energy generation. Governments are supporting households and business with the adjustment. However, weaning western economies off Russian energy and possibly Chinese technology will likely cause a deep recession in the near term. The recovery should be protracted with volatile, but on average potentially sub-par, growth and equally volatile, likely higher, inflation.
The consequences of Russia’s invasion of Ukraine
Geopolitical events can affect global macroeconomic forecasts both via supply-side effects (such as less certain supply of commodities or disruptions to supply chains) and via demand-side effects (such as export sanctions or increased uncertainty weighing on investment and consumption). However, usually these effects are temporary. The impact often fades as global news headlines move to the next story, even if the underlying conflict is not resolved. This was true, for example, of the annexation of Crimea in 2014. Economic sentiment was temporarily dented, and trade relations between Russia and the West changed permanently, but since overall Russia is a relatively small trade partner for the EU, the UK or the US, it is hard to argue that there was a permanent shift in Europe’s economic potential.
The current conflict in Ukraine and the western response to it are on a different scale from 2014. Even if we cannot rule out that it will eventually fade from the headlines – or even cool down on the ground – in the next few years the impact on the European and global economy is likely to be much larger and longer-lasting. While the shock to business and consumer confidence and the impact of sanctions on trade certainly play a role, the main long-term impact is the change in Europe’s energy mix it is forcing.
Europe faces a major challenge in reducing its dependence on its hitherto largest supplier of fossil fuels. In 2021, Russia supplied 40% of the EU’s natural gas, 46% of its coal and 27% of its oil, according to EU Commission data (and supplied the UK 4%, 27% and 9%, respectively (Bolton, 2022)). Even though the share of fossil fuels in electricity generation in the EU has fallen from 49% in 2010 to 36% in 2020 according to Eurostat, the overall share of fossil fuels in energy remains much higher. As most of transport and home heating, for example, is still fossil-based, the share of fossil fuels in EU gross available energy fell from 80% in 2000 to 71% in 2019, and from 89% to 80% in the UK.
The war in Ukraine has now undermined the reliability of energy supply from Russia. The EU, the UK and the US have imposed sanctions on Russian oil and coal exports, while Russia has reduced – and by now virtually ended – its gas exports through the Nordstream 1, Yamal and Transgas pipelines to Europe (see Figure 1.10). Even if the conflict were to fade or end, it is highly unlikely that Europe will want to rely on Russian energy again for more than it can replace at short notice.
In principle, Europe should be able to wean itself off parts of Russian energy supply fairly easily. Coal and oil are mostly transported by ship or rail and can be rerouted around the world fairly flexibly. Thus, the EU was able to ban direct imports from Russia in August 2022 and buy from other producers instead, while Russia can replace the missing supply in countries that have not sanctioned Russian exports, such as China and India. Thus, global trade flows for crude oil or coal will probably look different, but without a major and lasting impact on price differences between Europe and the rest of the world.
Figure 1.10. Germany: pipeline gas inflow from Russia
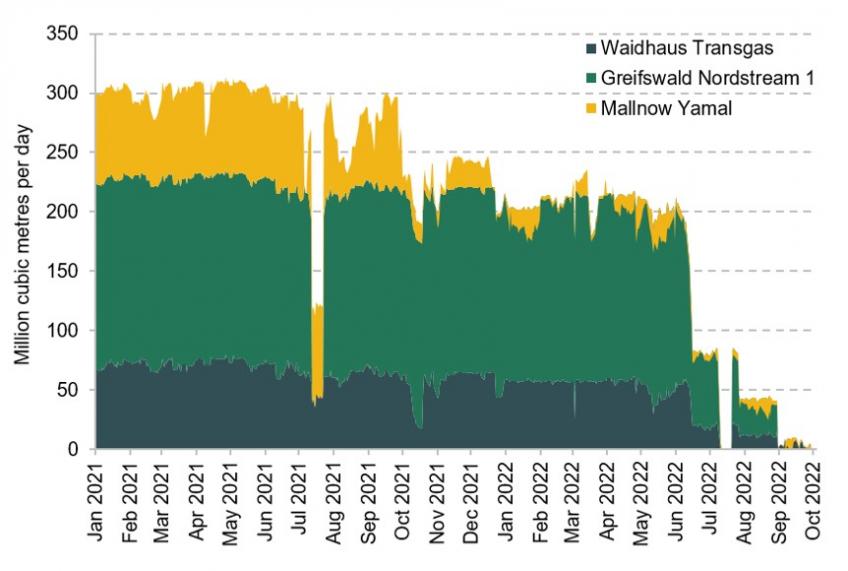
Source: Bloomberg and Citi Research.
Figure 1.11. World: share of natural gas reserves
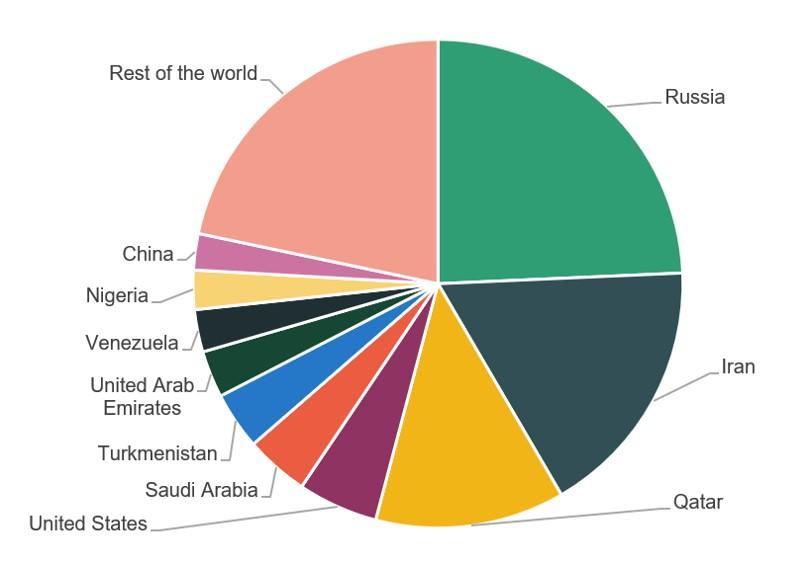
Source: WorldoMeter and Citi Research.
Natural gas, in contrast, is transported from Western Russian fields to Western Europe via thousands of kilometres of pipelines. Pipeline gas also arrives in Europe from other producers such as Norway, Algeria and Azerbaijan, but these are comparatively small. While Russia accounts for 24% of global gas reserves, Europe’s other pipeline suppliers’ reserves account for less than 5% combined (Figure 1.11). Most other large gas suppliers are out of viable reach for pipelines, either because of distance or the volatility of the regions they would pass through. As a result, Europe will have to either reduce its consumption of gas or switch a greater share of supply to liquefied natural gas (LNG) transported by ship.
The switch from cheap Russian pipeline gas to LNG will require major investments into infrastructure, both terminals and new pipelines. It will also likely be permanently more expensive. Wholesale gas prices in Japan, which relies entirely on LNG, have on average been 30% higher than in Europe before the pandemic. However, a 30% higher gas price in Europe compared with 2019 would mean a price of around €18 per MWh, which would still be 90% lower than at the moment. This could be the scenario for 2024, when Germany, the most Russia-dependent gas consumer, expects – at the earliest – to be independent of Russian gas, according to its economy ministry.
Figure 1.12. Europe, US and Japan: wholesale natural gas prices
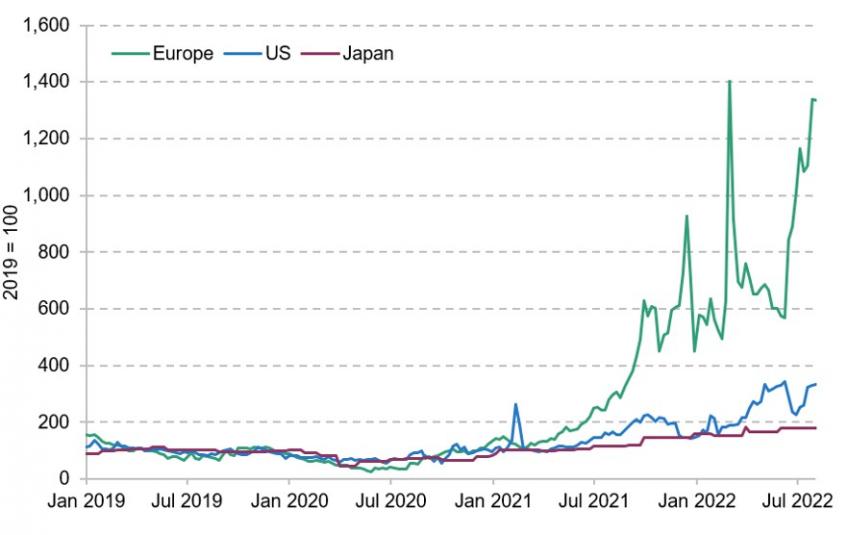
Source: Bloomberg and Citi Research.
In the meantime, gas will remain in short supply in Europe, with potentially devastating effects. The price of gas per MWh on the benchmark TTF exchange in the Netherlands has risen from an average of €14.55 in 2019 to around €300 this summer. If all natural gas was purchased at the spot prices of late August, then the cost of the 2019 level of natural gas consumption in the EU would have risen from €62 billion (0.4% of GDP) in 2019 to €1.2 trillion (8.4% of GDP) in 2022. While clearly not all gas is paid at spot prices due to long-term contracts (and a price rise of this magnitude would lead to lower demand), the shift in European trade balances (see Figure 1.13) confirms the order of magnitude of the shock, at least in combination with other commodity price and foreign exchange shifts.
Figure 1.13. EU and Germany: goods trade balance
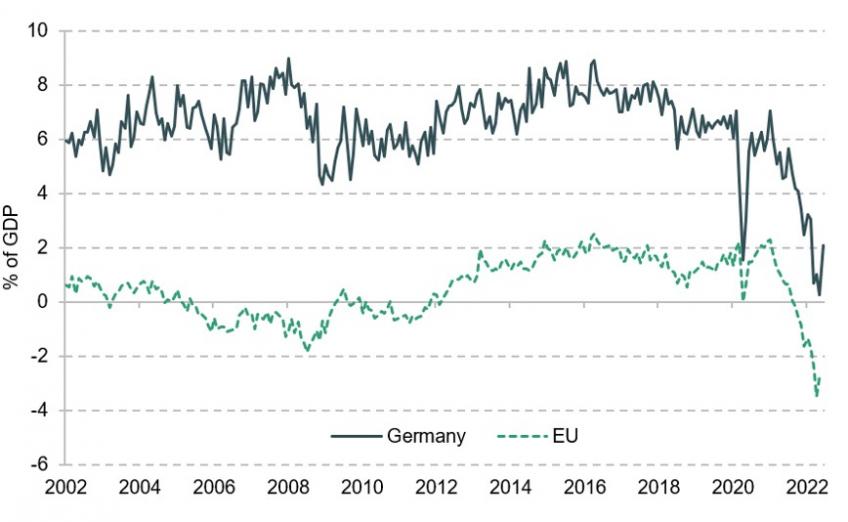
Source: Eurostat, Bundesbank and Citi Research.
Besides being a drag on the domestic economy, high gas prices also affect Europe’s competitiveness in global markets. While in Europe natural gas prices have risen more than tenfold, the US benchmark gas price Henry Hub has risen around threefold since 2019, and in Japan LNG prices have merely doubled in the same period. Partly as a result, energy producer prices have risen far less in the US or Japan than in Europe (see Figure 1.12). This means manufacturers are unable to pass on the cost to their global customers and have to take the hit in their margins. Energy-intensive manufacturers are likely to shut down or move production to places with cheaper energy. A July survey of 3,500 firms by the German chamber of commerce found that 4% of firms had already reduced production due to high energy prices, another 4% had started doing so and 8% were planning reductions. In energy-intensive areas such as steel, glass and paper, 32% of firms were considering reductions or had already done so.
Finally, the gas crisis – alongside idiosyncratic problems – is also affecting the European electricity market, because under merit order pricing, the most expensive electricity producers (currently often gas) determine the electricity price for all. Year-ahead wholesale electricity prices in France and Germany rose from around €40/MWh in 2020 to above €1,000 in August 2022. In this way, higher gas prices, which directly affect 2–3% of household consumption (measured by the weight in the HICP basket2 ), also affect electricity prices (another 2–3%). Unlike in the case of gas, the beneficiaries here are not foreign gas producers, but the domestic coal, nuclear or renewables energy firms (and the taxpayer who can tax them). This creates a distributional problem which several governments and the EU, for example, are currently trying to resolve. Countries such as Italy have already imposed windfall taxes, while the EU and Germany are proposing a levy on the electricity producers with low production costs. The EU estimates that capping the wholesale price for these producers at €200/MWh (compared with more than €400/MWh in current wholesale markets) would generate a revenue of €140 billion (1% of GDP) which could then be used to fund investment in new energy sources or alleviate the burden on poorer households or critical firms.
What is next in geopolitics?
With Russian gas exports to Europe already down to virtually zero, the scope for further macroeconomically relevant escalation may seem small. However, relations between the West and Russia are by no means the only source of macroeconomically relevant risk. Relations between the West and China are also increasingly fraught. The US trade wars against China under the Trump administration in 2017–19 may have been dismissed as idiosyncratic. At the time, Europe still pursued its strategy of ‘Wandel durch Handel’ (change through trade), culminating in the EU–China Comprehensive Agreement on Investment (CAI) in late 2020 under Germany’s EU presidency led by then Chancellor Angela Merkel. However, the US’s China strategy has persisted under the Biden administration, while in Europe Merkel’s departure, as well as the exposure of its reliance on China during the pandemic and China’s unclear role in the conflict with Russia, are leading to a shift in stance. The CAI is ‘on ice’, the criticism of China’s human rights records much more vocal and the agenda of ‘strategic sovereignty’ much more in focus. For example, the EU Commission announced a €300 billion ‘Global Gateway’ infrastructure programme in December 2021 to rival China’s Belt and Road strategy.
Deteriorating relations between the West and China could have significant consequences for both the supply and demand side.
- On the supply side, Europe received 22% of its goods imports from China in 2021, including 77% of its toys imports, 50% of its consumer electronics imports and 40% of its nuclear technology imports. Chances are that it will take at least as long to wean Europe off Chinese technology imports as it does to reduce the reliance on Russian gas. Whether this will also be accompanied by similar price hikes will largely depend on whether China will continue to supply in the meantime.
- On the demand side, 10% of Europe’s goods exports go to China. The average annual growth rate over the past decade of goods exports to China was 6% per year, nearly three times that of overall goods exports. The prospect of participating in Chinese demand growth has not just driven investment by western firms in China but also their domestic investment. Chinese growth has been a useful leading indicator of German manufacturing sentiment, which in turn leads business investment over the past decade or so (see Figure 1.14). Greater tensions with China may thus also lower investment in Europe and the US.
Figure 1.14. Germany and China: Li Keqiang index (YY %) and Ifo manufacturing expectations (index)
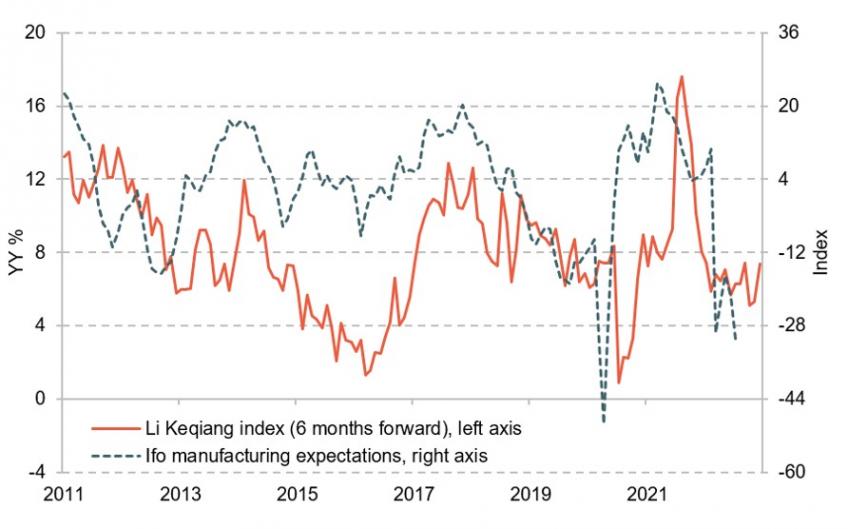
Note: The Li Keqaing index is the average growth rate of loans, electricity consumption and railway freight volumes in China. Germany’s Ifo survey polls around 9,000 German firms monthly on the current state and prospects for their business.
Source: Bloomberg, Ifo and Citi Research.
In sum, Russia’s war in Ukraine may have accelerated a process of disentangling global supply chains as industrialised economies try to improve the resilience of their supply chains. This will require large-scale private and public investment, not to raise capacity and economic potential but simply to maintain it. Improved resilience will likely come at the cost of a permanent reduction in economic potential. During the adjustment, this process could create more temporary shortages and higher prices, weighing on consumption. That investment will be strong in these circumstances is not a given, and certainly not in all parts of the world.
1.4 How will inflation come down?
Inflation in Europe is largely caused by a huge terms-of-trade shock, and could correct itself. In the US, inflation is driven by demand and a wage–price spiral which the Fed will have to break sooner or later. We already forecast both the US and Europe to fall into recession, and a global recession looks increasingly likely.
We currently expect global inflation to average 7.1% in 2022, 5.7% in 2023 and 3.5% in 2024 before converging with the long-run average of 3% in 2025. The series of supply shocks economies are experiencing means that the current spike in inflation is not transitory and will not pass without consequence: we think inflation will fall back, but the price level will not. The decline we expect over the coming years is to a large extent driven by base effects and rebounding supply, but partly also by demand developments. Slower growth and reopening output gaps but also higher central bank interest rates should curb consumer and business spending and constrain governments’ room for discretionary spending. We cannot rule out temporary bouts of low inflation in the coming years due to volatile energy prices or temporary gluts in tradable goods, but other drivers of inflation such as food and services prices are likely to take over the baton. The risks around the future path of inflation are high, in both directions. Here are some of the drivers we see behind falling inflation rates, but also what could go wrong:
Table 1.3. Eurozone: Citi commodity price forecasts, 21 September 2022
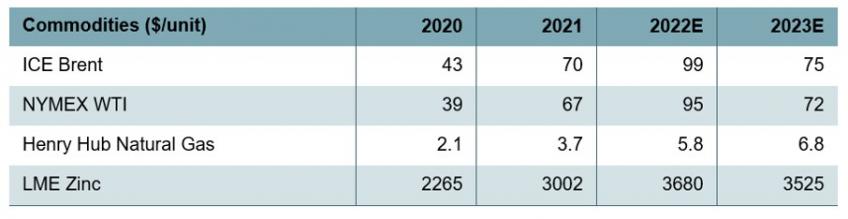
Source: Bloomberg and Citi Research.
- Stabilising, perhaps falling energy prices. Nearly half of global consumer price inflation is currently driven directly by energy, a third in the US and half in the Eurozone and the UK. Rebounding demand for travel and transport services as well as goods production plays a role in this, but the key driver is on the supply side, most notably the Ukraine conflict as discussed above. It is clearly possible that energy prices rise further, but even if they do, the rates of change are likely to slow. Market futures and Citi’s own commodity price forecasts (see Table 1.3) suggest falling energy inflation rates, perhaps even turning significantly negative. This effect on consumer price indices (CPIs) may be aggravated by the fact that statistical offices could raise the weight of energy in CPIs globally, giving falling inflation rates for electricity, gas and oil bigger weights in CPIs. Energy inflation is also partly behind the spike in other parts of consumer price inflation, in particular food but also goods and services prices. With a lag, the rates of price changes in these sectors should also slow. Clearly, these other categories have their own idiosyncratic supply issues.
- Normalising food supply. Food price inflation is also driven by fears over global food supply in the wake of the Ukraine crisis as well as Europe’s drought, for example. Pass-through from food commodity prices to consumer food prices is typically somewhat slower than in the energy sector, which means global food inflation may not have spiked yet. However, rising prices are likely to elicit both a reduction in demand and an increase in supply, and therefore bring falling inflation rates – perhaps even falling prices.
- Unwinding of post-pandemic distortions. As we noted above, some of the supply disruptions cause by the pandemic are starting to unwind, while others continue. There are good reasons to expect non-energy industrial goods inflation to remain high for some time, but overall the trend should be towards lower global inflation rates here. In the services sector, it may take considerably longer for inflation to normalise given some of the post-pandemic distortions may take longer to fix or have not even fully played out yet. However, we do expect high prices to cool the demand for travel and transport services, for example, while strong wage growth and easing health restrictions should entice more workers back into the labour market, alongside resuming international migration. Increasing labour supply should weigh on wage demands and thus ultimately wage growth.
- Government interventions. Multiple EU governments have been trying to help households by subsidising energy consumption. In France, electricity price increases are capped at 4% compared with 2021 until the end of 2022 and gas prices at the October 2021 levels (although both will be raised in 2023). In Germany, the government has phased out a renewables fee on electricity which was 20% of the electricity price in 2021. France and Germany have also temporarily reduced indirect taxes on motor vehicle fuels, and Germany introduced a very cheap temporary train ticket, which reduced the price of combined public transportation tickets by two-thirds in June. Italy reduced network fees and taxes on electricity, while in Spain and Portugal governments ended the benchmarking of electricity prices to the costliest input (currently gas). Adding up the measures, they have reduced inflation rates across Europe by around 3ppt already (see Table 1.4) and more measures are being planned. Clearly, such interventions are not without risk. In economies where gas and electricity are actually scarce, such as Germany or France, the risk is that they lead to blackouts. And where gas and electricity are not scarce directly, such as in Iberia, the interventions risk distorting the single market. Overall, they will raise aggregate demand for energy further and thus ultimately raise, rather than lower, the aggregate cost of energy while preventing adjustment to the long-term challenges on the energy demand as well as supply sides.
Table 1.4. Eurozone: energy crisis government interventions’ impact on inflation
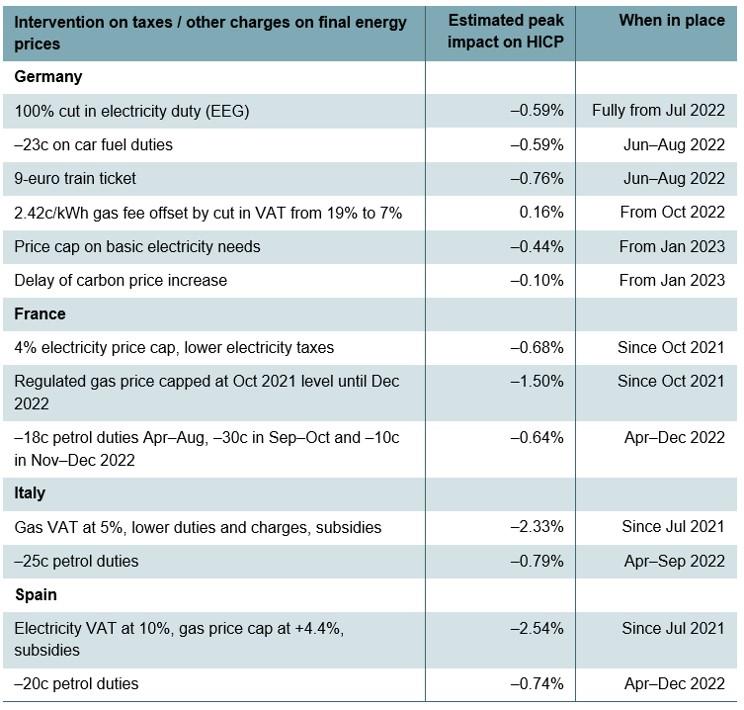
Note: The Harmonised Index of Consumer Prices (HICP) provides comparable consumer price data across the EU.
Source: Citi Research.
Figure 1.15. US: real private consumption
Source: BEA and Citi Research.
It would be misleading to think that inflation is driven solely by the vagaries of geopolitics and the pandemic, and will thus fade once these pass. Demand has been robust enough to allow companies to pass on much of their cost increases to end customers as well. At least in the US, goods demand has been running 10% above its pre-pandemic trend for the last two years. With US non-energy industrial goods inflation running into double digits already in 2021, when in Europe it was still only 2%, this is arguably a sign of excess demand (see Figure 1.15).
Even outside the US, labour markets are tight in many regions of the world despite economies remaining far off their pre-pandemic growth paths. Even if this tightness may prove temporary, it is helping workers to achieve significant wage gains which could also sustain demand (see Figure 1.8) going forward. A low risk of unemployment should also support household confidence and reduce the need for precautionary saving.
We do not expect the demand side to contribute to high inflation for long, however. Especially in Europe, where inflation is almost entirely driven by exogenous shocks so far, inflation is most likely to remain self-correcting. The extreme terms-of-trade shock acts in a similar way to a big tax on the economy, which reduces household real incomes and thus spending, as we discussed above. Even in the US, real incomes are falling and consumer confidence indicators are very low. In addition, the asymmetric energy price shock diminishes competitiveness and thus Europe’s ability to benefit from demand elsewhere. Companies could increasingly struggle to pass on higher costs to their customers and thus have to reduce their margins. Lower profits could mean less investment.
1.5 Monetary policy
Whatever excess demand is left is likely to be quashed by central banks sooner or later. Already at the time of writing, the Bank of England has raised its policy rate by 215bp to 2.25%, the ECB by 125bp to 0.75% and the Fed by 325bp to 3.00–3.25%. All three have recently stepped up the pace to 50–75bp hikes per meeting. We currently expect the BoE to hike policy rates to 4.25% (a further rise of 200bp), the ECB to 2% (125bp) and the Fed to nearly 5% (150bp) by early 2023 . In addition, the BoE and the Fed have started unwinding the asset purchases they have accumulated during the pandemic, exerting upward pressure on longer-term borrowing costs as well.
Even before central banks actually started tightening monetary policy, market interest rates rose sharply in anticipation. Between the start of 2022 and the middle of June when the Fed starting hiking in earnest, US 10-year Treasury yields had risen by 200bp from 1.5% to 3.5%, German 10-year Bund yields from –0.2% to +1.7% and UK 10-year Gilt yields from 1.0% to 2.5%. Riskier government bonds such as Italy saw yields rise even more (+300bp to 4.2%). Corporate bond yields also widened, and bank lending surveys show that banks have tightened credit standards as well.
From the middle of June to early August, financial markets recalibrated expectations somewhat due to the growing risk of recession, highlighting that central banks were not expected to let inflation deviate from target for long. As a result, market inflation expectations remained firmly anchored to central bank targets, although they have clearly moved up from the well-below-target levels of 2021 or even before the pandemic (see Figure 1.16). Since early August, long-term interest rates have risen again, with 10-year yields in the US by late September at 4%, in Germany a bit above 2%, and in the UK with the biggest jump nearly at 4.5%.
While volatile, market inflation expectations have so far not moved significantly beyond central bank targets, so there is no reason for central banks to go beyond what is strictly necessary to rebalance demand and supply, at least in the US and the Eurozone. However, as well as the market expectations shown above, central bankers will also have an eye on household inflation expectations, which are somewhat harder to measure and more difficult to contain once out of kilter. Here the picture is somewhat less reassuring. In the US, longer-term household inflation expectations on the University of Michigan’s measure have moved up, but not beyond the pre-2014 range. In the UK, longer-term inflation expectations on the Citi/YouGov measure have risen to record levels (as measured over the period since 2005) but have eased in recent months. Finally in the Eurozone, there is no survey of households’ longer-term inflation expectations that goes far enough back in time, but the ECB’s Consumer Expectations Survey, which has run since 2020, shows inflation expectations for three years ahead also rising.
Figure 1.16. US, UK and Eurozone: implied market expectation of annual inflation over the five years starting in five years’ time (CPI in US and Eurozone; RPI in UK)
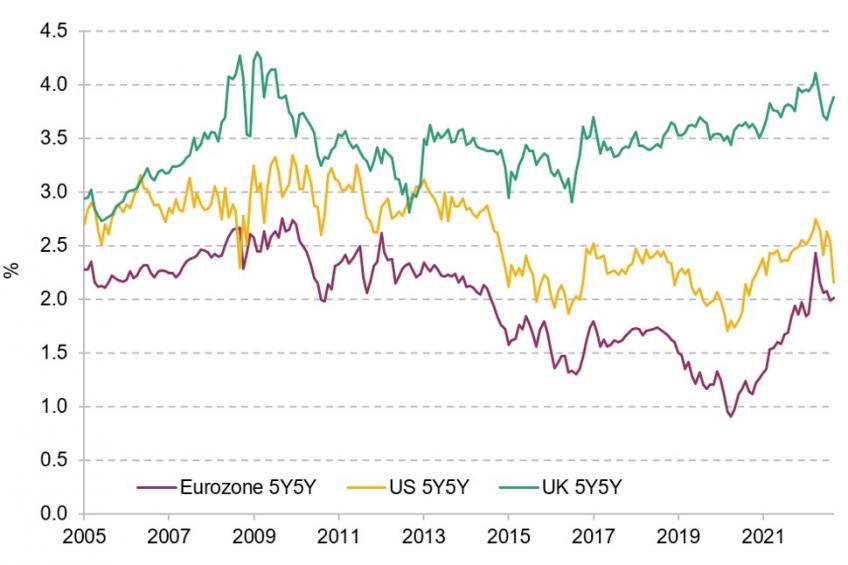
Note: Market expectations for annual CPI inflation over five years in five years (UK RPI, which is usually around 80–100bp higher).
Source: Bloomberg and Citi Research.
1.6 Fiscal policy
Governments are not sitting idly by amidst the mix of rising prices and falling growth. The number and size of fiscal and economic policy measures deployed to protect households and firms from high energy costs or at least support their real incomes are growing almost too rapidly to keep track of (see Table 1.5 for an attempt). All are also trying to secure and grow the supply of energy in order to bring down prices, although this is harder to do swiftly. The former sustains demand and thus increases inflation. The latter also creates demand directly because it triggers investment – for example, into renewable energy generation or LNG terminals. However, over time it creates new supply and thus lowers prices.
Table 1.5. Eurozone: overview of energy crisis fiscal interventions
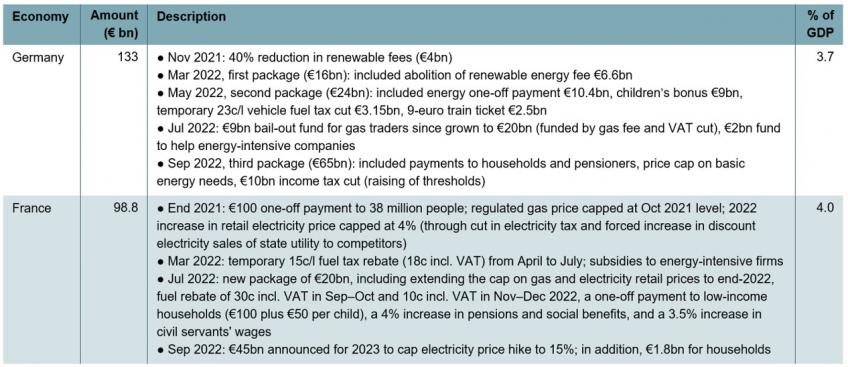
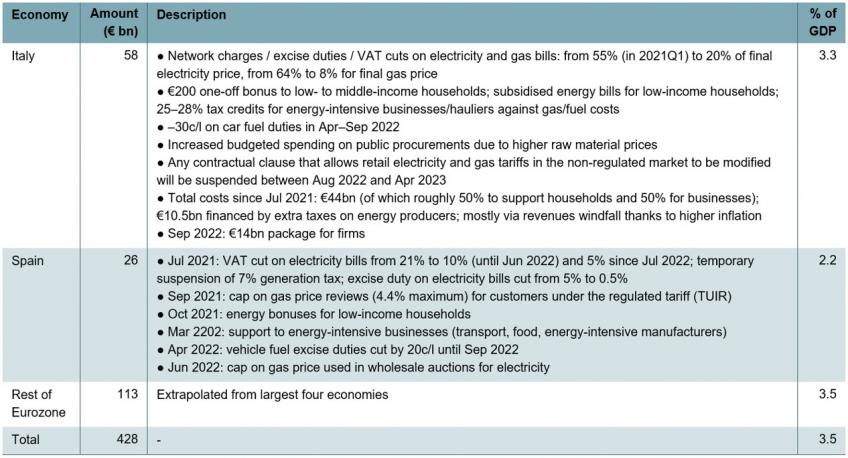
Note: Measures as of end September 2022.
Source: Local media, Bloomberg, Reuters and Citi Research.
The tools being used by governments across the EU differ widely, but the amounts deployed are so far strikingly similar (see Table 1.5). A key focus has been attempts to bring down energy costs for households (see Section 1.4) – for example, via France’s caps on gas prices (at October 2021 levels) as well as electricity price increases (4%), which account for the bulk of the roughly €100 billion (4% of GDP) package of support from the French government. Cuts in indirect energy taxes, such as Germany’s renewable fee or Italy’s network fees and VAT, have also featured. Some of the measures, such as Spain’s cap on electricity prices, are at least partly funded by energy consumers via additional fees, or by windfall taxes (Italy). Germany in particular also has a large amount of direct payments to households, which is better from the perspective of maintaining incentives to save energy. Overall, support amounts to 3–4% of GDP so far and is likely to continue to grow rapidly.3 Also at the European level, some coordination is starting to come into play – for example, with the proposal to cap prices for low-cost electricity producers and use the estimated revenue of €140 billion to help households as well. The EU’s €750 billion (in 2018 euros) NextGenerationEU fund is being even more targeted towards accelerating the energy transition.
Despite all these interventions, plus the rise in borrowing costs and lower growth than expected, government borrowing is largely evolving in line with projections at the start of the year or even lower. In the Autumn 2021 forecasts, the EU Commission expected Germany’s budget deficit for 2022 at 2.5% of GDP, France’s at 5.3% and Italy’s at 5.8%. The Bundesbank in June this year was still forecasting German borrowing to amount to 2.75% of GDP, the French government in its post-election fiscal update was still projecting borrowing at 5% of GDP, while Italy is still targeting 5.6% of GDP. This is because while expenditure has increased, finance ministers actually benefit from high inflation on the revenue side because of rising wages and indirect taxes. Direct revenues from the energy crisis such as windfall taxes (Italy, Spain) or windfall profits from nationalised utilities (France) are helping, too.
Fiscal space is likely to shrink, however. Falling growth and ultimately inflation will rein in revenue, while rising unemployment and borrowing costs will boost expenditure. Prioritising the investment necessary to relieve bottlenecks in energy production, support households with rising costs of living and boost security spending in the face of geopolitical tensions will be challenging for finance ministers.
1.7 Conclusion
The outlook for the global economy is far less rosy than in 2021. Supply–demand imbalances after the pandemic, aggravated by excessive fiscal stimulus especially in the US, which the central bank let continue for too long, now make a soft landing of the global economy increasingly challenging. Europe looks to be heading for a hard landing, with a likely winter recession due to the consequences of the Ukraine crisis, especially the sharp rise in gas prices, which takes out up to 8% of EU economies’ incomes.
In the medium term, the recovery from the pandemic remains incomplete, while the West has to wean itself off Russian energy and will potentially also reduce its dependence on Chinese technology and consumer goods exports. More resilient supply chains will likely come at the expense of lower potential growth as well as a decoupling from the fast-growing Chinese market.
Fiscal policy is treading a fine line in these circumstances. It has to protect vulnerable households and boost public and private investment necessary to restore and raise supply in the economy, not least for energy, to lower prices and regain competitiveness. At the same time, it should not thwart incentives for change – for example, by subsidising energy sources which ultimately have no future – or boost demand for scarce resources. If government interventions fuel inflation further, central banks will counteract them with more monetary tightening. Coordination between monetary and fiscal policy, where central banks keep borrowing costs in check but governments borrow to boost supply rather than demand, would be beneficial, but unlikely to materialise in the current institutional set-up.
References
Barrero, J. M., Bloom, N. and Davis, S. J., 2021. Why Working from Home Will Stick. National Bureau of Economic Research (NBER), Working Paper 28731, https://www.nber.org/papers/w28731.
Bloom, N., Han, R. and Liang, J., 2022. How Hybrid Working from Home Works Out. National Bureau of Economic Research (NBER), Working Paper 30292, https://www.nber.org/papers/w30292.
Bolton, P., 2022. Imports of energy from Russia. House of Commons Library, Research Briefing 9523, https://researchbriefings.files.parliament.uk/documents/CBP-9523/CBP-9523.pdf.
Citigroup, 2022. Where have all the nice workers gone?. European Economics Weekly, 10 June.
Endnotes
Authors

Christian Schulz
More from IFS
Understand this issue


Policy analysis


Academic research


