
Downloads
Download report
PDF | 623.5 KB
The demise of traditional defined benefit pension plans (which provide a guaranteed income from retirement to death) and the abolition of near-compulsory annuitisation of defined contribution pensions in 2015 has led to increasing interest, or even concern, around how people access their defined contribution (DC) pension wealth. Using microdata on households’ wealth, this report provides new evidence on:
- the importance of DC pension wealth in household wealth portfolios for those approaching retirement;
- how that is likely to change as subsequent generations approach retirement;
- the extent to which individuals in their 50s and early 60s have a plan on how to access their DC pension wealth;
- which people are particularly likely to withdraw funds from their pension in one go.
Key findings
1. Close to half of working-age people have at least a small amount of wealth held in defined contribution (DC) pensions. Among those aged 25–59, this is true of 46% of individuals and 64% of households. Wealthier people are more likely to have DC pension wealth: 60% of individuals in the top tenth of the (non-pension) wealth distribution have DC pension wealth, compared with 32% of those in the bottom tenth.
2. Just over three-quarters (76%) of individuals aged 50–59 – those approaching retirement – have some private pension wealth. Half of this age group (50%) have some DC wealth, and a little under half (43%) have a defined benefit (DB) pension. One in six (17%) hold wealth in both DC and DB pensions. This means that a third (33%) of those approaching retirement with DC wealth also have a DB pension.
3. People hold – on average – considerably less wealth in DC pensions than in traditional DB pensions. The median (middle) value of DC pension pots among those aged 50–59 with a DC pension was £33,500 in 2018–20, compared with around £220,500 for the estimated value of the median (middle) DB pension promise for those with DB pensions. Amongst families with at least some DC pension wealth, it is worth – on average – 12% of family wealth once we include the value of housing, the state pension, and other pensions and savings. This compares with large fractions of wealth on average being held in annuitised forms or housing (24% in the state pension, 19% in DB pensions and 24% in main property).
4. DC pension wealth is increasing significantly over time. Successive generations of people are increasingly likely to have saved in a DC pension as a result of the demise of DB pensions in the private sector and the introduction of automatic enrolment into workplace pensions. For example, in their mid 40s, 49% of people born in the mid 1970s had some savings in a DC pension plan, compared with 37% of people born in the mid 1960s at the same age. Younger age groups are also less likely to be actively saving in a DB pension scheme than current older workers.
5. People in their 50s with higher levels of overall wealth also tend to have greater amounts of DC pension wealth. This means that the decisions made over how to access DC wealth will matter most to richer people. People with low levels of wealth typically have so little accumulated DC pension wealth that however they withdraw it, it is unlikely to make a meaningful difference to their standard of living over the course of their retirement. On the other hand, people with very high levels of wealth tend to also have significant amounts of other wealth available to support them in retirement. Thus it is those around the middle or the upper middle of the wealth distribution for whom the decisions over how to access private pension wealth are going to be most consequential. There are a range of factors that people will need to take into account when deciding how to draw their DC pension wealth, but the key decision will be the extent to which people want to trade off flexibility (by withdrawing chunks of cash or using ‘flexi-access drawdown’) against the security and certainty provided by an annuity.
6. More than four in ten people in their 50s and early 60s who have savings in a DC pension do not know how they plan to access their pensions. This is more likely among those with low levels of wealth, even after controlling for other observed characteristics. Those in paid work and those who have not used a financial adviser are also less likely to have plans for how to access their DC pension pots. Those who can answer more financial literacy questions correctly and those who are owner-occupiers are relatively more likely to plan on buying an annuity rather than accessing their pension savings more flexibly.
7. Administrative data show that a large majority of people accessing DC pension plans withdraw the pot in full. This leads to concerns that some might be spending their retirement resources too quickly. But it is important to take into account wider financial resources, especially those that are already in annuitised forms. Even fully drawn DC pension pots – which on average are worth around £22,600 – typically make up a small fraction of overall resources. At the median, the withdrawn funds account for only 3.1% of private family wealth.
8. However, a minority of people make large withdrawals from their pension pots that make up a large fraction of household resources. For one in six of those who took out a DC pot in full, the amount withdrawn was at least £20,000 and made up at least a tenth of their overall family wealth.
9. A key policy challenge is identifying those for whom the decisions around DC pension decumulation are most important. Policymakers should aim to target support at those who are at the biggest risk of making imprudent financial decisions which could materially affect their standard of living in retirement. At a minimum, the Pensions Dashboard could – in time – provide some help in allowing people to understand and visualise the different pension savings they have. But more broadly, people should think of their pension savings in the context of their housing, other savings, and their partner’s/spouse’s pension wealth and other savings too. Default decumulation pathways should be considered, alongside a framework for decision-making that lays out the key trade-offs clearly to help people achieve good outcomes. Impartial and free pensions guidance through Pension Wise is already available, but take-up is currently very low. And even those who access this guidance usually only do so at a stage when they are accessing their DC pot for the first time, rather than getting support with planning for retirement earlier on. Expanding take-up of Pension Wise advice could be one way in which more support could be provided, although ensuring that the standards and quality of this guidance remain high is important.
10. As the importance of DC pots as a proportion of wealth is increasing over time, future generations will be more reliant on DC schemes and less reliant on (annuitised) DB schemes. While for many of those currently approaching retirement the decisions around accessing DC pots are ‘low-stakes’ because of other resources available to them, future generations will rely more heavily on DC pots for financing their retirement. The risks around making decisions that have adverse and long-run consequences will grow over time as the prevalence and size of average DC pots start growing. This is why the time for designing policies to help individuals who rely on DC pots for financing their retirement is now, so that future generations will be protected against adverse outcomes at older ages.
1. Introduction
‘Pension freedoms’ – or more formally the end of near-compulsory annuitisation of defined contribution (DC) pension wealth introduced in the UK in 2015 – have given individuals considerably more flexibility over when, and how, to access DC pension wealth. Since the announcement of this policy, annuity purchases have collapsed and even the increases in interest rates (and therefore annuity rates) since early 2022 have only led to a very limited increase in the number of annuity purchases.
Discussion about the benefits – and disadvantages – of the introduction of pension freedoms often focuses on the trade-offs between flexibility and risk. Individuals approaching retirement have more choice and freedom to draw on their DC pension savings in ways that are appropriate for their spending needs and they do not have to lock in – at a single point in time – annuity rates many saw as poor value. On the other hand, concerns have been expressed about the difficulties individuals face in retirement income planning, given uncertain (and potentially misperceived) life expectancy, low financial literacy, limited engagement with pensions, and low take-up of regulated financial advice (Adams and Ernstsone, 2018). Pensioners therefore risk drawing down on their private resources too fast – leaving them with little other than their housing and state support – or too slowly resulting in a needlessly frugal retirement.
However, the importance of the decisions that people take regarding their defined contribution pension wealth around retirement is ultimately determined by not just the amount of DC wealth they have but also the other assets in their, and their spouse’s (if they have one), portfolio(s). For some, the decisions regarding their DC pension wealth will be ‘low-stakes’ decisions, particularly if the accumulated pots are small or if sizeable other resources are available. And the value to individuals of additional longevity insurance provided by annuities may be limited, especially if large fractions of their portfolio are already held in annuitised forms, most notably entitlements to the state pension, defined benefit pension wealth, and the consumption flow provided to households by owner-occupied housing. That being said, with most retirement resources previously held in annuitised forms, the increase in non-annuitised wealth for retirees implies people are bearing more financial risk related to their life expectancy (‘longevity risk’) than previous generations of people approaching retirement, and some will have to make decisions throughout their retirement over the extent to which they should be drawing on their pension pots.
This report sheds light on these issues by examining the wealth portfolios of those approaching retirement. A particular advantage of the data we use in most of this analysis – the UK’s Wealth and Assets Survey (WAS) – is that we observe information on all the assets held by all members of the households. This includes all pension wealth as well as housing and other wealth. In addition to detailed data on wealth portfolios, the data contain specific questions on how individuals plan to access, and have accessed, DC pension wealth. With data on younger individuals too, who are not yet approaching retirement, we are also able to think about how pension freedoms may differentially affect subsequent generations.
To provide background to this issue, Figure 1 illustrates a key change in the UK pensions landscape over the last 25 years. The late 1990s and 2000s saw large declines in defined benefit (also known as final salary schemes) pension provision, with smaller growth in defined contribution provision. Following the phased introduction of automatic enrolment (AE) starting in 2012, pension participation jumped dramatically, driven entirely by defined contribution arrangements. In 2021, half of all employees were contributing to a defined contribution pension plan, though still almost three in ten were contributing to defined benefit plans (mostly in the public sector, with only around one in ten private sector employees in defined benefit (DB) schemes – see Cribb et al. (2023)). The decline of DB arrangements and rise of DC participation following automatic enrolment means that there are many more people with DC pension wealth than 25 years ago, and many more, often very small, pension pots.
Figure 1. Percentage of UK employees participating in a workplace pension by type of pension, over time
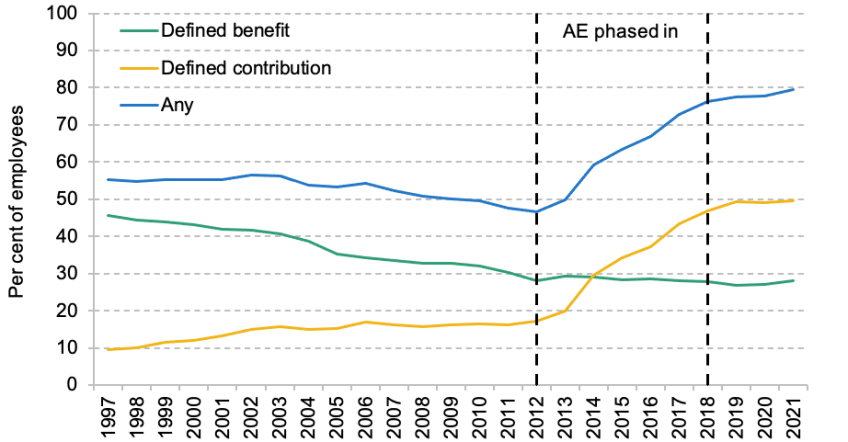
Source: ONS analysis using the Annual Survey of Hours and Earnings (https://www.ons.gov.uk/employmentandlabourmarket/peopleinwork/workplacepensions/bulletins/annualsurveyofhoursandearningspensiontables/2021provisionaland2020finalresults).
This is also shown in Figure 2, which shows the number of DC pension pots that were accessed in 2021–22 according to statistics from the Financial Conduct Authority (FCA). DC pension wealth can currently be accessed at age 55, though that age is rising to 57 by 2028. The graph shows the large numbers of people accessing pots worth less than £10,000 and that most of those were withdrawn in full. Of the (much smaller) number of large pots, most were accessed through partial drawdown rather than buying an annuity.
Figure 2. Number of pension plans accessed in 2021–22 by pot size and method of access
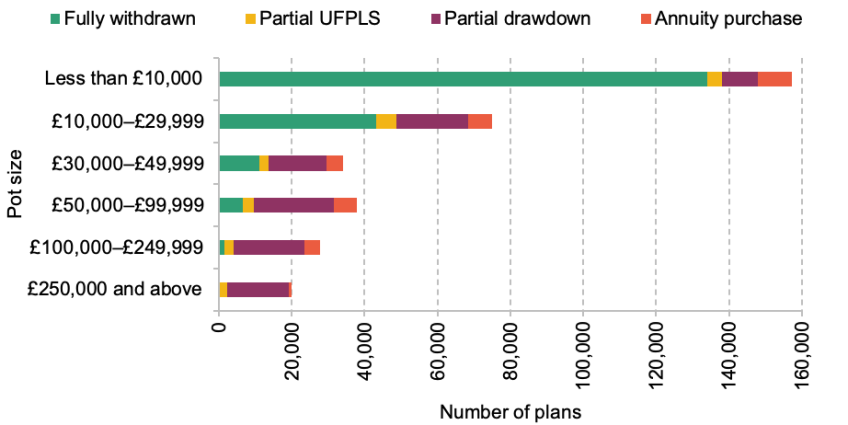
Note: UFPLS refers to uncrystallised funds pension lump sums – this is a way of drawing some money out of a pension without going into drawdown or buying an annuity.
Source: FCA retirement income statistics 2021–22.
The rest of this report proceeds as follows. Section 2 examines the prevalence of defined contribution pensions wealth in the UK in recent years, both amongst those approaching retirement and amongst younger generations. Section 3 illustrates how important the choices offered by pension freedoms are, by examining how incomes in retirement could be affected by the decisions made on accessing DC pension wealth. Section 4 examines how people in their 50s and early 60s plan to access their pensions, and how different that is across different types of people. Importantly, we show that most people do not know how they will access their wealth, but even amongst those who do there is much variation across different people. Section 5 analyses which people have accessed their DC pension wealth by taking out large amounts in cash at once, specifically focusing on those who withdraw a pension pot in full. Section 6 provides a short conclusion and discussion of policy implications.
2. Importance and prevalence of defined contribution pension wealth
Given the large increase in the prevalence of DC pension pots over recent decades, we start this section by examining how important DC pension wealth is as a source of wealth among working-age people, especially those currently approaching retirement (aged 50–59). We first focus on the prevalence of DC pots, and then assess the role that DC pots play as part of people’s overall wealth. We will then discuss how this picture is likely to evolve in future.
Importance of defined contribution pension pots for those currently approaching retirement
Figure 1 illustrated how the prevalence of active savers in DC schemes has changed over time among employees. In this subsection, we look at the prevalence of having a DC pot, regardless of whether the individual is currently contributing / actively saving in one or not.
Figure 3 shows the proportions of men and women aged 50–59 (in 2018–20) with unaccessed pension wealth, splitting these individuals into those who only hold pension wealth in a DB pension, those who only have a DC pension, and those who have unaccessed pension wealth in both. Among this group of individuals approaching retirement, more than three-quarters (76%) have some unaccessed pension wealth. Men are slightly more likely to have any unaccessed pension wealth (79%, compared with 74% among women), and while men are more likely to have unaccessed wealth only in a DC pension, women are more likely to have DB wealth only. These differences are most likely driven by differences in labour market patterns – women are more likely to work in the public sector where DB pensions are more prevalent. It is worth noting that while many of these individuals will have been able to benefit from private sector DB schemes, the decline in those schemes started even before this generation joined the labour force, meaning that less than half (43%) of those aged 50–59 currently have unaccessed DB pension wealth. On the other hand, half (50%) have unaccessed DC pension wealth. And out of those with any unaccessed DC pension wealth, 33% also have some DB wealth.1
Figure 3. Percentage of individuals aged 50–59 with DC and DB wealth not yet in payment, by gender
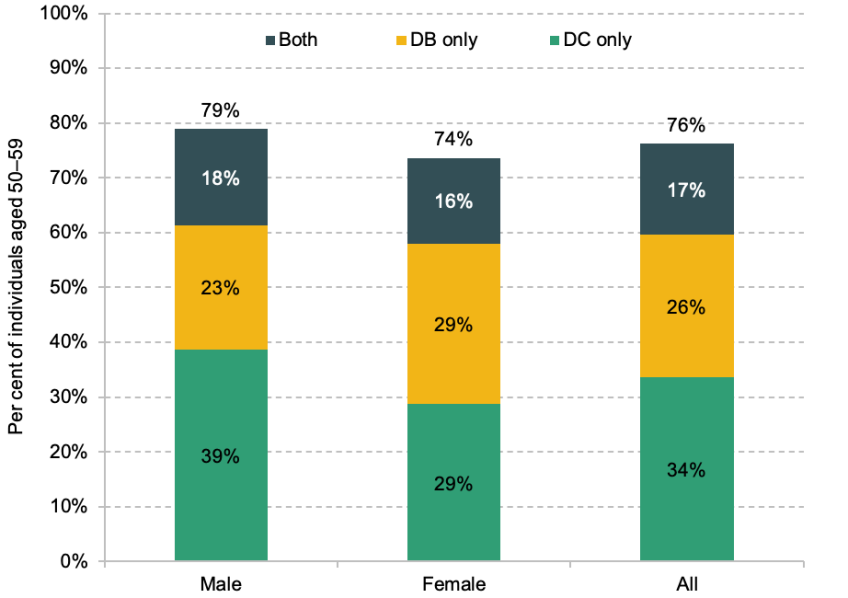
Note: Expected pensions from former spouse/partner or pensions in payment are not included. Additional voluntary contributions (AVCs) are included in DB pensions.
Source: Authors’ calculations using the Wealth and Assets Survey, Round 7 (2018–20).
Among those aged 25–59, 46% of individuals and 64% of households have some DC pension wealth.2 Figure 4 shows the prevalence of having any DC wealth across the total (non-pension) wealth distribution, among three different age groups. The youngest age group (those aged 25–34) are slightly less likely to have DC pension pots than the older age groups across the whole wealth distribution. However, the bigger differences in the prevalence of DC pots can be seen between wealth groups – among all of the age groups, those with more overall wealth are more likely to have DC pension pots. It is therefore worth noting that in the results that focus on the group of individuals or households with any DC wealth, that group will be, on average, wealthier than the overall population.
Figure 4. Prevalence of having a DC pension pot across the (non-pension) wealth distribution, by age group
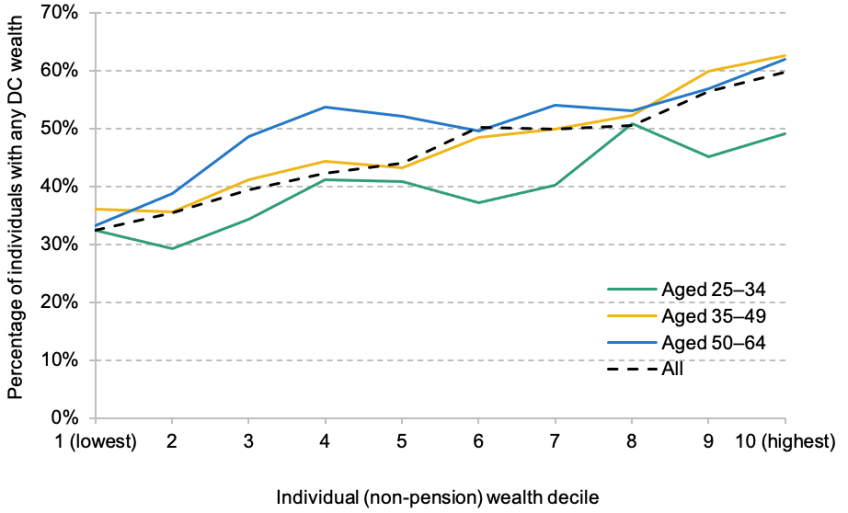
Source: Authors’ calculations using the Wealth and Assets Survey, Round 7 (2018–20).
While Figure 4 illustrates the prevalence of having any DC wealth, the amounts people have in their DC pots also vary. Figure 5 shows the distribution of DC pension wealth among those aged 50–59 with any DC pension wealth (which is 50% of 50- to 59-year-olds). DC pension pots are often relatively small among this generation (despite them being between 7 and 17 years away from their state pension age) – 25% have £7,500 or less, half have £33,500 or less, and only 25% have £103,500 or more saved in a DC pension pot. The value of DB pension plans (among those who have one) tends to be much higher. Among those aged 50–59 who have DB pension wealth, half have more than £220,500 and a quarter have more than £464,500.
Figure 5. Distribution of total DC pension wealth among those with some DC pension wealth, and of total DB pension wealth among those with some DB pension wealth, among 50- to 59-year-olds
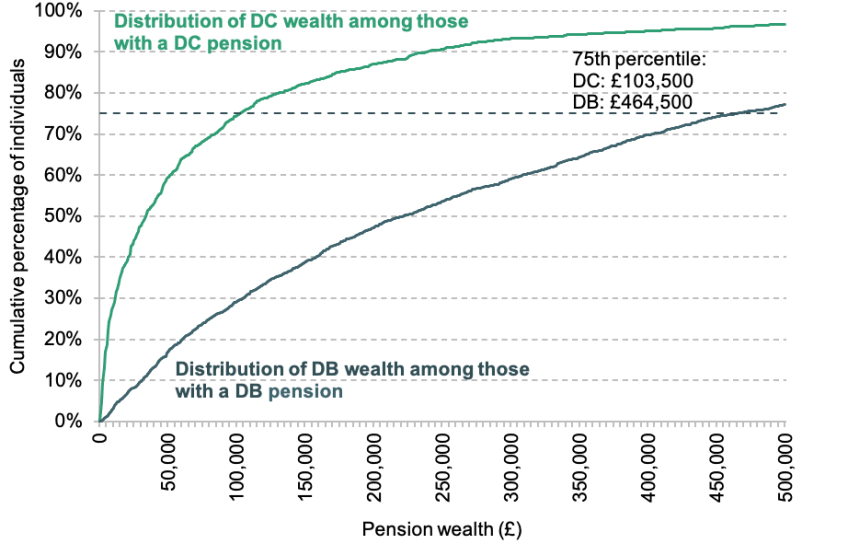
Source: Authors’ calculations using the Wealth and Assets Survey, Round 7 (2018–20).
This difference in levels of wealth held in DC and DB schemes can be explained by a combination of facts. First, those with DB pensions are likely to have had them for longer. Second, employee and employer contributions into DB pensions tend to be much higher than levels seen in DC pots. Third, asset returns have fallen in the years after the 2008 financial crisis (see Cribb et al. (2023)); this will have a direct effect on the value of DC pensions as the returns on those investments will be lower, whereas it will not have directly affected the income provided by a DB pension. In contrast, progressively lower ‘discount rates’ (which are used to value promised streams of income in retirement) have boosted the value of DB pensions (see O’Brien and Zaranko (2023)).
We next turn to show how important DC pensions are as a part of overall wealth for this age group. Figure 6 shows the proportion of overall wealth that individuals aged 50–59 with any DC pension wealth hold on average in different asset types. We look at this both at the individual and at the family (defined as a single individual and his/her cohabiting partner/spouse) level. In addition to the value of wealth reported in the WAS data, we also add in the expected value of the state pension in retirement.3
Figure 6. Components of wealth among individuals aged 50–59 with some DC pension wealth
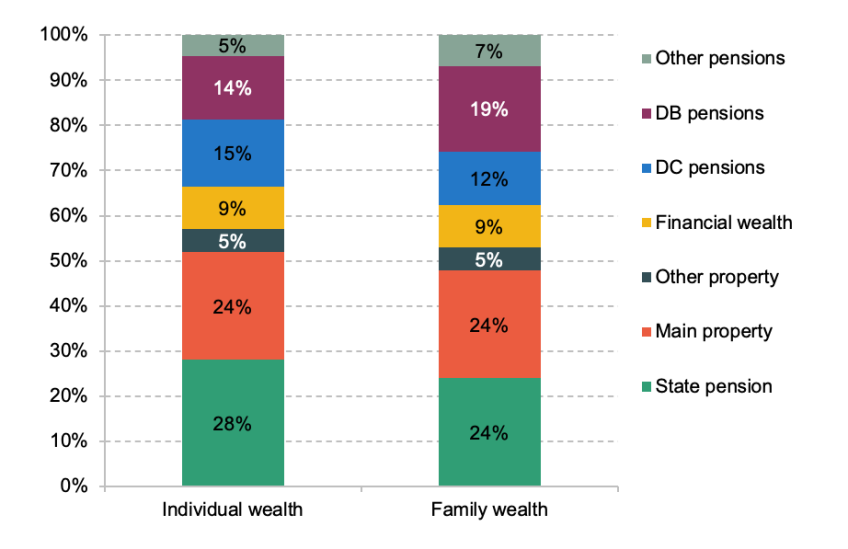
Note: Individuals aged 50–59 with some DC wealth, and families with some DC wealth with an individual aged 50–59. The average amount of total wealth is £659,000 at the individual level and £1,182,000 at the family level (including state pension wealth). ‘Other pensions’ refers to pensions in payment and pension from a former spouse or partner.
Source: Authors’ calculations using the Wealth and Assets Survey, Round 7 (2018–20).
Figure 6 shows that, on average, people who have DC pensions hold 15% of their total wealth in DC pensions and 14% in DB pensions. At the family level, DB pensions are even more important, with 19% of wealth being held in them, compared with 12% in DC pensions.
In fact, much of the overall wealth of these households is being held in annuitised forms. The main source of wealth for these households is the state pension, which, like a DB pension, provides a guaranteed and index-linked stream of income until death. The second-largest source of wealth on average is main property, which we can also consider as a form of annuitised wealth. While the main property does not provide a guaranteed income in retirement, it provides a guaranteed stream of consumption of housing. In other words, people who own a property outright benefit from lower housing costs compared with renting or paying a mortgage. Figure 6 therefore shows that this age group of individuals and families with any DC wealth hold about two-thirds of both individual and family-level wealth in what might be considered an annuitised form – DB pensions, state pension, and main property wealth. This composition of wealth will have implications for what the right balance of flexibility and certainty is for people making decisions about how to access their DC pension pots.
Importance of DC pots among younger generations
So far, this section has illustrated that DC pots are still typically a relatively small part of the total wealth available for the current generation of individuals in their 50s. This is likely to change in the future. Figure 7 shows the prevalence of DC pension pots among different age groups, in the earliest and latest periods of WAS data (2006–08 and 2018–20). The earlier data are from before the introduction of automatic enrolment, and the later data cover a period when the roll-out of AE had been completed. Instead of just looking at employees as we did in Figure 1, here we illustrate the prevalence of DC pots among all individuals in these age groups, including those who are currently self-employed or not currently in paid work.
Figure 7. Percentage of individuals with an unaccessed DC pension pot
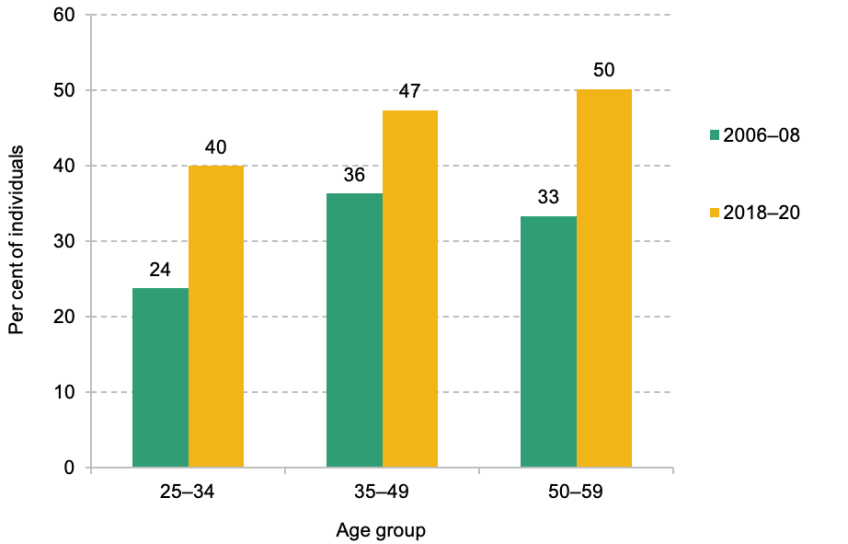
Source: Authors’ calculations using the Wealth and Assets Survey, Wave 1 (2006–08) and Round 7 (2018–20).
Figure 7 shows that between 2006–08 and 2018–20, the prevalence of unaccessed DC pots increased by at least 11 percentage points among all age groups, largely thanks to automatic enrolment. In absolute terms, the increase in prevalence was largest among the youngest and oldest age groups. Relative to the participation rate in the earlier period, the increase in prevalence of DC pots was largest among the youngest age group. While automatic enrolment affected DC pension participation among all age groups, the effect was most pronounced among the youngest group.
Figure 7 compared the prevalence of DC pension pots among the same age group between different periods. We can also look at what happened to DC pension prevalence within generations over time – Figure 8 shows the prevalence of any DC wealth by age among people grouped by their year of birth. Once again, the effect of automatic enrolment is clear: in addition to prevalence increasing as each generation ages, as we would expect, each generation is also more likely to be saving into a DC pension than the previous generation at the same age. This strongly suggests that DC pensions will be an increasingly important part of older workers’ wealth in the future.
Figure 8. Percentage of individuals with DC wealth, by generation
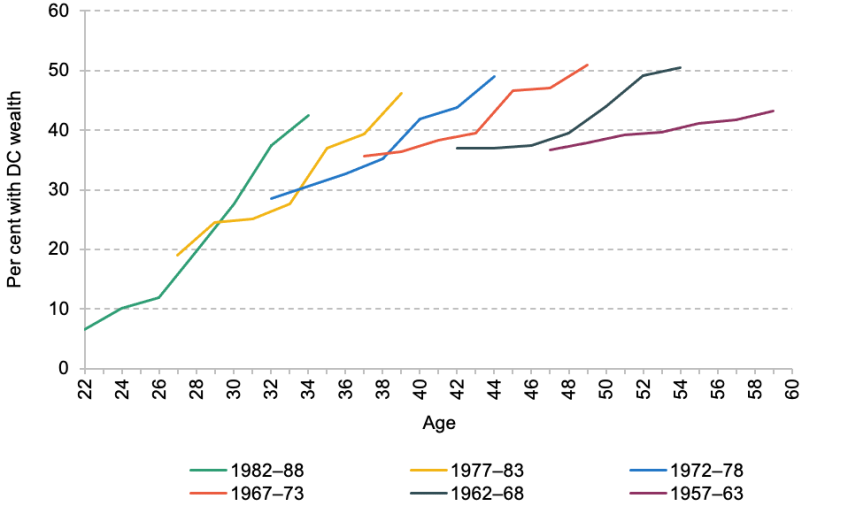
Source: Authors’ calculations using the Wealth and Assets Survey, Waves 1–5 and Rounds 6 and 7.
At the same time as we expect to see a rise in the prevalence and importance of DC pension pots among future generations, we also expect other sources of wealth to play a smaller role in overall retirement resources available to these cohorts. Previous research (Cribb and Simpson, 2018) has shown that homeownership rates are at much lower levels among current younger adults than among older generations at the same age, with this being especially true of middle earners. This is in large part due to house prices rising faster than earnings, particularly in southern England, which makes it harder to get onto the housing ladder. Given these trends, it is likely that a greater proportion of future generations will reach their late working life with no or little housing wealth compared with the current generation in their 50s. Instead of being homeowners, they are more likely to be living in the more expensive (and less secure) private rented accommodation sector.
As was shown in Figure 1, the prevalence of DB pensions has fallen over time as private sector DB schemes have been closed off to new entrants. This means that fewer young people with DC pots, especially those working exclusively in the private sector, will have any DB pension available to them in retirement. This is evident in figure 9 of Cribb (2019), which shows that about a third of employees born in the 1970s were active members of a DB pension scheme in their early 40s, compared with over 40% for those born in the 1960s and around 55% for those born in the 1950s.
Summary
This section has illustrated that while the importance of DC pension pots has been increasing over time, for people currently in their 50s these pots play a relatively small role when compared with the overall wealth available to them in retirement. However, given the effects of automatic enrolment, as well as longer-running falls in the prevalence of DB schemes among private sector employees and declining rates of homeownership, we can expect DC pensions to play a much more important role for younger generations.
While this section has focused on average differences between age groups, it is important to note that there is also a huge amount of variation within generations when it comes to the types of resources available to them in retirement. While in total there is more DB wealth than DC wealth among 50- to 59-year-olds even among the group of people who have at least some DC wealth, only 33% of this group actually has any DB pension wealth. And while main property is another important source of wealth among this group on average (24% of both individual and household-level wealth), more than a quarter of this group do not have any housing wealth at all.
3. How important are DC pensions for incomes in retirement?
The previous section focused on the prevalence of DC pension pots, and their role as part of the overall wealth of current workers. In this section, we consider DC pension pots in the context of the income they may provide in retirement.
With a DB pension, by definition, individuals have limited choice in deciding how they want to draw down their wealth in retirement. Apart from a potential lump sum, pension income will be paid according to a formula that determines the pension entitlement based on the number of years the individual has been an active member of the plan while working, and a measure of their earnings – often their career average or final salary. The pensioner will then receive that amount until death (after which survivor benefits to a surviving spouse may be paid).
However, with DC pension pots since pension freedoms, people can now choose what their income profile will look like in retirement. This freedom of choice around how to access DC pots provides a great deal of flexibility to match total income with spending needs and desires, but brings about potential risks. And those risks will matter more for those more reliant on DC pensions in retirement.
In this section, we first examine which income groups, among those currently in their 50s, will be most affected by the choices made around accessing DC pension pots. We do this by looking at the share of potential income from DC pots across the income distribution. We will then discuss some of the factors that individuals will have to consider when making decisions around accessing their DC pension pots.
Incomes at state pension age among those currently approaching retirement
In Figure 9, we take the different components of wealth we observe among the 50- to 59-year-olds with DC pots, and convert those into incomes at age 66 (the current state pension age, i.e. the age at which people become eligible to receive the state pension). The different income streams are defined and modelled as follows:
- For defined contribution pensions, we assume the pot grows at a real rate of 2% per year up to age 66, and is then converted into an RPI-linked annuity, based on best annuity rates for a 65-year-old as of April 2023.4
- While housing does not provide an income stream in retirement, it is important to take into account the existence of housing wealth to reflect the fact that those who own their homes outright will have lower housing costs compared with those in particular in the private rented sector. We assume an annual consumption stream of 5% of the value of the housing, in line with common rental yield assumptions.
- Expected income from DB pensions and pensions in payment are used as reported in WAS.
- For the state pension, we use the full entitlement amount of the new state pension as an indicative level of state pension income. Some people may receive less than this amount due to not having enough qualifying years (especially those who have lived outside of the UK during their adult life), whereas some may receive more if they had built up sufficient contributions under the old earnings-related state pension schemes. Some may also choose to defer the state pension to start receiving it after age 66, although this is rare.
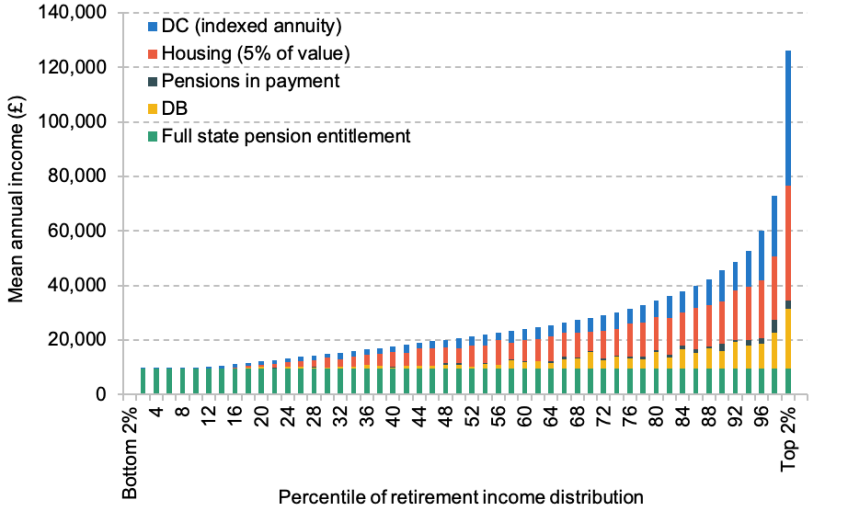
Figure 9. Composition of retirement income at age 66 for people with DC wealth
Panel A
Panel B
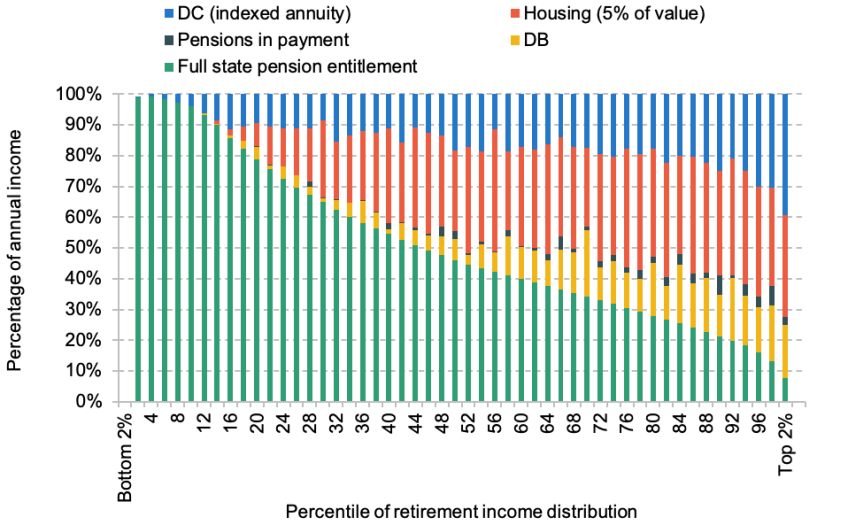
Note: Cash values expressed in 2022 prices.
Source: Authors’ calculations using the Wealth and Assets Survey, Round 7 (2018–20).
We do not consider means-tested benefits (in particular, pension credit or housing benefit) or income from work or savings and investments, and all income streams are reported gross of tax. Figure 9 shows the average annual income (in pounds, Panel A) and its composition (shares of total income, Panel B) at age 66 among those currently aged 50–59 who have any DC wealth, across the projected retirement income distribution. It is clear from this figure that among the group of individuals with any DC wealth, there is much variation in terms of resources available to them in retirement.
The indexed annuity from DC pension wealth makes up less than a tenth of overall income for the bottom 14% of the income distribution. This low proportion of total income coming from DC pots is driven by the fact that the DC pots (as well as other sources of income) at this part of the distribution are on average small, while the full new state pension entitlement is close to £10,000 a year. On the other hand, income from DC pots makes up more than a fifth of total income for the top 15% of the income distribution (among those with DC wealth), as individuals at this part of the distribution have larger DC pension pots. However, at the top of the income distribution, the average incomes from other sources are also much higher.
While this figure shows average incomes from different sources of wealth, the prevalence of having any property or DB wealth also differs greatly across the income distribution. Those in the bottom 12% of the sample in terms of their projected income have no property wealth and those in the bottom 6% have no DB wealth at all, whereas among the top tenth, nearly all (98%) have housing wealth and 55% have DB pensions. In the middle of the distribution (45th to 54th percentiles in terms of projected income), 33% have DB pensions and 93% have some housing wealth.
Figure 9 illustrates that both in terms of pound amounts and as a share of total income, the decisions around what to do with DC wealth will be more impactful at the top of the income distribution, as those with higher total retirement incomes tend to also have higher levels of DC wealth on average. However, those at the very top of the income distribution often also have a great deal of other resources available to them in retirement, so they will generally not need to rely on DC income to ensure a decent living standard in retirement.
On the other hand, for those at the bottom, no matter what decision these individuals make around their DC pots, it will only make a small difference to their living standards as the cash amounts will be small. This suggests that the choices around how to use DC pots are likely to matter the most for those in the middle (and upper middle) parts of the income distribution, as for these people DC pots make up a relatively large part of their overall wealth as other resources available are more limited, but they are also large enough in pound terms to make a meaningful difference to living standards. For example, in the middle of the income distribution, DC pension income from an indexed annuity could make up 18% or £3,850 of total annual income.
Considerations for choosing how to access DC pension pots
Pension freedoms mean that people get to choose what their income profile in retirement will look like (subject to them having sufficient DC wealth available to them to achieve the profile they would like to have). While Figure 9 assumed that an individual with a DC pension purchases an index-linked annuity once they reach the state pension age, there is no longer a requirement to do so at any age.
When choosing how to draw down their DC wealth, individuals will have to consider a number of key questions, some of which are listed below. While pension freedoms refer to DC pots in particular, when answering these questions individuals should make sure that they are taking stock of all the other sources of wealth and income they have available, both individually and at the household level, and that they make decisions with their overall finances in mind. Depending on the level and type of other assets available, the appropriate decisions around how to access DC pots may look very different.
The factors people should consider when deciding how to access a DC pension pot include:
- Do they want a stable income through retirement, or more up front or later on?
In order to achieve a higher payout up front, individuals may choose to make flexible drawdowns from their pension either as needed/desired, or at a predetermined rate each year. A benefit of flexible drawdown is the ability to change income streams in response to changing needs (e.g. changing spending desires or changes in the level of other sources of income), whereas an annuity provides a stable stream of income through retirement, with a guarantee that it will be paid until death. For example, people may opt for flexible drawdown in order to have a higher income early on in retirement, in anticipation of spending needs declining later on. However, while the composition of spending changes as people age, it is not clear that total spending needs fall. In fact, Crawford, Karjalainen and Sturrock (2022) show that per-person spending in retirement stays on average flat in real terms, rather than declining with age.
- Do they want to insure themselves against longevity and market risk? How about inflation risk?
While flexible drawdown potentially allows people to draw on more income earlier (or later), it can increase exposure to various risks. The key risks people may want to insure themselves against in retirement are longevity, market and inflation risk. Longevity risk refers to the fact that individuals do not know at the start of retirement how long they will live, which makes it difficult to determine how fast they should draw down on resources in retirement. Individuals can insure themselves against longevity risk – i.e. the risk of running out of resources in retirement, or alternatively spending down wealth too slowly – by purchasing an annuity, which guarantees a set level of income in retirement until death. An annuity also protects people against market risk, as the insurance company guarantees the level of income, even if returns on investments through retirement are lower than expected at the time of purchasing the annuity.
However, the most prevalent annuity products in recent years have been level annuities, which pay out the same nominal amount each year in retirement.5However, this type of annuity can leave people more exposed to inflation risk – namely, the risk that the value of their pension will fall if inflation is higher than expected – with the period since the start of 2022 a very striking example. An index-linked annuity can insure people against that risk. However, all insurance comes at a price, in this case a lower starting annuity income – and a lower income overall if inflation does not surprise on the upside.
Do they want to keep on adjusting incomes through retirement or make one decision at the start?
Another aspect of insurance inherent in annuities is the fact that once a decision to purchase an annuity has been made, the individual no longer has to make decisions around how to draw down their wealth (although they will still have to decide how much of their income to spend and how). Through locking in a decision earlier on, an annuity can also act as insurance against cognitive decline which would make decision-making more difficult at older ages, as well as protection against fraud which individuals with large undrawn pension pots could be exposed to.
On the other hand, the fixed nature of an annuity also means that people will have less flexibility in terms of accessing their wealth. When faced with unexpected costs, such as repairs in the home, this can become an issue, especially to those with limited sources of other liquid wealth.Are they hoping to leave an inheritance? Are there other reasons why they may want to hold on to liquid savings, such as saving for social care costs later on?
People may want to use their DC pension pots for purposes other than providing an income in retirement, especially if they have other annuitised resources available to them in retirement but little liquid financial wealth. In fact, some – presumably high-wealth – people may choose to consider DC pension pots as a pot of liquid savings which they can access at any point from their late 50s onwards, rather than a pot of money that is meant to provide a stable stream of income in retirement. For high-wealth individuals, leaving funds in a DC pension pot can also be a very tax-efficient way to pass on wealth as they are exempt from inheritance tax (for more detail, see Adam et al. (2022)).Is the preferred method of accessing the pension the most tax-efficient one?
An additional layer of complexity in deciding how to access a DC pension pot is the tax implications of the different options. People should make sure that they do not inadvertently end up paying more tax than needed because of how they choose to access their DC pension pot. Withdrawing a large pot of DC wealth at one point could bring the individual into a higher tax bracket (e.g. move them from being a basic-rate – 20% – taxpayer to a higher-rate – 40% – taxpayer) and lead them to pay considerably more tax than if the wealth were withdrawn more smoothly.
Options for drawdown strategies and pension income products
Given the insurance value of annuities, they may seem like – aside from a desire to leave an inheritance – a good product choice for many. Indeed, Mitchell et al. (1999) emphasise that the insurance that annuities provide can play a potentially important welfare-improving role for retirees. However, it is not clear that an annuity is always the optimal choice for all individuals and households, in particular when taking into account other sources of income and wealth in retirement. If households already hold much of their wealth in an annuitised form, the additional value of longevity insurance may be low compared with the flexibility of keeping a DC pension pot in a more liquid form. This illustrates the key trade-offs when it comes to choices people have to make around accessing DC pots – an annuity provides insurance, stability and certainty, but other ways of accessing a DC pension provide flexibility and the ability to pass on wealth at death (and potentially to do so in a tax-favoured way).
A key challenge for the pensions industry as well as public policymakers has to do with the difficulty of effectively communicating these trade-offs around level of income, flexibility and insurance. While it may be straightforward to compare amounts that income products or drawdown strategies provide at the start of retirement, the way in which incomes may vary through retirement under different sets of assumptions is much more difficult to conceptualise. A given pension pot and strategy for withdrawal may lead to very different income profiles and total payouts depending on investment returns, inflation and longevity, and people may differ in their appetite and ability to take on those risks. These trade-offs need to be communicated with pension savers in a clear and consistent way, in order to support people in making these consequential choices around their finances in retirement.
Our framing of the retirement product choice so far has focused on the difference between flexible access and purchasing a guarantee. However, a combination of approaches is possible and other products exist. Most of the proposed solutions put forward by the industry focus on hybrid options, where some of the DC pot is held in a liquid form for flexible access or leaving as inheritance, and the rest is used for providing a lifetime income and insurance against longevity risk (Hyams et al., 2022; LCP, 2022; Pensions and Lifetime Savings Association, 2022). For example, Hyams et al. (2022) suggest that as a default, 10% of DC pots could be allocated to a flexible fund, and the rest into a pension fund that over time would be transferred into a pooled fund to manage longevity risk. They suggest this type of hybrid solution can simultaneously help achieve several of the goals that may be important to individuals, such as providing flexibility while also insuring against different risks under various scenarios.
Other new products have also been proposed in light of these challenges, both in the UK and in countries with similar types of systems with a high reliance on private pension saving. Collective defined contribution (CDC) schemes have garnered a great deal of attention in the UK recently, as new legislation has enabled Royal Mail to introduce the first such scheme in the UK. In a CDC scheme, the employer and employee contribute to a collective fund which provides an income stream in retirement until death, but rather than the employer guaranteeing the benefits paid by the scheme, a CDC scheme provides a target pension which may be adjusted if the scheme is under- (or over-)funded (Mirza-Davies, 2022). While being an interesting development, new CDC schemes will not benefit those currently approaching retirement who are making decisions about how to access their DC pension pots.
Finally, another interesting product development relates to deferred annuities. These are annuities you buy today, but only start receiving income from years from now. While not widely available in the UK, these have been proposed as a solution that could improve pensioner outcomes in the US setting (Shoven and Walton, 2023; Horneff, Maurer and Mitchell, 2023). Some of the benefits of deferred annuities include the fact that by purchasing smaller deferred annuities over time, people can lock in different annuity rates and will be less exposed to annuity rate risk at the time of retirement.
Summary
In this section, we have shown that the choices around how to use DC pots are likely to matter the most for those in the middle (and upper middle) parts of the income distribution. This is because DC pots make up a relatively large part of these people’s overall wealth as their other resources are more limited, but the pots are also large enough in pound terms to make an important difference to living standards. However, there are a number of factors that people have to consider when making decisions around how to access DC pension pots.
Given the complexity of the choices that people have to make about accessing their DC pension, there have been calls for policies to set out more default options and retirement income pathways for people seeking to access DC pots (e.g. Work and Pensions Committee, 2022). A key challenge in communicating default options will have to do with explaining the risks and value of insurance. People may be drawn to the higher up-front amount of flexible drawdown, but it is important to convey the risks associated with not having insurance against uncertainty around longevity, market fluctuations and inflation. On the other hand, people may also need to consider scenarios where they purchase an annuity but live less long than expected, or face an unexpected shock to their other sources of income. Higher take-up of the kind of impartial pensions guidance that Pension Wise can provide could help people consider these trade-offs more thoroughly.
4. How do people in their 50s and early 60s plan to access DC pension pots?
Irrespective of the exact level of people’s pension wealth, at some point they will have to consider how to access their pension. For most, that is likely to be alongside making plans for retirement, where they will have to consider how much income and other resources they will have available in the years after stopping work. For someone with a DB pension pot and full state pension entitlement, the only decision they will usually have to make is when they start claiming these pensions. However, those with DC pension pots will also have to decide how they will access their DC pension, which, as Section 3 illustrated, is a potentially complex decision that comes with many trade-offs.
Given this, it may well make sense for people with DC pension pots to make plans around accessing their retirement savings well before retirement. An interesting question therefore is whether people in their 50s and 60s have a plan for how to access DC pension pots, and whether those plans differ between different types of people.
We can shed light on the extent to which people approaching retirement have a plan for how to access their DC pensions. In the latest wave of WAS data (Round 7, covering 2018–20), we can analyse how individuals with untouched (or partially drawn) DC pension pots are planning to access their pension pots, and how that differs for different people.
Specifically, the Wealth and Assets Survey for 2018–20 asks anyone aged 50 or over with an unaccessed or partially drawn DC pension pot, how they plan to access that savings pot. Respondents can choose all that apply from:
- don’t know;
- buy an annuity (guaranteed income) offered by your own pension provider;
- buy an annuity (guaranteed income) from a different provider on the open market;
- invest pot to give a regular (adjustable) income (referred to as ‘flexi-access drawdown’);
- take cash in chunks from the pension pot as it is needed;
- apart from the tax-free lump sum, leave the rest of the pension pot untouched.
We record the prevalence of each answer for the largest pension pot that the individual has. While people could give a different response across pots, or give multiple answers per pot, we find that nearly 95% of respondents only give one response, and results look very similar if we extend the analysis to responses on all pension pots the individual has.
We start by looking at characteristics of individuals who are asked questions about their plans for their pension pots, i.e. those aged 50 and over with some unaccessed DC wealth. We focus on those aged 50–64. Table 1 shows that 44% of the sample are women, and the vast majority (94%) are in paid work. 58% of the sample are aged 55 and over, which means they could already access their DC pot if they wished. The majority only have one DC pot, with the mean number of DC pots being 1.2. The median value of a pot is about £33,500, though over a quarter of pots are worth more than £114,000.
Table 1. Characteristics of people aged 50–64 with unannuitised DC pension wealth
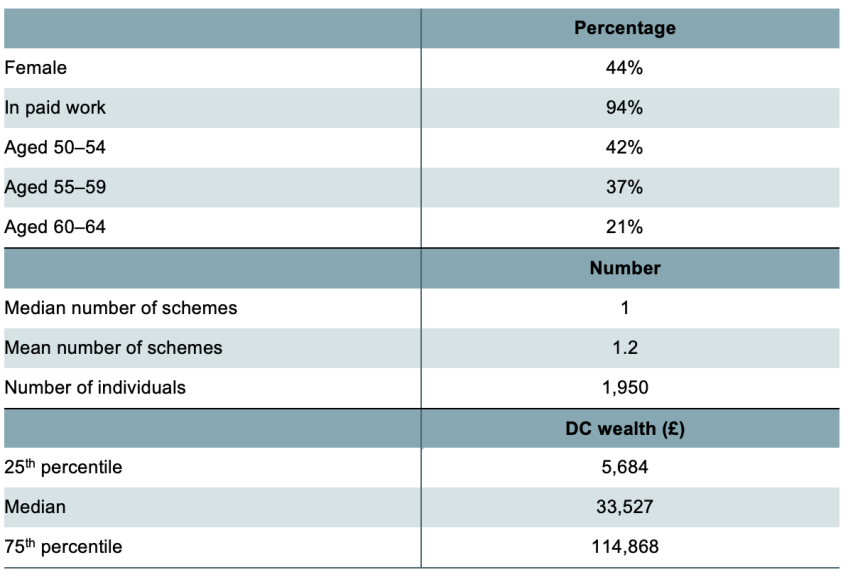
Note: Non-proxy respondents aged 50–64. DC wealth in 2022 prices.
Source: Authors’ calculations using the Wealth and Assets Survey, Round 7 (2018–20).
Figure 10 shows the prevalence of each of the responses to the question on how people plan to access their DC pension pots. It shows that 43% of people in this group answer that they do not know what they plan to do with their pension pot. Around one in seven (14%) say they will purchase an annuity with their own provider, compared with only one in seventeen (6%) saying they will shop around for annuities. This is in line with existing evidence on how people buying annuities actually access their pension pots, as the majority have been shown to purchase an annuity with their own provider (e.g. Banks, Crawford and Tetlow, 2015). However, this is problematic; a Financial Conduct Authority (2014) review showed that 80% of individuals who purchased an annuity from their original pension provider could have got a better deal by shopping around. Another one in seven people (14%) say they are planning to enter into a flexible drawdown, and about one in five (21%) say they plan to take chunks of cash as needed. Around one in twelve (8%) plan on leaving their pension untouched apart from the tax-free lump sum.
Figure 10. Prevalence of responses to ‘How do you plan to use (the rest of) your pension pot?’
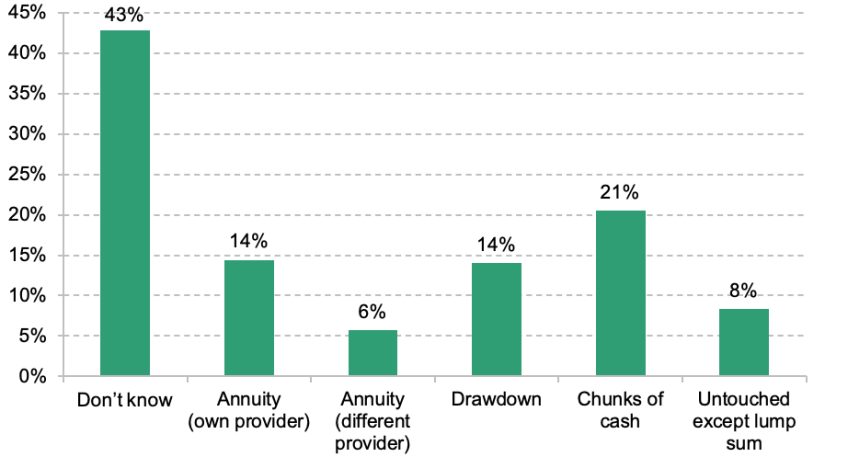
Note: Non-proxy respondents aged 50–64 with some unannuitised DC wealth. The percentages do not add up to 100 because people can give more than one answer to this question.
Source: Authors’ calculations using the Wealth and Assets Survey, Round 7 (2018–20).
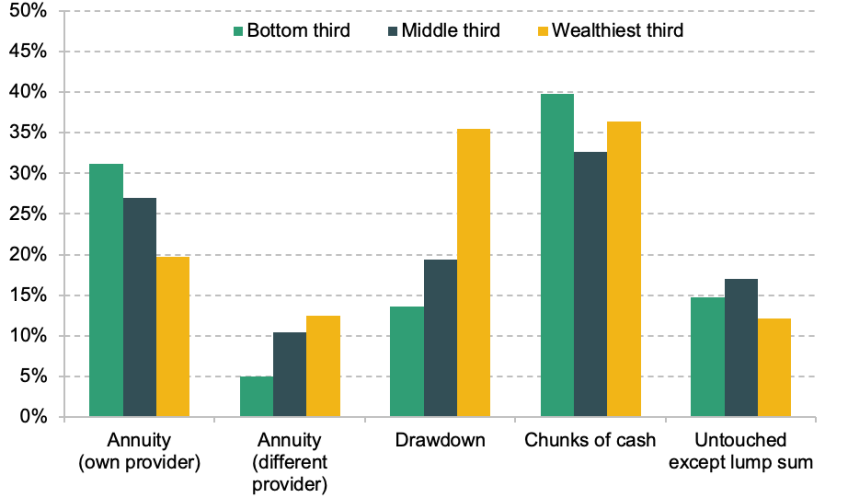
We can also consider differences in responses between different types of people. First, we split individuals into three groups based on their level of total individual wealth. Figure 11 shows clearly that the prevalence of responses differs between people in different parts of the wealth distribution. Those with less wealth are more likely to respond ‘don’t know’ – 60% of the bottom third gave this answer when asked about plans for their DC pot. However, even among the wealthiest third, we see that nearly a third (31%) respond not knowing what they plan to do with the pension. Interestingly, flexible drawdown is more popular among those with more wealth. This is true even if we limit the responses to those not saying ‘don’t know’ (see Figure A1 in the appendix).
Figure 11. Plans for how to access largest DC pension pot, by wealth group
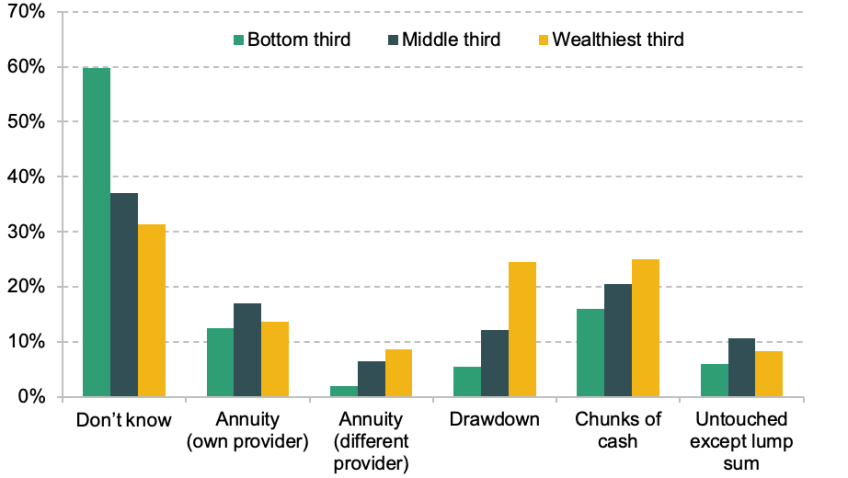
Note: Non-proxy respondents aged 50–64 with some unannuitised DC wealth. Wealth thirds defined among those with any DC wealth aged 50–64. Wealth defined as total net private wealth at the individual level (excluding non-housing physical wealth and state pension).
Source: Authors’ calculations using the Wealth and Assets Survey, Round 7 (2018–20).
We may also expect to see differences in responses by age, as those in older age groups might have thought more about how to finance retirement given it is on average closer for them. However, Figure 12 shows that differences in the prevalence of responses between age groups are surprisingly small. In fact, 39% of those aged 60–64 still report not knowing what they plan to do with their DC pension pot, despite being only a few years away from the state pension age (by which point most people have retired).
Figure 12. Plans for how to access largest DC pension pot, by age group
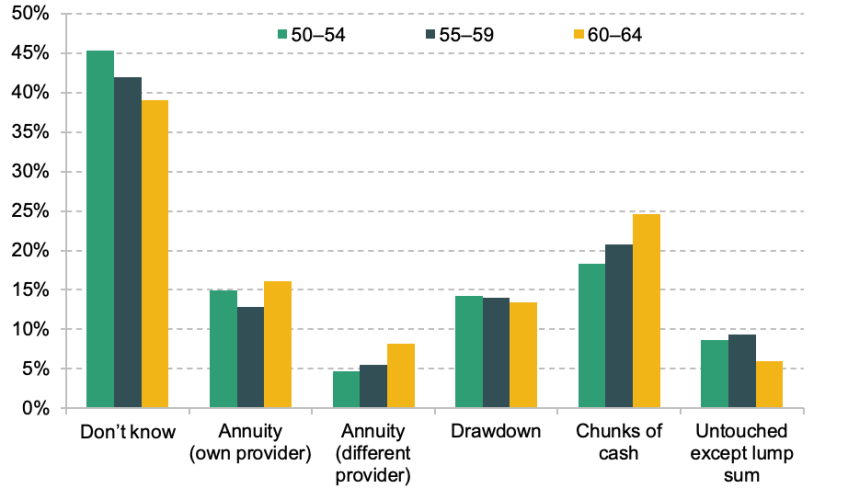
Note: Non-proxy respondents aged 50–64 with some unannuitised DC wealth.
Source: Authors’ calculations using the Wealth and Assets Survey, Round 7 (2018–20).
Multivariate analysis
While it is interesting to look at differences in responses between different age and wealth groups, to gain a better understanding of which characteristics are associated with different plans for DC pension pots we turn to multivariate analysis. Here we run regressions to see which associations remain after controlling for a number of other characteristics. We now group the responses to the question on what the individual plans to do with their DC pension pot into three (mutually exclusive) categories based on responses for largest pot:
- don’t know;
- buy annuity (own or different provider);
- flexible drawdown (flexi-access drawdown, chunks of cash as needed, or leave untouched).
Table 2 shows the average marginal effects from a multinomial probit with these three possible outcomes (first three columns), and a separate probit model where we exclude those who respond ‘don’t know’ and the outcome is an indicator of whether they intend to buy an annuity or enter drawdown (fourth column).
Table 2. Characteristics associated with plans for DC pension pots (percentage point association)
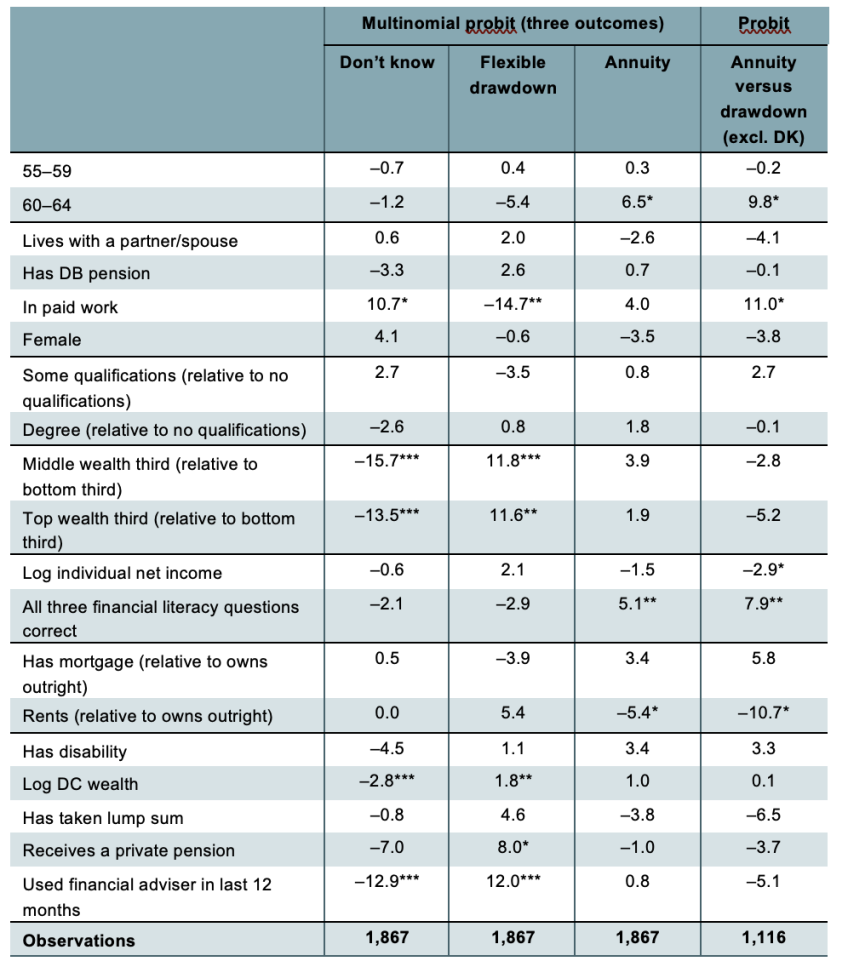
Note: * p < 0.10, ** p < 0.05, *** p < 0.01. Average marginal effects (multiplied by 100) from multinomial probit and probit regressions of answers to the question on plans for accessing DC pot on characteristics. For example, the interpretation of –12.9 for ‘Used financial adviser in last 12 months’ in the first column is that the probability of someone who used a financial adviser in the last 12 months responding ‘don’t know’ to the question on plans for pension pots was 12.9 percentage points lower than for someone who did not use an adviser in that period (all else equal). The marginal effects of each variable on the different alternatives in the first three columns sum to zero. Also controlling for region.
Source: Authors’ calculations using the Wealth and Assets Survey, Round 7 (2018–20).
The results show that even after controlling for a number of other characteristics, we still see some differences in prevalence of responses by wealth. In particular, those with more total wealth are still more likely to prefer flexible access, and less likely to say ‘don’t know’, than those in the bottom third of the wealth distribution (which is the reference category). Also, even after controlling for differences in total wealth, those with more DC wealth are less likely to say they ‘don’t know’ what they plan to do with their pot, and more likely to respond ‘flexible drawdown’.
There are also other characteristics that are associated with DC access plans, even after controlling for various other characteristics. Those in work are more likely to answer ‘don’t know’, and less likely to respond that they plan on accessing their pension through flexible drawdown, compared with those out of the workforce. This would be consistent with some people formulating a plan when they leave paid work.
Those who respond having used a financial adviser in the last 12 months are much less likely to respond that they ‘don’t know’ their plan for their DC pot, and more likely to respond that they plan to access their pot through flexible drawdown, than those who did not use a financial adviser. This suggests that using a financial adviser may indeed bring clarity to some people’s pension plans, although we cannot claim to have identified a causal relationship here – it could be that those using a financial adviser were more likely to have a plan for their retirement finances anyway.
The third column shows characteristics associated with planning to buy an annuity. We can see that the oldest age group (those aged 60–64) are more likely to plan to annuitise. Those who are renting are less likely to plan to annuitise than those who own their homes outright, which may suggest that they feel they would rather keep wealth in a more liquid form. The Wealth and Assets Survey also asks individuals questions about financial literacy to see whether they understand concepts such as inflation. We find that answering all three of these questions around financial literacy correctly (which is the case for the majority of this sample) is associated with being more likely to plan to annuitise.
The fourth column shows the results for characteristics associated with buying an annuity among those who know what they plan to do with their DC pension (excluding those who respond ‘don’t know’). While the magnitudes are slightly different from those in the third column, we again find that planning to buy an annuity is positively associated with being a homeowner, being in the oldest age group, and answering the financial literacy questions correctly.
Summary
In this section, we have shown that among individuals with defined contribution pensions in their 50s and early 60s, more than four in ten report having not decided what to do with their DC pension pot, indicating a lack of planning and a degree of uncertainty around retirement finances among this group. It could be that some of these people have not decided how to use their DC pot just because they have a lot of other resources available in retirement. But we find evidence for the opposite, as those with more wealth are more likely to have a plan for their DC pots than those with less wealth.
A key question, especially for policymakers, to understand is whether people answer ‘don’t know’ to these questions about using their DC pots because they are comfortable with their financial situation in retirement and see DC pots as some additional saving pot, or whether they answer this because they feel they are not sufficiently supported by pension providers, the government and others in making these decisions. This is an interesting area for future research which could provide clarity on policy priorities – if people feel unsupported in their decision-making in retirement, there could be scope for changes to make a difference to them – for example, through provision of more or clearer advice or guidance, or well-designed default options.
Perhaps the most worrying reason that people may not be making plans for accessing their DC pots could be a complete lack of engagement with the pension system. In fact, many people may even be unaware of having to make these types of decisions at or in retirement. Increased financial education and awareness campaigns may help, but as many examples from the UK and worldwide have shown, making a meaningful sustained difference to levels of engagement with the pension system is very difficult.6
5. Who is withdrawing their DC pension pots in full?
Out of pension pots that are accessed for the first time, administrative data (such as those presented in Figure 2) show that most people accessing their DC pension pots take them out in full, and that this is true especially for small DC pension pots. However, these data do not give us information on the overall circumstances of the individuals, including other wealth such as DB pensions and financial wealth, and other household circumstances such as homeownership and spouse’s resources.
In order to understand the wider circumstances of people who take out their pension pots in full, we can use WAS to assess how these full withdrawal amounts relate to the overall resources available to those who make them, and what the characteristics are of people who have taken out their DC pots in full.
In WAS, people are asked whether they have taken a lump sum out of their DC pension in the last two years. They are then asked whether the withdrawal represented the full pot available. In this section, we focus on the set of people who took out a pension pot in full in the last two waves of WAS, between 2016 and 2020.
It is worth noting that taking out a DC pot in full may not be the most tax-efficient way of accessing a pension, and in fact rarely is. 25% of a DC pension pot can be withdrawn without being subject to income tax, but the rest of the drawdown amount will be subject to the marginal income tax rate of the individual. There may be some people who can withdraw their pot in full without it being subject to tax, if the drawdown amount and their total income for the tax year are less than the personal allowance limit (currently £12,570). But for most, it is likely that the remaining 75% of the pot will be subject to at least 20% of tax (which is the rate for basic-rate taxpayers). There may also be some individuals, especially those taking larger pots out in full, who may end up paying higher-rate tax on part of their withdrawal, whereas if they had drawn down the pension in smaller chunks over time and across tax years they could have paid less tax in total.
Figure 13 shows the distribution of full pension pot withdrawals, both in pound amounts and as a proportion of overall wealth. We can see that the median pension pot that was withdrawn in full was worth £22,600, and 75% of full withdrawals were worth less than £47,400.
Figure 13. Size of full pension pot withdrawals
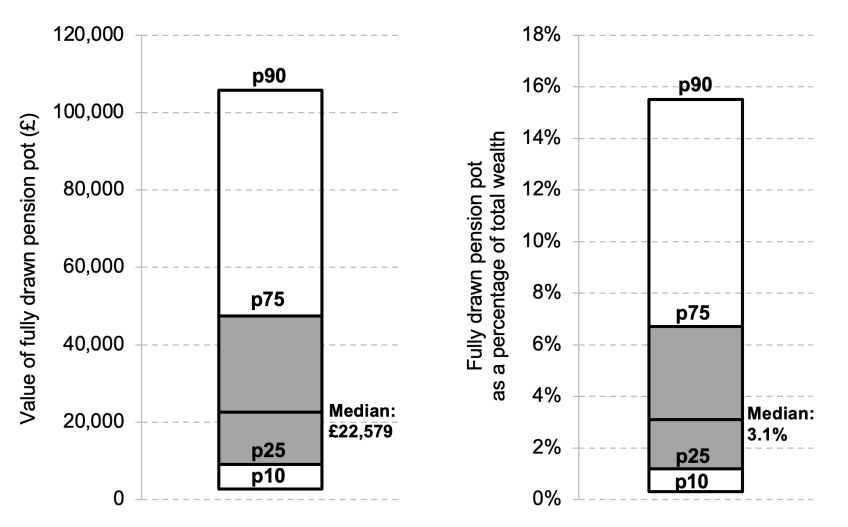
Note: Households where at least one individual aged 55–69 has fully withdrawn a DC pension pot in the last two years. Number of observations: 335.
Source: Authors’ calculations using the Wealth and Assets Survey, Rounds 6 and 7 (2016–20).
On average, these full pension pot withdrawals represent a small proportion of people’s overall resources. The median pension withdrawn fully was worth just 3.1% of the family’s total resources, and for fewer than one-tenth of households was the value of the full withdrawal more than 16% of their total resources.
Figure 14 shows what the average amounts look like across the family wealth distribution. Here we split the sample into five groups based on total family (private) wealth, and show average full withdrawal amounts in pound terms and as a proportion of total family wealth. The figure shows that average amounts are smaller among those lower down the wealth distribution, but the opposite is true when we look at those amounts relative to overall wealth – the larger average drawdowns represent a smaller proportion of total wealth at higher points of the wealth distribution.
Figure 14. Full withdrawals across the wealth distribution
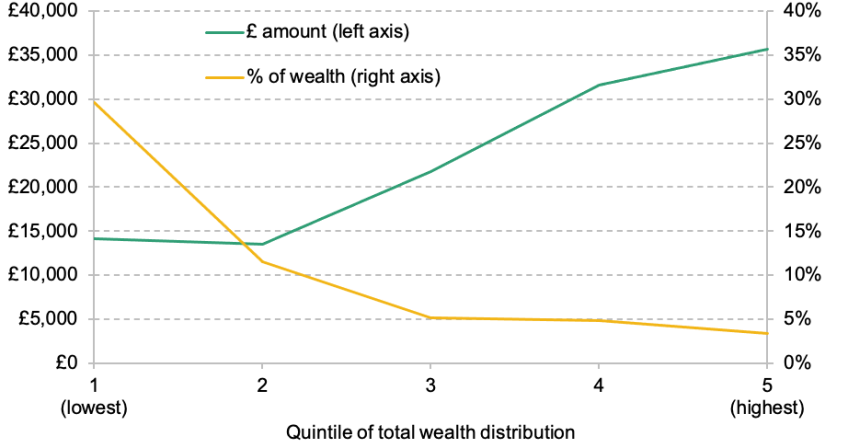
Note: Individuals aged 55–69 who have fully withdrawn a pension pot in the last two years. Position in total family wealth distribution among all individuals aged 55–69 who withdrew a pension pot in full. Sample size: 335.
Source: Authors’ calculations using the Wealth and Assets Survey, Rounds 6 and 7 (2016–20).
The fact that the full withdrawals represent such a small proportion of people’s overall wealth may indicate that the high prevalence of full withdrawals among those accessing their DC pots for the first time may be down to many of those people having other resources available to them. We can assess this further by comparing the characteristics of people who have taken out a pension pot in full and those of people who have not (but have some unaccessed DC pension wealth).
Interestingly, average total household private wealth is similar among those with fully withdrawn pots and among people of the same age who have DC pension wealth but who did not withdraw a pot in full.7
But there are differences in terms of other characteristics between people who did, and did not, withdraw a DC pension pot in full. Table 3 shows some characteristics among the group of people who have taken out a pension pot in full, compared with those who have DC pension wealth but had not taken out a pot in full. The bold figures indicate instances where the difference between the two groups is statistically significant at the 5% level.
Table 3. Characteristics of people aged 55–69 who have taken out a DC pot in full, compared with people with DC pension wealth who did not do so
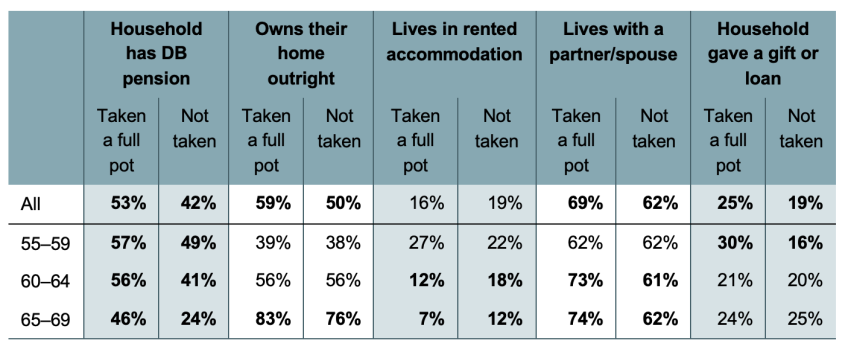
Note: Households where at least one individual aged 55–69 has fully withdrawn a DC pension pot in the last two years versus households with at least one individual of the same age with unannuitised DC wealth with no full withdrawal in the last two years. Number of observations: 335 and 3,450 respectively. Last column only uses data from Round 7 (when questions on giving gifts and loans were introduced) – sample sizes are 268 and 2,216 respectively.
Source: Authors’ calculations using the Wealth and Assets Survey, Rounds 6 and 7 (2016–20).
First, the table shows that households that took out a pension in full are more likely to have a DB pension, are more likely to own their home outright, and are more likely to live in a couple. All of these indicate that these households may have additional resources available to them for funding retirement, in the sense of having other savings and assets, or having a spouse who may also have some resources available to share. In fact, withdrawing a DC pot in full may be preferred by households that have a significant amount of DB and housing wealth, as those are annuitised sources of wealth which already provide longevity insurance for people – these households may have a preference for having more of their remaining wealth in forms that they can more easily access. This is true in particular as those with significant DB wealth may be better off using their DC pots for the tax-free withdrawal, rather than taking a tax-free lump sum from their DB pension.
Another interesting finding in Table 3 is the prevalence of households having given gifts or loans to others. WAS measures whether people have given a gift or loan worth £500 or more in the last two years. In particular when looking at the youngest group (aged 55–59), we can see that those who had taken out a pension pot in full were twice as likely to have given a gift or loan to others over this period. Boileau and Sturrock (2023) show that most gifts of this kind are given to children, suggesting that some people may be using their DC pension pots to help family members.
Which groups should we worry about?
As the findings above show, while many people are taking out pension pots in full, it seems that many of them will also have other resources available to them in retirement. But are there some people taking out their pension pots in full whom we should worry about more?
In order to make it easier to think about this question, we can use the framework illustrated in Table 4. The extent to which we may need to worry about people’s choice to draw a pension in full will depend both on whether the amount is small or large in pound terms and on whether it represents a small or large proportion of overall wealth.
Table 4. Classification of households taking out pension pots in full
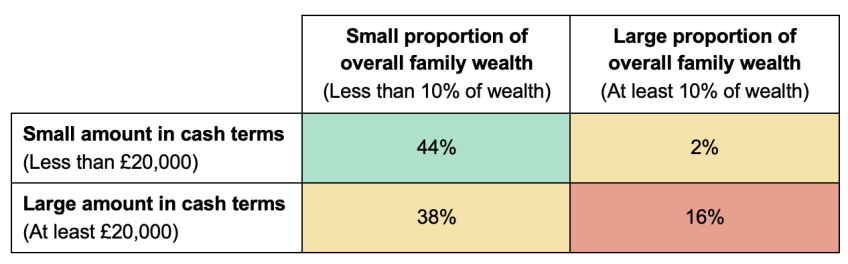
Note: Households where at least one individual aged 55–69 has fully withdrawn a DC pension pot in the last two years. Number of observations: 335.
Source: Authors’ calculations using the Wealth and Assets Survey, Rounds 6 and 7 (2016–20).
The group we arguably need to worry least about in this framework are those taking out in full a small DC pot in pound terms, for whom this DC pot also represents a small proportion of their overall wealth. These individuals will have other resources to rely on in retirement, and the small pound amount taken in full means that it is unlikely to be possible to convert it into a significant income stream in drawdown or an annuity, and that it is unlikely to generate significant extra tax payments compared with drawing down on the pension pot more slowly.
For those who take out a large amount in pound terms which represents a small proportion of their overall wealth, we may worry to some extent about the additional tax implications of withdrawing a pension pot in full. However, as the total withdrawal amount represents a small proportion of their overall wealth, their living standards in retirement may not be significantly harmed by this.
We may also have households who take out a small pound amount pension pot in full, but for whom that represents a large proportion of their overall wealth. While it is important to ensure that these people are not making withdrawals at a time when markets are such that they miss out on potential investment returns, and that they are not making decisions that may needlessly increase the tax bill they have to pay on pension pot withdrawal, any decumulation decisions will have a limited effect on standards of living in retirement due to the small pound amount the DC pots have saved in them.
This leaves one group most at risk – those who take out a large DC pot in full and for whom that large pound amount also represents a large proportion of their overall wealth. Here the risks around suboptimal decisions leading to adverse financial outcomes for decades of retirement seem the greatest.
As an indicative exercise, in Table 4 we have defined a large pension pot in pound terms as being worth £20,000 or more, and a full pension pot withdrawal of 10% or more of total household wealth representing a large proportion of overall wealth. One might think these thresholds are relatively low. But even so, the table shows that nearly half the sample (44%) are in the ‘least worrying’ group, and more than a third (38%) are in the high-wealth group of households for whom even a large pension pot only represents less than 10% of their overall wealth. Very few people are taking out small amounts that represent a large proportion of their overall wealth, leaving about 16% in the group we might be most worried about.
Comparing average characteristics among the green and red groups in Table 4, some worrying patterns emerge. In particular, those in the least worrying (green) group are more likely to have DB pensions in the household (54%) and to own their home outright (53%), compared with those in the most worrying (red) group where 33% have DB wealth in the household and 45% own their home outright. Those in the most worrying group are also on average younger: 52% of them are aged 55–59, compared with 35% of the least worrying group.
Summary
While the administrative statistics on how many DC pots are taken out in full may seem worrisome, many of the individuals taking out their pension pots in full will have other resources available to them in retirement. While only a relatively small proportion of those taking out pension pots in full at the moment are taking out large amounts that represent a large proportion of their wealth, it is likely that this group will grow over time as the prevalence and size of average DC pots start growing. This is why the time for designing policies to help those individuals is now, so that those future generations will be protected against adverse outcomes in retirement.
6. Conclusion
The introduction of pension freedoms has given individuals more flexibility over when and how they access defined contribution pension wealth. This has the benefit of giving people greater choice, but comes at the cost of requiring them to make more complicated choices, which may be difficult given low financial literacy, lack of engagement with pensions, and uncertain life expectancy. The importance of the decisions made regarding the access and decumulation of DC pension wealth is in part dependent on the amount of other annuitised resources that a family has access to. Most obviously, this will include any defined benefit pensions that a person – or their partner – has, and their entitlements to the state pension. Those who own their home outright also have something akin to an annuity income: their home can provide a flow of housing services, at no ongoing cost, through retirement.
This report has provided new evidence using data on households’ wealth holdings to understand this aspect of financial decision-making around retirement. We find that, on average, for people in their 50s with DC pension wealth, their DC pension wealth makes up only 12% of family wealth, once you take into account the state pension and housing, although there are some very high-income people with significant amounts of DC pension wealth for whom that wealth is very large compared with other wealth. Importantly, rising levels of DC pension wealth in comparison with falling DB pension participation for younger generations mean that, in future, there will be many more people with significant levels of DC pensions wealth approaching retirement.
Amongst those in their 50s and early 60s, there is a high degree of uncertainty about how they plan to access their DC pension wealth. Asked how they plan to access their pension pots, more than four in ten say that they do not know. Around 20% plan to buy an annuity, 14% plan to enter flexible drawdown, 21% plan to take chunks of cash when they need it and 8% plan to leave the pot largely untouched. People still in paid work, and those with lower total (and DC) wealth, are significantly less likely to know what they will do, and those who have used a financial adviser are more likely to report that they have a plan for what to do. Of those who do know what they plan to do, people with higher financial literacy are more likely to plan to buy an annuity compared with accessing the wealth more flexibly. Renters (social or private) are less likely to plan to annuitise their DC wealth.
Finally, we examine the behaviour of people who have withdrawn their DC pension pots in full. The median pot withdrawn in full was worth £22,600, representing 3.1% of family wealth, though slightly more than one-tenth of pots withdrawn in full were over £105,000 (and slightly less than one-tenth were worth over 16% of family wealth). People withdrawing pots in full are more likely to have DB pension wealth, own their home outright and live with a partner/spouse – all marks of more financial security. Withdrawing pots in full has the most potential to pose financial difficulties at older ages if they are both large amounts of money in cash terms and a high fraction of people’s wealth. On average, only 16% of people taking out pension pots in full took out a pot of at least £20,000 which represented at least 10% of total family wealth.
Our results have various implications for policymakers and financial services firms who manage DC pension pots and sell retirement income products. For many people, taking out large amounts of cash from a DC pension pot (including withdrawing it in full) may not be a cause for concern. This is because a large majority of those doing so have important other sources of (annuitised) wealth.
In order to protect the most at-risk groups from adverse outcomes, a key question for policymakers and industry is to determine how they could identify those groups who plan on withdrawing large amounts of cash while having only limited other resources available. While the Pensions Dashboard could – in time – show all individual pension resources in one place, it will not take into account pension wealth of a spouse, or housing wealth, both of which are very important in retirement. Given the importance of these forms of wealth, it could be beneficial if there were different guidance pathways for people based on whether they own their own home or whether they have a partner with significant (particularly DB) pension wealth.
More generally, many people approaching retirement with DC pension wealth have little idea how they will access it. Most DC pots that are currently being accessed are relatively small in pound terms, so this may not be that concerning as these will mostly be fairly ‘low-stakes’ decisions. But as younger generations approach retirement, they will have much greater levels of DC pension wealth, and less DB pension wealth (and potentially housing wealth too). It will be increasingly important that people understand the different withdrawal options, the risks that they face from either annuitising or not annuitising, and how these decisions could be affected by other resources they have.
We should have a solid policy framework in place in the next few years, so that in future, when more people approach retirement with substantial DC wealth, there are well-functioning systems that allow people to make informed decisions balancing the advantages and disadvantages of the flexibility given by drawdown or other withdrawals, and the certainty provided by annuities.
Having stronger nudges towards guidance, such as Pension Wise, and advice, not just at the time of accessing a DC pot but also earlier during working life, could help people to think earlier on about the different withdrawal options and how they fit their overall resources. But given the important set of defaults that exist in the automatic enrolment system to encourage the accumulation of pension wealth, it remains an open question as to whether there are appropriate default suggestions or decumulation paths to help people who are confused or uncertain about the appropriate way to use DC pension wealth at and through retirement.
Figure A1. Prevalence of responses to ‘How do you plan to use (the rest of) your pension pot?’, excluding ‘don’t know’ answers, by wealth group
Note: Non-proxy respondents aged 50–64 with some unannuitised DC wealth. Wealth thirds defined among those with any DC wealth aged 50–64. Wealth defined as total net private wealth at the individual level (excluding non-housing physical wealth and state pension).
Source: Authors’ calculations using the Wealth and Assets Survey, Round 7 (2018–20).
Endnotes
Authors

Jonathan Cribb
Jonathan joined IFS in 2011. His research areas includes: pensions, ageing and demographic change, public sector pay, housing, and inequalities.

Heidi Karjalainen
Heidi is a Senior Research Economist in the Retirement, Saving & Ageing sector. Her current research is on pensions and saving for retirement.
More from IFS
Understand this issue


Policy analysis


Academic research


