
Downloads
Download full report as a PDF
PDF | 6.84 MB
All chapters available separately below.
Event - 17 October 2023 from 13:00 to 14:30
We recommend watching the event on Slido by clicking here, where you can also ask questions to the panel. Click here to read Citi's disclosures.
Authored by Christian Schulz
Global growth has so far remained resilient through an extreme surge in inflation paired with one of the sharpest monetary tightening cycles in generations, which suggests that both contracting supply and expanding demand contributed to rising prices. This raises a key question for the coming 12 months: have central banks really managed a soft landing of the global economy in such a complex situation? Or is the world facing a hard landing because central banks overreacted to mostly supply-driven inflation, or because they still underestimate the shift in inflation dynamics and will have to go even further to break them?
This chapter considers the outlook for the global economy and relative likelihood of each of these scenarios.
The path to a soft landing of the global economy after the inflation surge and sharp rate hike cycle of the past two years is narrow. In the US, growth and inflation are so resilient that the Federal Reserve might be at risk of struggling to return inflation to target quickly enough, which could trigger the need for even more tightening later on. China’s economy is struggling to gain momentum and may be exporting deflationary tendencies to the rest of the world. In Europe, economies are struggling to grow even before the full impact of monetary policy has unfolded. If the European economy falls into a protracted recession, and deflationary tendencies return, the European Central Bank would need to react quickly and decisively to avoid returning to the effective lower bound. The outlook is highly uncertain, but we are now forecasting world GDP growth, excluding China, of less than 1% in 2024, fulfilling some definitions of a global recession.
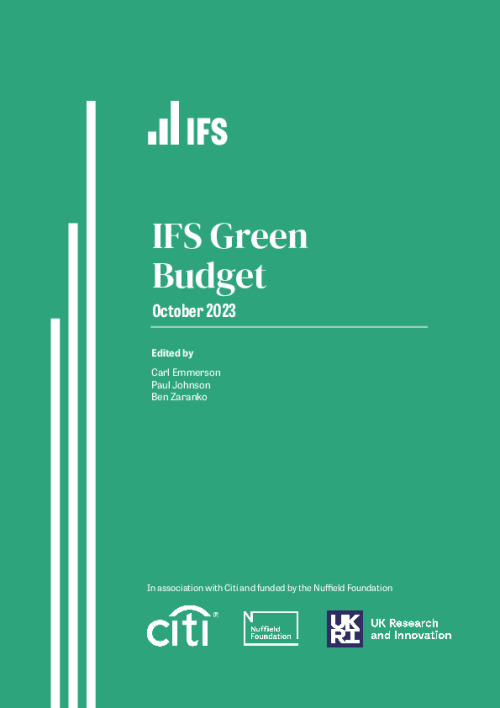
Composite inflation (year-on-year %)
Source: Haver Analytics and Citi Research.
Key findings
1. Global growth has so far remained relatively resilient through an extreme surge in inflation paired with one of the sharpest monetary tightening cycles in generations. This suggests that both contracting supply and expanding demand contributed to rising prices and raises a key question for the coming 12 months: have central banks really managed a soft landing of the global economy in such a complex situation? Or is the world facing a hard landing because central banks overreacted to mostly supply-driven inflation, or because they still underestimate the shift in inflation dynamics and will have to go even further to break them?
2. A soft landing is possible. Global inflation has fallen from more than 9% in 2022 to below 6%. Energy disinflation may have run its course, and food inflation is falling. Remaining pandemic-era supply disruptions have faded, suggesting consumer goods will get cheaper. Once wages have adjusted to higher prices, services inflation should also fall. In Europe – but not in the US – we expect inflation to fall below 2% in the second half of 2024.
3. Lower inflation, higher growth? Supply-driven inflation lowers growth, so as it reverses it should stabilise demand while at the same time allowing central banks to cut interest rates. This makes a soft landing more likely, particularly in some emerging markets in Asia and South America, where growth prospects have brightened and central banks are already cutting rates. But the path to a soft landing looks increasingly narrow – especially in the US and Europe.
4. Has the US battle against inflation only just begun? In the US, inflation is expected to stay above 2% beyond 2024. Wage growth is not normalising, and growth and the housing market are picking up despite high interest rates. The risk that the Fed has not yet done enough is significant. While the bar to significant further rate hikes is high, rates may have to stay high for longer to achieve the necessary cooling of growth and inflation.
5. Even in weak-growth Europe, inflation may not return to target quickly. Wage growth is set to remain high and services inflation usually moves in lockstep in both the Euro Area and the US. Wage growth would have to be absorbed by falling profit margins or by rising productivity growth. However, neither has been the norm in recent decades.
6. Despite strong wage growth and fading inflation, we expect the Euro Area economy to shrink for the next three quarters. Weak external demand, labour shortages, uncompetitive energy prices and the housing market are expected to weigh on growth before the full extent of the policy tightening has taken effect. In contrast to the US, there is a significant risk that the European Central Bank has already overtightened. If the Euro Area falls into a protracted recession, and deflationary tendencies return, the ECB would need to react quickly and decisively to avoid returning to the effective lower bound.
7. Global recession? Excluding China, we are now forecasting world GDP growth of less than 1% in 2024, fulfilling some definitions of a global recession. And for China we are not optimistic either. China’s economy is struggling to gain momentum as the global manufacturing cycle weighs and structural weaknesses such as demographics and high debt combine with hesitant stimulus.
8. Global interest rates are most likely to fall. Rate hike cycles are coming to an end at 4% in the Euro Area, just over 5% in the UK and just under 6% in the US. Weak growth makes rate cuts most likely from Q2 2024, especially in Europe. In the US, the risks are skewed towards higher rates for longer, however.
Read the full chapter here.
Authored by Benjamin Nabarro
The UK’s recent experience is an extreme example of a global shift in macroeconomic volatility from demand to supply. Since 2020, the economy has been subject to two major shocks. The rebound from the pandemic proved quick, but incomplete – even in light of recent revisions. The subsequent terms-of-trade shock through 2022 has meant a further slowdown. The cumulative recovery remains relatively poor.
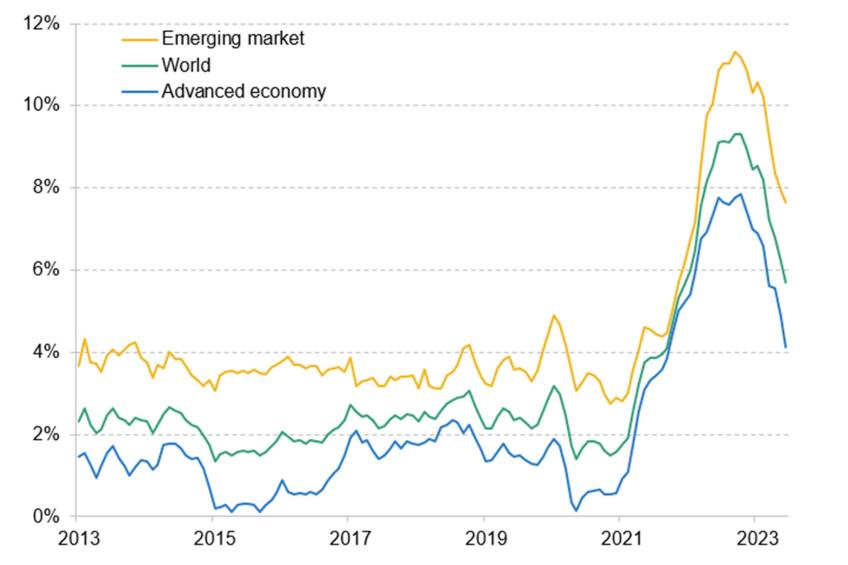
From here, the UK economic outlook hinges on three factors: first, the boost associated with the unwinding of the adverse terms-of-trade shock; second, the headwind associated with tighter monetary policy; and third, the potential for greater inflationary persistence – especially in wage setting. The first appears as though it is beginning to fade. The second, by contrast, seems only now to be gathering pace, with a big increase in housing costs still to come (see the figure). We expect the economy to slump into a recession at the beginning of 2024. The risks here remain enormous. More persistent pricing power could yet shore up economic activity in the near term, though only likely at the expense of higher interest rates and a larger recession later. From that perspective, the UK can ill afford any ill-timed electoral sweeteners: this would risk shifting the UK to a higher-inflation paradigm, and would likely need to be paid back many times over.
In this chapter, we begin by dissecting the UK’s post-pandemic recovery, before turning to a discussion of the outlook for the supply side of the economy – the labour market, wages and inflation. The interesting concluding question is where these forces leave policy. If the last 12 months were the hardest since the Monetary Policy Committee’s inception in 1997, the coming year may prove harder still, as the Committee seeks to navigate a course between embedded inflationary risks on the one hand, and the risk of a self-propagating process of balance sheet impairments on the other. If the lesson of the 1970s was ‘don’t cut too soon’, we see a growing risk that the lesson of the 2020s may be ‘don’t leave cuts until too late’.
Cumulative change in UK housing costs, relative to Q1 2022
Note: For mortgagers, these data include only owner-occupiers, so as to avoid double-counting effects with rental costs. These numbers are conditioned on Bank Rate increasing to 5.25%, and then rapid cuts from Q2 of 2024.
Source: FCA, Bank of England, ONS and Citi Research.
Key findings
1. The UK’s recent experience is an extreme example of a global shift in macroeconomic volatility from demand to supply. The UK has suffered two major shocks since 2020. The rebound from the pandemic proved to be quick, but incomplete. The subsequent terms-of-trade shock through 2022 has meant a further slowdown. Recent ONS statistical revisions paint a rosier picture of the past. But even so, UK GDP is still 5.2% short of its 2012–19 trend: a worse relative performance than either the United States or the Euro Area where the shortfalls range between 2% and 3%. Upwards revisions to the UK’s estimated post-pandemic performance, while good news, also do not translate into an improved outlook ahead.
2. From here, the UK economic outlook hinges on three primary factors: first, the boost associated with the unwinding of the adverse terms-of-trade shock; second, the headwind associated with tighter monetary policy; and third, the potential for greater inflationary persistence – especially in wage setting. The first has supported growth consistently over the past 12 months as news around the terms-of-trade shock (especially around energy prices) has turned out better, and fiscal support has remained in place. However, many of these supports now seem to be fading. And monetary policy is likely to weigh heavily over the economic outlook. Our estimates suggest that the 5.15 percentage point increase in Bank Rate might be expected to eventually reduce output relative to where it otherwise might have been by roughly 4.0–4.5 percentage points over two to three years. Credit growth has, in recent months, dropped to levels only previously observed during the post-GFC Credit Crunch, in a sign of the economic shock to come.
3. Even before the shock to credit, firms and households faced a continued squeeze. The weakness of UK corporate margins to this point has been genuinely exceptional. Unlike in the US and the Euro Area, changes in firm profit margins have made only a minimal contribution to the rate of overall inflation, and wages proportionately more. Our best estimate of firms’ bottom lines suggests that profitability remains around 3 percentage points down on pre-COVID levels. A key question for the outlook now is whether firms seek to keep prices higher as costs fall in order to repair margins, or cut back on staff. We think it unlikely households will be able to come to firms’ rescue. Even with modestly positive real wage growth, real household disposable income is likely to continue to shrink in 2024 as a result of higher interest rates and ongoing tax rises. We expect household consumption to stagnate through both 2024 and 2025.
4. Household and corporate balance sheets are no stronger in aggregate than they were pre-pandemic. While households in particular enjoyed a marked boost in net worth through 2020, in the years since, the value of both financial and housing wealth has been eroded by the surge in inflation. The implication is that net worth within the household and non-financial corporate sector is now 33 percentage points smaller as a share of total output than in 2019 (whereas it is well above pre-pandemic levels in the US). An older working population now means households are more resilient to the cash-flow effects of higher interest rates, but more vulnerable to changes in asset prices. Already, savings are rising rapidly in response to the recent balance sheet deterioration. This adds to the downside risks, with the potential for an adverse feedback effect between asset prices, demand and employment.
5. There are signs labour market dynamics are starting to shift. Unemployment has increased from 3.5% in the 2022 trough to 4.3% now. We expect an increase to 5.8% by the end of 2024. Through 2022, labour demand was particularly strong while labour supply was weak. There are signs that supply is beginning to normalise – with improvements in matching and increases in aggregate labour supply. On the demand side, there are also clearer signs that softening activity is feeding into vacancies – with most remaining demand strength now concentrated in the public sector. There are also tentative signs that some labour hoarding is beginning to ease. With the UK already close to the historical threshold at which unemployment begins to feed back into consumer confidence and demand, we see growing risks that higher unemployment (alongside higher rates) feeds back into a broader weakening in household consumption.
6. We expect a reduction in CPI inflation from 6.7% in August to a little over 4% by the end of the year – which would mean the Prime Minister meets his goal to halve inflation. None of this should be taken as a sign of complacency with respect to the inflationary risks, however. The focus now is more how far price growth can fall back through 2024 – i.e. whether inflation makes it from 4% to 2%, and whether it does so sustainably. Here the key question in our view is whether pass-through of adverse cost shocks proves symmetrical over the coming months. If so, then the scope for firms to recover margins will be limited, and prices should fall both quickly and completely. A slower reduction in inflation would create space for more near-term resilience, but also more persistent price and wage growth. This could mean more rate rises, and plausibly a longer recession later on.
7. The risks of a more disruptive inflationary scenario are very real. But from here, these appear most likely to relate to any further fiscal policy errors. If there were to be any ill-timed fiscal giveaways, they would risk shifting the UK into a higher-inflation paradigm. Any near-term fiscal boost (e.g. in the form of pre-election tax cuts) could therefore require repayment many times over, not just in higher taxation but through a protracted monetary-policy-induced recession.
8. While the risks around inflation are increasingly skewed to the upside, the risks around activity look skewed to the downside, especially in the medium term. In part this reflects the potential for more embedded inflation. It also reflects the possibility of a more meaningful adverse effect from weaker private sector balance sheets. Having delivered the sharpest monetary tightening since the early 1980s, we are in uncharted territory in terms of the potential economic spillovers. Fewer households have substantial outstanding mortgages. But more are reliant on private savings and housing wealth for their retirement. This transmission mechanism is more unpredictable, especially when global rates could remain higher.
9. This leaves monetary policymakers with a conundrum. The risk of embedded inflation means that slowing growth and higher unemployment may be insufficient for a loosening of monetary policy; instead, policymakers may want to wait for firm evidence of disinflation. The issue is that, by definition, once this is achieved, policy has been too tight for too long. In current circumstances, that is also risky – with the economic sensitivity to weaker asset prices likely greater, but also very difficult to reverse. The historical lesson since the 1970s has been not to cut rates until one is sure the inflationary risks have been contained. But a higher level of indebtedness means the policy trade-offs are now harder to navigate, and the balance of risks more two-sided.
10. The economic experience of the last three years is a harbinger of the kinds of supply shocks that are likely to come. In our view, an over-reliance on monetary policy has meant poorer policy trade-offs and a weaker overall recovery – especially when fiscal policy has remained extraordinarily loose. Long lags mean rate hikes offer only limited insurance, and often at great (and persistent) cost. And their blunt nature reduces the potential for a more investment friendly recovery, while also adding to the financial stability risks. The economic challenges of the coming decades are hard enough without persistent policy headwinds. In our view, the policy mix needs to change. We think there is a strong argument for fiscal policy to take on more of the burden of managing the risks around inflation. This should come alongside efforts to invest in greater structural flexibility. As things stand, the UK is poorly placed.
Read the full chapter here.
Authored by Carl Emmerson, Martin Miklos & Isabel Stockton
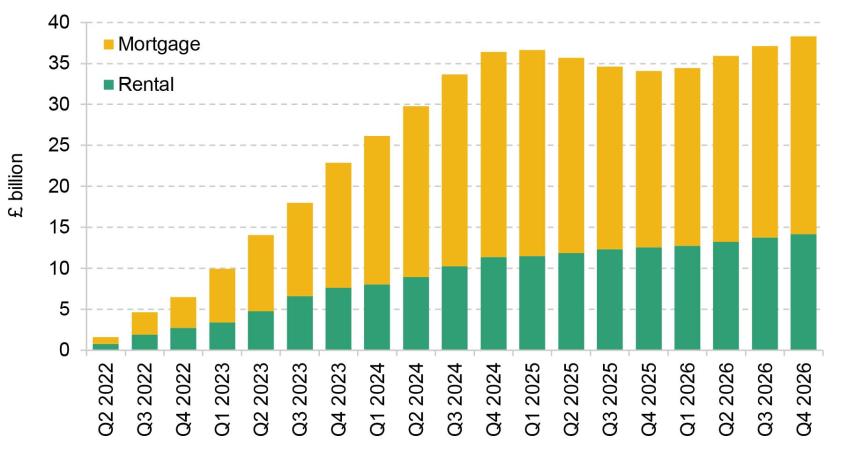
In the March 2023 Budget, the Chancellor presented an OBR forecast that had him meeting by a hair’s breadth his fiscal mandate for debt to be forecast to fall as a share of national income in 2027–28. Since March, the medium-term outlook for the public finances has, in many ways, changed quite substantially. We now expect (under Citi’s central scenario) slightly higher growth in the cash size of the economy, which will boost revenues. That is largely driven by higher inflation though, rather than higher real growth, which will also push up spending on social security benefits and public service spending (if the Chancellor wishes to maintain their real-terms generosity). These and other factors have offsetting effects on the public finances (as illustrated in the figure).
One key source of uncertainty is what will happen to interest rates: market expectations for future rates have been extremely volatile since Summer 2022. At the time of writing, these now imply £20 billion more spending on debt interest in 2026–27 than what the Office for Budget Responsibility forecast in March. However, Citi expect Bank Rate to fall more quickly, which would suggest debt interest spending could be £12 billion lower than the March 2023 Budget forecast.
All things considered, it is likely to be touch-and-go whether the Chancellor is on track to meet the letter of his fiscal rules. A lot will hinge on the precise assumptions made around the state of the economy five years hence, and what policies the Chancellor pencils in for the final year of the forecast (whether he actually plans to implement them or not).
In the current environment of high inflation and rising interest rates, tax cuts at the upcoming Budget would be extremely difficult to justify. The Chancellor should certainly avoid ‘paying for’ (certain) near-term tax cuts by pencilling in an (uncertain and difficult-to-implement) extension of the freeze to the personal tax allowance (in 2028–29) or by either tightening or extending the squeeze on public service spending beyond March 2025.
Changes to borrowing in 2027–28 between the OBR’s March forecast and Citi’s baseline scenario
Source: OBR’s Economic and Fiscal Outlook (March 2023) and authors’ calculations.
Key findings
1. The government’s fiscal mandate requires debt to fall as a share of national income between years 4 and 5 of the forecast period. While the idea of getting debt on a falling path over time has its merits, this specific target is much more poorly designed than most, such that focusing on ‘headroom’ against this target often gives a misleading impression of the health of the public finances.
2. No fiscal target is completely game-proof, or applicable to every single conceivable situation. But because it narrowly targets the change between year 4 and year 5 of the forecast, the fiscal mandate is overly sensitive to assumptions about growth, inflation and interest rates five years hence. It is also too easy to ‘game’ by pencilling in policy changes over a five-year period that the government has no intention of actually delivering. And we should remember that of the 14 Chancellors who have served over the 44 years since 1979, only three (Nigel Lawson, Gordon Brown and George Osborne) actually remained in post for more than five years.
3. The supplementary target, which requires borrowing to be forecast to be lower than 3% of national income, is very loose by UK historical standards. On virtually every occasion in the 43 years since 1980 (outside of the global financial crisis and the COVID-19 pandemic), the Chancellor at the time could have increased planned borrowing without breaching this target.
4. The welfare cap, which currently places a limit on a measure of social security spending in 2024–25, is likely to remain on course to be missed – with a big factor being the increase in the number of individuals qualifying for incapacity and disability benefits. Rather than attempting to cut around £4 billion from spending in the coming financial year to bring it back to the limit specified by the welfare cap, this oddly designed fiscal target should join many other badly designed targets in the dustbin of history.
5. At more than 40% of national income, revenues are set to reach historically high levels. In part, these are financing higher spending on debt interest, which we forecast to remain above 4% of national income this year, a level which, before last year, had not been seen since the late 1940s. Overall public spending was forecast in the Budget to be 46% of national income this year, which would be only just below the pre-pandemic peak seen in 1975–76. Even by 2027–28, spending was forecast to be 43% of national income, which would be 3% of national income above what was spent in 2007–08, prior to the financial crisis and after a decade of New Labour governments. Of this increase, 1.2% of national income is explained by debt interest spending remaining elevated.
6. Under the March 2023 forecast, borrowing would be 1.7% of national income in 2027–28. If this materialised, it would be the lowest level since 2001–02. But despite this, debt was still only forecast to fall very slightly, highlighting the difficulty of preventing debt from rising as a share of national income when growth is weak and borrowing costs are high.
7. In the first five months of the financial year, tax revenues have run £13 billion, or 3%, ahead of the forecast, reflecting stronger nominal growth in the economy. As a result, borrowing is running £11 billion, or 14%, below forecast. Under Citi’s baseline scenario, some of this persists for the next seven months, leaving borrowing at £112 billion for the year, £20 billion below the Office for Budget Responsibility (OBR)’s March forecast for 2023–24 as a whole.
8. In March 2022, the OBR forecast that debt interest spending in 2026–27 would be £47 billion, but by March 2023 it had revised this up to £89 billion. Taking current market expectations for Bank Rate alone could push debt interest spending up by a further £20 billion to £108 billion. But market expectations are volatile. And whereas markets (at the time of writing) expect Bank Rate to be around 4% in 2026–27, Citi’s forecast is for Bank Rate to fall to 2% by that year. In that case, debt interest spending would be £12 billion lower in 2026–27 than forecast in March. That is a more than £30 billion swing in forecast borrowing depending on a decision over how best to forecast interest rates.
9. The impacts of higher inflation on the public finances are nuanced and partially offsetting. If inflation proves more persistent, it will result in higher tax revenues as well as higher spending on debt interest and working-age benefits.Spending plans for public services would be less generous than intended and the Chancellor would either need to top them up, or accept a reduction in scope or quality of services. Under a range of plausible inflation scenarios, we can confidently say that borrowing will be comfortably below the 3% cap imposed by the supplementary mandate, but will also be comfortably above what was forecast in Rishi Sunak’s final Budget as Chancellor in March 2022.
10. In a weak-growth environment, stabilising debt by 2028–29 is likely to rest on pencilling in another year of extremely tight spending plans, which will be very difficult to deliver when the time comes. Larger realised losses from the Bank of England’s quantitative tightening in a high-interest-rate environment could further add to debt (although not borrowing) and hence complicate meeting the letter of the fiscal mandate. Though, as outlined above, whether or not the government has debt falling in one particular year is not a good guide to the health of the public finances.
11. The case for tax cuts is weak. If anything, given the government’s appetite for public spending, there is actually a reasonable argument for a net tax rise to be set out for implementation over the medium term. In the current environment of high inflation and rising interest rates, a fiscal loosening would be extremely difficult to justify – especially given the high and volatile costs of servicing debt. The Chancellor should certainly avoid ‘paying for’ (certain) near-term tax cuts by pencilling in an (uncertain and difficult-to-implement) extension of the freeze to the personal tax allowance (in 2028–29) or by either tightening, or extending, the squeeze on public service spending beyond March 2025.
Read the full chapter here.
Authored by Carl Emmerson, Martin Miklos & Isabel Stockton
Under the Office for Budget Responsibility’s March 2023 Budget forecast, the Chancellor was only meeting his commitment to have debt falling as a share of national income at the end of the forecast period by a hair’s breadth. This forecast is intended to reflect a ‘central’ expectation of how the public finances might evolve under current plans, but there are several policy issues that threaten this ‘centrality’. Pressures on both revenue and spending are skewed to add to borrowing over the next few years and few of these pressures are temporary in nature.
For example, over a decade of successive freezes to rates of fuel duties undermine the credibility of an OBR forecast which takes the stated policy of annual increases in line with the RPI measure of inflation as given. Freezes to income tax and National Insurance thresholds are set to push a record share of adults into paying income tax and into paying higher-rate income tax, which could lead to pressure on the Chancellor to end the planned six-year freeze early. Very tight plans for day-to-day public service spending beyond March 2025 (see the figure) and a cash freeze on public investment would be difficult to deliver and it would be far from a surprise if they were subsequently topped up.
As well as the risks over the next five years, there are pressures usually described as ‘long-term’ – though these are already materialising. Ageing of the population and cost pressures on the health and social care budgets are projected to increase spending on health, social care and state pensions by more than 5% of national income by 2050 and then continue rising. Accommodating these spending pressures would require deep cuts to spending elsewhere or a big further increase in tax. A coherent government strategy for tackling these pressures is urgently needed.
Illustrative change in real-terms day-to-day funding implied by latest plans, 2024–25 to 2027–28
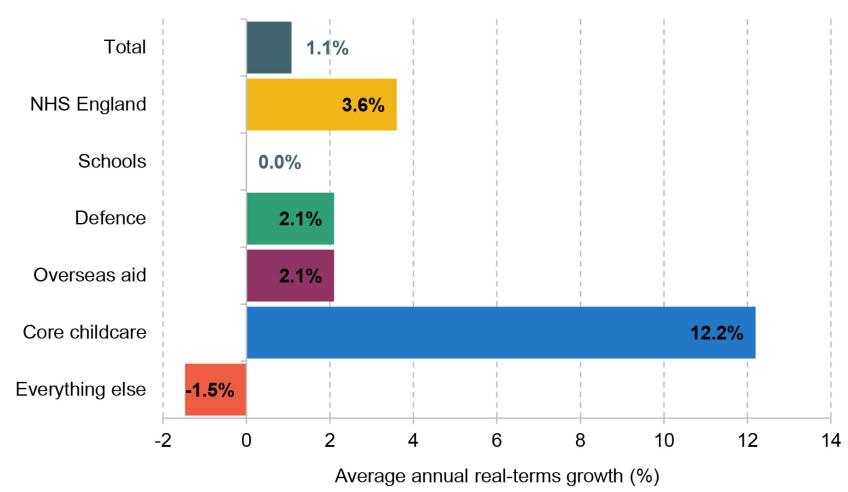
Note: Assumes defence spending and spending on overseas aid grow in line with national income and uses central estimate for NHS workforce plan funding from Chapter 8. For detailed assumptions, see Section 4.5 of this chapter.
Source: HM Treasury’s Autumn Statement 2022 and Spring Budget 2023.
Key findings
1 Under the March 2023 Budget forecast, debt was forecast to stabilise at the end of the forecast horizon, leaving no scope for additional borrowing under the government’s current set of fiscal rules. But pressures on both revenue and spending are skewed to add to borrowing over the next few years, unless difficult decisions are made on spending cuts or tax rises.
2 Perhaps the most obvious risk to the current forecast is that the government has a stated indexation policy for fuel duties that stretches credulity to breaking point. Successive freezes that can be predicted in advance are in fact worse than a stated policy of non-indexation: we not only incur substantial costs to the public finances but the official forecast, for which the Office for Budget Responsibility (OBR) takes stated policy as given, is made less credible. Freezing fuel duties at their current rates – as the government surely intends – would reduce forecast revenues in 2027–28 by £6 billion. This and other known pressures that the OBR is nevertheless unable to include in its forecast mean the official forecast is not as ‘central’ as it should be. This is harmful for transparency and makes scrutiny of fiscal plans more difficult.
3 A further fiscal risk comes from the Chancellor’s new corporation tax full-expensing policy. This has been put in place for three years (2023–24, 2024–25 and 2025–26), adding around £10 billion a year to measured borrowing in those years. Jeremy Hunt has signalled his desire for it to be made permanent. The OBR has said that it could cost approaching £10 billion a year to do this. Making full expensing permanent would add to borrowing from March 2026, but, as stated in Chapter 10, a better estimate of the eventual direct fiscal cost would be around £1–3 billion a year.
4 In an environment of high and volatile inflation, cash-terms freezes to income tax and National Insurance thresholds are now set to raise much more than expected just months ago. An up-to-date inflation forecast suggests they could raise £52 billion in 2027–28 (or £43 billion if we include the cost of the big July 2022 uplift in the point at which employees and the self-employed pay National Insurance contributions, from which the level is now frozen). This is 40% more than the OBR’s March 2023 forecast and 6½ times as much as the original package of threshold freezes was expected to raise when announced in March 2021 (£8 billion). As perhaps could have been predicted, it means much of the large increase in the personal allowance implemented during the 2010s has not proven to be sustainable: the freeze could reverse two-thirds of that increase. It could also lead to a record two-thirds of adults paying income tax (and a record one-sixth of adults paying higher-rate tax). This large increase in taxpayer numbers could lead to pressure on the Chancellor, or his successor, to end the planned six-year freeze – much longer than any previously attempted or delivered – early.
5 Provisional spending totals beyond 2025 pencil in a 1% real-terms increase in day-to-day spending on public services each year. These spending plans are far tighter than those bequeathed by then Chancellor Rishi Sunak, implying around £15 billion less spending in 2027–28 than set out in his 2022 Spring Statement, and seem incompatible with the government’s – or for that matter the Labour opposition’s – appetite to spend. After taking account of commitments on the NHS workforce, the huge expansion of state-funded early-years childcare announced in the Budget, increased spending on defence and overseas aid (to meet stated commitments) and a likely protection of school budgets, ‘unprotected’ departments would need to shoulder cuts of 1.5% per year, or £9.4 billion in today’s terms, by 2027–28. Mr Hunt has also lowered planned spending on investment, with the size of this cut relative to the spending implied by the previous plans bequeathed by Mr Sunak rising to £13 billion in 2027–28.
6 Longer-term structural factors – for example, the ageing of the population and cost pressures on the health and social care budgets – also challenge the sustainability of the public finances. The OBR projects that spending on state pensions and health and social care will increase by 5% of national income – equivalent to £137 billion a year in today’s terms – up to 2050 and then continue rising. Accommodating these spending pressures would require deep cuts to spending elsewhere or a big further increase in tax.
7 There is inherent uncertainty around these long-run projections. On the one hand, there has been a significant increase in net immigration and slowing increases in life expectancy at older ages, both of which will ease some of the pressure on the public finances in the long term. On the other hand, steadily declining fertility rates will make it harder to finance growing ageing-related spending, over and above the latest OBR projections, as they will reduce the population of working-age adults in coming decades.
8 Long-term public finances challenges around ageing, health and social care, and the transition to net zero have been known about for years, but there is a temptation to always push addressing these issues to ‘tomorrow’ – or just beyond the reach of the current forecast horizon and specific fiscal targets. However, many of the effects of an ageing population are already showing today and will only become more pressing over coming decades. A detailed and coherent government strategy for tackling these pressures is urgently needed.
Read the full chapter here.
Authored by Carl Emmerson, Isabel Stockton, Ben Zaranko and Sam van de Schootbrugge
Governments make policy choices on the basis of forecasts. This is particularly true of fiscal policy, where governments often target borrowing or debt at some future date. These forecasts are subject to considerable uncertainty, however, and are subject to frequent revisions – especially when the economy gets buffeted by shocks.
As Chancellors prepare ahead of each fiscal event, they are provided with a new set of forecasts, which contain information about how the outlook has changed since the last fiscal event. These changes can be thought of as representing ‘good’ or ‘bad’ economic news. This chapter examines whether Chancellors since 2010 have responded symmetrically to good and bad news.
Since 2010, when the Office for Budget Responsibility (OBR) has presented the government with a windfall – i.e. improved public finance forecasts – successive Chancellors have tended to spend the majority of it, mainly by topping up their spending plans. But when public finance forecasts have got worse, Chancellors have tended to accept higher borrowing, rather than announce offsetting tax rises or spending cuts. The result was tens, if not hundreds, of billions of additional borrowing over the 2010s, and a bigger state than originally planned.
Given the inevitability of future shocks and revisions to forecasts, continued behaviour of this sort will lead to a continuing upward ratchet in spending, borrowing and debt. It also means that official ‘central’ forecasts cannot really be thought of as central. Irrespective of anything else, if future Chancellors continue to behave like their predecessors, and shocks come along like they did during the 2010s, then we estimate that an appropriate central forecast for borrowing in 2027–28 would be 3.1% of GDP, rather than 1.7% under the OBR’s forecast (see the figure) – around £40 billion higher. Our simulations, based on Chancellors’ decisions since 2010, suggest that there is a nine-in-ten chance that borrowing turns out higher than the OBR forecast.
Central borrowing forecasts with symmetric and asymmetric policy responses
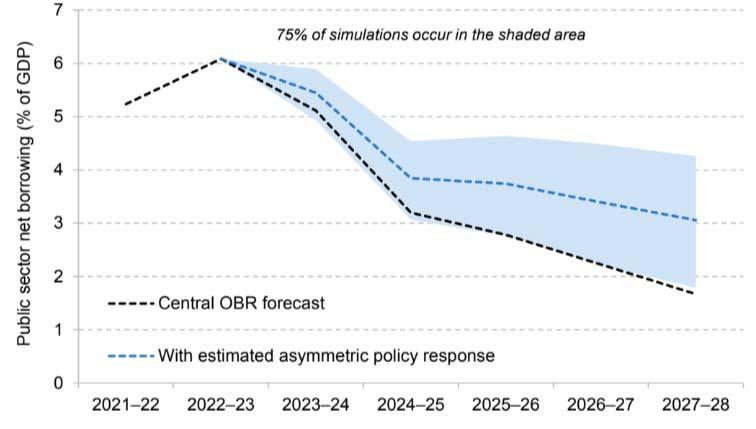
Source: Authors’ calculations using Office for Budget Responsibility, ‘Forecast revisions database’, http://obr.uk/data/.
Key findings
1. Forecasts for government borrowing are uncertain and subject to frequent revision. Over the last four decades, borrowing has turned out higher than the median forecast for that year on three-quarters of occasions. In other words, forecasts have tended to underestimate the future level of borrowing. This was particularly the case just prior to periods of economic distress, such as the early 1990s, late 2000s and the pandemic, but is true generally.
2. Forecast revisions often reflect economic ‘news’ since the previous forecast and unfortunately, since 2010, there has been more bad news than good. Across the 26 fiscal events since 2010, there have been just 8 occasions on which economic news has meaningfully improved the borrowing outlook, versus 12 where bad news has materially worsened the outlook. On 6 occasions, there was no meaningful change.
3. Chancellors often adjust their tax and spending plans in response to these forecast changes. For example, if the economic and fiscal outlook improves, it could be that the Chancellor is able to lower taxes and/or increase spending and still be on track to meet his or her stated objectives for borrowing or debt. Conversely, if the outlook deteriorates, the Chancellor might decide to raise taxes and/or cut spending to return forecast borrowing back towards the desired level.
4. It matters whether or not Chancellors respond symmetrically to good and bad news. If Chancellors respond asymmetrically to underlying changes in borrowing forecasts – for example, by spending windfall gains in the case of good news, but accommodating increased borrowing when bad news comes along – then over time, borrowing will systematically diverge from that forecast. This represents a non-trivial risk to the accuracy of borrowing forecasts, and potentially to fiscal sustainability.
5. Chancellors have not responded symmetrically to good and bad economic news since 2010. On the 12 occasions when economic conditions deteriorated meaningfully between fiscal events, Chancellors have planned to offset just over a quarter (27%) of the medium-term borrowing increase, on average, by reducing the planned level of spending and/or announcing tax rises for implementation by the final year of the forecast period. Meanwhile, when economic conditions improved, Chancellors have planned to offset an average of 60% of the windfall through higher spending and/or lower taxes.
6. This tendency for Chancellors to loosen more than they tighten in response to economic news led to tens, and possibly hundreds, of billions of additional borrowing over the 2010s. Public sector net debt at the eve of the pandemic could have been between 3% and 11% of GDP lower – with a central estimate of 7% – had Chancellors responded symmetrically to underlying forecast changes over the preceding decade.
7. Asymmetric policy responses mean that the Office for Budget Responsibility (OBR)’s central forecast is not actually ‘central’. Based on Chancellors’ past responses to shocks, and assuming good shocks are as likely to come along as bad ones, we estimate that forecast government borrowing in 2027–28 should be 1.4% of GDP higher than under the OBR’s central forecast. In 100,000 simulations of future shocks and subsequent policy responses, we estimate that there is just a one-in-ten chance that borrowing turns out lower than the OBR forecast. This is symptomatic of a wider issue facing the OBR: the requirement to take government policy as stated, rather than exercise its judgement based on past government behaviour, can make it more likely that the forecast underestimates borrowing.
8. When economic conditions improve, Chancellors since 2010 have tended to top up their spending plans, rather than use any ‘windfall’ to cut taxes. When conditions worsen, they have tended to cut back their spending plans and raise taxes. Combined, this tendency has acted to increase the size of the state over time. We estimate that if future Chancellors respond to economic news in the same way as their predecessors, the forecast for total government spending should be 1.6% of GDP higher in 2027–28 than under the OBR’s central forecast. In contrast, forecast government revenues would be just 0.2% of GDP higher in our simulations.
9. In the short term, Chancellors tend to announce a policy loosening (i.e. higher spending and/or lower taxes) regardless of whether there has been an underlying economic improvement or deterioration. This may be appropriate – depending on the nature of the economic news – but risks a further ‘ratcheting’ effect if short-term loosenings are implemented but medium-term tightenings are ever-postponed.
Read the full chapter here.
Authored by Ben Zaranko
There have been numerous calls for the UK to alter its fiscal framework to place greater weight on improving the net worth of the public sector, rather than overly focusing on the level of public sector debt. Supporters of such a shift include the current Chair of the Office for Budget Responsibility and a former Chief Economist at the Bank of England. The Labour Party has promised to ‘take greater account of public sector assets as well as debt in fiscal policy’. This all comes on the back of more than a decade of work within government to develop better and more timely measures of both sides of the public sector balance sheet.
In this chapter, we assess the relative merits of public sector net worth as a fiscal target.
There are several theoretical reasons to suppose that targeting public sector net worth might represent an improvement over a simple target for public sector net debt. It could also strengthen the incentives for governments to invest well, to better manage public sector assets, and to think about the long term. UK public sector net worth is also relatively low by international standards (see the figure), something which is often pointed to by proponents of a public sector net worth target.
There are, however, very good reasons to be cautious and to suppose that a public sector net worth target would work rather less well in practice.
All things considered, our view is that the benefits of moving to a net worth target would likely be insufficient to justify the costs involved. There might be simpler and less complicated ways of achieving some of the policy objectives espoused by its proponents, and it would likely create as many problems as it solved. In our view, it is a useful indicator, but a poor fiscal rule. At a minimum, assessments of public sector net worth would need to come alongside traditional assessments of debt, debt interest and deficits.
UK public sector net worth in an international context (selected countries, 2020)
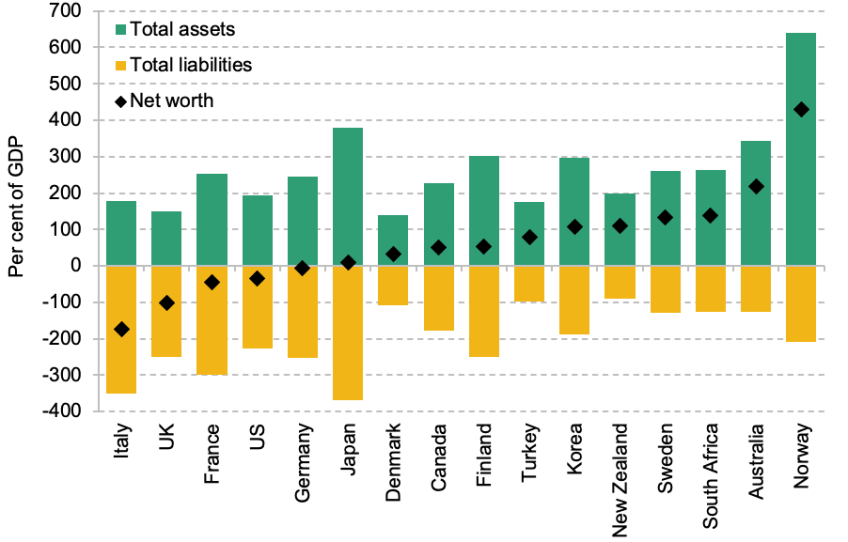
Note: Data for 2020 used for consistency, as 2021 data are available only for a subset of countries.
Source: IMF Public Sector Balance Sheet Database, accessed August 2023.
Key findings
1. The government has made a welcome investment in the development of a wider set of measures of the public sector balance sheet. There have been numerous calls for the UK to adapt its fiscal rules to place weight on a particular one of these balance sheet measures, public sector net worth. This is a statistical measure that aims to summarise what the government owns and what it owes: it captures both the government’s assets (financial and non-financial) and its liabilities. It attempts to provide a broader and more comprehensive picture of the public finances than commonly used measures of debt and borrowing.
2. UK public sector net worth is relatively low by international standards. This is driven by the UK having unusually low levels of public sector assets and unusually high public sector pension liabilities. We should be careful, though, not to equate public sector net worth with the country’s net worth, and should not over-read into such comparisons (which partly reflect different boundaries of the state and the precise set of assets and liabilities included). Nonetheless, the UK’s position at the back of the international pack is often pointed to by proponents of a public sector net worth target.
3. This is a debate worth having. Public sector net worth is a valuable addition to the set of information about the financial position and assets of the government, and to the set of measures estimated by the Office for National Statistics (ONS) and forecast by the Office for Budget Responsibility (OBR). Recent improvements in the quality and timeliness of public sector net worth measures have the potential to contribute to better policymaking.
4. In particular, there are reasons to suppose that a public sector net worth target might be preferable to a simple target for public sector net debt. Most obviously, by capturing a more comprehensive range of liabilities and assets, it can provide a more complete picture of the impacts of government action (or inaction). This is particularly advantageous when the government is considering asset purchases (such as nationalisations) or asset sales (such as of the student loan book), when a narrow focus on debt can be particularly misleading and/or unhelpful.
5. More generally, a public sector net worth target could helpfully strengthen the incentive for governments to focus on investing in high-quality projects where the value of assets created is expected to exceed the cost of financing, and could provide a framework for holding the government to account when it promises to ‘borrow to invest’ (often under the implicit assumption that such investments will pay for themselves). It could also encourage decision-makers to think more about how well public sector assets are managed and maintained, and to confront longer-term liabilities that might otherwise be ‘out of sight and out of mind’ (such as public sector pension liabilities, or the costs of decommissioning nuclear sites).
6. There are, however, good reasons to be cautious, and to suppose that – whatever its theoretical attractions – a public sector net worth target might work rather less well in practice.
7. One issue is that performance against a public sector net worth target will not necessarily tell us much – if anything – about the government’s ability to access capital markets or service its debt. That is particularly true if the change in net worth is driven by a change in the value of non-financial assets. These assets (such as the road network) are extremely difficult to value, both practically and conceptually. In many cases, the recorded value (the ‘replacement cost’) bears little relevance to the economic or social value of the asset, or to assessments of fiscal sustainability. Importantly, these assets cannot generally be sold to meet financing needs – or if they can, it would presumably be because the new private owners would be able to start charging for something (e.g. driving on a motorway) that was previously free to the public. Put differently, should an increase in the estimated value of an asset the government cannot sell really be taken as a signal that the government can afford to borrow more?
8. For that reason, more traditional measures of debt, debt interest and borrowing will remain important for fiscal policy, and ought to be considered alongside any target for public sector net worth when setting policy. Under current circumstances, traditional measures of debt and/or debt interest are at such high levels that it is they which are likely to be the binding constraint on fiscal policy, irrespective of any target for, or change in, public sector net worth.
9. A further issue is that choices over definitions and modelling assumptions matter enormously for estimates of net worth – more so than in the case of a debt target. Different definitions would likely send different signals to fiscal policymakers. Under one measure, rising interest rates (and falling market prices for gilts) have improved the UK’s public sector net worth by 40% of GDP over the past two years. On the face of it, and if we were to rely on such a measure alone, that might point to space for a substantial debt-fuelled fiscal expansion – even as borrowing costs surge and markets are being asked to absorb more gilt issuance than at any point in recent history. But under a different measure, net worth has remained effectively flat, suggesting no substantive change in the amount of fiscal headroom.
10. Whichever measure of public sector net worth is used, it would be complex and difficult to communicate. It also would not be truly comprehensive: public sector net worth ignores the state’s single greatest asset (its ability to tax future generations) and its greatest liabilities (the implicit promise to provide healthcare, pensions, education and security to future generations). For that reason, forecasts of future spending flows on things such as healthcare and pensions – as already produced by the OBR – are a more valuable tool for assessing the long-run sustainability of the public finances. We might also worry about the volatility of forecasts for public sector net worth, and the fact that they can be subject to large shifts in levels following changes in accounting parameters.
11. In our view, many of the potential advantages of a public sector net worth target stem from the fact that it would reduce the incentives for governments to engage in certain types of ‘bad fiscal behaviour’ (such as selling off public sector assets for less than they are worth in an effort to reduce public sector net debt). It would not, however, eliminate all incentives for Chancellors to engage in ‘short-termism’ or for them to allow accounting treatment to determine economic policy. And it would be possible to improve some incentives (e.g. for governments to invest only in high-return projects) without adopting a net worth target.
12. The fiscal fundamentals would remain unchanged, in any case. There would still be a need for a well-designed ‘escape clause’ to allow for countercyclical fiscal policy in a crisis; the UK would still face daunting public finance pressures; and there would still be a need for fiscal policy to be tighter in the ‘good’ times to build up fiscal buffers and provide the space to respond to adverse shocks when they arrive.
13. All things considered, our view is that the benefits of moving to balance sheet targeting might be insufficient to justify the potential costs involved. In other words, wholesale adoption of a public sector net worth target could prove to be a long walk for a small sandwich: there might be simpler and less complicated ways of achieving some of the policy objectives espoused by its proponents, and it would likely create as many problems as it solved. There is, nonetheless, a strong case for considering public sector net worth as part of a broader suite of fiscal metrics – particularly when assessing asset sales and purchases, and other balance sheet policies. The government’s Charter for Budget Responsibility already includes a commitment to do this. Labour’s proposal to ‘take greater account’ of public sector net worth appears sensible. But public sector net worth ought not, in our judgement, to be at the centre of the UK fiscal framework.
Read the full chapter here.
Authored by Arun Advani and David Sturrock
Inheritance tax is arguably the UK’s most disliked tax. There is near-universal agreement that inheritance tax in its current form needs reform, but no consensus about what that reform should be. Complaints range from saying that the tax is far too easy to avoid – because of exemptions for certain types of assets and for gifts made more than seven years before death – and so needs to be expanded, to claims that there is no justification for (further) taxing those who choose to pass on their wealth to their children and that the tax should be abolished.
Inheritance tax revenues are small, at £7 billion (or 0.3% of GDP) a year. However, we forecast that by 2032–33 they will rise to just over £15 billion in today’s prices (0.5% of GDP; see the figure), driven by increasing levels of wealth held by subsequent generations of retirees. It is therefore of growing importance that this tax is well designed.
This chapter considers problems with the current design of inheritance tax, examines the revenue and distributional consequences of potential reforms, and discusses some wider issues about how the tax system operates at death. It makes a set of recommendations for how inheritance tax, if it is to be maintained, could be made fairer and more efficient.
Even with reform, inheritance tax will not have much impact on inequalities in wealth or on intergenerational social mobility: only a small share of estates are affected by the tax; and by the time inheritances arrive, wealth inequalities by parental background are already well entrenched and hard to undo.
Inheritance tax revenues as a percentage of GDP
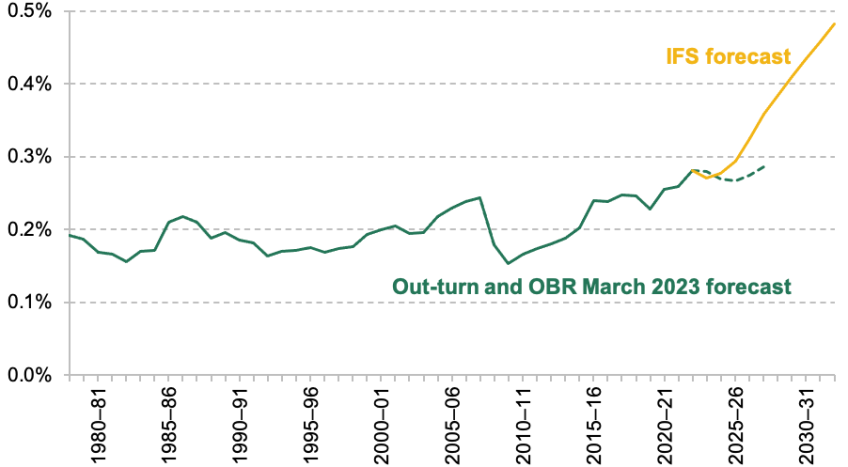
Note: Includes estate duty and capital transfer tax, the predecessors of inheritance tax. Dashed line indicates Office for Budget Responsibility (OBR) forecast. Yellow line indicates IFS forecast.
Source: OBR’s March 2023 Economic and Fiscal Outlook, IFS revenues composition spreadsheet, and authors’ calculations using the Wealth and Assets Survey.
Key findings
1. Inherited wealth is growing – and set to continue to grow – compared with earned incomes, and it will have a growing impact on inequalities by parental background. While inheritances will remain small for those with the least wealthy fifth of parents, for those with the wealthiest fifth of parents they are set to rise from averaging 17% of lifetime income for those born in the 1960s, to averaging 30% of lifetime income for those born in the 1980s. If the annual flow of non-spousal inheritances next year was equally shared across those aged 25, this would imply each receiving around £120,000.
2. Exemption thresholds, which allow many couples to pass on up to £1 million tax-free, mean that the share of deaths resulting in inheritance tax is small, at around 4% in 2020–21, but a larger and growing proportion are potentially affected by the tax. The proportion of deaths resulting in inheritance tax is set to grow to over 7% by 2032–33. The number of people affected by inheritance tax will be still larger. By 2032–33, one in eight people (12%) will have inheritance tax due either on their death or their spouse or civil partner’s death.
3. Inheritance tax revenues are small, at £7 billion (or 0.3% of GDP) a year. However, we forecast that by 2032–33 they will rise to just over £15 billion in today’s prices (0.5% of GDP), driven by increasing levels of wealth held by subsequent generations of retirees. It is of growing importance that this tax is well designed.
4. The current cost of abolishing inheritance tax would be £7 billion. Around half (47%) of the benefit would go to those with estates of £2.1 million or more at death, who make up the top 1% of estates and would benefit from an average tax cut of around £1.1 million. The 90% or so of estates not paying inheritance tax would not be directly affected by such a reform.
5. There are several problems with the current design of inheritance taxation. Reliefs for agricultural and business assets and certain classes of shares, and the total exemption of pension pots from inheritance tax, open up channels to avoid the tax and are consequently costly and inequitable and distort economic decisions. The residence nil-rate band, which gives special treatment to property passed to direct descendants, raises similar types of problems and is of greater benefit to those in London and the South. There is a clear case for eliminating the special treatment of all of these types of assets.
6. Abolishing agricultural and business reliefs and bringing pension pots within the scope of inheritance tax could raise up to around £1½ billion a year. How much revenue would be raised is uncertain and depends on various factors including whether other channels are used to avoid inheritance tax. Making these changes together would reduce the scope for substituting one avoidance channel for another.
7. Four-fifths of the tax revenue from reform to business relief could be captured just by capping the relief at £500,000 per person, rather than outright abolition. Most business wealth is concentrated among those with high wealth, so the fiscal cost of an additional half a million pounds threshold for business wealth would be low, though the special treatment would remain unfair and distortionary. Around 90% of business wealth bequeathed is given as part of an estate worth over £2 million.
8. Removing the special treatment for residential property, by abolishing the residence nil-rate band (currently set at £175,000) and extending the nil-rate band from £325,000 to £500,000 would cost around £700 million a year and hold the proportion of deaths resulting in inheritance tax down at around 4%, while making the tax system fairer.
9. A reform that capped agricultural and business reliefs, brought pension pots within the scope of inheritance tax and abolished the residence nil-rate band could fund an increase in the nil-rate band to around £525,000 or a cut in the inheritance tax rate from 40% to around 25%.
10. Increasing the nil-rate band to hold the share of deaths resulting in inheritance tax down at its long-run average of 4% would require a nil-rate band of £380,000 and cost around £900 million a year. The cost of limiting the scope of the inheritance tax system in this way would grow over time, reaching £2.7 billion by 2032–33.
11. There are other changes to taxation at death that would improve efficiency and fairness, and raise revenue. Levying capital gains tax at the point of death would raise around £1.6 billion a year. Levying income tax on withdrawals from inherited pension pots regardless of the age at which the giver passed away would also raise further revenue.
12. Inheritance tax as currently designed has only a small impact on the distribution of inheritances received and therefore on intergenerational wealth mobility. The wealthiest fifth of donors will bequeath an average of around £380,000 per child, and pay inheritance tax of around 10% of this amount. By contrast, the least wealthy fifth of parents will leave less than £2,000 per child. To have a larger impact on intergenerational mobility, inheritance tax would have to be substantially expanded in scope.
13. By the time inheritances are received, wealth inequality is already substantial. Inheritances are most often received when people are in their late 50s or early 60s. Around the ages of 50–54, children of the wealthiest fifth of parents have an average of £830,000 in wealth, while children of the least wealthy fifth have on average £180,000. While a reformed inheritance tax could do more to promote intergenerational mobility, big wealth inequalities by parental background already exist before inheritances are received.
Read the full chapter here.
Authored by Imran Tahir
The UK has seen a significant decline in participation in adult education and training. The number of publicly funded qualifications started by adults has declined by 70% since the early 2000s, and the average number of days of workplace training received per employee in England has fallen by almost 20% since 2011.
The decline in training participation – which has not been observed to the same extent in most other European countries – has been associated with declines in both public and private investment in training. Over the past two decades, total public spending on adult education has shrunk by over 30%, while surveys of employers show that their training expenditure is also falling.
In light of the large decline in training participation, and with concerns in particular about skills shortages and poor productivity, it is worth considering whether the existing skills system could be reformed and improved.
In reforming skills policy, there is a central trade-off between the cost of reform and the potential benefits. These benefits depend on the extent to which education and training induced by policy reforms are genuinely new and productive. Would the training have happened anyway, even without the reform? And will it yield economic returns?
This chapter analyses the financing of adult education and training in England through the lens of this trade-off. We explore four policy areas: the public funding of adult education, the student loan system, apprenticeship policy and the taxation of training. We then set out the lessons that can be drawn and the government’s options for reforming the skills system.
Public funding for adult education and apprenticeships in England (actual and forecast)
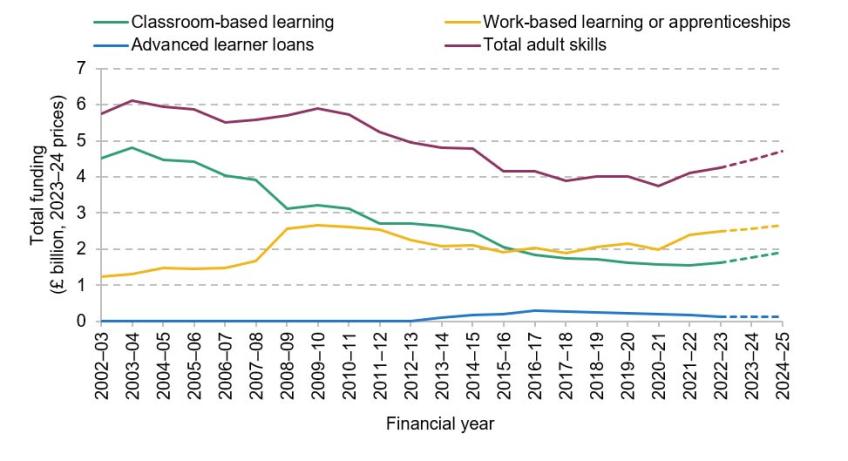
Note and source: See Figure 9.7 of the chapter.
Key findings
1. The UK has seen a significant decline in participation in adult education and training. The number of publicly funded qualifications started by adults has declined by 70% since the early 2000s, dropping from nearly 5.5 million qualifications to 1.5 million by 2020. Although the total number of adults participating in employer-provided training has remained fairly stable over time, the average number of days of workplace training received each year has fallen by 19% per employee in England since 2011.
2. The decline in training participation has occurred alongside a fall in both public and private investment in training. Average employer spending on training has decreased by 27% per trainee since 2011. Since its peak in 2003–04, public funding for adult skills has fallen by 31% in real terms, mostly as a result of a reduction in provision of low-level courses. But the historical decline in funding also reflects long-term freezes in funding rates. Funding provided for an adult learner taking GCSE English or maths has fallen by 20% since 2015–16 in real terms.
3. There are five main policy levers that this (or a future) government might look to in the adult skills policy sphere: the direct public funding of qualifications and skills programmes, loans to learners, training subsidies, taxation of training and the regulation of training. In making changes to any lever, there is a trade-off between the costs of the reform (both the fiscal cost and the cost associated with further policy churn) and the benefits, which depend on whether the reform leads to additional training that is genuinely new and productive.
4. Ensuring that public funding of adult education is well spent is key. Adult skills funding is set to increase by 11% on today’s levels, reaching around £4.7 billion by 2024–25. Given the low returns to many adult skills courses, instead of expanding the range of courses that are publicly funded, the government might more helpfully review whether increasing existing funding rates would offer a better return.
5. The student loans system is set to be reformed with the introduction of the Lifelong Learning Entitlement (LLE), which will merge the two separate loan systems that currently exist for further and higher education. In 2022–23, the amount lent to further education students (£124 million) was less than 1% of the amount lent to higher education students (£19.9 billion). The LLE has the potential to reshape the post-18 student loan landscape. However, progress in implementing the LLE has been slow. And important questions still remain about how the system will be designed, including which courses will be covered by the new loan entitlement. The government should provide clarity on the design of the LLE and ensure that it moves forward with its implementation within a reasonable time frame.
6. The government introduced the apprenticeship levy in 2017 as a means to deliver 3 million apprenticeship starts in England by 2020. This target was not met, with around 2 million apprenticeship starts between 2015 and 2020. While overall numbers of apprenticeships have fallen back, the number of higher-level apprenticeships has almost tripled since 2016, and the average duration of apprenticeships has increased by 22%. Since the apprenticeship levy was introduced in 2017, it has raised £580 million more than has been allocated for spending on skills and training across the UK.
7. The apprenticeship levy should be reformed to have a uniform subsidy rate for all employers. Currently, levy-paying employers (who tend to be bigger) benefit from a higher subsidy rate. While there is a case for subsidy rates being set according to the degree to which training is likely to be underprovided, this would be complicated and difficult to measure and implement in practice, so a uniform rate is desirable. The uniform subsidy rate should also be set at a lower level than the current rates which effectively subsidise the full cost of apprenticeship training.
8. The Labour party has announced plans to broaden the apprenticeship levy into a ‘growth and skills levy’, which will allow employers to use subsidies for non-apprenticeship training. Past experience, with schemes such as Train to Gain in the late 2000s, suggests that there is a risk of significant deadweight costs (i.e. subsidising training that would have taken place anyway). In addition, an extended subsidy would add to costs, which could perhaps be covered by lowering the existing subsidy rates.
9. At present, all spending on employer-provided training is exempt from tax, but the cost of self-funded training only qualifies for tax relief under certain conditions. The government should consider aligning the two systems by providing tax relief for self-funded training on the same basis. This would remove a disincentive for groups such as the self-employed, who are historically less likely to participate in training. Only 13% of the self-employed reported engaging in work-related training in the previous three months, compared with 28% of all employees. However, any tax change would need to be accompanied by careful regulation of training courses to avoid the risk of fraud.
Read the full chapter here.
Authored by Stuart Adam & Helen Miller
The 2023 Budget announced that, from April 2023 to April 2026, companies will be able to deduct 100% of qualifying plant and machinery investment immediately (known as ‘full expensing’) when calculating taxable corporate profits.
The government estimates that full expensing costs around £10 billion a year. But most of the up-front cost will be recouped in future years (because full expensing is instead of a stream of capital allowances, and so while companies get more tax relief up front, they get less further down the line). The true ultimate cost is much lower: around £1–3 billion for each year the policy is in place.
The design of the corporation tax base creates a range of undesirable distortions. Some of these can be seen in the figure, which shows that effective marginal tax rates (EMTRs) vary across types of assets and depending on how investment is financed.
If the full-expensing policy does end up being temporary, it will have little or no long-run effect on the UK’s capital stock.
If the full-expensing policy is made permanent, it would bring benefits, simplifying the tax system and removing the corporation tax penalty for equity-financed investment. But, in isolation, it comes with trade-offs. Notably, it creates a bias towards investing in the kinds of assets that qualify (i.e. towards investing in plant and machinery rather than other assets), and it increases the large and problematic existing subsidy for debt-financed investment – this is not good for productivity.
Our view is that making the current policy permanent would be preferable to letting it expire – but this is a finely balanced judgement.
The UK urgently needs a clear plan for a fuller reform to the corporate tax base. Policy uncertainty will hamper investment.
Effective marginal tax rates (EMTRs) on example investments with different capital allowances
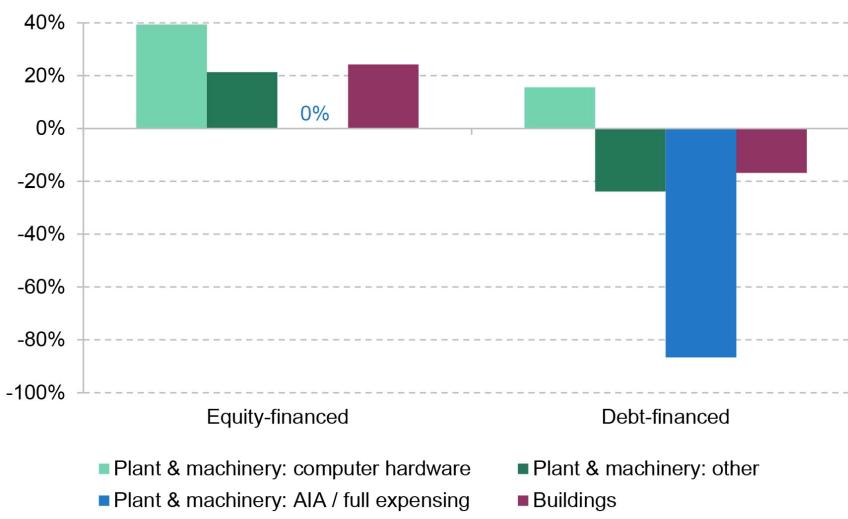
Note: Calculations assume a 5% real interest rate, a 2% rate of inflation, and depreciation rates of 37% for computer hardware, 12.6% for other plant and machinery, 17.5% for plant and machinery eligible for the AIA / full expensing, and 3.1% for buildings.
Key findings
1. Corporation tax is the fourth-biggest source of UK government revenue: the £82 billion it is expected to raise this year amounts to 8% of total government revenue. In the coming years, corporation tax revenue is forecast to reach its highest-ever share of national income.
2. For decades, UK corporation tax policy followed a broad pattern of rate cutting and base broadening. This pattern has now sharply reversed. In April 2023, the main corporation tax rate was increased from 19% to 25%. At the same time, the base was narrowed through a temporary ‘full expensing’ policy which allows companies to immediately deduct 100% of the cost of qualifying plant and machinery investments when calculating profits.
3. For now, the full-expensing policy has been put in place for three years. The government has stated a desire to make the policy permanent.
4. The design of the corporation tax base creates a range of undesirable distortions, including to the level and type of investment and to how investments are financed.
5. If the full-expensing policy ends up being temporary, it will have little or no long-run effect on the UK’s capital stock. It will bring forward some investment that would otherwise have happened later, but there is no obvious reason to want to distort the timing of investment in that way at the moment.
6. The key reason the full-expensing policy is temporary appears to be cost: the Treasury estimates an up-front cost of around £10 billion a year for each of the three years it is in place. That estimate may be correct in terms of the short-run effect on measured government revenue, but it gives a vastly inflated impression of the long-run cost of the policy. Most of the up-front cost will be recouped in future years (because full expensing is instead of a stream of capital allowances). Accounting for this, the true ultimate cost is around £1–3 billion for each year the policy is in place. There is a risk of letting short-run scorecard impacts govern long-term policy choices.
7. If full expensing is made permanent, it would bring benefits, simplifying the tax system and removing the corporation tax penalty for equity-financed investment. But, in isolation, it comes with trade-offs. Notably, it creates a bias towards investing in the kinds of assets that qualify (i.e. towards investing in plant and machinery rather than other assets), and it increases the large and problematic existing subsidy for debt-financed investment – it makes even more unprofitable projects viable. This is not good for productivity. Our view is that, on balance, making the current policy permanent would be preferable to letting it expire – though neither is ideal.
8. Ideally, the full-expensing policy would be made permanent as part of a broader reform package that extended full expensing to all investment and changed the treatment of debt interest payments. There are several ways to move towards a well-designed corporation tax base.
9. Uncertainty is bad for investment. The government – and the opposition – should set out a clear long-term plan for corporation tax.
Read the full chapter here.
More from IFS
Understand this issue


Policy analysis


Academic research


