
Downloads
Download report PDF
PDF | 464.32 KB
Executive summary
One of the government’s key public service priorities is to cut waiting times for elective (pre-planned) NHS care in England. The government has committed to achieve the NHS constitutional standard that 92% of patients should wait no longer than 18 weeks for elective hospital treatment. Despite the high-profile nature of this target, the dynamics and drivers of changes in waiting times are not well understood. It is therefore difficult to assess how likely the government is to meet this target and how different policy choices might affect its chances of doing so. In this report, we set out to fill this gap. We develop a simulation model of NHS elective waiting times in England that estimates how the full distribution of waiting times could change over time under a range of scenarios. We use this model to set out the impacts of potential policy choices facing the government, and to assess the plausibility of the government reaching the target by the end of this parliament.
Key findings
- The government has committed to returning to the NHS constitutional standard that at least 92% of patients should wait no longer than 18 weeks for elective (pre-planned) hospital treatment in the English NHS. This target is currently far from being met: at the end of December 2024, 59% of patients waiting for elective NHS treatment had been waiting less than 18 weeks. The target has not been met since September 2015.
- There is no simple relationship between the size of the waiting list – the number of people waiting – and waiting times. The relationship between the size of the waiting list and performance against the 18-week waiting time target is even more complex. A shorter waiting list is in general associated with lower waiting times, but this is not always the case. For example, 18-week performance (the proportion of patients waiting less than 18 weeks) was 59% in September 2007, 71% in April 2020 and 90% in July 2017. But in these three months, the total size of the waiting list was almost identical at 4 million.
- Increasing the number of patients treated from the waiting list will reduce waiting times, as a greater number of patients can be seen more quickly. But our model suggests that plausible increases in treatment volumes can only take you so far. In our central scenario, in which the NHS increases treatment volumes by 3.5% per year, we estimate that – without any other changes – 74% of patients would wait less than 18 weeks for treatment by mid 2029, a big improvement but still far from the 92% target.
- We estimate that treatment volumes would need to grow by 4.9% per year in the absence of other changes to reach the 18-week target by the end of the parliament. For comparison, the average annual growth rate pre-pandemic (from 2016 to 2019) was 2.4%, and the growth rate in 2024 was 3.8%. Sustained annual increases of 4.9% would be more than double the average growth rate of the 2010s. It will therefore be very challenging for the government to achieve the 18-week target by increasing treatment volumes alone.
- One way to increase treatment volumes would be to make hospital activity more efficient at ending waiting list pathways (or, equivalently, to reduce the average number of hospital appointments needed to complete a treatment). The average number of outpatient appointments and inpatient admissions required for a patient to leave the waiting list has increased significantly since 2019, likely in part due to patients needing more complex treatment. The government has planned to reduce ‘unnecessary’ follow-up appointments. If this ratio of hospital activity to completed waiting list pathways could be reduced to its 2019 levels, hospital activity would only need to grow by an average of 3.2% each year to deliver the 4.9% growth in treatment volumes required to meet the target (absent any other changes).
- Waiting times also depend on how many patients are referred to join the list: if there are more people in the queue, everyone who subsequently joins can expect to wait longer. The NHS plans to reduce referrals to the waiting list, primarily through greater use of Advice & Guidance diversions (where GPs consult hospital doctors on whether there are alternative community treatment pathways for patients, rather than them being referred onto the elective waiting list). Combined with our central scenario of 3.5% annual treatment volume growth, we estimate a plausible reduction in demand could mean 18-week performance climbs to 82% by mid 2029 (relative to 74% without demand reduction). However, policies that aim to reduce referrals also come with the risk that patients who need care cannot access it.
- How hospitals choose to prioritise which patients they treat from the waiting list also affects waiting times. Prioritising those with longer waiting times would improve performance against the 18-week target. We model one potential change in prioritisation (where patients who have been waiting for longer would be bumped towards the front of the queue), which combined with our central scenario of 3.5% annual treatment volume growth could mean 18-week performance climbs to 78% by mid 2029 (relative to 74% without reprioritisation). Such a change would come at the cost of patients who would otherwise have been seen more quickly, the patients who often have the greatest clinical need for treatment.
- Taken together, our analysis suggests that achieving the 18-week target by the end of this parliament will require concerted policy action on several of these dimensions at once. No single policy lever will likely be enough by itself. In one scenario we consider – 4.5% annual increases in treatment volumes (almost double the pre-pandemic rate of growth) – efforts to reduce demand and greater prioritisation of patients with long waits would be enough to achieve the 18-week target by early 2029. While this is firmly within the realms of possibility, our assessment is that the government will substantially improve waiting times, but it is more likely than not to miss its target to have 92% of patients seen within 18 weeks by the end of the parliament.
1. Introduction
At the 2024 general election, both the Labour and Conservative parties committed to improve NHS performance in England, including returning to the NHS constitutional standard that patients needing elective (pre-planned) care should be treated within 18 weeks of referral (Labour party, 2024; Conservative party, 2024). Ensuring that 92% of patients are waiting less than 18 weeks – the operational target of the constitutional standard – is now a major priority for the government (Prime Minister’s Office, 2025a). As shown in Figure 1, this standard was last met in September 2015, and performance against the target has since deteriorated gradually before a sharp fall during the pandemic.
Yet despite the political consensus on the desirability of achieving this target, and its prominence as part one of the government’s missions, there is little evidence on what it would take to meet the 18-week target.1 This is because waiting times are determined by a range of factors and the interaction between them.
One of these factors is the size of the waiting list: how many people are waiting for treatment. This measure is simpler than waiting times measures, as it is determined entirely by the numbers of people who join and leave the waiting list each month. This was the focus of the previous government and the subject of most previous modelling, including our own (Warner and Zaranko, 2024).
But for understanding waiting times, and thus performance against the 18-week target, it also matters which patients are treated, and how long they have been waiting when they are. There is no simple relationship between the size of the waiting list and the distribution of waiting times. The NHS could – at least in theory – meet the 18-week target with any size of waiting list, making it difficult to estimate how much the NHS needs to increase activity to deliver the target.
To illustrate this point, Figure 2 shows the state of the elective waiting list since 2007 (when current measurement began). The horizonal axis shows the total size of the waiting list, while the vertical axis shows the percentage of patients waiting less than 18 weeks. The most recent point, December 2024, is shown in yellow.
There is no clear relationship between the list size and waiting times in this period. Although the relationship is broadly negative – periods with fewer waiters tend to be those with shorter waits – the relationship is non-linear and looking at different periods could lead to very different conclusions. For example, when the waiting list fell from 4 million to 2.5 million in 2007–08, the proportion waiting less than 18 weeks improved rapidly from around 60% to around 85% (the steep line of points heading north-west up the left-hand side of the graph). Yet 18-week performance has remained around 60% since 2022, despite the list size varying between 6.1 million and 7.8 million (the cloud of points on the right-hand side). The waiting list has had 4 million waiters on multiple occasions since 2007, but with patients facing very different waiting times in each case (for example, 18-week performance was 59% in September 2007, 71% in April 2020 and 90% in July 2017, while the list in all cases stood at 4.0–4.1 million). Expanding the amount of hospital activity the NHS can deliver will reduce the size of the waiting list, but it is clearly far from simple to infer what could happen to waiting times in response.
In this report, we set out to shed light on the relationship. We develop a simulation model of the elective waiting list in England, to allow us to calculate measures of waiting times as well as the total size of the waiting list. We model how both referrals and activity could change over time, under a range of assumptions, and consider explicitly how the NHS might choose to prioritise different groups of patients.
Our results suggest that achieving the target will require significant policy action along a range of dimensions. Increasing the amount of elective activity the NHS can deliver will be an important part of any plausible path to achieving the target. But our findings suggest that even activity growth far above the recent historical average could still fail to deliver the target of 92% of patients waiting less than 18 weeks by the end of the parliament. In other words, plausible increases in hospital activity will likely not be enough, and the government will need to consider other policy levers. We set out a range of scenarios that consider changes to prioritisation rules, and reductions in the number of referrals to the waiting list, under which the target could be met. Meeting the target is not impossible, but would require concerted policy action along several dimensions at once, and none of these actions would be costless or without losers.
The rest of this report is organised as follows. In Section 2, we explain how the 18-week target is defined. In Section 3, we outline the different ways in which the government could achieve the target and we review the plans that NHS England has set out in each of these areas. In Section 4, we present the results of our simulation model and discuss the policy changes that could be needed to achieve the target. Section 5 concludes.
Throughout this report, we take the 18-week target as given. Future work will examine whether this is the best way to measure and improve elective waiting times.
2. The 18-week target and the elective reform plan
What is the 18-week target?
The NHS Constitution states that patients should wait no longer than 18 weeks to start treatment for non-urgent conditions (Department of Health & Social Care, 2025). This is the basis of the government’s headline target that patients should wait less than 18 weeks for elective (pre-planned) activity. While this target is relatively simple in principle, in this section we outline several important details about how the target is defined in practice.
Since 2007, elective waiting times have been measured on a referral-to-treatment (RTT) basis. On this measure, waiting begins when a patient is referred to a hospital for treatment, typically by their GP. Waiting ends when the patient’s course of treatment substantively begins – for example, if they have an operation or start a course of outpatient appointments. This way of measuring waiting times means that any time spent waiting to see a GP, or any time spent waiting for follow-up appointments once treatment has started, is not included.
In general, while measuring the size of the waiting list is simple, there are a range of different ways to summarise average waiting times in a given month. One approach is to focus on the patients who have received treatment in a month and measure the length of time between them joining and leaving the list (referred to as complete waiting times). Another approach is to focus on patients who are still waiting for treatment at the end of the month and measure the length of time between joining the list and the end of the month (referred to as incomplete waiting times). Since 2015, performance has been measured only using incomplete waiting times – the amount of time that patients who are yet to receive treatment have been waiting (Keogh, 2015).
When the government talks about returning to the 18-week standard, it therefore means that in a given month, patients who are still waiting for treatment should be waiting less than 18 weeks, rather than that the patients who are treated in that month should have been waiting less than 18 weeks at the point they received treatment. Although a somewhat subtle distinction, this is an important difference when it comes to measuring and improving performance, and each target creates different incentives for hospitals. In December 2024, 66% of patients treated that month were treated within 18 weeks. But 59% of patients still waiting had been waiting less than 18 weeks. It is this second measure that the government uses to measure 18-week performance.
In practice, it is unlikely that the NHS would ever be able to ensure that 100% of patients wait less than 18 weeks. For example, it may be that some patients choose to wait longer or that some forms of complex treatment need more time to schedule. The NHS therefore has long had an 8% tolerance built into the target (though, in practice, far more than 8% of patients have been waiting for longer than 18 weeks in any given month over the last decade). This means that the operational 18-week target is that 92% of patients should be waiting less than 18 weeks in a given month (NHS England, 2025c).
What has the government said about the 18-week target?
During the general election campaign, the Labour party committed to returning performance to many of the NHS constitutional standards. The Labour manifesto stated that ‘patients should expect to wait no longer than 18 weeks from referral for consultant-led treatment of non-urgent health conditions’ (Labour party, 2024). As a first step, the party promised to deliver an extra 2 million operations, scans and appointments each year, which the government has now achieved (Prime Minister’s Office, 2025b). After taking office, the government recommitted to achieving the 18-week target and in January the Department of Health & Social Care (DHSC) and NHS England published their plan to reform elective care.
The elective reform plan published in January (Department of Health & Social Care and NHS England, 2025) committed the NHS to meeting the 18-week standard by March 2029. It also included two new intermediate targets: that the percentage of patients waiting less than 18 weeks would hit 65% by March 2026; and that every NHS trust needs to deliver a minimum 5 percentage point improvement by the same date. Later in January, NHS England published its 2025–26 priorities and operational planning guidance (NHS England, 2025b). This guidance included two additional targets: first, that the percentage of patients waiting no longer than 18 weeks for a first appointment would increase to 72% by March 2026, with every trust expected to deliver a minimum 5 percentage point improvement; and second, that the numbers waiting over 52 weeks for treatment would fall to less than 1% of the total waiting list by March 2026.2 Although these targets are important, in this report we focus on the final, headline 18-week target.
The plan outlined four key ways that these improvements to elective performance would be achieved: first, by empowering patients through improving access to information and appointment management tools (e.g. on the NHS App) and choice about when and where they receive care; second, by reforming delivery so the NHS delivers more elective activity more productively, which includes expanding surgical hubs and community diagnostic centres and working with the private sector; third, by delivering care in the right place, which includes an expansion of activity in the community where possible, instead of patients joining the waiting list for elective activity; and fourth, by aligning funding, performance oversight and delivery standards, by increasing financial incentives, expectations and oversight. In the next section, we discuss how some of these plans may impact performance against the 18-week target.
3. Three ways to achieve the 18-week target
There are three main types of ways that the government and the NHS can use to achieve the 18-week target. They can increase the number of patients leaving the waiting list (normally after treatment); they can change which groups of patients on the waiting list receive treatment first; and they can reduce the number of patients joining the waiting list. In this section, we outline these three routes, discuss relevant parts of the NHS elective reform plan and identify the potential challenges and trade-offs these policies imply. In Section 4, we estimate how each route could affect performance against the 18-week target over the next five years.
Increase the number of patients leaving the waiting list
The most obvious policy to reduce waiting times is to increase the number of patients treated from the waiting list. Intuitively, the more patients that the NHS can treat each month, the shorter the waiting list becomes over time and the less time patients will have to wait before reaching the front of the queue for treatment. As we discussed in the introduction, the link between the size of the waiting list and the 18-week target is not a direct 1:1 relationship. Nonetheless, in general, we would expect greater treatment volumes to reduce waiting times in the medium and longer term.
There are two ways to increase treatment volumes from the waiting list. The most direct is to increase hospital activity. If hospitals can deliver more outpatient appointments and inpatient surgeries, then they can treat more people from the waiting list. To increase hospital activity requires either an improvement in NHS productivity or an expansion of the funding and inputs to hospitals. The NHS has in recent years struggled to increase activity and productivity (Warner and Zaranko, 2023) after a sharp fall in both during the pandemic, though there are now early signs that productivity is growing again (Harvey-Rich, Warner and Zaranko, 2024). The elective reform plan (Department of Health & Social Care and NHS England, 2025) outlines a number of ways to achieve a further increase in activity. These include expanding surgical hubs, community diagnostic centres and partnerships with the private sector.
But increasing hospital activity is not the only way to increase treatment volumes from the waiting list. An alternative approach is to make hospital activity more ‘waiting list efficient’. Patients on the waiting list often have multiple contacts with hospitals – for example, several outpatient appointments for a course of treatment, or outpatient appointments before and after a hospital admission. Reducing the number of interactions patients need to have with hospitals before leaving the waiting list would mean that the same amount of hospital activity – i.e. the same number of appointments – leads to more patients leaving the waiting list. If patients’ medical conditions can be resolved with fewer hospital episodes, that itself would represent a form of increased productivity.
The elective reform plan explicitly aims to reduce ‘unnecessary follow up appointments’, in part by rolling out patient-initiated follow-up appointments across all major medical specialties. This allows patients to initiate follow-up appointments only when they need them, reducing the number of outpatient appointments as fewer are booked by default. The plan also aims to increase the incentives for activity that ends a patient’s wait for care.3 While it is clearly attractive to reduce genuinely unnecessary hospital activity, the potential risk here is that some of the avoided activity would have been valuable, potentially leading to a lower quality of care and worse health outcomes for some patients.
Change how to prioritise different patients on the waiting list
An alternative route to improving performance against the 18-week target is to change how hospitals choose which patients to treat next from the waiting list. In general, and for good reason, hospitals have a lot of discretion about which patients they treat next – it is not decided on a ‘first in, first out’ basis – and often take into account both medical need and the length of time already waited. The NHS Constitution states that people should be treated ‘at the right time and according to their clinical priority’ and that patients with urgent conditions should receive treatment more quickly (Department of Health & Social Care, 2025).
As discussed in Section 2, performance against the 18-week target is currently measured using ‘incomplete’ waiting times, i.e. the share of patients at the end of the month still waiting for treatment who have been waiting less than 18 weeks. This measure encourages hospitals to treat patients who have been waiting for longer than 18 weeks.
For example, consider a hospital that must choose between treating a patient who has been waiting for 10 weeks and a patient who has been waiting for 20 weeks. Treating either patient will lower the waiting list. But treating the patient who has waited for 20 weeks will improve performance against the 18-week target that month (it would mean one fewer patient breaching the 18-week standard), while treating the patient who has waited for 10 weeks would actually worsen performance against the 18-week target that month (the number of patients waiting longer than 18 weeks is the same, but they now represent a greater percentage of the overall waiting list).4
This simple example suggests that for the same number of patients being treated, the NHS can improve performance against the 18-week target by treating more patients who have been waiting longer than 18 weeks and fewer patients waiting less than 18 weeks – in other words, by reprioritising who receives treatment from the waiting list.
In practice, most patients are currently being treated within 18 weeks: 66% of patients treated in December 2024 waited less than 18 weeks. This suggests that major improvements could be made to the 18-week target by treating fewer of these patients each month, and treating more of those waiting more than 18 weeks.5 There is, however, a clear trade-off. Treating more patients who have been waiting over 18 weeks means that other patients who would otherwise have received treatment more quickly end up waiting longer. Often, these are the patients with the most severe medical needs: there is a reason they are treated sooner.
The elective reform plan does not explicitly set out plans to change how hospitals prioritise patients. This is in sharp contrast to the 2022 elective recovery plan (NHS England, 2022), which had explicit targets for hospitals to prioritise treatment to patients waiting longer than two years, a year and a half, a year and a quarter, and then a year. One exception is that the new planning guidance for 2025–26 does include a supplementary target to reduce the number of patients waiting more than a year to less than 1% of the total waiting list (NHS England, 2025b). But this focus on prioritising long waiters is seemingly a much lower priority than under the previous government.
Reduce the number of people joining the waiting list
The final route to improving performance against the 18-week target is to reduce the number of people joining the waiting list. Just like increasing the number of people leaving the waiting list, this will over time reduce the size of the waiting list, which will then reduce waiting times.6 The risk is that there may be people who still genuinely need care but are unable to join the list.
The elective reform plan explicitly aims to reduce the number of people joining the waiting list, by using Advice and Guidance services so patients can ‘receive the care they need in primary and community care settings, as opposed to being added to the elective waiting list’. Advice and Guidance services allow GPs to talk to a specialist prior to referring a patient onto the waiting list, with the goal of reducing the number of joiners because the specialist can often recommend alternative treatment paths.
4. Scenarios for 18-week performance
We now turn to estimating how the three routes discussed above could affect performance against the 18-week target over the next five years. To do this, we must make assumptions about what could happen to treatment volumes, prioritisation patterns and the number of new referrals over time. In this section, we first detail how we reach these assumptions, using both past trends and the NHS’s own plans, described in the previous section.
We then combine our assumptions into different scenarios and quantify what each set of assumptions would mean for 18-week performance. To do this, we develop a simulation model of the state of the elective waiting list. Box 1 provides a brief overview of the model, while the methodological appendix provides more details.
Box 1. Our simulation model of NHS waiting times
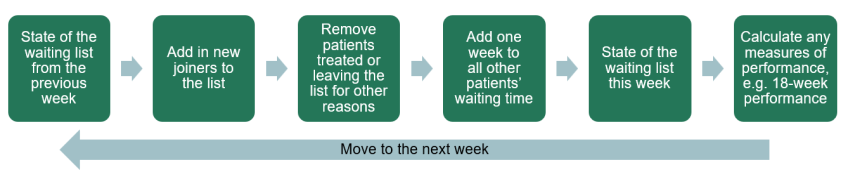
Our model starts by taking the full distribution of incomplete waiting times at the end of December 2024, using publicly available NHS referral-to-treatment waiting times data (https://www.england.nhs.uk/statistics/statistical-work-areas/rtt-waiting-times/rtt-data-2024-25/). This distribution is the initial state for all runs of our model. We then simulate how this distribution could change over the next five years.
For each week over the next five years, we first add a projected number of new joiners to the waiting list, based on our assumption about the number of referrals to the list. We then remove a projected number of leavers, based on our assumptions about the number of patients treated by the NHS and the number of patients leaving the waiting list for other reasons. Importantly, our model uses not just the total number of patients leaving the waiting list, but also the number of weeks they have been waiting prior to leaving. We therefore have to make assumptions over how the NHS prioritises patients who have been waiting different lengths of time. Then, for any patients who do not leave the waiting list, we increase their recorded wait by one week in each period.
This process generates an estimate of the full state of the waiting list in each period, from which we can calculate any target measure, such as the total list size, the median wait length or the proportion of those waiting who have waited less than 18 weeks. Figure 3 provides a graphical summary of this process.
Figure 3. Overview of the model process
More details of our methodology are available in the methodological appendix.
We start by considering the effects of increasing treatment volumes on 18-week performance while holding new joiners and prioritisation decisions constant at their current levels. We then consider the potential impacts of changing these two inputs alongside treatment volumes.
The effect of increases to treatment volumes
As discussed in Section 3, the most obvious route to achieving the 18-week target is to increase treatment volumes. Here we quantify what increase in treatment volumes might be needed to achieve the target. We hold all other inputs into the model constant at their current levels. In practice, this means that we assume:
- the growth rate for new referrals to the waiting list is constant at 1.4% each year, which was the rate in 2024;
- that 3.3% of the total waiting list leaves for other reasons each month, again as seen in 2024 (and, indeed, the previous three years);
- that the relative priority of different groups of patients for treatment is unchanged from 2024, such that the only thing we vary is the total number of patients treated.
We consider three scenarios for treatment volumes: low, medium and high growth. The average annual increase in activity in the years before the COVID-19 pandemic (from 2016 to 2019) was 2.4% each year. In our low scenario, we assume 2% annual growth in activity, equivalent to annual treatment volumes growing from 18.0 million in 2024 to 19.9 million in 2029. In our medium scenario, we assume 3.5% annual growth: this is above the pre-pandemic average, but slightly below the 3.8% annual growth rate seen in 2024. This growth rate would see treatment volumes from the waiting list reach 21.4 million in 2029. Finally, in our high scenario, we assume 4.5% annual activity growth, equivalent to annual treatment volumes reaching 22.4 million in 2029. We have not seen sustained activity growth this high in any recent period except in the immediate recovery from the pandemic, but this rate of growth could be possible if hospital activity becomes more ‘waiting list efficient’, as discussed in Section 3.
For each of these three activity growth scenarios, Figure 4 shows our model’s predictions for how 18-week performance and the overall waiting list size change over time. Although performance improves in each case, in none of them does performance reach the 92% target by the end of the parliament.
In the medium growth scenario (3.5% annual growth, shown by the yellow line), performance against the 18-week target only reaches 73% by mid 2029, still lower than on the eve of the pandemic. In this case, the waiting list reaches 4.6 million by mid 2029.
In the low growth scenario (2% growth, shown by the green line), 64% are waiting less than 18 weeks at the end of the parliament, with the list size still above 6.7 million. This is a small improvement on current performance, but far from the target.
Even under 4.5% annual growth in treatment volumes (shown by the blue line), only 84% of those on the waiting list have been waiting less than 18 weeks by mid 2029. This is despite the waiting list more than halving over the parliament, to reach 3.5 million by mid 2029.
In the absence of other policy changes, we estimate that treatment volumes would need to grow by 4.9% each year to reach the target by the end of the parliament. This would be more than double the average growth rate of the 2010s (1.9% per year), and higher than growth in any single year of that decade. It would be equivalent to growing annual treatments from the waiting list from 18.0 million in 2024 to 22.9 million in 2029.
Nonetheless, achieving annual growth of 4.9% in treatment volumes would not be impossible: with significant increases in resources, productivity and ‘waiting list efficiency’, it could be feasible to achieve the 18-week target in this way. For example, the average number of appointments and hospital admissions per completed pathway has risen from 6.2 in 2019 to 6.7 in 2024, likely in part due to rising patient severity. If the plans to reduce unnecessary elective activity could offset this rise, and reduce this ratio back to its 2019 level, we estimate that hospital activity would only need to grow by an average of 3.2% each year to deliver 4.9% annual growth in treatments from the waiting list.
Indeed, in the best-performing five years of the 2010s (2013 to 2018), the average growth rate in treatment volumes from the waiting list was 3.6%. Looking further back, a 4.9% annual growth rate would be slower than activity growth rates achieved in the 2000s (although the measurement of the waiting list was different). In 2009, the first year where we can calculate a comparable growth rate, treatments from the waiting list grew by 6.5%. This whole period, however, was one with rapid growth in health spending (Stoye, Warner and Zaranko, 2024).
In sum, these results suggest that increasing treatment volumes, even by historically high levels for five years in a row, will be a challenging way to deliver the 18-week target in this parliament. We therefore now turn to the other two routes to achieve the target.
The effect of changes to the number joining the list and to prioritisation
Here, we consider how reductions in the number of people referred onto the waiting list, and changes to prioritisation to favour those who have waited more than 18 weeks, may affect performance against the 18-week target. In all cases, we consider these changes alongside potential changes to treatment volumes. We focus on the impact that such changes would have on performance on the 18-week target. They may also have impacts on patient outcomes and population health, but quantifying these potential impacts is beyond the scope of this report.
The main way that the NHS plans to reduce the growth in referrals to the waiting list is through expanded use of Advice and Guidance (A&G) diversions. We estimate that targets set out for A&G in the elective reform plan, along with other measures that reduce referrals, could reduce the growth rate in new joiners to the waiting list to 0.5% per year (down from the 1.4% growth rate last year).7 We use this number as an illustration of what might happen if the NHS is able to significantly reduce demand.
Changes to prioritisation are less straightforward to quantify, in part because prioritisation decisions depend on many factors and in part because hospitals have a lot of discretion. We therefore focus on the impact of a very simple change in priority. Patients who have waited more than 18 weeks already have a different likelihood of being treated from those who have waited less than 18 weeks. We increase this gap by 50% so that longer waiters are relatively more prioritised.8 In practice, in our medium activity growth scenario (of 3.5% per year), this means initially that around 30,000 fewer patients who have been waiting less than 18 weeks are seen each week, and the same number of patients who have been waiting longer are seen instead (for comparison, on average the NHS treats around 350,000 patients from the waiting list a week). Note this does not affect the total number of patients treated (and therefore does not affect the size of the waiting list) – it only affects which patients are treated.
Given these assumptions over the number of patients joining the list and prioritisation, we produce four sets of scenarios. First are ‘status quo’ scenarios, where both demand and prioritisation are kept at their 2024 levels – these are the results presented in the previous subsection. Next is a demand reduction scenario, where the number of patients joining the list grows less quickly, at 0.5% per year, but patients are prioritised as in 2024. Next is a reprioritisation scenario, where patients waiting more than 18 weeks are 20% more likely to be treated (and vice versa for those under 18 weeks), but the number joining the list grows as in 2024. Finally, we have a scenario where demand growth is reduced to 0.5% per year and patients below and above 18 weeks are reprioritised (combining the demand reduction and reprioritisation scenarios).
To start with, Figure 5 shows 18-week performance and the total waiting list size under each of these scenarios, assuming that activity grows in line with our medium scenario, at 3.5% per year. The results confirm that reducing demand and reprioritising patients can significantly increase performance against the 18-week target. The ‘status quo’ scenario suggests that 3.5% activity growth would lead to 74% of patients waiting less than 18 weeks by August 2029. But reprioritising patients would increase performance by 4 percentage points (from 74% to 78%) and reducing demand would increase performance by 8 percentage points (from 74% to 82%). Doing both at once would increase performance by 12 percentage points (from 74% to 86%).
The waiting list size is not affected by changing prioritisation, as the total number of people waiting for treatment is affected only by how many people join and leave the list, not which people on the list are treated (which means that the yellow and purple lines coincide in Panel B of Figure 5, as do the green and blue lines). As expected, reducing the number of referrals to the waiting list has a significant impact on the number of waiters: there are 1.4 million fewer patients on the list by the end of the parliament in our ‘demand reduction’ scenario than under the status quo.
Reprioritisation and demand reduction would have clear benefits for 18-week performance (and demand reduction also helps reduce the total size of the waiting list). But they are not costless. Reducing referrals to the waiting list carries the risk that some patients who genuinely need care will be unable to access it. The trade-off under reprioritisation is more subtle: since longer waiters are being prioritised, the cost is in the form of longer waits for those who would otherwise have been seen more quickly (and who may have good clinical reasons for being treated more quickly).
Although reducing demand and reprioritising patients improve performance, in none of our scenarios with medium growth in treatment volumes is the 18-week target achieved by the end of the parliament. Table 1 therefore shows the effect of these scenarios for demand and prioritisation for each of our activity growth scenarios.
Table 1. Simulated performance against the 18-week target
Scenario | Low activity growth (2%) | Medium activity growth (3.5%) | High activity growth (4.5%) |
Status quo demand & prioritisation | 64% | 74% | 84% |
Reprioritisation, | 68% | 78% | 88% |
Demand reduction, | 69% | 82% | Mid 2029 |
Both reprioritisation and demand reduction | 73% | 86% | Early 2029 |
Note: Purple denotes missing the target by more than 10 percentage points. Blue denotes missing the target by less than 10 percentage points. Green denotes the target being achieved and the text shows the date it is achieved. We use simulated performance in August 2029 to reflect the latest possible date of the next general election.
For scenarios in which the target is met by the end of the parliament (shown in green), we record the approximate date at which it is met. For scenarios in which the target is not met (shown in purple, or in blue if the final figure is within 10 percentage points of the target), we record the simulated percentage of patients waiting less than 18 weeks for treatment in August 2029.
These results suggest that achieving the 18-week target will be very challenging. As discussed in the previous subsection, to meet the target through increases in treatment volumes alone would require a very high activity growth rate (of nearly 5% per year) to be sustained for the rest of the parliament. However, this is not to say that the target cannot be achieved. An annual activity growth rate of 4.5%, if combined with demand reduction and greater prioritisation of patients with longer waits, would mean the 18-week target can be achieved in early to mid 2029. And, for example, if the NHS manages to return the ratio of hospital activity to waiting list treatments to its 2019 level, this 4.5% increase in waiting list treatments could be delivered with just 2.8% annual growth in hospital activity.
Of course, if the NHS is able to reduce demand further than we have assumed in our scenario, or reprioritises patients by even more than we have assumed, it is possible that the target could be achieved even faster or with lower growth rates in activity.9 On the other hand, if demand grows faster than we have assumed here (as the NHS long term workforce plan assumes), or efforts to change prioritisation rules are unsuccessful, it will be harder to achieve the target.
As discussed in the introduction, we are not the first to analyse whether the 18-week target is achievable. Box 2 discusses how our estimates here compare with other estimates of how plausible the 18-week target is.
Box 2. How our results compare with other estimates
In January, the government set out its plans to reach the 18-week target by 2029. It did not provide estimates of the changes to demand, treatment or prioritisation that would be required to achieve it. However, it did estimate that the number of people waiting more than 18 weeks for treatment would need to fall by 450,000 by next March, to achieve the interim target of 65% (Prime Minister’s Office, 2025a). This figure is not an estimate of activity growth, as a significant portion of activity is directed toward patients with shorter waits, and so cannot be directly compared with our estimates.
More recently, NHS England has published some results from internal modelling of the elective waiting list (Pritchard, 2025). They suggest that the 18-week target can be met when the total list size reaches approximately 4 million. In our introduction, we note that the relationship between the list size and waiting times is highly non-linear, and that performance against the 18-week standard has ranged from 59% to 90% at previous points when the waiting list was 4 million. Methodological details of the NHS/DHSC modelling are not publicly available, so we cannot directly compare our methods. However, the non-linearity of this relationship suggests that explicit modelling of dynamic flows through the waiting list system, as well as the overall list size, will have important implications for any estimates of how and whether the target can be achieved.
The most detailed public modelling of what is needed to achieve the 18-week target so far was produced by the Health Foundation (Cavallaro and Tallack, 2025). This found that achieving the 18-week target would require the number of patients leaving the waiting list to grow by 2.4% per year (close to the pre-pandemic rate of activity growth). Relative to our own results (which suggest that activity would need to grow more than twice as quickly), this may suggest that the 18-week target is quite achievable and less ambitious than it might appear at first glance. There are two main reasons that our results are so different from the Health Foundation’s.
First, the Health Foundation analysis considers all leavers from the waiting list together, while we separate out those leaving because their pathway is completed and those leaving for other reasons. This matters because changes in the number of patients leaving for other reasons could – and we think is likely to – be different from changes in the number of patients leaving because their pathways are completed. All else equal, we would expect the number of patients leaving for other reasons to fall as the waiting list and waiting times fall – there are simply fewer patients, with shorter waiting times, to leave the list for other reasons. For this reason, we assume in our modelling that the number of patients leaving the list for other reasons is a constant share of the waiting list size. This has been the case for the last several years. As with all of the other assumptions in our model, if the next few years see very different patterns from the ones we have assumed, waiting times will also vary from the results of our simulations.
This distinction between treated and non-treated leavers from the waiting list is important. It means that the Health Foundation’s estimate of a 2.4% annual increase in leavers from the waiting list being sufficient to achieve the 18-week target could require a much larger than 2.4% increase in hospital activity to be brought about. Our closest scenario is our status quo scenario where activity grows by 4.9% per year, so that the 18-week target is achieved. In this case, we estimate that the number of patients leaving the waiting list for other reasons would fall by 19% per year (as the size of the waiting list also falls rapidly). If we combined all reasons for leaving, we estimate that total leavers from the waiting list would need to grow by 2.5% per year, which is very similar to the Health Foundation’s estimate of 2.4%. But under these assumptions, this 2.5% far understates the increase in activity needed, of 4.9% growth per year.
Second, the Health Foundation takes a different modelling approach from us. Our model is a full simulation model of the waiting list, which offers a number of advantages – we can explicitly model the complex and dynamic relationship between waiting times and the waiting list, and can show the effect of different prioritisation decisions. This is at the cost of requiring more complex modelling and having to make assumptions about prioritisation. The Health Foundation instead uses a reduced form approach – it estimates the linear relationship between the 92nd percentile of waiting times and the waiting list clearance time (waiting list / treatment volumes) on historical data. Using this approach requires the assumption that this historical ‘rule of thumb’ relationship holds over time as the waiting list falls (which is implicitly also an assumption about prioritisation decisions). While this linear approach likely performs well when the waiting list is relatively stable, it is hard to predict how it might perform when there are major changes to the waiting list and waiting times, as we illustrated in the introduction. Moreover, this linear relationship gives very different results when estimated on the last decade of NHS performance or estimated on performance in recent years only.
5. Conclusion
The 18-week target is the government’s key target for the NHS and a central part of its wider health mission. Understanding how the government might achieve the target, and whether it is plausible that it will, is therefore of crucial importance. However, the complexity of the relationship between waiting times and the things that the government can influence, such as the number of patients receiving treatment, makes this a difficult exercise. In this report, we have developed a simulation model to unpick the role of different potential factors and quantify the effect they may have on 18-week performance.
Our results suggest that achieving the 18-week target by the end of this parliament will be challenging, but far from impossible. Trying to meet the target simply by increasing the number of patients treated by hospitals would require a sustained increase in activity – nearly 5% per year – that is high relative to improvements over the last decade. But the government has many available levers to reduce the growth rate in activity required. Reducing the number of referrals to the waiting list and reprioritising which patients are treated from the waiting list can materially improve 18-week performance. Making hospital activity more ‘waiting list efficient’ by reducing unnecessary follow-up appointments would also mean that hospital activity will need to grow by less to achieve the same increase in patients treated from the waiting list.
If the government uses all the levers available to it, and is able to grow treatments from the waiting list faster than in recent history, our modelling suggests that it is possible the 18-week target will be hit by the end of the parliament. We know from history that rapid improvements in waiting times are possible. But there is a risk that too much focus on achieving the 18-week target could ultimately be counterproductive for the NHS and – most importantly – for patients. Restricting demand, or deliberately increasing waiting times for those with short waits under the status quo in order to prioritise treating those who have waited longer than 18 weeks, could have adverse consequences for some patients. More broadly, too much focus on increasing elective activity may have downsides for other areas of the NHS.
Based on the modelling in this report, it is our view that the government is more likely than not to miss the 18-week target by the end of the parliament. After all, the NHS remains far from achieving most of the targets in the 2022 elective recovery plan. It remains to be seen what the Spending Review later this year will mean for the NHS budget, but the government’s overall public spending plans are relatively tight for the next few years, following large top-ups this year and last. And while the focus on productivity is very welcome, on current trends NHS hospitals remain several years away from simply returning to pre-pandemic performance levels. We therefore expect the NHS to make significant improvements to performance in coming years, but the changes needed to meet the 18-week target look as though they may be too much of a stretch.
Methodological appendix
Our model simulates the state of the national elective waiting list in England. We group patients by the number of weeks they have waited and simulate how the size of these groups will change over time. We can then calculate measures such as the total list size, the median wait time or the proportion of patients waiting less than 18 weeks, as functions of these group sizes. In this report, we focus on modelling the overall elective waiting list, aggregated across all specialties and all providers. However, our model allows us to conduct all the analysis discussed in the report at the specialty, commissioner or provider level (or even combinations of specialty and commissioner/provider), using the methodology described here. In future work, we will explore the results at these lower levels.
The rest of this appendix sets out in more detail how the model works. We focus on providing a simple overview of how it works, with key intuition behind each component. The size and complexity of the model and the data it uses mean we cannot set out the full details here.
In each period, the state of a waiting list system () is fully determined by four inputs: the state of the system in the previous period (), the number of new referrals (), the number of leavers and how these leavers are spread across the waiting time distribution (). is a vector such that , where is defined as the number of patients at time with a wait time of weeks. is similarly defined in terms of , the number of patients who leave the list in period having waited weeks. is a scalar, since all patients join the list having waited 0 weeks. Our model takes these as inputs, with each period being one week.
The initial state of the waiting list system, , is taken directly from published NHS referral to treatment waiting times data.10 For 1 ≤ n ≤ 104, we observe the total number of patients waiting for treatment who have waited weeks for treatment. The final group contains the number of patients waiting 104 weeks or longer. We initialise our model with these data.
We model the number of joiners and leavers in each period by applying annual growth rates to historical data, with the exception of one type of leaver. Leavers are disaggregated into three groups: pathways completed with an admission to hospital (inpatients); pathways completed without an admission to hospital (outpatients); and leavers for other reasons, such as turning down treatment or dying while waiting for care. We assume that this final group is a constant proportion of the total number of waiters, as in our previous work (e.g. Warner and Zaranko, 2024). The numbers of inpatient treatments, outpatient treatments and joiners are modelled by applying annual growth rates to the observed values in the relevant calendar month in past data, after adjusting for the number of working days per month.
We model the distribution of leavers across the waiting time distribution by assuming that the relative probability of leaving the list, conditional on waiting N weeks, is constant over time. We estimate these probabilities from past data. For example, we observe the number of patients treated as an inpatient after waiting N weeks in each month, and we estimate the total number of patients who were available to be treated after waiting N weeks, from which we can derive the required probabilities. The absolute probability will vary in line with treatment volumes, specified above, and so this assumption reflects the fact that some groups (such as very long waiters) are much more likely to receive treatment than others.
In each period, we use the above inputs to model the state of the waiting list. We define such that

The group of waiters with a wait time below 1 week equals the number of new referrals in that week, minus those treated within 1 week. For other groups of waiters, each group contains the number of waiters in the previous period with 1 week less wait, minus the relevant leavers. The group of waiters with at least 104 weeks’ wait equals its previous value, plus those waiting 103 weeks in the previous period, again net of leavers. To determine , we use the treatment probabilities discussed above to model the number of leavers from each group of waiters. These values are then rescaled such that their sum matches the modelled number of total leavers. If input values imply more leavers from one group than are available to be treated, we set the size of the group to zero and assign the excess leavers across all other groups.
We can then calculate any statistic of the waiting list in each period, such as the total number of waiters, the median wait time or the proportion of waiters below the 18-week threshold. Iterating this process generates a full simulation of how these statistics evolve over time.
We have tested the validity of the model in a number of ways. Most importantly, we have tested whether our model can replicate past dynamics of the waiting list and waiting times. We find that, given data up to the end of 2022, the model can reproduce 2023 and 2024 performance measures well, with discrepancies only where we would expect due to policy changes (e.g. shifts in the prioritisation of longer waiters). Further results are available on request.
References
Cavallaro, F. and Tallack, C., 2025. Government’s plan for 18-week NHS waiting times: is it realistic? Health Foundation, https://www.health.org.uk/reports-and-analysis/analysis/government-s-plan-for-18-week-nhs-waiting-times-is-it-realistic.
Conservative party, 2024. The Conservative and Unionist Party manifesto 2024. https://public.conservatives.com/publicweb/GE2024/Accessible-Manifesto/Accessible-PDF-Conservative-Manifesto-2024.pdf.
Department of Health & Social Care, 2025. Handbook to the NHS Constitution for England. https://www.gov.uk/government/publications/supplements-to-the-nhs-constitution-for-england/the-handbook-to-the-nhs-constitution-for-england.
Department of Health & Social Care and NHS England, 2025. Reforming elective care for patients. https://www.england.nhs.uk/wp-content/uploads/2023/04/reforming-elective-care-for-patients.pdf.
Harvey-Rich, O., Warner, M. and Zaranko, B., 2024. NHS hospital productivity: some positive news. IFS Comment, https://ifs.org.uk/articles/nhs-hospital-productivity-some-positive-news.
Keogh, B., 2015. Making waiting time standards work for patients. https://www.england.nhs.uk/wp-content/uploads/2015/06/letter-waiting-time-standards-sbk.pdf.
Labour party, 2024. Change. Labour party manifesto 2024. https://labour.org.uk/wp-content/uploads/2024/06/Labour-Party-manifesto-2024.pdf.
NHS England, 2022. Delivery plan for tackling the COVID-19 backlog of elective care. https://qna.files.parliament.uk/qna-attachments/1672776/original/C1466-delivery-plan-for-tackling-the-covid-19-backlog-of-elective-care%20(2).pdf.
NHS England, 2025a. Referral to treatment (RTT) waiting times. https://www.england.nhs.uk/statistics/statistical-work-areas/rtt-waiting-times/.
NHS England, 2025b. 2025/26 priorities and operational planning guidance. https://www.england.nhs.uk/wp-content/uploads/2023/04/PRN01625-25-26-priorities-and-operational-planning-guidance-january-2025.pdf.
NHS England, 2025c. Recording and reporting referral to treatment (RTT) waiting times for consultant-led elective care. https://www.england.nhs.uk/statistics/wp-content/uploads/sites/2/2025/02/Recording-and-reporting-RTT-waiting-times-guidance-v5.0-Feb25.pdf.
Prime Minister’s Office, 2025a. PM sets out plan to end waiting list backlogs through millions more appointments. https://www.gov.uk/government/news/pm-sets-out-plan-to-end-waiting-list-backlogs-through-millions-more-appointments.
Prime Minister’s Office, 2025b. Over two million extra NHS appointments delivered early as trusts handed £40 million to go further and faster. https://www.gov.uk/government/news/over-two-million-extra-nhs-appointments-delivered-early-as-trusts-handed-40-million-to-go-further-and-faster.
Pritchard, A., 2025. Re: work of NHS England evidence session, 29 January 2025. https://committees.parliament.uk/publications/46864/documents/241734/default/.
Stoye, G., Warner, M. and Zaranko, B., 2024. The past and future of UK health spending. IFS Report, https://ifs.org.uk/publications/past-and-future-uk-health-spending.
Warner, M. and Zaranko, B., 2023. Is there really an NHS productivity crisis? IFS Comment, https://ifs.org.uk/articles/there-really-nhs-productivity-crisis.
Warner, M. and Zaranko, B., 2024. The past and future of NHS waiting lists in England. IFS Report, https://ifs.org.uk/publications/past-and-future-nhs-waiting-lists-england.
Acknowledgements
The authors gratefully acknowledge the support of the ESRC Centre for the Microeconomic Analysis of Public Policy (ES/T014334/1). The authors also thank Carl Emmerson, Paul Johnson, George Stoye, Charles Tallack and Ben Zaranko for providing useful comments on various parts of the report.
Endnotes
Authors

Max Warner
Max joined the IFS in 2020 as a research economist in the Healthcare Sector, with a focus on the NHS labour force and adult social care in England.

Olly Harvey-Rich
Olly joined the IFS in 2024 and works in the Healthcare sector.
More from IFS
Understand this issue


Policy analysis


Academic research


