
Downloads
Download the report as a PDF
PDF | 1.17 MB
Executive summary
Automatic enrolment has transformed private pension saving in the UK: workplace pension participation among eligible private sector employees rose from just over 40% in 2012 to 89% in 2024. Despite this, there are concerns that current levels of pension contributions will lead to many falling short in retirement. The Second Pensions Commission’s interim report (Department for Work and Pensions, 2026) argues that 15 million working-age people are undersaving for retirement based on a ‘target replacement rate’ measure, implying that they are expected to face significant falls in their income and standard of living at retirement. The Commission is now considering policies to increase pension saving.
A key lever for policymakers to increase pension saving, in particular among private sector employees, is through increasing the minimum contribution rates under automatic enrolment policy. The effect of these policies will depend not just on how the minimum rates are amended but also the extent to which different types of employers are currently making contributions at the minimum rates, or above them. Thus, in the first part of this report we document trends in employer contributions to private pensions over time, and how patterns of saving differ between different types of employees and employers.
In the second part we consider how the government could approach increasing minimum contributions (from both employees and employers). While increasing contributions improves retirement income adequacy, there are real trade-offs. Higher contributions mean lower take-home pay today, higher employer costs and particular pressures on low earners and minimum wage-heavy sectors such as accommodation and food services. Balancing these trade-offs will be a key challenge for the Second Pensions Commission’s policy proposals.
Key findings
Trends in employer contributions
- Employer pension contribution rates have risen significantly since the mid-2010s, after falling in the late 2000s and early 2010s. Among all private sector employees, including those not saving in a workplace pension, average employer contributions fell from 4.2% of total earnings in 2005 to a low of 3.4% in 2012. But as automatic enrolment was rolled out and minimum contribution rates rose, average contributions rose again, reaching 5.1% in 2024. Gaps in average employer contribution rates between groups have also narrowed. For example, women’s average employer contribution rate was 0.7 percentage points below men’s in 2005, but this gap was just 0.1 percentage points in 2024.
- Many people saving in defined contribution (DC) pension plans receive only the statutory minimum employer contribution, but a substantial minority receive considerably more. In 2024, among private sector employees who were saving into a DC pension, 28% received the statutory minimum employer contribution of 3% of qualifying pay. In contrast, 31% received contributions worth at least 6% of gross pay. Higher earners are much more likely to receive large employer contributions: 46% of savers in the highest quarter of the earnings distribution received employer contributions of at least 6% of gross pay, compared with 22% of the lowest quarter of earners.
- Employees working for small firms, and those working in particular industries such as accommodation and food services, are especially likely to receive minimum employer contributions. Among savers working for employers with under 50 employees, 47% received the statutory minimum employer contribution in 2024. This compares with 17% among savers working for employers with 10,000 or more employees. The variation by industry is even starker: 52% of savers in accommodation and food services received the statutory minimum, compared with only 5% in finance and insurance. Large differences by industry remain even after controlling for other employee characteristics.
What would the effects of changing the current minimum saving rates be?
- Under the current system, employers must contribute at least 3% of qualifying earnings – earnings between £6,240 and £50,270 – and the minimum default total contribution rate (from employees and employers) is 8% of qualifying earnings. We model the effects of four different scenarios for changing the current system, allowing us to draw out key conclusions about the effects of changing the structure of the current system. The four scenarios set out different combinations of the automatic enrolment system parameters that all result in more saving. In particular, we consider reforms to the contribution rate, the band of qualifying earnings and the point at which people are automatically enrolled (the ‘earnings trigger’). The detail on the different scenarios can be found in the main text – the key findings below are focused on setting out the most important take-aways and trade-offs from considering the different options.
- The band of ‘qualifying’ earnings to which the minimum applies, not just the minimum saving rate, has a large effect on minimum contributions – and this is not just true for low earners. The increase in minimum saving rates from lowering or removing the lower qualifying earnings limit is the largest for lower earners, but it also matters for middle and higher earners. If the minimum contribution rate is 12% of earnings above £6,240, then someone earning £50,000 would have a minimum contribution rate, measured as a fraction of total earnings, of 10.5%.
- Higher minimum contributions would improve projected retirement adequacy, but the size of the effect depends on the adequacy measure used. Among people currently saving in DC pensions aged 25 to 59, we project that 66% of private sector employees are on track to reach their ‘target replacement rate’ – a benchmark for avoiding large falls in living standards at retirement. Reforms that generate substantial additional saving can push up adequacy significantly on this measure – for example, raising minimum contribution rates to 12% of a qualifying earnings band of £6,240 to £65,000 would increase this adequacy measure by 8 percentage points to 74%, with a larger effect for younger workers who will spend longer under the reformed system. By contrast, 91% are already projected to reach the ‘minimum retirement living standard’ defined by Pensions UK. Because most people saving in DC pensions are likely to already meet this threshold, even large reforms have a limited effect on this share.
- The gains in retirement saving come at the cost of lower take-home pay today, especially for low earners. This is partly because higher minimum contributions would likely involve many employees making higher contributions themselves. It is also because economic theory and empirical evidence suggest that, over time, higher employer contributions are likely to pass through into lower wages for most employees. For example, raising minimum contribution rates to 12% of a qualifying earnings band of £6,240 to £65,000 would result in a reduction of 0.4% of take-home pay due to higher employee contributions and a further 0.8% reduction assuming full pass through of employer contributions to wages. The effect on the highest earning third is smaller – the reduction in take-home pay from higher employee contributions is 0.2% and higher employer contributions 0.4% (assuming full pass through to wages) – compared with 0.3% and 0.9% respectively for the lowest earning third.
- The take-home pay of low earners would be particularly affected by reducing or removing the ‘lower limit of qualifying earnings’. Assuming full pass through of employer contributions into lower wages, the total reduction in take-home pay for the lowest earnings third of employees would be 1.2% if the minimum contribution rate was set to 12% of qualifying earnings of £6,240 to £65,000. If the 12% contributions were instead calculated on earnings from first pound, without the lower limit of qualifying earnings, the reduction in take-home pay for low earners would be 4.0%.
- Higher minimum contributions would increase employer costs the most in industries where many workers are close to the minimum wage. Employer costs rise more in industries with more minimum-wage workers because these industries are also more likely to pay only minimum employer pension contributions. For minimum-wage workers, employers cannot directly offset higher pension costs by reducing hourly wages below the minimum wage, but there may be other unintended consequences on workers – adjustment could instead come through lower employment, higher prices, lower profits or other changes to working conditions that reduce the cost of employing people.
1. Introduction
Automatic enrolment, the requirement for employers to enrol eligible employees automatically into a workplace pension, has been a major policy success in increasing the pension participation rates of private sector employees. Since the start of the roll out of automatic enrolment, workplace pension participation among eligible private sector employees has risen – from just over 40% in 2012 to 89% in 2024 (Department for Work and Pensions, 2025a). This has been driven entirely by an increase in the prevalence of defined contribution (DC) pension pots.
Despite this increase in pension participation, there remain concerns that a significant number of working-age people are not saving enough for retirement. According to modelling by the Department for Work and Pensions, on current trends, 15 million working-age people in the UK are not expected to reach their ‘target replacement rates’ – a benchmark for avoiding large falls in standards of living in retirement (Department for Work and Pensions, 2026). These concerns are not just confined to people who are not currently saving in a private pension. Indeed, we previously found that even among private sector employees saving into a DC pension, nearly four-in-ten are on track to miss their target replacement rate in retirement based on their current pension saving rate (Cribb et al., 2025), although incorporating expected pension incomes from partners and expected inheritances notably reduces the share missing these target replacement rates (O’Brien, Cribb and Sturrock, 2024).
The Second Pensions Commission was set up by the government in large part to address these concerns. The interim report set out the issue and the extent of ‘undersaving’, and the final report, set to be published in early 2027, will present policy proposals. Clearly, given the challenges for employees set out above, as well as the power of automatic enrolment defaults to change saving behaviour, the Commission should carefully consider whether changes to the system could produce better outcomes for people, both in retirement and during working age.
There are many potential changes that the Commission could propose within the automatic enrolment system. One question is who should have to be automatically enrolled into workplace pension saving. Currently, employers only have to enrol employees aged between 22 and state pension age who earn at least £10,000 per year, but there has been much debate about changing both the age range and the ‘earnings trigger’ for eligibility. Another, perhaps more significant, question is what the level of minimum pension contributions should be. At present, employers have to make contributions worth at least 3% of qualifying pay – defined as the band of earnings from £6,240 to £50,270 – while the minimum total pension contribution (from both the employee and the employer) has to be at least 8% of qualifying pay. Changes to both the minimum contribution rates and the definition of qualifying pay will have significant effects on how much many employees will have to save in a private pension.
When making these decisions, it will be important to keep in mind that higher pension saving comes at the expense of lower take-home pay. This is true even when the extra saving comes from employers, as the majority of higher employer contributions would likely be passed through to lower wages over time (see Chapter 3 for more details or Coates, Mackey and Cowgill (2020) for a review). This trade-off is clearly particularly stark for those who face low material standards of living during working life and who may not want to lock their savings into a product they can only access in their late 50s. In addition, the effects of any changes to the automatic enrolment parameters will also have to be considered in the context of other cost pressures on employers, as well as the cost of higher pensions tax relief to the public finances.
It is also important to consider how changes to minimum contribution rates will impact different types of employers and employees. The effects of these changes will particularly impact employers and employees who are currently contributing at the minimum rates. On the other hand, many employers are already making contributions above the minimums and may not be as affected by changes to the statutory minimum rates. This means that taking account of patterns in current employer contributions will be crucial for understanding how changes to minimum contributions will be felt across different types of employers and employees.
In this report, we provide new evidence to help the Second Pensions Commission make proposals about how to improve the system of automatic enrolment. In Chapter 2, we focus on employer pension contributions, a part of the automatic enrolment system that received particular focus in the Commission’s interim report (Department for Work and Pensions, 2026). Using employer-provided data on earnings and pension contributions from the Annual Survey of Hours and Earnings (Office for National Statistics, 2025), we first document how employer pension contribution rates (expressed as a % of earnings) have changed over time, and how this varies by different groups of employees and employers. We then focus on the most recent data from 2024 and examine the distribution of employer pension contribution rates in detail.
In Chapter 3, we consider the system as a whole and model four different policy options for changing automatic enrolment parameters. Of course, other options besides those we model are possible. The aim is not to provide concrete recommendations, but to provide insight into how changing different parameters could have very different impacts on individuals and employers. We consider the effects of these policy options on take-home pay, adequacy and employer costs, both overall and for different types of employees and employers, as well as their impact on aggregate saving and the short- and long-run cost to the Exchequer through higher pensions tax relief. Finally, Chapter 4 concludes with a discussion of policy considerations.
2. Trends in employer contributions
While the minimum level of employer contributions (for those participating in a scheme) is determined by the government’s automatic enrolment rules, there is a great deal of variation in how much employers actually contribute to employees’ pensions, with some employers making contributions well above the minimum level. For example, existing evidence from the Department for Work and Pensions (2025b, 2026) shows that median contribution rates are higher and above-minimum contributions are more common among those with higher earnings, those working for large employers and those working in finance and insurance. This suggests that firms' pension offerings are shaped by more than just the automatic enrolment minimum: many such firms likely offer higher employer contributions as part of their remuneration package because these contributions are valuable to many workers and, potentially, to attract workers with a stronger preference for pension saving (Lazear and Shaw, 2007; Rosen, 1986). In this section, we provide new analysis of trends in employer contributions and how these have changed over time.
Data
Throughout this report, we use employer-reported data on earnings and pension contributions from the Annual Survey of Hours and Earnings (ASHE). The sample frame for ASHE is a 1% random sample of employees in Great Britain (based on the last two digits of the employee’s National Insurance number), meaning it has a large sample size of around 140,000 to 180,000 observations per year. It collects information on pay, hours worked and pension contributions in April of each year.
ASHE is the highest quality dataset on employer contributions available at a large scale in the UK, and, importantly for our analysis, employers have to separately report ordinary employer contributions and contributions made via salary sacrifice.1 Throughout, we analyse data on ordinary employer pension contributions. It is worth noting that ASHE contains information on the actual contributions that employees and employers make, but we cannot observe the contribution schedule offered by the employers. This means that we cannot observe whether the employer offers any kind of matching for pension contributions.
We use data from April 2005 to April 2024. There is a structural break in the data in 2021 when the methodology for cleaning the pension contribution variables changed. We use the new pension contribution measures where available except in 2021, where we show both measures to show how they compare.2
Trends in employer pension contributions over time
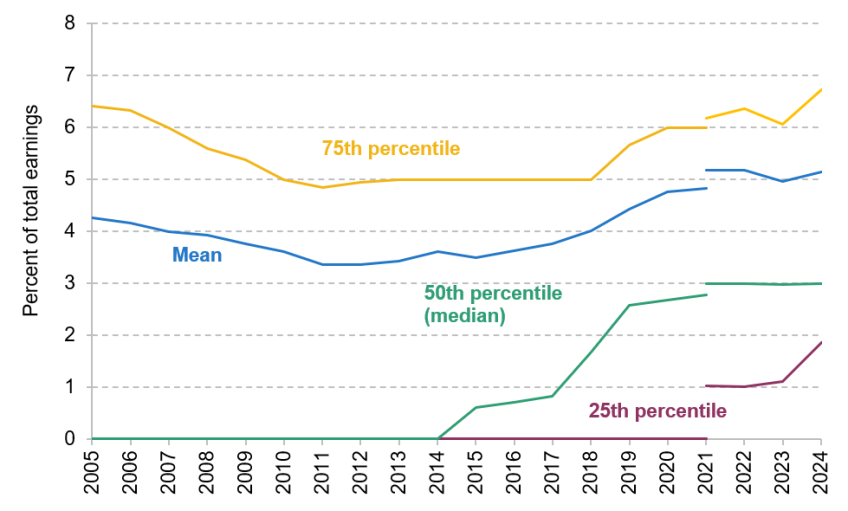
Figure 1 shows the mean and 25th, 50th and 75th percentiles of employer pension contribution rates from 2005 to 2024 among all private sector employees. Contribution rates are calculated as a percentage of total gross pay (rather than qualifying pay, which is used to calculate the statutory minimum contributions).
The sample includes all private sector employees, that is, we include zeros for those not saving in a workplace pension. We look at all private sector employees so that our results incorporate the effects of both more people saving in a pension and the decline of traditional defined benefit pensions (which often have very high employer pension contribution rates). The sample choice is evident from looking at the 25th and 50th percentile of employer contributions – these were zero for much of the period we study, meaning that fewer than 75% and 50% of private sector employees (respectively) were saving in a pension. In most of the analysis that follows, we therefore focus on the mean contribution rate.
The mean employer contribution rate among private sector employees was 4.2% in 2005 and was steadily falling until the introduction of automatic enrolment, mostly driven by falling pension participation.3 Since the gradual introduction of automatic enrolment in 2012, the mean employer contribution rate has increased, reaching 5.1% in the last year of data. This is markedly above the mean employer contribution rate in the mid-2000s.
Figure 1. Employer contributions to private pensions (% of earnings), over time among all private sector employees
Note: The series break in 2021 denotes the move to a new cleaning method for the pension contribution variables in the Annual Survey of Hours and Earnings.
Source: Authors’ calculations using Annual Survey of Hours and Earnings 2005 to 2024.
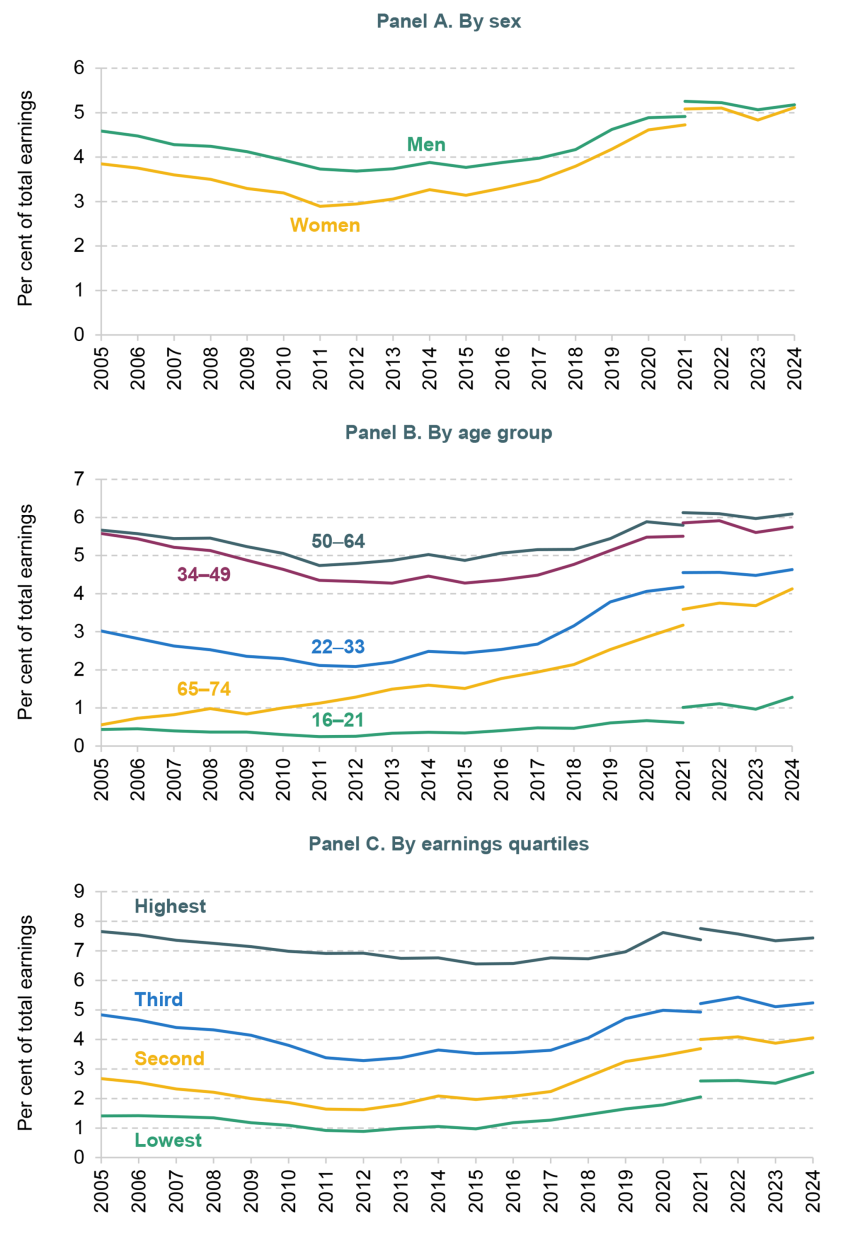
Average employer contributions also vary between different types of employees. Figure 2 shows how mean contribution rates have evolved over time for men and women, between age groups and between earnings groups. All three panels show that average employer contribution rates have gradually been converging between different groups.
In 2005, the mean employer contribution rate for men was 0.7 percentage points higher than that for women. Expressed as a percentage, this means the average employer pension contribution rate for male employees was 19% higher than for female employees. Since the introduction of automatic enrolment, mean employer contribution rates have risen among both men and women, but at a faster rate among women, meaning that the gap in mean contribution rates fell to just 0.1 percentage points in 2024.
In the early 2000s, mean employer contribution rates among workers aged 34 to 64 were much higher than among other age groups. For example, in 2005 the mean employer contribution rate for those aged 22 to 33 was 3.0%, compared with 5.6% among those aged 34 to 49. However, this gap has also shrunk, as average contributions among the younger age group have grown more rapidly since the introduction of automatic enrolment. In 2024, the average employer contribution rates were 4.6% and 5.7% among the 22- to 33-year-olds and 34- to 49-year-olds respectively, meaning the gap in average contribution rates between these two groups decreased from 2.6 percentage points to 1.1 percentage points over this period.
Average employer contribution rates among those aged 16 to 21 remain relatively low – this age group is not eligible for automatic enrolment, and very few of them are saving into a workplace pension. The 65 to 74 group are also not automatically eligible due to their age, but the mean employer contribution rate for this age group rose dramatically over the 2010s.
Panel C of Figure 2 shows mean employer pension contribution rates for different quarters of the earnings distribution. Again, the contribution rates among all earnings groups fell before the introduction of automatic enrolment and have been rising since. For those in the highest earnings quarter, the mean employer contribution rate is now at a similar level to in the mid-2000s (7.6% of total pay in 2005 and 7.4% of total pay in 2024), whereas increases in mean contribution rates have been larger for the other earnings groups in both absolute and relative terms. In particular, among low earners, the mean employer contribution rate rose from 1.4% of total pay in 2005 to 2.9% in 2024. This means that, while gaps in average contribution rates between earnings groups still exist, these are now markedly smaller than they were in the mid-2000s.
Figure 2. Mean employer pension contribution rates over time among all private sector employees, by sex, age and earnings quartiles
Note: The series break in 2021 denotes the move to a new cleaning method for the pension contribution variables in the Annual Survey of Hours and Earnings.
Source: Authors’ calculations using Annual Survey of Hours and Earnings 2005 to 2024.
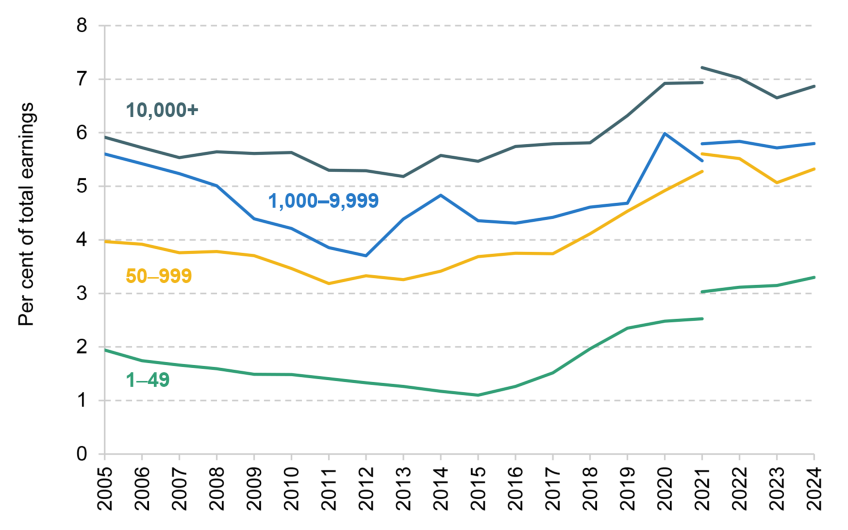
Contribution rates also vary by size of employer, with average contribution rates among those working for small employers (fewer than 50 employees) particularly low compared to those in medium and larger sized employers, as shown in Figure 3. Between 2005 and 2024, the mean employer contribution rate among employees working for small employers increased by 1.4 percentage points, compared with an increase of 0.2 percentage points among those at employers with more than 10,000 workers. This once again implies a reduction in the gaps in employer contribution rates by employer size since the mid-2000s.
Figure 3. Employer contributions over time among all private sector employees, by employer size
Note: The series break in 2021 denotes the move to a new cleaning method for the pension contribution variables in the Annual Survey of Hours and Earnings.
Source: Authors’ calculations using Annual Survey of Hours and Earnings 2005 to 2024.
Distribution of employer contributions
In order to model and understand how changes to the statutory minimum employer contributions would affect different types of employees and employers (as modelled in Chapter 3), we need a closer understanding of the current distribution of employer contribution rates. In particular, because most of the policy discussion surrounds potential increases in the minimum contributions to those who are participating in a pension, and because those defined benefit pension arrangements that still remain in the private sector almost always have substantial employer contributions, in this sub-section we focus on employer contributions into private sector DC schemes. We focus on the distribution of employer contribution rates in the latest year of data (collected in April 2024), with a particular focus on understanding which employers and employees are most likely to be making minimum contributions.
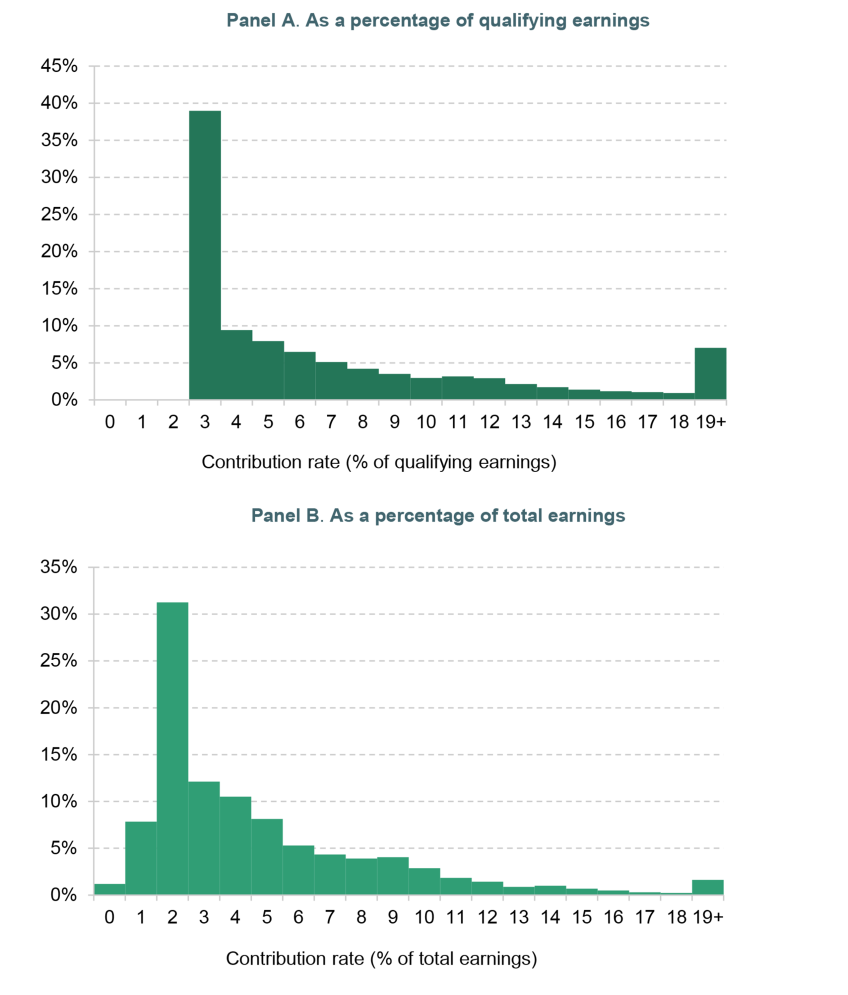
Figure 4 illustrates the full distribution of employer contribution rates among private sector employees saving in a DC pension. Panel A shows contribution rates defined as a percentage of qualifying earnings (earnings between £6,240 and £50,270). By law, the minimum contribution that an employer must pay into a private pension is 3% of qualifying earnings. Indeed, Panel A shows that 38% of private sector employees saving into a DC pension are paid an employer contribution of between 3% and 3.99% of qualifying earnings. It is notable that, while a large minority of DC savers receive employer contributions at or close to the statutory minimum rate, there is also a long tail of higher employer contributions (with contributions above 20% of qualifying earnings aggregated together, creating the second spike in the chart).
The pattern also looks similar in Panel B where employer contributions are shown as a percentage of total earnings. The chart shows that 40% of DC savers receive employer contributions that are less than 3% of their gross earnings (sum of the first three bars). But the flipside of this is that the majority of people do receive contributions that are at least 3% of gross earnings – and around three-in-ten receive employer contributions that are at least 6% of gross earnings.
Figure 4. Distribution of employer pension contribution rates, as a percentage of qualifying earnings and total earnings, for private sector employees participating in a defined contribution pension, 2024
Source: Authors’ calculations using Annual Survey of Hours and Earnings 2024.
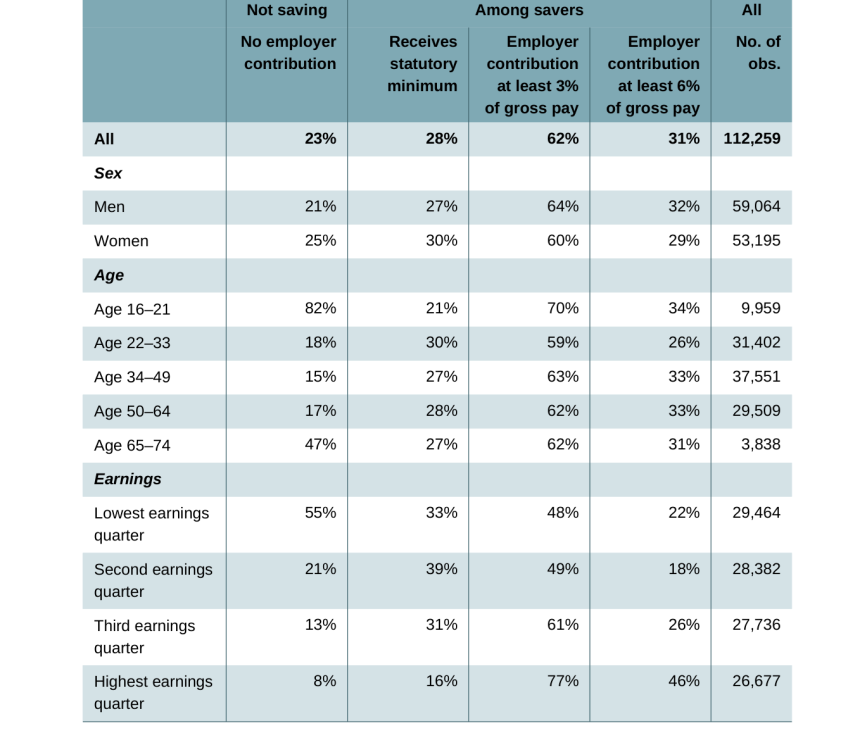
Table 1 shows the proportion of different groups of private sector employees not saving in a pension and, among savers, the proportion receiving the statutory minimum and employer contributions of at least 3% and 6% of gross pay.4 Receiving the statutory minimum is slightly more likely among female employees than male employees, and among those in the bottom three-quarters of the earnings distribution. The reverse is true for receiving contributions above 6% of pay – men are more likely to receive higher employer contributions, as are those in the highest earning quarter.
When looking at variation by age, the picture is more mixed. The vast majority of those aged 16 to 21 are not saving in a pension – due to the age restriction, employers do not have to automatically enrol employees in this age range into a workplace pension. But among the 18% of 16- to 21-year-olds who do save into a pension, about four-in-five are receiving more than the minimum employer contribution. This could be because there are very low employment rates and pension participation rates at these ages, meaning that they are an unusually selected sample.5
While not shown in the table, our analysis shows that receiving minimum contributions is also particularly prevalent among minimum-wage workers – 33% of private sector workers with a wage within £1 of minimum wage receive the statutory minimum employer contributions, compared with 22% among those with higher wages.
Table 1. Employer contribution rates among private sector employees (not saving in a defined benefit pension) in 2024, by employee characteristics
Source: Authors’ calculations using Annual Survey of Hours and Earnings 2024.
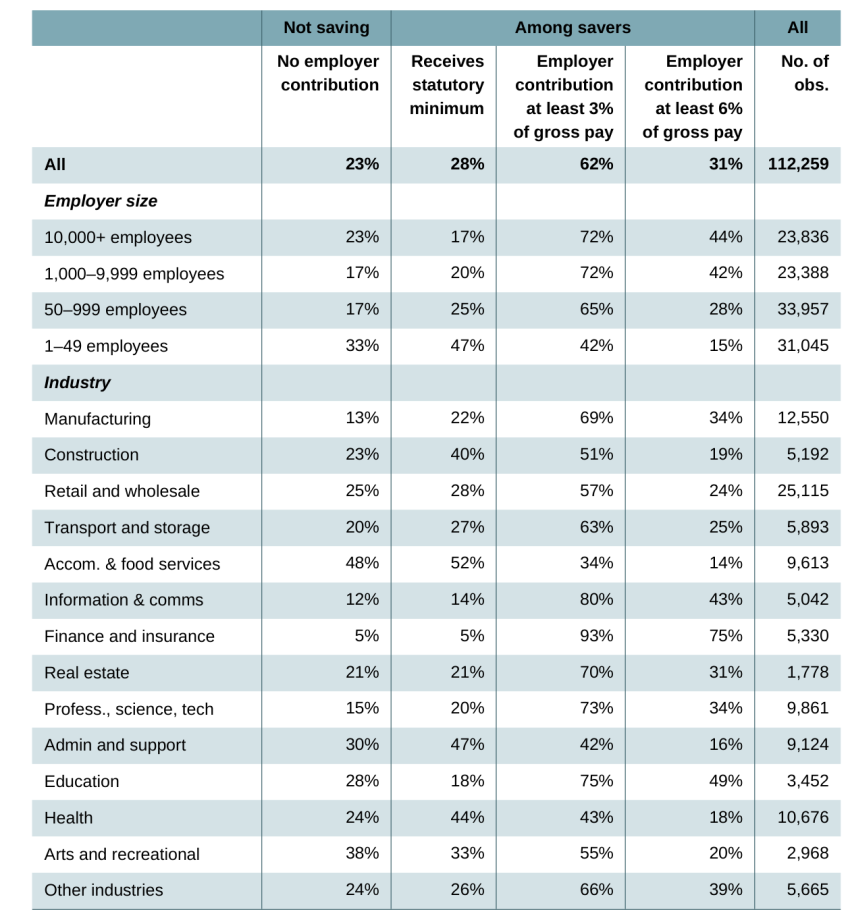
Table 2 shows similar analysis but focusing on differences by employer characteristics. Small employers (fewer than 50 employees) are more likely to make statutory minimum employer pension contributions, and less likely to make contributions of at least 3% or 6% of gross pay, compared with larger employers. This table also shows stark differences in employer contributions between different industries. For example, among DC savers, 52% of those working in accommodation and food services receive the minimum contribution from their employer, and just 14% receive at least 6% of gross pay. On the other hand, among those working in finance and insurance, 5% receive the minimum employer contribution, while 75% receive 6% or more of their gross pay.
Table 2. Employer contribution rates among private sector employees (not saving in a defined benefit pension) in 2024, by employer characteristics
Source: Authors’ calculations using Annual Survey of Hours and Earnings 2024.
In order to understand whether the differences in employer contributions between industries are simply driven by differences in employee characteristics (such as earnings) between them, we run a multivariate regression.
Table 3 shows marginal effects from a logistic regression, where the outcome variable is an indicator for whether the employee is receiving just the statutory minimum contributions, and the sample is all private sector employees saving in a DC pension. The marginal effects can be interpreted as the percentage point difference in the likelihood of being paid minimum employer contributions between the group in question and the reference category, keeping all of the other characteristics constant.
The results show that the differences in the prevalence of minimum contributions by employer size and industry remain, even after controlling for employee characteristics. For example, those working for a small employer (fewer than 50 employees) are 29 percentage points more likely to be receiving just the statutory minimum contributions from their employer than those working for an employer with more than 10,000 employees (the reference category), even after controlling for sex, age, industry and earnings.6
Those in accommodation and food services are 30 percentage points more likely than otherwise similar workers in manufacturing (reference category) to receive the statutory minimum employer contribution only, after controlling for sex, age, earnings and employer size. The equivalent differences are 26 percentage points for administrative and support services, 19 percentage points for health and social work, and 14 percentage points for construction.
Table 3. Marginal effects (percentage points) from a logistic regression of and indicator for receiving statutory minimum contributions on characteristics, among private sector employees saving in a defined contribution pension
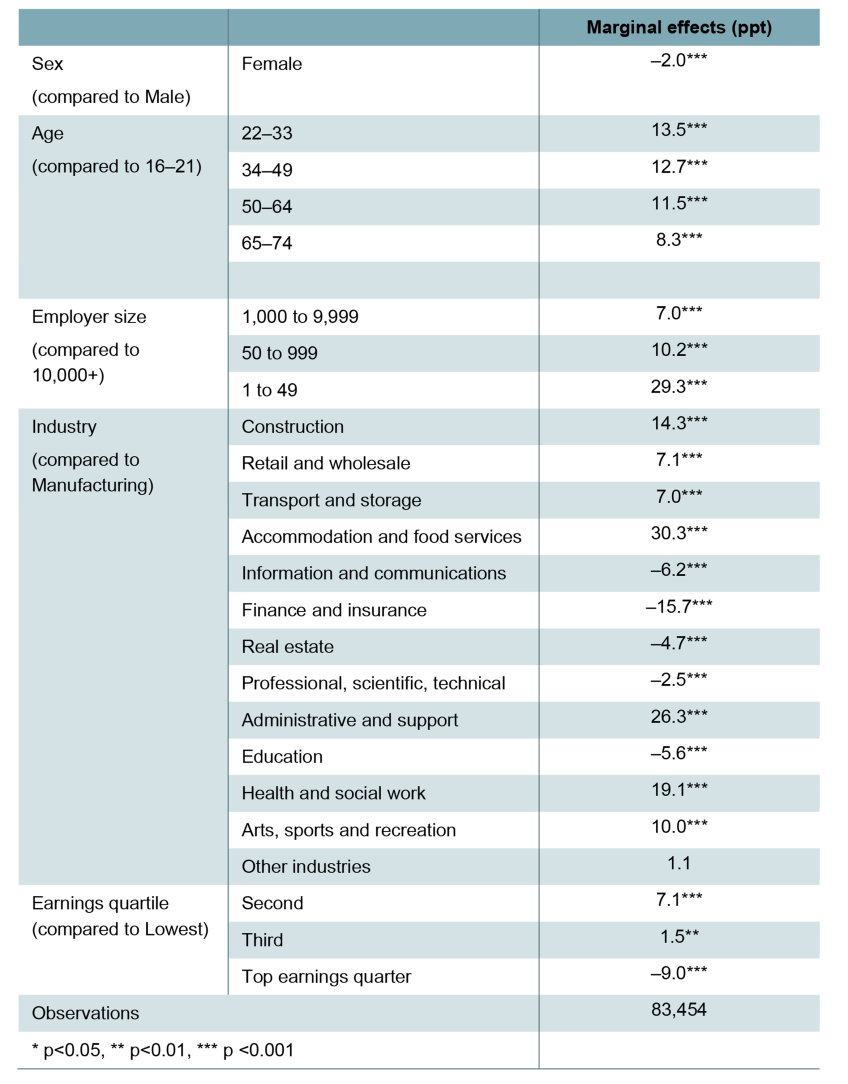
Note: ‘Other industries’ aggregates together the remaining (smaller) one-digit Standard Industrial Classification (SIC) code industries. The marginal effects have been multiplied by 100 and can be interpreted as percentage points. Standard errors in parentheses.
Source: Authors’ calculations using Annual Survey of Hours and Earnings 2024.
3. Policy options to increase minimum contribution rates
In this section, we set out the effects of four different scenarios for how automatic enrolment parameters could be changed to increase saving rates. We assess the impact of these scenarios on adequacy, take-home pay, employer costs and tax relief in the short and long run.
Throughout, the analysis is based on updating previous IFS modelling, described in detail in O’Brien, Cribb and Sturrock (2024). It is worth noting that the exact outputs from this modelling are subject to uncertainty and depend on a number of assumptions. In addition, we do not model any behavioural change or employer responses to the policies, such as changes in hiring, changes to opt-out rates or changes to the pension saving of workers currently well above the automatic enrolment minimums.
The four scenarios we model are set out in Table 4. These scenarios are by no means a comprehensive list of policy options but provide a range of examples for how saving rates could be increased. The scenarios differ both in terms of the overall level of additional saving generated and the balance between employer and employee contributions. We chose parameters most commonly proposed by stakeholders, with a particular focus on changes that increase saving rates among current low earners, given that the interim report of the Second Pensions Commission suggested there was a particular issue around low saving among this group. Throughout, we assume that all thresholds are uprated over time in line with average earnings growth. We use the current system as a baseline.
In Scenario A, we modify the current system by removing the lower limit of qualifying earnings (currently £6,240), as well as expanding the age range for eligibility to those aged 18 to state pension age (SPA) (currently 22 to SPA). This would mean that any eligible employees earning more than £10,000 would save a total of 8% of earnings not just from their earnings above £6,240 but from the first pound of earnings.
Legislation was passed in 2023 that gives the government the power to eliminate the lower limit of qualifying earnings and to lower the minimum age for eligibility to 22 – following the recommendation of these changes by the 2017 Automatic Enrolment Review (Department for Work and Pensions, 2017). This means that the process of implementing these changes would be straightforward as the legislation for doing so is already in place. While removing the lower limit of qualifying earnings will increase effective saving rates, concerns have been raised about this exposing low earners to financial vulnerability today (see e.g. Pensions Policy Institute, 2026).
The second scenario, Scenario B, is the proposal from last year’s IFS Pensions Review (Cribb et al., 2025). This proposal aims to balance several objectives. First, there is a non-contingent employer contribution available to all employees earning more than £4,000 per year, which is aimed at widening pension participation especially among lower earners. The total contribution rate is also set at a higher level (10%) but starting from an increased lower limit of qualifying earnings of £9,000 (up to a higher upper limit of qualifying earnings of £90,000).7 This means that under this proposal most of the additional pension saving from employees is aimed at middle earners, who potentially can more easily afford a reduction in their standard of living today than lower earners. The purpose of this report is not to campaign for this option as the ‘right’ way of increasing contributions, but it is a useful example of how a slightly different structure can be used to help balance some of the key trade-offs.
Scenarios C and D show the effect of increasing the minimum total contribution rate to 12%, with 6% coming from employers. This figure (12%) has been proposed by a number of industry bodies and commentators (e.g. Association of British Insurers, 2022; Standard Life, 2023). Scenario C shows this level of contributions while keeping the lower limit of qualifying earnings unchanged, whereas in Scenario D we show the effects of a 12% contribution rate when the lower limit of qualifying earnings is also eliminated. In both scenarios, we also extend the upper limit of qualifying earnings to £65,000. This is partly to offset the fall in the real value of the upper limit since 2021–22 – the year since which it has been fixed in cash terms – and also as it ensures that more saving is concentrated on periods of people’s careers where earnings are higher and additional saving is generally more affordable.
Table 4. Four scenarios for automatic enrolment parameters compared to the current system
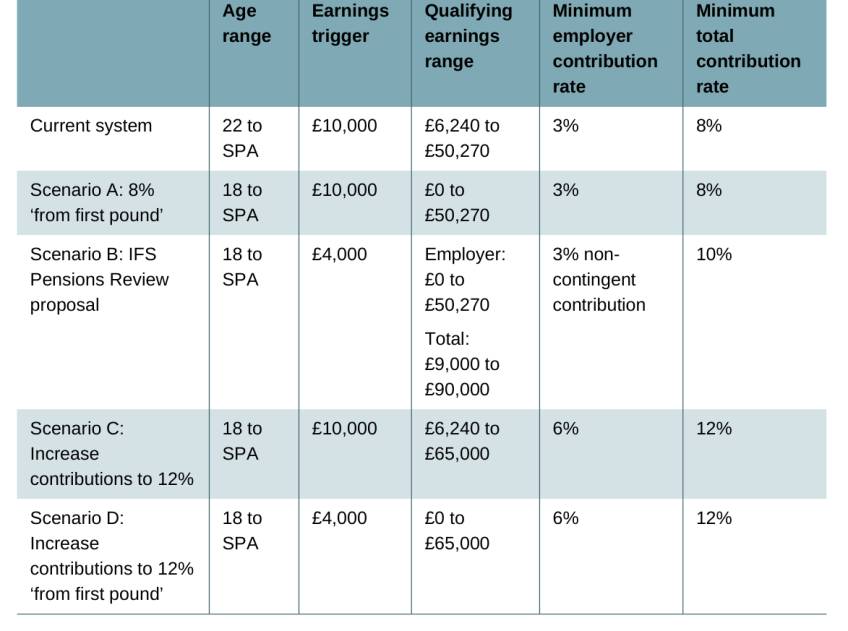
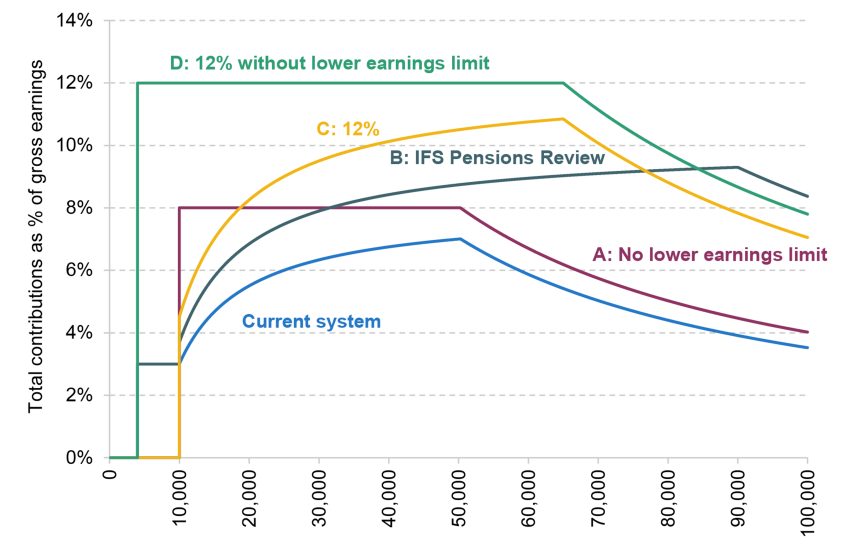
Figure 5 provides a graphical illustration of minimum total contribution rates as a percentage of earnings under the four scenarios. All scenarios increase saving compared to the current system, but to a different extent across the income distribution. In general, removing the lower limit of qualifying earnings (as in Scenarios A and D) increases minimum saving rates among lower earners most dramatically, while Scenarios B and C focus increases in saving rates more on middle and higher earners.
However, even under Scenarios A and D, minimum contribution rates (as a % of total earnings) are significantly higher even for middle and higher earners. For example, the current total minimum contribution rate is 7% of total earnings for someone with pay of £50,000 per year. Under Scenario A, the minimum contribution rate would rise to 8% and, under the IFS Pensions Review proposal, would rise to 8.7%. Under Scenario C, the total contribution would be 10.5% at this earnings level, compared with 12% in Scenario D.
Figure 5. Minimum total (employee + employer) contribution rate, measured as % of total earnings, under the different scenarios
Source: Authors’ calculations.
Aggregate impact of the scenarios
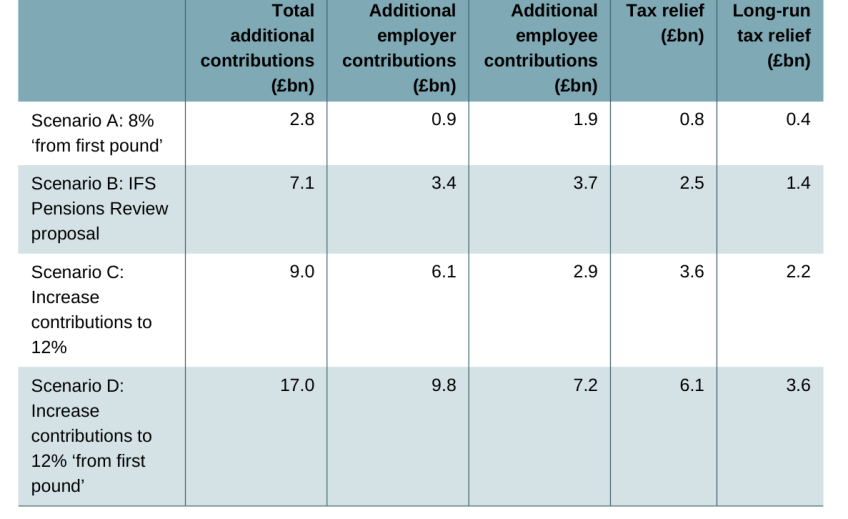
In order to first give a sense of scale of the reforms, the extent to which additional contributions come from employees versus employers and the impact on public finances, Table 5 shows the aggregate impact of the scenarios compared with the current system and taking account of current saving patterns.
The first column shows the estimated annual additional contributions made into private pensions as a result of the reforms, indicating their relative size. Scenario A – removing the lower qualifying earnings limit – would increase total contributions by £2.8 billion per year, whereas the effect of the IFS Pensions Review proposal is considerably higher than this at £7.1 billion.8 Increasing contributions to 12% further increases saving – where the additional contributions are paid only from qualifying earnings (Scenario C), the additional contributions would be £9 billion, whereas with 12% from first pound (Scenario D) the additional saving would be £17 billion.
Table 5. Aggregate impact of the scenarios
Note: This table shows the effect of the scenarios on aggregate employer pension contributions, employee contributions, and up-front and long-run tax relief (both income tax and National Insurance contributions). The sample is all private sector employees aged between 16 and 74 in the Annual Survey of Hours and Earnings in 2024. We uprate earnings to 2026 prices. To calculate the up-front and long-run tax relief, we assume that employer pension contributions are fully incident on wages and that additional employee contributions are not made via salary sacrifice.
Source: Authors’ calculations.
The contribution schedule also determines the extent to which additional saving comes from employees compared with employers (assuming no behavioural response). Removing the earnings trigger increases employee contributions by more than employer contributions, because under the current system employee contribution rates are higher than employer rates (5% and 3% respectively). Under the IFS Pensions Review proposal, the additional contributions are relatively evenly split by employers and employees.
Under Scenarios C and D, more of the additional contributions come from employers. While the earnings trigger is also different between Scenarios C and D (£10,000 and £4,000, respectively), the vast majority of additional saving between these scenarios is due to the removal of the lower limit of qualifying earnings in Scenario D – as Figure 5 illustrates, this generates a great deal of additional saving across the income distribution.
Higher pension contributions will also lead to more tax relief, as pension saving is tax-favoured. The magnitude of this additional cost to public finances is shown in the final two columns of Table 5, under the assumption that employers reduce wages to fully offset the costs of the increase in employer pension contributions. The effects on tax relief clearly reflect the magnitude of the additional saving brought about by the reforms. The long-run tax relief is lower as it takes account of the fact that tax is paid on the pension contributions when they are accessed.9
Effects on employees
One of the key trade-offs for policymakers when setting higher minimum contributions is that increased saving will increase future retirement incomes but reduce take-home pay today. In this section, we show the modelled effects of the four scenarios on employees across the income distribution, both by looking at how they affect current take-home pay and projected retirement income adequacy measures.
Effects on take-home pay today
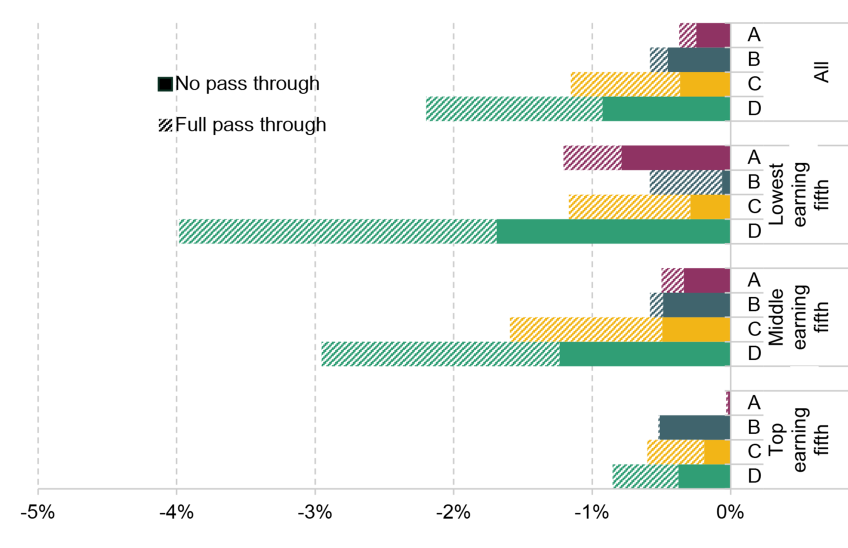
Figure 6 shows the modelled impact of the four scenarios on average current take-home pay. The solid bars show the falls in current take-home pay that result directly from higher employee contributions. The average reduction in take-home pay from employee contributions varies between –0.2% for Scenario A and –0.9% for Scenario D.
The effects of the scenarios differ between different earnings groups, both because the magnitude of the increase in minimum pension saving rates varies across the earnings distribution and because there are differences in current pension saving levels between the earnings groups. Figure 6 shows that the effects on take-home pay are much more pronounced for lower income groups when the lower limit of qualifying earnings is removed (Scenarios A and D). This is consistent with Figure 5, which showed that these policies particularly increased minimum contribution rates for lower earners.
Scenario A shows that the reduction in take-home pay among the bottom fifth of the take-home pay distribution is –0.8% when the lower limit of qualifying earnings is removed from the current system. Similarly, comparing Scenarios C and D shows that moving to a 12% total contribution rate while maintaining the lower limit of qualifying earnings reduces take-home-pay among low earners by –0.3%, whereas additionally eliminating the lower limit leads to a −1.7% fall in take-home pay.
The shaded bars show what the further fall in take-home pay would be if employers offset higher employer pension contributions one-for-one with lower pay. As discussed further later in this section, economic theory and evidence suggest that employers tend to respond to higher employer contributions by reducing wage growth, thereby passing these costs on to the employee.
The reductions in take-home pay are much more substantial under this assumption of full pass through of higher employer contributions onto wages. Especially under Scenario D, which increases pension saving to 12% from first pound, the total fall in take-home pay would be −4.0% for low earners and –3.0% for middle earners.
Figure 6. Modelled percentage change in take-home pay from different scenarios (A to D), for the top, middle and bottom quintile of the take-home pay distribution, with and without pass through of higher employer contributions onto pay
Note: The sample contains 25- to 59-year-old private sector employees saving into a DC pension in Round 7 of the Wealth and Assets Survey. We calculate the average percentage fall in take-home pay (relative to today) for each quintile of the take-home pay distribution under the four scenarios. We separate out falls from higher employee contributions and falls from higher employer contributions where employers reduce wages one-for-one. See Table 4 for a description of Scenarios A to D.
Source: Authors’ calculations.
A key question for the Pensions Commission is how to trade off these falls in take-home pay today against higher retirement incomes in later life.
Households may respond to lower take-home pay in different ways, such as by reducing consumption today, saving less in other assets or taking on debt. Evidence suggests that households respond through all of these margins and that the margin of adjustment differs by type of household. Choukhmane and Palmer (2025) found that, when UK automatic enrolment minimum contribution rates increased from 2% to 8%, about one-third of this increase was funded through reduced spending, with the rest of the decrease in take-home pay financed through higher borrowing and lower non-retirement savings. Low-liquidity households were particularly likely to reduce spending today in response to higher pension saving, whereas higher-liquidity households were more likely to reduce saving in other assets.
Similarly, evidence from Nest Insight (recently renamed Centre for Inclusive Money at Nest) (Beshears et al., 2024) showed that over the first 41 months after being automatically enrolled into a pension in the UK, each additional month increased the average employee’s pension savings by £32 to £38 and unsecured debt (such as personal loans and bank overdrafts) by £7. However, they also found that loan defaults fell and credit scores rose modestly. These two studies highlight that, even if changes to automatic enrolment do induce more saving in private pensions, households may offset this to a notable degree by saving less in other assets or taking on more debt.
The trade-off between current and future income is sharper because many working-age households currently have incomes that are below some of the benchmarks suggested for measuring retirement income adequacy. The Pensions UK minimum retirement living standard (RLS) is an illustrative benchmark for what spending level would be enough to achieve a basic minimum living standard in retirement, based on qualitative analysis of public views.
Figure 7 shows that 23% of people in working households (working-age households where at least one person is in paid work) have a current household income (after deducting housing costs) that is below the Pensions UK minimum RLS. In other words, nearly a quarter of working-age people in working households currently have a standard of living that is below what many consider as the minimum that people should strive for in retirement. A standard economic model of consumption smoothing, where people should save in periods when they have relatively high incomes, would not suggest increasing pension saving contributions for this group.10
One of the challenges of pension saving for low earners is that they generally have very low levels of liquid wealth, which impacts their financial resilience. As a result, many low earners could arguably benefit from having more emergency savings to deal with issues that arise during working life, rather than having their savings locked in until age 55 (soon to be 57). Nest Insight proposed a ‘sidecar’ saving product as a solution, where low earners would be nudged into building financial resilience by automatically enrolling them into making cash savings until they reach a particular level of earnings, and only then enrolling them into private pension saving (Broome, Phillips and Sandbrook, 2026). While this could address some of the concerns around the financial resilience of low earners, there remain practical challenges in implementing these solutions.
Figure 7. Share of people in working households with income net of housing costs below the minimum Pensions UK retirement living standards, 2026
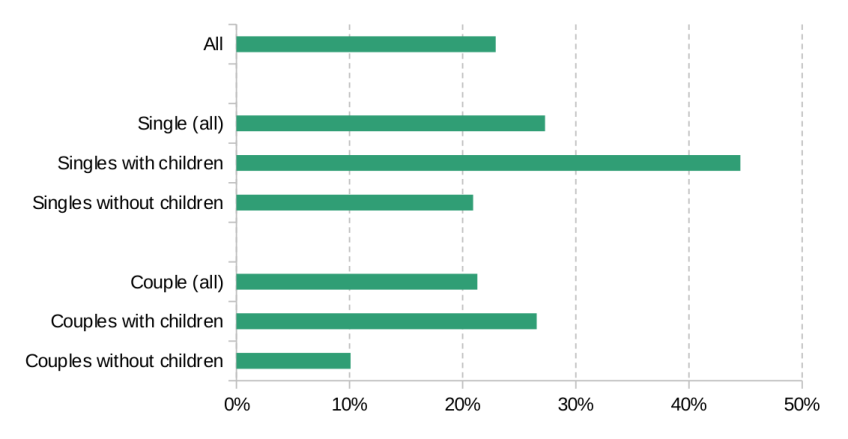
Note: Single/couple households with children have their income equivalised to the level of a single/couple household without children before being compared with the Pensions UK standards. Equivalisation uses the OECD modified scale. Working-age households with someone in paid work are included.
Source: Authors’ calculations using the Family Resources Survey 2024–25, uprated to May 2026.
Effects on retirement income adequacy
In this section, we illustrate the other side of the trade-off: the impact of the four scenarios on measures of retirement income adequacy.
We first use a ‘target replacement rate measure’, which compares an individual’s projected retirement income to their average income when working in their 50s. The exact target replacement rates (see Appendix Table A1) are aligned with the Second Pensions Commission’s interim report (Department for Work and Pensions, 2026). They decline from 80% of pre-retirement earnings for people earning less than £15,900 to 50% for those earning more than £67,000 per year. The goal of target replacement rates is to ensure that people do not see too large a drop in their living standards in retirement.
An alternative definition of adequacy is whether someone has some minimum level of income in retirement. To measure this, we use the Pensions UK minimum RLS, currently set at £13,900 net income per year for a single person and £22,500 for a couple, abstracting from housing costs.11, 12
The green bars in Figure 8 show the proportion of our sample (private sector employees aged 25 to 59 currently saving in a DC pension) who are projected to have an adequate income in retirement on current trends, given these two measures of adequacy. The purple bars show the extent to which the additional saving from the four scenarios translates to more people reaching retirement income adequacy. The left-hand-side bars use target replacement rates as the adequacy measure, and the right-hand-side bars use the Pensions UK minimum RLS.
As expected, the increases in the proportion of people reaching adequacy are higher for the scenarios with more saving. Removing the lower limit of qualifying earnings under the current saving rates (Scenario A) increases the share of people projected to reach their target replacement rate from 66% to 69%, whereas increasing the contribution rates to 12% from first pound (Scenario D) increases the share to 78%.
More people are projected to reach the Pensions UK minimum RLS under the status quo (91%), largely driven by the fact that the full new state pension on its own is enough to get many people close to, or above, the minimum RLS.13 The magnitude of the increases in the share of people projected to reach this minimum level of income is more subdued than with target replacement rates as an adequacy measure, between 2 and 4 percentage points across the four scenarios. It is notable that, while our modelling suggests that without reform 9% of pensioners will have an income below the Pensions UK minimum RLS, analysis of current data (in Figure 7) shows that 23% of people in working households currently have incomes below this level.
Figure 8 shows the effects of the scenarios where adequacy is measured at the individual level. Figure A1 in the Appendix shows the same results at the couple level, and also taking account of projected housing costs in retirement. In this analysis, the share of people projected to reach their target replacement rate and the Pensions UK minimum RLS is higher under current policy, and the increase in the share of people projected to reach either of these adequacy measures due to the modelled scenarios is smaller. For the remainder of the analysis, we focus on results at the individual level without accounting for housing costs, but this is an important caveat to keep in mind.
Figure 8. Effect of the scenarios on percentage of people projected to reach an adequate retirement income – private sector employees aged 25 to 59 saving in a defined contribution pension
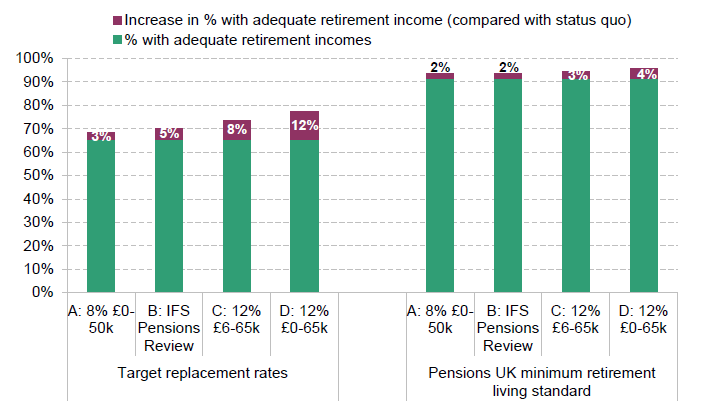
Note: The sample contains 25- to 59-year-old private sector employees saving into a DC pension in Round 7 of the Wealth and Assets Survey. We simulate projected future retirement income under their current saving rate, and under the scenarios, modelling everyone at the individual level and without accounting for future housing costs or inheritances.
Source: Authors’ calculations.
The impact of increasing automatic enrolment minimum contributions on adequacy will differ between age groups, mostly because younger generations will have more time to work and save under the reformed system. As a result, those who are currently younger, and face the higher saving rate automatic enrolment system for longer, see larger effects of the reforms, as shown in Figure 9. For example, moving to 12% of qualifying earnings (Scenario C) increases the proportion of 25- to 34-year-olds projected to reach their target replacement rate by 14 percentage points, compared with 8 percentage points among all aged 25 to 59.
Figure 9. Effect of the scenarios on percentage of people projected to reach an adequate retirement income – private sector employees aged 25 to 34 saving in a defined contribution pension
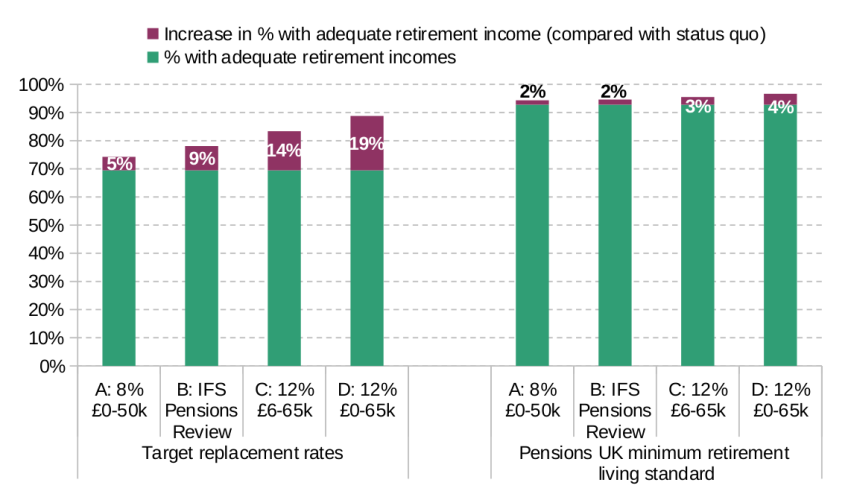
Note: The sample contains 25- to 34-year-old private sector employees saving into a DC pension in Round 7 of the Wealth and Assets Survey. We simulate projected future retirement income under their current saving rate, and under the scenarios, modelling everyone at the individual level and without accounting for future housing costs or inheritances.
Source: Authors’ calculations.
Effects on retirement income adequacy across the earnings distribution
In order to further assess the trade-off between reduction in take-home pay today and more resources in retirement, we also show how the retirement income adequacy measures, and the impact of the four scenarios, differ by earnings.
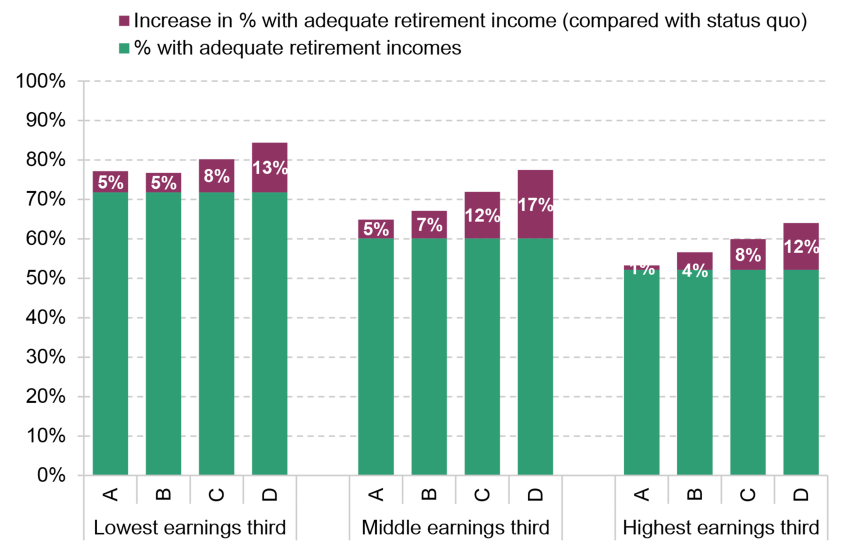
Figure 10 shows both how the baseline level of projected adequacy (green bars) and the size of the impact from the scenarios differ between thirds of the earnings distribution. Based on the target replacement rate measure (Panel A), low earners are much more likely to be on track to achieve this level of income than high earners, mostly due to the flat rate new state pension on its own getting low earners much closer to their target replacement rates. The effect on projected adequacy rates from all of the scenarios is largest for middle earners. Looking at the target replacement rates alone would suggest that policy should focus on undersaving particularly among middle and higher earners. However, using the Pensions UK minimum RLS as an adequacy measure, nearly all middle and higher earners are projected to reach this minimum income level, whereas only 77% of the lowest earning third are projected to be on track for this income. This is because lower earners would typically have to save a much higher share of their income to reach a fixed income standard than higher earners.
Figure 10. Effect of the scenarios on percentage of people projected to reach an adequate retirement income, by earnings third – private sector employees aged 25–59 saving in a defined contribution pension
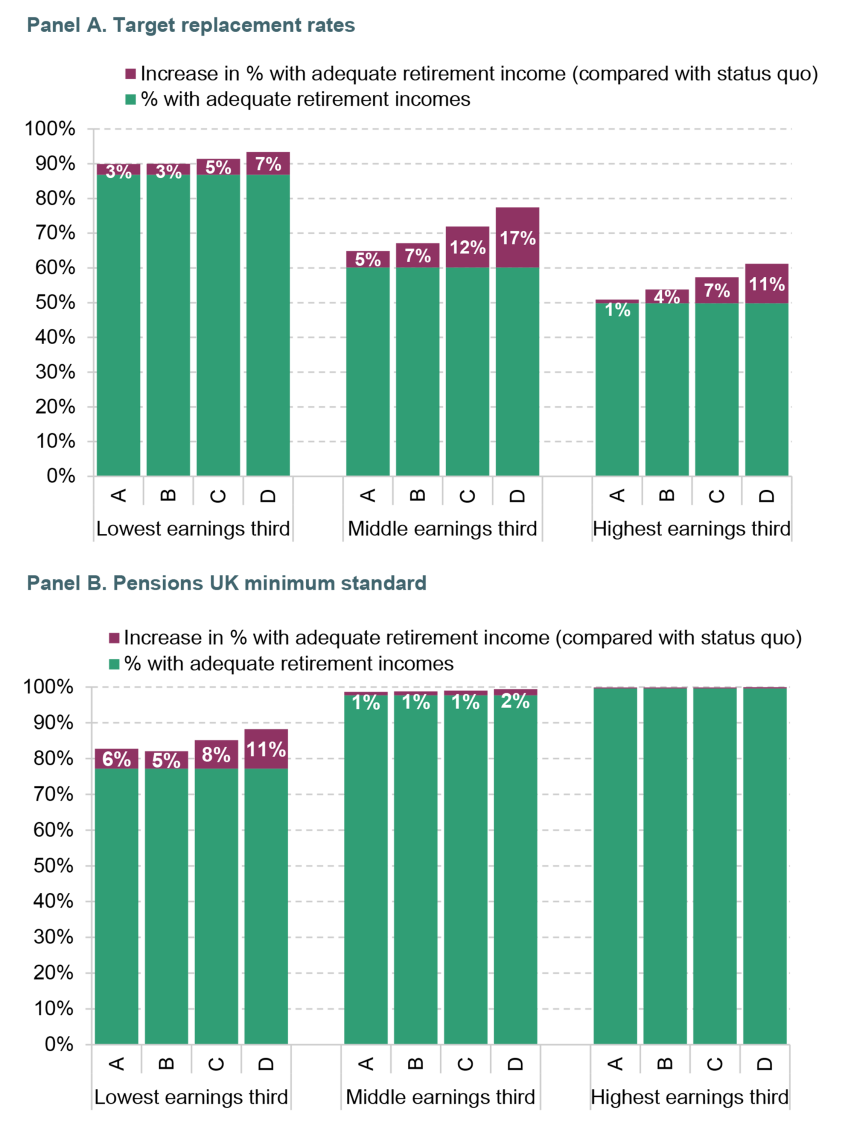
Note: A: 8% £0–50k; B: IFS Pensions Review; C: 12% £6–65k; D: 12% £0–65k. The sample contains 25- to 59-year-old private sector employees saving into a DC pension in Round 7 of the Wealth and Assets Survey. We simulate projected future retirement income under their current saving rate, and under the scenarios, modelling everyone at the individual level and without accounting for future housing costs or inheritances. Earnings thirds are based on pre-retirement earnings, i.e. simulated average earnings between ages 50 and 59. Average target replacement rates across the earnings groups: 74%, 67% and 57%, respectively.
Source: Authors’ calculations.
This finding is also highlighted in the Second Pensions Commission’s interim report – the two adequacy measures can lead to different conclusions in terms of which groups are most at risk of an inadequate income in retirement.
Given this, the Second Pensions Commission suggested that a ‘hybrid measure’ that builds on replacement rates for middle earners while focusing on a basic adequacy standard for lower earners could help guide policy in the future. While details of what this measure would entail have not yet been confirmed, we have modelled the effects of our scenarios using an illustrative hybrid measure that combines elements from both of these approaches. In particular, under this hybrid measure:
- Any income below the Pensions UK minimum standard is considered inadequate. This acts as a floor – even those who reach a high replacement rate in retirement due to very low incomes before retirement will need to reach the minimum standard to achieve adequacy.
- Any income above the Pensions UK moderate standard (net income of £32,700 for a single person and £45,400 for a couple, ignoring housing costs) is considered adequate. This is a ceiling that is relevant for higher earnings – even those who do not reach their target replacement rates because of high pre-retirement incomes are considered to have an adequate income if their retirement income is above the Pensions UK ‘moderate’ standard.
- For those with incomes between these two levels, their retirement is considered adequate if they reach their target replacement level.
Figure 11 shows the baseline level of adequacy and the impact of the scenarios across the earnings distribution under the hybrid adequacy measure. We continue to focus on results at the individual level.
First focusing on baseline adequacy, Figure 11 shows that, under this hybrid measure, fewer lower earners are projected to reach retirement income adequacy. In particular, while, under the target replacement rate measure, 87% were projected to reach an adequate income in retirement and, under the Pensions UK minimum standard, 77% were on track for an adequate income, under this hybrid measure, 72% are now on track for adequacy. This is partly by construction: under this measure, lower earners have now to meet two conditions (target replacement rate and the Pensions UK minimum standard) rather than one.
On the other hand, those with middle and higher earnings face very similar adequacy projections under this hybrid measure as with the target replacement rate measure. For higher earners, the share reaching adequacy increases very slightly, from 50% to 52%. In other words, only a very small share of higher earners are on track to meet the Pensions UK moderate standard but are not on track to meet their target replacement rate. There is no difference between the hybrid measure and the target replacement rate measure for middle earners. This means that, under this illustrative hybrid measure, while the lowest earning third are now less likely to reach adequacy than under the other measures, the gradient where middle and higher earners are less likely to be on track for adequacy still remains.
Of course, the hybrid measure could use a lower level of income as the ‘ceiling’ if policymakers consider a lower income to be adequate, even if it means not reaching target replacement rates. Appendix Figures A2 and A3 show what the results would look like with a ceiling set at a level halfway between the minimum and moderate RLS (£23,300 net income for a single person, ignoring housing costs). With this lower ceiling, the gaps between earnings groups are smaller, and it is the middle earners who have the lowest share of people reaching adequacy (60%), compared with 72% for low earners (as below) and 65% for high earners. However, a ceiling income of £23,300 (for a single person) would mean that many high earners would be considered by this measure to be on track for an adequate income in retirement, despite potentially facing very significant falls in their standards of living at the point of retirement on the basis of their state and private pension entitlements.
Figure 11. Effect of the scenarios on percentage of people projected to reach an adequate retirement income based on an illustrative hybrid measure of adequacy – defined contribution savers only, by earnings thirds
Note: A: 8% £0–50k; B: IFS Pensions Review; C: 12% £6–65k; D: 12% £0–65k. The sample contains 25- to 59-year-old private sector employees saving into a DC pension in Round 7 of the Wealth and Assets Survey. We simulate projected future retirement income under their current saving rate, and under the scenarios, modelling everyone at the individual level and without accounting for future housing costs or inheritances.
Source: Authors’ calculations.
Importantly, both these hybrid adequacy measures are meant to be illustrative rather than our recommendation on how to define an adequate income in retirement. Nor are we suggesting that moving to a single hybrid adequacy measure is necessarily the right thing to do. In fact, there are good reasons for using two separate adequacy measures, because they answer different questions.
A single income standard, such as the Pensions UK minimum RLS or the income poverty line, tells us which groups of people are projected to have a standard of living in retirement below a certain level. Different people are likely to disagree on where this line should be drawn and what the purpose of such a standard should be. These lines could be seen either as useful benchmarks to understand which people are likely to struggle financially in retirement, or they could be perceived as a minimum acceptable living standard that government policy should ensure people reach.
However, individuals having an expected income in retirement that is below a particular line does not necessarily mean these people are themselves saving too little for retirement. Many people live on incomes below these income levels during working life too – and for those that do, it is by no means clear that they should further reduce their income in working life in order to increase their income in retirement. Ultimately, private saving moves resources from one period of life to another, so whether someone is saving ‘enough’ for retirement should be assessed relative to their income during working life. This is exactly the comparison that target replacement rates make.
Effects on employers
All of our illustrative scenarios would increase both employee and employer pension contributions, as shown in Table 5. While many stakeholders agree that this is a reasonable response to concerns around undersaving into pensions (see e.g. Pensions UK, 2026), there are also concerns around the impact this will have on employers. This is particularly the case as many employers have already faced significant increases to costs in recent years because of both the large increases to minimum wages over the last decade and the significant increases to employer National Insurance contributions that were announced in Autumn Budget 2024 and implemented in April 2025.
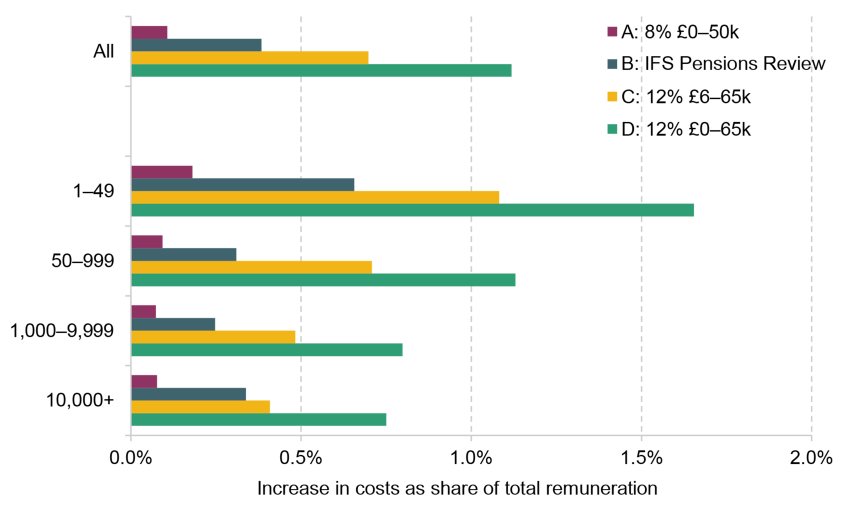
Figure 12 illustrates the increase in employer contributions as a share of current total remuneration (pay and employer contributions) arising from the different scenarios. The increase in employer contributions varies from 0.1% of total remuneration for Scenario A to 1.1% of total remuneration for Scenario D. The split by employer size also clearly shows that the increase in employer contributions as a share of total remuneration would be significantly larger among small employers than larger employers. For example, Scenario D would increase employer costs by 1.7% of total remuneration for employers with fewer than 50 employees, compared with 0.8% of total remuneration for employers with more than 10,000 employees. This is largely driven by the fact that small employers are more likely to be currently paying only the minimum contribution rates, meaning that an increase in those rates would directly affect the amount of mandated saving they have to do.
Figure 12. Increase in employer costs as a percentage of total remuneration due to suggested scenarios, by employer size
Note: The figure illustrates the modelled increase in employer costs from higher employer contributions, assuming no adjustment or behavioural response from employers.
Source: Authors’ calculations using the Annual Survey of Hours and Earnings 2024.
It is worth noting that the analysis in Figure 12 provides a static picture of increased costs for employers. However, as discussed in relation to the effects on take-home pay in Figure 6, existing evidence suggests that employers may be able to pass through some, if not all, of the increase in mandated pension contributions to employees in the form of lower wages or wage growth, although the extent of this ‘pass through’ can be hard to predict.
Economic theory (as highlighted in Gruber, 2008) suggests that if a mandated benefit (such as an employer pension contribution) is valued as much as take-home pay by employees, then the cost of the additional benefit is likely to pass through entirely into lower wages. However, it could be that, on average, employees value pension contributions less than the equivalent value in take-home pay – for example, because some employees might be shortsighted and tend to undervalue the future, or because some have low earnings and do not want to save at that time. In this case, as well as in the case where employers have significant market power in the labour market (Manning 2001), an increase in mandated employer contributions would not pass through one-to-one into lower wages.
Empirically, current evidence suggests that especially where the additional compulsory payments have a strong link to the benefit that the worker receives as a result of them – as is the case with employer contributions to pensions – most, if not all, of the increased employer costs are passed on to employees in the form of lower wages. On the other hand, the pass-through rate tends to be lower when the link between the payments and the benefits is much weaker (such as employer National Insurance contributions in the UK).14
The ability of employers to pass increased costs on through lower wages will also depend on how much notice employers have of the changes. There are nominal rigidities in wage setting, meaning that employers cannot immediately pass on increased costs by reducing nominal wages. However, assuming that any reforms are announced several years in advance of their implementation, as has been suggested by the Pension Minister, employers could respond by increasing wages more slowly than they would have otherwise done.
Interactions with minimum-wage policies
While economic theory and evidence suggest that in the medium to long run employers can pass on increased employer costs to employees in the form of lower wages, this is not possible in the case of employees who are being paid the minimum wage, as this acts as a statutory floor on the wage an employer can pay their employees.
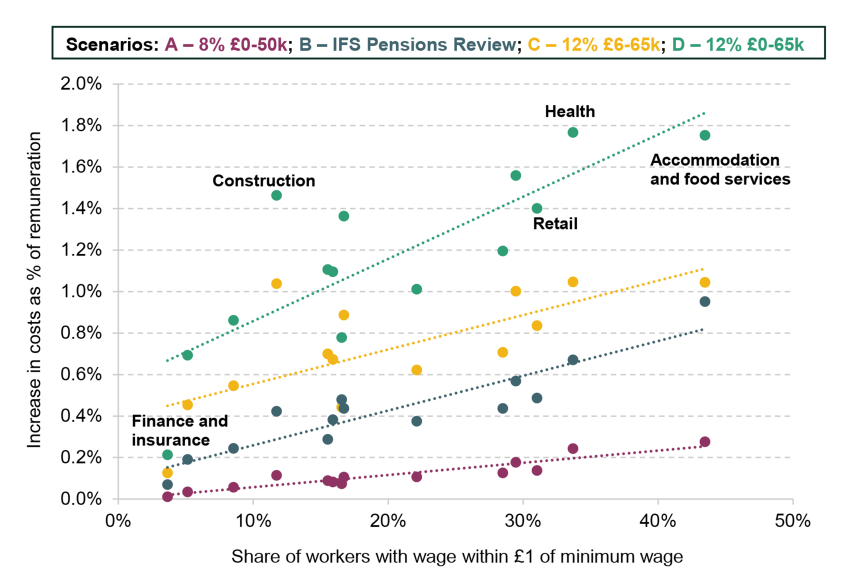
In order to understand which industries are most likely to be affected by both the minimum wage and potential increases in employer contributions, Figure 13 shows the share of workers with an hourly wage within £1 of the minimum wage on the horizontal axis and the increased employer costs as a percentage of total remuneration on the vertical axis. Each dot indicates a different industry, and the colours correspond to the four scenarios. We fit linear trend lines through the data points for each scenario.
Figure 13 shows that all the trend lines are upwards sloping. In other words, the increase in employer costs relative to total remuneration, resulting from an increase in minimum contribution rates, is higher in industries that employ more minimum-wage workers. This is driven by the fact that industries that have a higher share of minimum-wage workers also tend to be more likely to pay their employees the statutory minimum employer contributions only, meaning that they are directly affected by the increases in minimum rates.15
This figure also illustrates that the larger the reform (in terms of the amount of additional contributions generated), the stronger this positive relationship between the share of minimum-wage workers in the industry and the increase in employer costs relative to total remuneration. For example, the share of employees within £1 of the minimum wage is 4% in finance and insurance, and 43% in food and accommodation. The removal of the lower qualifying earnings limit (Scenario A) increases employer costs in finance and insurance by 0.01%, and by 0.28% for accommodation and food services, while under Scenario D, where the saving rate is increased to 12% from the first pound of earnings, the additional employer cost in finance and insurance is just 0.21% of total remuneration, whereas in accommodation and food services this additional cost is 1.75% of total remuneration.
Figure 13. The increase in employer costs as a % of remuneration, by share of workers with wage within £1 of minimum wage
Source: Authors’ calculations using the Annual Survey of Hours and Earnings 2024.
Policymakers and other stakeholders may worry about this relationship in particular because these employers cannot directly pass through increased contributions to lower wages, as employers cannot pay a wage below the minimum-wage level. This may lead to employers adjusting to higher costs in other ways for example by reducing hiring, which may be particularly worrying in industries such as hospitality that tend to employ many young people.
Firms may also respond in other ways that would have a negative effect on workers, such as by requiring more effort or reducing schedule flexibility and safety measures. On the other hand, firms may try to raise prices of their products or accept lower profits. Clemens (2021) has a comprehensive review of potential margins of adjustment and the empirical evidence.
One factor that would mitigate the impact for low-paying industries is pass through into lower average wages because, under current government policy, this would also lead to a lower minimum wage (it is currently set at two-thirds of median hourly wages). In practice, this would occur due to the (nominal) minimum wage rising at a slower pace than it would have otherwise. However, because rises in employer costs are particularly high in low-paid sectors (as shown in Figure 13), this means that even full pass through of the average rise in the employer cost into lower average wages (and a commensurately lower minimum wage) would not offset the rise in employer costs coming from higher minimum contributions for the low-paying industries.
4. Conclusion and discussion
As highlighted in the IFS Pensions Review (Cribb et al., 2025), there is no one-size-fits-all answer to how much people should be saving in a private pension. Many lower earners will legitimately want to prioritise current consumption over more saving for retirement, while many higher earners might prefer to push income into older age. But, even for people on the same levels of earnings, differences in preferences, expectations about future earnings, other wealth, and earnings and savings of a partner or spouse are all likely to lead to people wanting to save different amounts in pensions. As a result, the design of automatic enrolment involves a series of trade-offs that the Second Pensions Commission will have to face when making policy recommendations in its final report.
The clearest trade-off is simply that more saving has to be paid for somehow – by individuals, their employers or the state. In general, increasing pension contributions through automatic enrolment will lead to lower take-home pay today, regardless of whether the extra contributions are made by employees or their employers.
The way in which the Commission should adjust any automatic enrolment parameters will depend on what its key policy objectives are. The focus on low earners in the Second Pensions Commission’s interim report raises questions about whether these people can – or should – face a drop in their living standards today in order to improve their living standards in retirement. This might be appropriate for some, but for many it will not. Changing minimum contributions could potentially also affect pension participation. All else equal, higher employee contribution rates would discourage participation, whereas higher employer contribution rates would encourage it. The effect of increasing both is then likely to be ambiguous. Moreover, empirical evidence suggests that any participation change as a result of higher contributions on a scale modelled in this report is likely to be limited.
The trade-off between take-home pay today and retirement income in the future is particularly pertinent given that over one-in-five people in working households currently have income below the Pensions UK minimum RLS. One way to make this trade-off less severe – that is, to increase retirement incomes among many people who are low earners today at a lower cost to them – is to encourage them to save more at other times when their earnings are higher.
However, if the Second Pensions Commission decides that it is worthwhile increasing pension saving for those with currently low earnings, it should consider how best to mitigate the associated falls in living standards today. For example, one option would be to incorporate a more accessible savings account into the automatic enrolment system, as suggested by Nest Insight (Broome, Phillips and Sandbrook, 2026). Increased contributions made by low earners could then be accessed by those who face hardship while in working life, and this policy could also lead to increased financial resilience, particularly given concerns about low levels of liquid savings among low- and middle-income households (Boileau, Cribb and Wernham, 2023).
Integrating accessible savings into the automatic enrolment system would, however, undoubtedly increase the complexity of the system. There is a trade-off between a more complex system which might be better targeted at different groups’ needs and the drawbacks that complexity brings (as discussed in Pensions UK, 2026). A more complex system would likely lead to extra costs and administrative burden for employers and pension providers, and could increase the risk of accidental (or indeed intentional) non-compliance.
The timing of any reforms will also be important. The Pensions Minister has already made clear that any changes to automatic enrolment will not be implemented during this parliament, and indeed there are good reasons to announce changes well ahead of implementation to give individuals and (in particular) employers, time to adapt. On the other hand, delaying the implementation of reforms to automatic enrolment means fewer years with more saving. This means that many of ‘Gen X’ (approximately those born 1965 to 1980), whose outlook for retirement adequacy is of particular concern to the Second Pensions Commission (2026), will be unlikely to accumulate much more pension savings under any reformed system. However, the Commission should not avoid making decisions that could address key concerns for generations to come, even if the generation currently closer to retirement may not have time to benefit from them.
Striking an appropriate balance in response to these trade-offs will be a key challenge for the Second Pensions Commission. However, this is not all that is needed for its policy recommendations to be a success. Policy certainty and stability are of particular importance when it comes to pensions policy given the long-term nature of pension saving decisions. Long-term stability in the pensions system is likely to need cross-party political consensus to be sustainable.
Achieving this consensus within the short timeframes of the Commission will require a convincing evidential case and might mean avoiding more controversial and complex reforms. Getting this right, and striking the right balance on the trade-offs above, will mean that automatic enrolment can continue to evolve in a way that improves retirement outcomes for those currently on track to fall short.
Appendix
Table A1. Target replacement rates by earnings bands
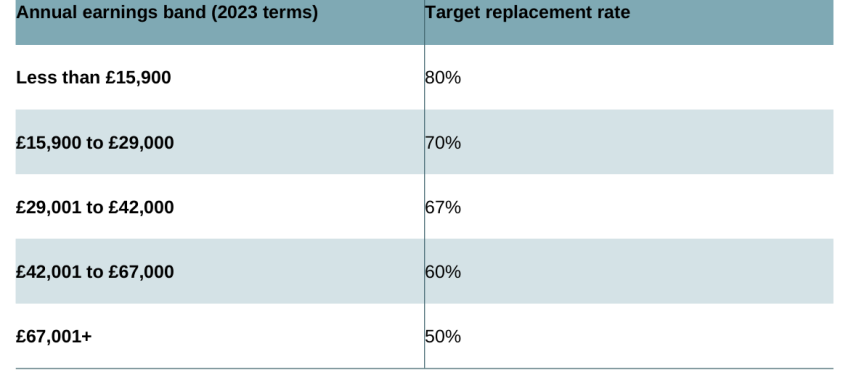
Figure A1. Effect of the scenarios on percentage of people projected to reach an adequate retirement income, including spousal income and projected housing costs – private sector employees aged 35–59 saving in a defined contribution pension
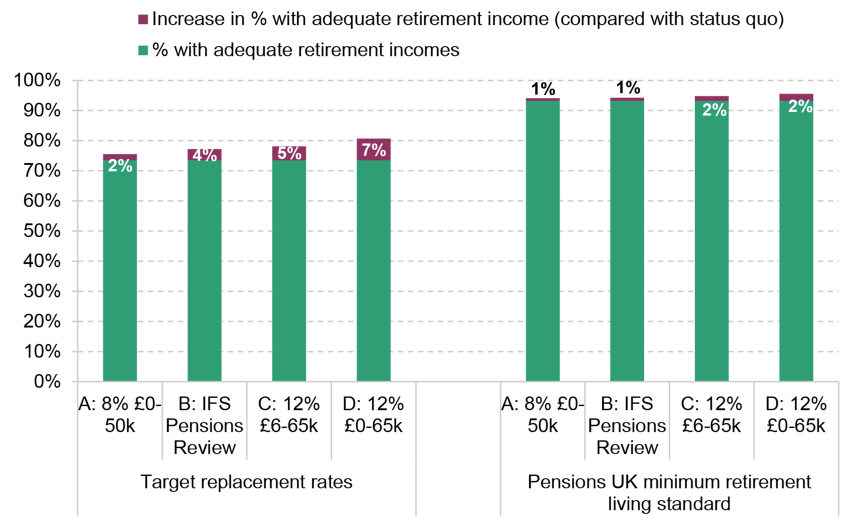
Note: The sample contains 35- to 59-year-old private sector employees saving into a DC pension in Round 7 of the Wealth and Assets Survey. We simulate projected future retirement income under their current saving rate, and under the scenarios, modelling couples jointly (assuming they share their incomes), and incorporating future housing costs for those living in private rented accommodation in retirement.
Source: Authors’ calculations.
Figure A2. Effect of the scenarios on percentage of people projected to reach an adequate retirement income based on two alternative hybrid measures with cap at moderate retirement living standards and halfway between minimum and moderate retirement living standards – private sector employees aged 25–59 saving in a defined contribution pension
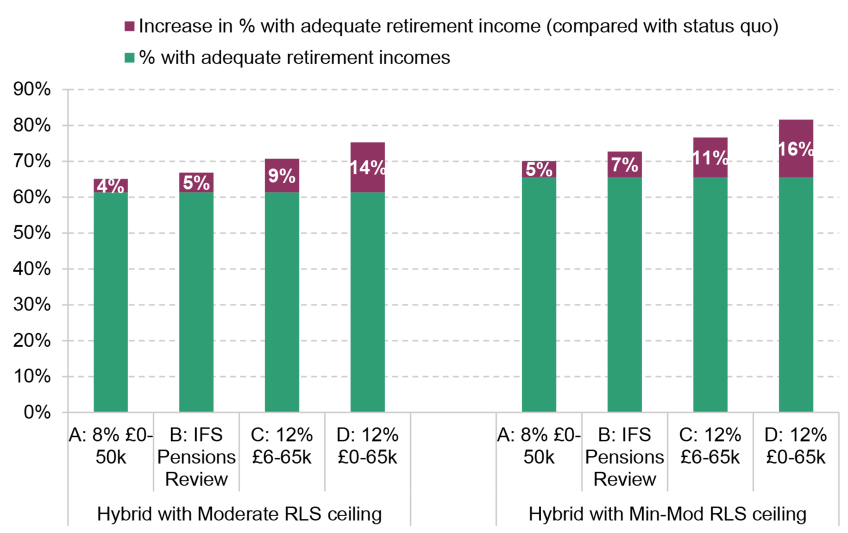
Note: The sample contains 25- to 59-year-old private sector employees saving into a DC pension in Round 7 of the Wealth and Assets Survey. We simulate projected future retirement income under their current saving rate, and under the scenarios, modelling everyone at the individual level and without accounting for future housing costs or inheritances. The hybrid measure is based on target replacement rates with a floor at the Pensions UK minimum RLS (£13,900 for a single person) and a ceiling at either the Pensions UK moderate RLS (£32,700 for a single person) or halfway between the minimum and moderate RLS (£23,300).
Source: Authors’ calculations.
Figure A3. Effect of the scenarios on percentage of people projected to reach an adequate retirement income based on an alternative hybrid measure with cap halfway between minimum and moderate retirement living standards – private sector employees aged 25–59 saving in a defined contribution pension, by earnings third
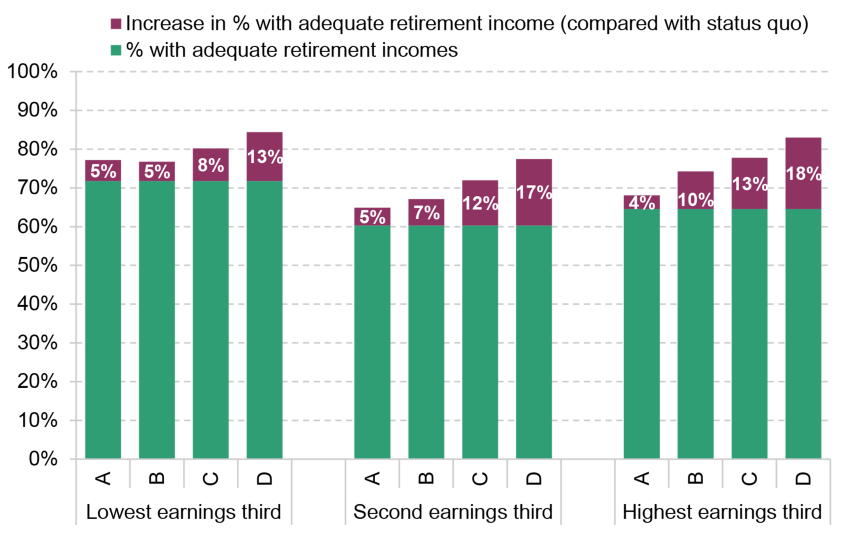
Note: A: 8% £0–50k; B: IFS Pensions Review; C: 12% £6–65k; D: 12% £0–65k. The sample contains 25- to 59-year-old private sector employees saving into a DC pension in Round 7 of the Wealth and Assets Survey. We simulate projected future retirement income under their current saving rate, and under the scenarios, modelling everyone at the individual level and without accounting for future housing costs or inheritances. The alternative hybrid measure is based on target replacement rates with a floor at the Pensions UK minimum RLS (£13,900 for a single person) and a ceiling halfway between the minimum and moderate RLS (£23,300). Earnings thirds are based on pre-retirement earnings, i.e. simulated average earnings between ages 50 and 59.
Source: Authors’ calculations.
References
Association of British Insurers, 2022. Automatic enrolment: what will the next decade bring? https://www.abi.org.uk/globalassets/files/publications/public/lts/2022/automatic-enrolment-what-will-thenext-decade-bring/.
Beshears, J., Blakstad, M., Choi, J.J., Firth, C., Gathergood, J., Laibson, D., Notley, R., Sheth, J.D., Sandbrook, W. and Stewart, N., 2024. Does pension automatic enrollment increase debt? Evidence from a large-scale natural experiment. Nest Insight Working Paper, https://www.nestinsight.org.uk/wp-content/uploads/2024/02/Does-pension-automatic-enrollment-increase-debt.pdf.
Boileau, B., Cribb, J. and Wernham, T., 2023. Characteristics and consequences of families with low levels of financial wealth. IFS report, https://ifs.org.uk/publications/characteristics-and-consequences-families-low-levels-financial-wealth.
Broome, M., Phillips, J. and Sandbrook, W., 2026. Balancing today and tomorrow: a blueprint for unlocking a more adequate, fair and sustainable auto enrolment system. Nest Insight, https://www.nestinsight.org.uk/wp-content/uploads/2026/06/Balancing-today-and-tomorrow.pdf.
Choukhmane, T. and Palmer, C., 2025. The effect of increasing retirement saving on consumption, balance sheets, and welfare. Working Paper, https://tahachoukhmane.com/wp-content/uploads/2025/09/CP_Retirement.pdf.
Clemens, J., 2021. How do firms respond to minimum wage increases? Understanding the relevance of non-employment margins. Journal of Economic Perspectives, 35(1), 51–72, https://doi.org/10.1257/jep.35.1.51.
Coates, B., Mackey, W. and Cowgill, M., 2020. No free lunch: higher superannuation means lower wages. Grattan Institute Working Paper 2020-01, https://grattan.edu.au/wp-content/uploads/2020/02/No-free-lunch-Higher-superannuation-means-lower-wages.pdf.
Crawford, R., O’Brien, L. And Sturrock, D., 2021. When should individuals save for retirement? Predictions from an economic model of household saving behaviour. IFS report, https://ifs.org.uk/sites/default/files/output_url_files/BN326-When-should-individuals-save-for-retirement.pdf.
Cribb, J., Emmerson, C., Johnson, P., Karjalainen, H. and O'Brien, L., 2025. The Pensions Review: final recommendations. IFS report, https://ifs.org.uk/publications/pensions-review-final-recommendations.
Department for Work and Pensions, 2017. Automatic enrolment review 2017: maintaining the momentum. https://www.gov.uk/government/publications/automatic-enrolment-review-2017-maintaining-the-momentum.
Department for Work and Pensions, 2025a. Workplace pension participation and savings trends of eligible employees: 2009 to 2024. Official statistics, https://www.gov.uk/government/statistics/workplace-pension-participation-and-savings-trends-2009-to-2024/workplace-pension-participation-and-savings-trends-of-eligible-employees-2009-to-2024.
Department for Work and Pensions, 2025b. Analysis of automatic enrolment saving levels. Official statistics, https://www.gov.uk/government/statistics/analysis-of-automatic-enrolment-saving-levels/analysis-of-automatic-enrolment-saving-levels.
Department for Work and Pensions, 2026. Pensions 2050: evidence and future priorities – interim report. Independent report, https://www.gov.uk/government/publications/pensions-2050-evidence-and-future-priorities-interim-report.
Gruber, J., 2008. Mandated employer provision of employee benefits. In S.N. Durlauf and L.E. Blume (eds), The New Palgrave Dictionary of Economics, Palgrave Macmillan, https://doi.org/10.1057/978-1-349-95121-5_2814-1.
Lazear, E.P., and Shaw, K.L., 2007. Personnel economics: the economist's view of human resources. Journal of Economic Perspectives, 21(4), 91–114, https://doi.org/10.1257/jep.21.4.91.
Manning, A. 2001. Monopsony and the efficiency of labour market interventions. Centre for Economic Performance, Discussion Paper 514, https://cep.lse.ac.uk/pubs/download/DP0514.pdf.
O'Brien, L., Cribb, J. and Sturrock, D., 2024. Adequacy of future retirement incomes: new evidence for private sector employees. IFS report, https://ifs.org.uk/publications/adequacy-future-retirement-incomes-new-evidence-private-sector-employees.
O’Brien, L. and Oulton, M., 2026. Assessing the government’s reform to the National Insurance treatment of salary sacrifice pension contributions. IFS report, https://ifs.org.uk/publications/assessing-governments-reform-national-insurance-treatment-salary-sacrifice-pension.
Pensions Policy Institute, 2026. From payslip to pension: life course impacts on retirement saving among low earners. Part four: modelling of policy options for low earners. Pensions Policy Institute, https://www.pensionspolicyinstitute.org.uk/media/m0yn4eet/20260520-part-4-payslip-to-pension.pdf.
Pensions UK, 2026. Closing the gaps: can flexible contributions make retirement savings more affordable? Pensions UK, https://www.pensionsuk.org.uk/Policy-and-Research/Document-library/Closing-the-gaps-Can-flexible-contributions-make-retirement-savings-more-affordable.
Rosen, S., 1986. The theory of equalizing differences. In O. Ashenfelter and R. Layard (eds), Handbook of Labor Economics, Vol. 1, North-Holland, 641–92, https://doi.org/10.1016/S1573-4463(86)01015-5.
Standard Life, 2023. Auto-enrolment: how and when should default contribution rates rise to 12%? https://www.standardlife.co.uk/about/thinking-forward/articles/article-page/auto-enrolment-how-andwhen-should-default-contribution-rates-rise-to-twelve-percent.
Data
Office for National Statistics. (2025). Annual Survey of Hours and Earnings, 1997-2025: Secure Access. [data collection]. 27th Edition. UK Data Service. SN: 6689, DOI: http://doi.org/10.5255/UKDA-SN-6689-27.
Acknowledgements
Funding for this research was provided by the IFS Retirement Saving Consortium 2026-2028: Age UK; Association of British Insurers; Association of Consulting Actuaries; Aviva; Centre for Ageing Better; Department for Work and Pensions; Financial Conduct Authority; Hymans Robertson; Institute and Faculty of Actuaries; The Investment Association; Lane, Clark and Peacock; Money and Pensions Service; Nest; Nucleus; The Pensions Regulator; Pensions UK; People’s Partnership; Scottish Widows; Standard Life; and Vanguard.
We also gratefully acknowledge the support of the ESRC Centre for the Microeconomic Analysis of Public Policy (ES/Z504634/1).
Endnotes
Authors

Jonathan Cribb
Jonathan joined IFS in 2011. His research areas includes: pensions, ageing and demographic change, public sector pay, housing, and inequalities.

Heidi Karjalainen
Heidi is a Senior Research Economist in the Retirement, Saving & Ageing sector. Her current research is on pensions and saving for retirement.

Laurence O'Brien
Laurence is in the Retirement, Savings and Ageing sector. His work focuses on people’s savings decisions and on economic activity in later life.
More from IFS
Understand this issue


Policy analysis


Academic research


