
Downloads
Key findings
1. In 2019, around 40% of 20- to 59-year-olds had less than £2,000 in financial wealth (combined with their partner if they had one). Those who are younger, have lower income, and rent rather than own their homes are more likely to have low savings – but having low savings remains common in the middle of the income distribution. 43% of working-age people in the middle of the income distribution have less than £2,000 saved.
2. Between 2012 and 2019, though, the proportion of people with low financial wealth (less than £2,000) was falling – from 47% of the working-age population in 2012 to 40% in 2019. This fall was concentrated among relatively less financially resilient groups – people who were younger and people who rented, rather than owned, their homes. These more vulnerable groups have been increasingly likely to have a financial safety net.
3. Notwithstanding this fall, having low savings tends to be a persistent, rather than temporary, condition. 70% of those with low financial wealth in 2018–20 had had low savings for the last four years. This is especially concentrated in the most vulnerable groups. The lowest-income, least financially literate, and least-educated groups, holding other factors constant, are more likely to have persistently rather than temporarily low savings levels. In contrast, higher-income adults, those with degrees, and those with higher levels of financial literacy are more likely subsequently to move out of having low financial wealth. This suggests that increasing levels of financial literacy in the population could help people build up savings levels.
4. Nearly a fifth of those with financial wealth worth less than a month’s income report that they would be unable to meet an expense of a month’s income, even considering other forms of ‘insurance’. They say they would be unable to borrow money, or to ask friends or family for help. Even in the middle 60% of the income distribution, 11% of those with low financial wealth would be unable to meet an expense of a month’s income. This represents around 1 million middle-income adults.
5. A key reason to hold financial wealth is to protect one’s standard of living during an economic shock. We looked at the experience of the start of the COVID-19 pandemic as a large, adverse economic shock that affected millions and saw to what extent a stock of financial wealth protected people from hardship.
6. Having low levels of financial wealth notably increased people’s risk of falling into financial difficulties in the early months of the pandemic. Among those who became unemployed, were furloughed, or were self-employed and lost all work, those with no financial wealth were 6.3 percentage points more likely to fall into arrears on their household bills in April 2020, and 6.7 percentage points more likely to in May 2020, compared with those with at least a month’s income’s worth of savings.
7. Amongst those with low levels of financial wealth (some, but less than one month’s income’s worth), there was no increased risk of falling into arrears by April 2020, but a 3.1 percentage point increase in the probability of falling into arrears by May 2020, compared with those with more in savings. This suggests that those with only low levels of savings may have used them up rapidly at the beginning of the economic shock to cover their expenses.
8. Low financial wealth led to a particularly high risk of falling into arrears on bills for those who were self-employed but lost all work. Amongst this group, those with no savings were 15.5 percentage points more likely to fall into arrears in April. Savings made less of a difference for those who were furloughed, perhaps because this group received generous support early on through the furlough scheme.
9. We find that those with lower levels of financial wealth were also more likely to make use of alternative insurance mechanisms to deal with the economic shock of the pandemic. Those with no savings at all were more likely to reduce spending or access informal credit, from family or friends. Those who had positive, but low, levels of savings were more likely to access credit from a bank or credit card.
1. Introduction
There is a widespread argument that having an ‘emergency fund’ of savings or financial wealth is financially prudent in order to help families cope with either short-term falls in income or unexpected spending needs such as the failure of a boiler or other durable good. Despite this, levels of financial wealth in the UK remain low for many households. Recent analysis from the Money and Pensions Service found that a quarter of UK adults have less than £100 in savings, for example.
These low levels of financial wealth are, and have been for a number of years, an object of policy concern. Former Prime Minister David Cameron announced the introduction of ‘Help to Save’ – a policy designed to help low-income benefit recipients build up a stock of savings – in 2016 following concerns about low levels of savings, and the policy was extended at the 2023 Spring Budget. In addition, NEST has been trialling ‘sidecar savings’ as a way of boosting savings in addition to saving for retirement in a workplace pension.
Low savings levels have been brought into particularly sharp relief by the COVID-19 pandemic. During this period, many people experienced unexpected falls in income, after losing work or being furloughed. Where government assistance was available, in some cases it initially came with a delay, and usually did not top incomes up to their full previous level. And in some cases households fell between the cracks of the schemes that, for obvious reasons, had been hastily designed and implemented (see Cribb, Delestre and Johnson (2021)). Private savings were therefore an important way in which households could adjust to the financial shock they experienced. Rapid increases in the cost of living in 2022 and 2023, fuelled by rising energy and food prices, have also threatened households’ financial resilience, again potentially making savings more important.
Understanding the patterns of low savings in the UK, and the importance of having savings as a buffer to adjust to adverse financial shocks for different types of households, is therefore crucial. It helps policymakers know who is at most risk of being forced to cut back on essential spending, of going into arrears on important household bills, or of taking out high-interest credit through pay-day loans or credit cards, in response to a financial shock. Financial wealth that we focus on in this report is that which is easily accessible (or ‘liquid’) and therefore excludes wealth held in private pensions, and in accounts that are difficult to access until particular ages or life events such as Lifetime ISAs.
Of course, building up a small buffer stock of financial wealth is not the only financial goal many families will have (over and above financing their current spending). They will need to consider the importance of paying off credit card or other unsecured loans which – as well as reducing the costs of servicing these debts – could also improve their access to credit in future should they need it. They will also need to consider saving for retirement as most people will need additional income over and above the state pension to provide a reasonable replacement rate compared to their incomes in working life. Indeed, Kaplan, Violante and Weidner (2014) argue that a significant number of higher-income people in the US have low liquid financial wealth but are ‘wealthy hand-to-mouth’ – they keep much of their financial wealth in pensions, property, or more illiquid equities to maximise the return on their assets. Faced with a shock to income or spending needs, they can perhaps easily cut back on other spending. However, this is unlikely to be the case for most people, particularly in the UK where household incomes are on average lower than in the US.
As well as cutting back on spending, there are other alternatives to savings which households might make use of to adjust to financial shocks. Most notably, the benefit system provides a significant degree of insurance against job or earnings loss, although to a much greater extent for lower earners than for those further up the earnings distribution (see Cribb, Hood and Joyce (2017)). Some households are able to borrow money from friends or family in response to a financial shock, and some are able to take out formal credit, though these methods of adjustment have their disadvantages. Understanding the relative importance of these alternative insurance mechanisms for different households is another way in which policymakers can understand whether certain households should be saving more in liquid forms.
In this report, we dig deeper into the characteristics of those who have low levels of financial wealth and the consequences for their living standards. In Chapter 2, we examine the factors associated with having low levels of financial wealth. We look at which groups are most likely to have low financial wealth and at how persistent having low savings tends to be, and we examine groups for whom low savings levels may be of particular concern to policymakers. In Chapter 3, we draw on data from the COVID-19 pandemic to illustrate the extent to which having (at least) a small amount of financial wealth can help in protecting people against financial difficulties during adverse spells. Chapter 4 concludes.
2. Who has low levels of financial wealth?
We begin by examining which characteristics are associated with having low levels of financial wealth, and how this has changed over time. We examine the prevalence of low financial wealth by age, income, housing tenure and financial literacy in particular, to build a sense of which groups policymakers might be particularly concerned about, and which policy levers might be effective in building financial resilience.
We then look at the persistence of low financial wealth for the same people over time, and how this differs by characteristics. Finally, we discuss groups of particular concern: these are groups for whom the social security system provides less insurance, and those who say they would be unable to meet an unexpected expense.
2.1 Data
This chapter uses data from the Wealth and Assets Survey (WAS), a longitudinal survey run by the Office for National Statistics. Each round of data covers two years, with the most recent round covering 2018–20. The survey contains detailed information on respondents’ demographic characteristics and financial situation. We restrict our sample to working-age people aged between 20 and 59.
Our variable of interest throughout this chapter is gross financial wealth. In particular, we are interested in savings held in relatively accessible or ‘liquid’ forms, which can be accessed rapidly. We therefore include the value of current accounts, savings accounts, Individual Savings Accounts (ISAs) (excluding long-term ISAs, LISAs), National Savings products, stocks and shares, bonds, unit and investment trusts, and informal financial assets. As well as LISAs, we exclude the value of insurance products, child trust funds and other assets. The measure is ‘gross’ in the sense that we consider financial wealth before deducting any financial debts such as credit card debt or bank loans. We measure wealth at the ‘family’ level, which groups together an individual with a cohabiting partner, if they have one. We do not ‘equivalise’, or adjust, this level for the number of adults or children in the family.
Throughout our analysis, we consider two separate measures of having low financial wealth; each is, of course, somewhat arbitrary, but each tells us something slightly different about financial resilience. The first measure is having less than £2,000 in financial wealth (in 2020 prices). This reflects respondents’ ability to meet unexpected spending needs such as a boiler repair, broken washing machine or other durable expense, for which the costs will be relatively stable across the income distribution.
The second measure is having less than a month’s family disposable income saved. This reflects respondents’ ability to cope with adverse shocks such as unemployment. For an event like this, the need for financial wealth will be more likely tied to the level of disposable income that a family is used to having. Those with higher incomes are likely to have higher pre-committed expenditure, such as mortgage, rent and hire-purchase payments, and so they may need more (in cash terms) to withstand a shock to their incomes than people with lower pre-committed expenditures.
3.1 Characteristics of families with low financial wealth
Low levels of financial wealth are common: 39% of those between 20 and 59 had less than £2,000 in wealth saved in the 2018–20 wave of WAS, and 41% had less than a month’s family income saved.
Figure 2.1 shows the percentage of people with low levels of wealth between 2018 and 2020, split by various characteristics. Both measures of low financial wealth are illustrated. Younger adults are more likely to have low financial wealth: the age gradient is especially marked when considering the fixed threshold of £2,000, with two in three 20- to 24-year-olds having under £2,000 in financial wealth compared with one in four 55- to 59-year-olds.
Figure 2.1. Percentage of population aged 20–59 with low financial wealth by age, income, financial literacy and housing tenure
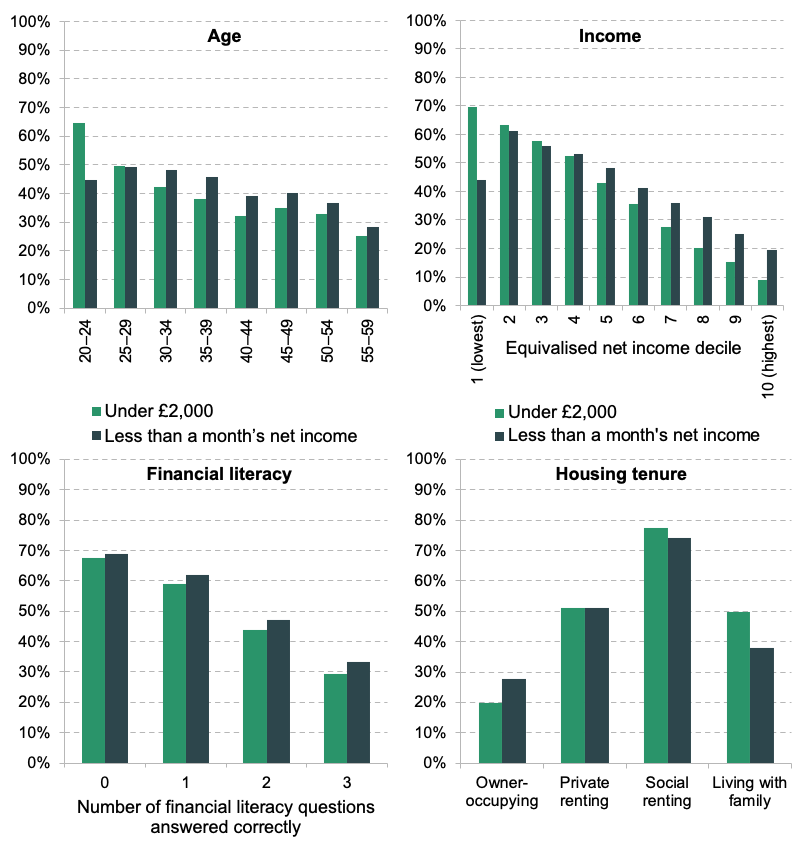
Note: Financial wealth and income are measured on a benefit unit (family) level. Income is measured net of direct taxes and state benefits and is equivalised according to family size using the OECD modified equivalence scale. The financial literacy chart excludes proxy interviews, since only direct respondents are asked the set of financial literacy questions.
Source: Authors’ calculations using the Wealth and Assets Survey, Round 7.
There is a sharp gradient in low financial wealth by income decile, which – as we would expect – is steeper for the measure of having under £2,000 in savings than for the measure of having less than one month’s income saved. 70% of those in the lowest income decile have less than £2,000 saved, compared with 9% of those in the highest income decile. While this difference may not be especially surprising, the significant numbers of middle-income people with low wealth are notable, with 43% of those in the fifth income decile reporting less than £2,000 in savings and 48% less than a month’s net income.1 This is perhaps particularly concerning, since middle-income people will typically receive a lower replacement rate from the social security system when they lose their job compared with lower earners (see Cribb, Hood and Joyce (2017)).
The percentage of people who have low financial wealth by level of financial literacy is also shown in Figure 2.1. This financial literacy index is constructed using the number of questions (out of three) answered correctly by respondents; the questions measure understanding of inflation, interest rates and bank statements. The specific questions asked can be found in full in Appendix A. People who answer all three questions correctly are much less likely to have low financial wealth than those who are unable to do so: 29% of those who answer all three questions correctly have less than £2,000 saved, compared with 67% of those who answer none correctly.
Finally, Figure 2.1 shows that homeowners are much less likely to have low financial wealth than those who rent their homes. Around three-quarters of social renters have less than £2,000 saved, compared with around a fifth of those in owner-occupied housing. Private renters are in the middle, with around half of private renters having less than £2,000 saved.
These correlations are also apparent in the US (see Bhutta, Blair and Dettling (2021)), with higher-income and older households more likely to have sufficient liquid savings to cover three months of expenses, as well as those with higher levels of education.
The disadvantage of the analysis in Figure 2.1 is that many of these characteristics are correlated with one another: the connection between lower financial literacy and low savings shown above, for example, could be entirely a result of the fact that income is correlated with both. In order to understand these relationships better, we use regression analysis, regressing the probability of having low financial wealth on a range of the characteristics we might expect to be associated with low financial wealth. These are age, sex, family type, housing tenure status, equivalised income decile, different types of debt, region, education level, financial literacy, and terciles (thirds) of the property and pension wealth distributions. We use a probit model, which takes account of the dichotomous nature of the outcome (whether or not a family has savings of at least a certain level), to estimate these associations.
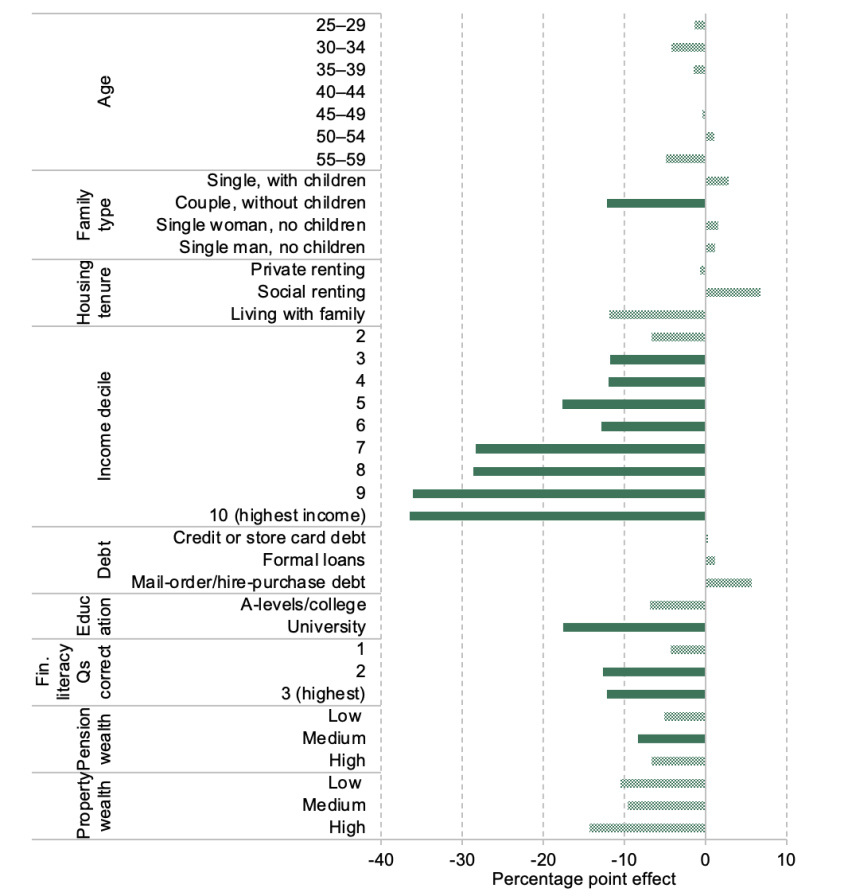
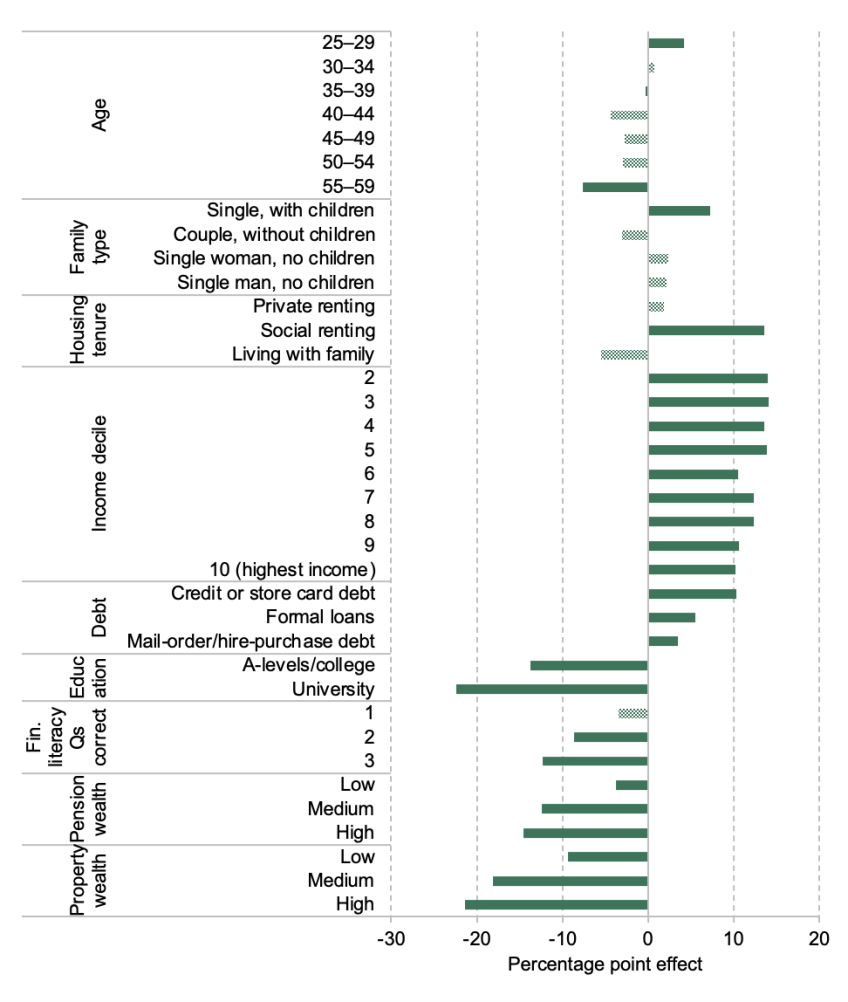
Figure 2.2 shows results from this exercise, where having less than £2,000 in financial wealth is the outcome variable. (The equivalent regression for having less than a month’s net income is shown in Figure B.1 in Appendix B.) The bars represent average marginal effects and can be interpreted as the percentage point change in the likelihood of having less than £2,000, holding all other factors constant. As shown, many characteristics are significantly associated with the likelihood of having under £2,000 in financial wealth at the conventional (5%) level of statistical significance.
- Age: Compared with the baseline group of those aged 20–24, those in all older age brackets are significantly less likely to have under £2,000 saved. The difference is most marked between 20- to 24-year-olds and all other age groups. 30- to 34-year-olds are 15 percentage points less likely to have low financial wealth than 20- to 24-year-olds, while 55- to 59-year-olds are 26 percentage points less likely.
- Family type: Compared with those in a couple with children, those who are single with children (i.e. lone parents, the vast majority of whom are women) are 14 percentage points more likely to have less than £2,000 saved. Single men and women without children are 5–6 percentage points more likely to have less than £2,000 saved. Couples without children, in contrast, are 6 percentage points less likely to have less than £2,000 saved compared with couples with children.
- Housing tenure: Compared with homeowners, private renters are not significantly more likely to have less than £2,000 saved, all else equal. Social renters are, however, 9 percentage points more likely to have less than this threshold. Those adults who are living with their parents (or others who are living with other adults other than a partner) are 10 percentage points less likely than homeowners to have low financial wealth, controlling for other factors, perhaps reflecting their greater ability to put money aside given low or no housing costs – or indeed the fact that they might be saving in order to build a deposit to enable them to move into private rented accommodation or to purchase a home.
- Income decile: Compared with those in the bottom income decile, those with incomes in the third decile and above are all less likely to have less than £2,000 saved. Those in the top income decile are 33 percentage points less likely to have less than £2,000 saved than those in the bottom income decile.
- Debt holdings: Holding one of the three types of (non-mortgage) debt that we consider – credit or store card debt, formal loans, and hire-purchase or mail-order debt – is associated with being more likely to have low gross financial wealth. This is likely to be financially sensible where this debt is high-interest: people are generally expected to be financially worse off if they build up low-interest financial wealth savings such as ISAs or savings accounts while accruing high interest rates on unsecured debt.
- Education: Having attended university is associated with a likelihood of having low financial wealth around 18 percentage points lower, compared with having left school at 16 or earlier.
- Financial literacy: Answering all three questions measuring financial literacy correctly is associated with being 8 percentage points less likely to have less than £2,000 saved than those who answer no questions correctly. The fact that this remains significant, even when controlling for age, education and income, is interesting and suggests that potential policies to increase financial literacy might increase the fraction of people with a buffer stock of financial wealth.
- Other wealth holdings: As might be expected, having some level of pension or property wealth, compared with having none, means you are less likely to have less than £2,000 saved. The strongest association is with property wealth: being in the top third of positive property wealth, compared with having no property wealth, is associated with being 25 percentage points less likely to have less than £2,000 saved.
Figure 2.2. Characteristics associated with having less than £2,000 in financial wealth among the population aged 20–59
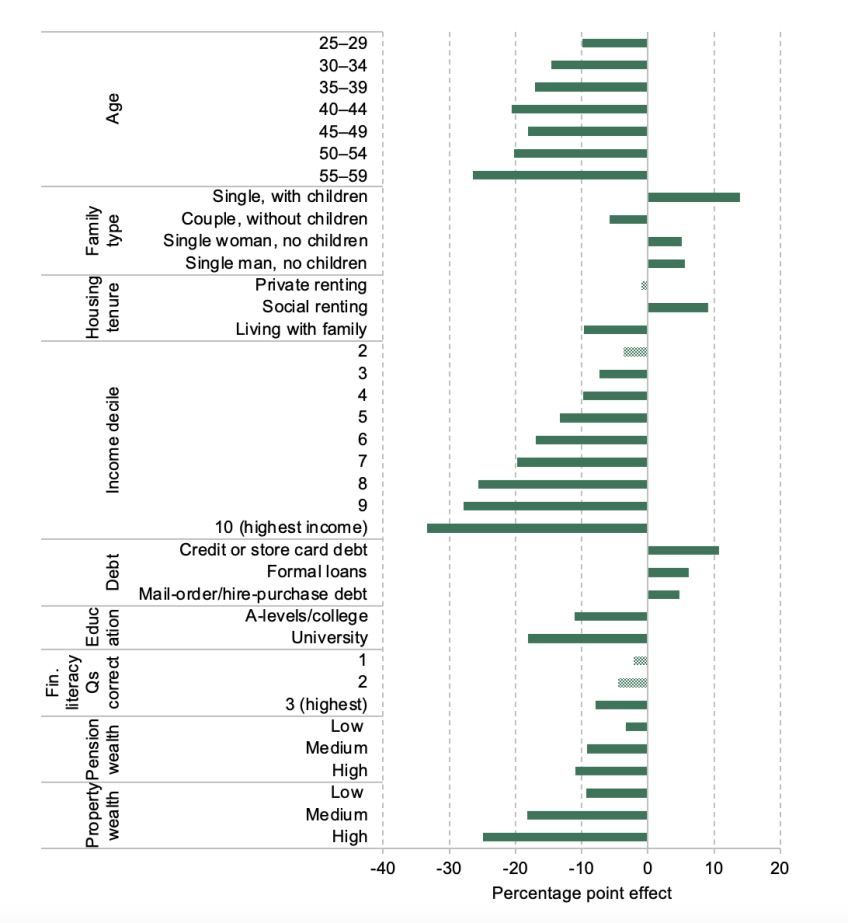
Note: Bars represent average marginal effects from a probit regression, where the outcome variable is having less than £2,000 in financial wealth. Explanatory variables are age, sex, family type, housing tenure status, equivalised income decile, holding debt, region, education level, financial literacy, and terciles of property and pension wealth, not all of which are illustrated here. ‘Low’, ‘medium’ and ‘high’ levels of pension and property wealth are defined as being in the lowest/middle/top third of the distribution conditional on having positive pension/property wealth. Standard errors are clustered at the household level. Solid bars indicate that the effects are statistically significantly different from zero at the 5% significance level and shaded bars indicate that they are not.
Source: Authors’ calculations using the Wealth and Assets Survey, Round 7.
2.3 Changes in the prevalence of low financial wealth over time
Between 2012 and 2019, the proportion of people with low financial wealth fell, as is shown in Figure 2.3. The share with financial wealth below £2,000 rose somewhat between 2010 and 2012, from 44% in 2010 to 47% in 2012, before falling steadily to 40% of the population aged 20–59 in 2019.
Figure 2.3. Percentage of population aged 20–59 with low levels of financial wealth, over time
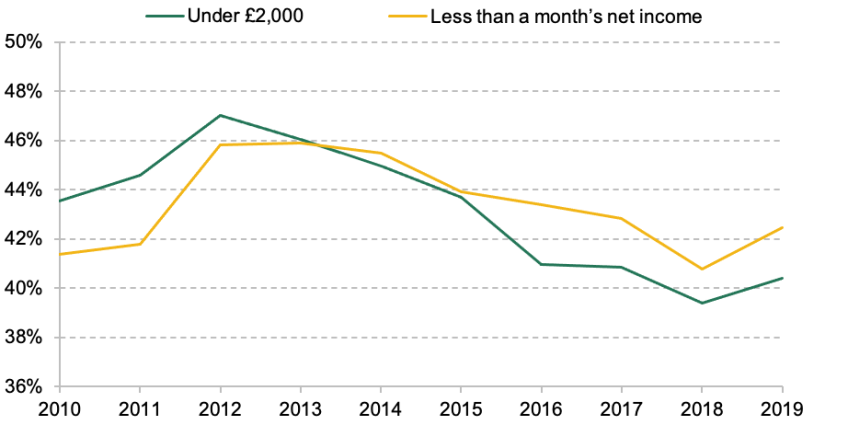
Note: Financial wealth and income are measured on a benefit unit (family) level. Income is measured net of direct taxes and state benefits and is equivalised according to family size using the OECD modified equivalence scale. Waves 1 and 2 are excluded because we cannot construct a measure for having less than a month’s equivalised family income in these waves.
Source: Wealth and Assets Survey, Waves 3–5 and Rounds 6 and 7.
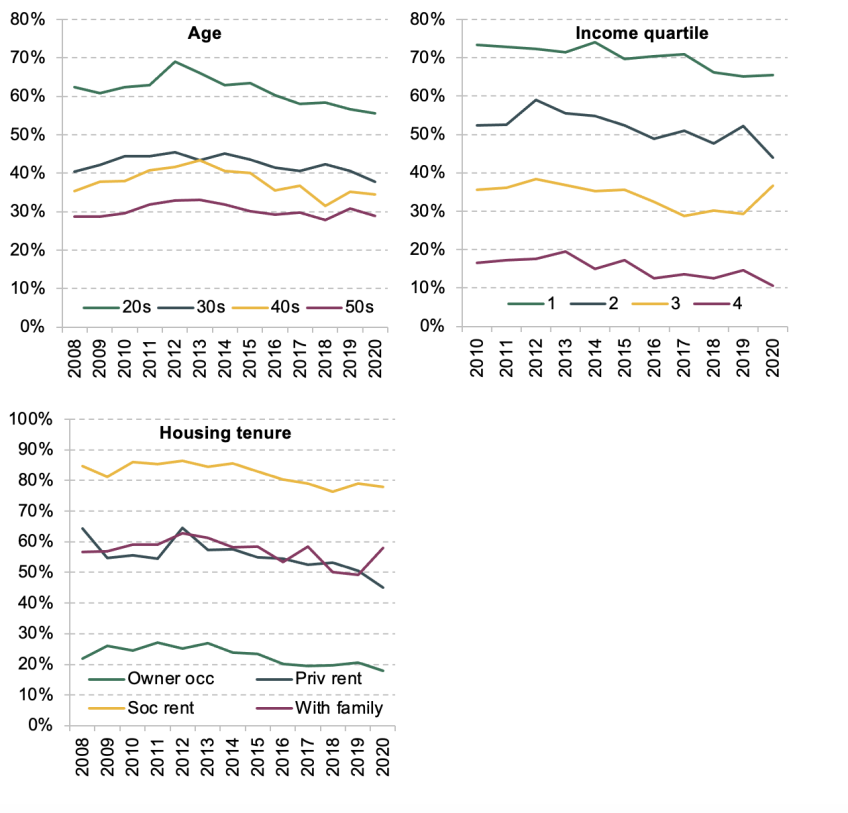
This fall between 2012 and 2019 was concentrated amongst certain groups, meaning that the composition of people with low financial wealth has also changed during this period. Figure B.2 in Appendix B illustrates how the proportion of people with low financial wealth by age group, housing tenure and income quartile has changed over time.
The percentage of people with less than £2,000 saved in financial wealth in their 20s initially rose from 62% in 2008 to 69% in 2012 before falling to 57% in 2019. This 12 percentage point fall was much larger than the falls at older ages: the falls between 2012 and 2019 were 5 percentage points for those in their 30s, 6 percentage points for those in their 40s and only 2 percentage points for those in their 50s. The prevalence of low savings has thus decreased most amongst the age group that was particularly likely to have low levels of financial wealth.
Similarly, the fall in the share with low financial wealth was much more pronounced for private and social renters – who, as shown above, are more likely to have low financial wealth – than for owner-occupiers between 2012 and 2019. And the fall in the proportion with low financial wealth is least apparent amongst those in the highest-income quarter of the population.
Overall, savings rose most over the 2010s among relatively more deprived groups: young people, renters and lower-income groups. This may have had important consequences for their standards of living; Cribb et al. (2022) argue that the rising levels of financial wealth among low-income groups could be one reason that they find lower levels of material deprivation amongst families with children over the 2010s, despite relatively poor household income growth for low-income families.
The data used so far in this report, the Wealth and Assets Survey, only extend to March 2020 at the time of writing. However, the evolution of financial wealth levels during the COVID-19 pandemic, as well as during the subsequent ‘cost of living crisis’ in 2022–23, is clearly of interest.
While many of those in paid work on the eve of the pandemic subsequently experienced income losses, essentially everyone had limited spending possibilities. Many did not commute to work, and whole sectors of the consumer economy were shut down – for example, in-person ‘inessential’ retail, hospitality, leisure activities and recreation. This generated ‘forced saving’, as documented by Davenport et al. (2020). They find that higher-income people saw larger percentage declines in total spending than lower-income people, because higher-income people spend relatively less on ‘essentials’ such as food and energy (spending on which held up better during the pandemic, as expected) as a share of their total spending. This pattern would imply greater increases in savings for higher-income households than for lower-income households.
Crossley et al. (2021) corroborate this, finding that unprecedented increases in household savings took place during the pandemic, and that the resulting increase in net wealth was higher for higher-income households. Figure 2.4 shows evidence from the Understanding Society COVID-19 study: the yellow line, which represents the percentage of respondents in each long-run income decile who reported having experienced a rise in net wealth of more than 10%, is higher than the green line, the percentage who reported having seen a fall of more than 10%, in all except the bottom two income deciles. This graph captures all wealth, rather than just financial wealth, and the evidence is less high-quality than that using WAS, since the COVID-19 study only asks whether wealth has risen or fallen, rather than the exact values of wealth at each contemporaneous point in time.
Figure 2.4. Reported change in total net wealth (January/February 2020 to March 2021), by long-run income decile
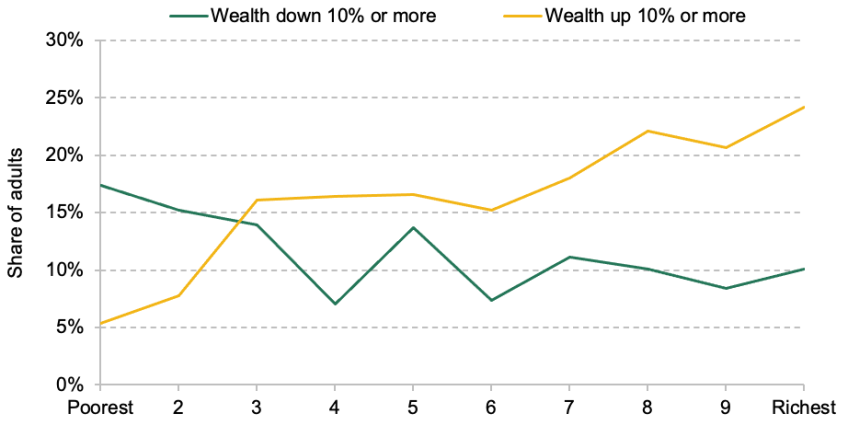
Note: Respondents were asked whether their household total net wealth had gone up or down by 10% or more, or stayed about the same, since January/February 2020. Income deciles are assigned on the basis of net household income averaged across up to three previous waves of the main Understanding Society survey.
Source: Crossley et al. (2021), using Understanding Society COVID-19 study.
Survey evidence from the Bank of England (2021) captures the evolution of financial wealth in particular. It finds that while 42% of high-income households reported saving more during the pandemic, this compared with only 23% of low-income households. Similarly, only 16% of high-income households reported saving less, compared with 24% of low-income households.
The weight of this evidence suggests that the next round of WAS will show further declines in the rate of low savings in 2020 and the beginning of 2021. The pattern seen up to now, however, where this decline has been concentrated among those in lower-income groups, is likely to be, at least partly, reversed.
Despite the rises in savings levels during the pandemic, the ensuing period of high inflation (the ‘cost of living crisis’), with substantially rising energy, food and other household bills, has eroded at least some of the savings accumulated during the pandemic. The Financial Conduct Authority (2022), in its May 2022 survey, found that the increased burden of domestic bills and credit commitments was somewhat offset by higher savings accumulated in the pandemic. However, it also found that there has been a significant increase in the proportion of UK adults in financial difficulty between February 2020 and May 2022, implying that the latest high-quality data on wealth may show more people with very low levels of financial wealth than data that finish in early 2020.
In an Autumn 2022 survey of households, the Bank of England (2022) corroborated these findings. It found that households who reported having spent more as a result of the increase in the cost of living during 2022 were likely to have funded this through saving less (more than half of households with increased spending) and through drawing down on savings (almost a quarter of such households).
2.4 Persistence of low financial wealth
Our results so far have used only cross-sectional data – we have not followed people over time to examine how their financial situation changes. The question of whether having low financial wealth tends to be a persistent condition, or is more likely to be a transitory or temporary condition – for example, if a large expense has just been paid – is an important one. People who have low levels of financial wealth for only a short time may have responded to a recent shock, for example. Or they may only have recently entered the labour market and not yet accumulated much financial wealth. More generally, it is likely to be more concerning if people have low financial wealth for a longer period.
The Wealth and Assets Survey allows us to track the same people over time, meaning that we can follow a group of people present in the data from 2014–16 to 2018–20 (three distinct waves of data) and examine the number of waves in which they have low financial wealth. We can also test whether the relationships we uncovered in the previous section hold when only considering persistently low financial wealth.
Figure 2.5 shows the number of waves (out of three) in which those who had low financial wealth in 2018–20 had low financial wealth. As shown, 70% of those with under £2,000 in 2018–20 had under £2,000 in the previous two waves as well (2014–16 and 2016–18). Less than 10% had low financial wealth (less than £2,000) in 2018–20 alone. Having less than a month’s net income saved was a slightly less persistent condition, but still 64% of those who had less than a month’s net income saved in 2018–20 had also had less than a month’s income saved in the two prior waves, and for only 11% was it the only wave.
Figure 2.5. Total number of waves (out of three: 2014–16, 2016–18 and 2018–20) in which those reporting low financial wealth in 2018–20 had low financial wealth
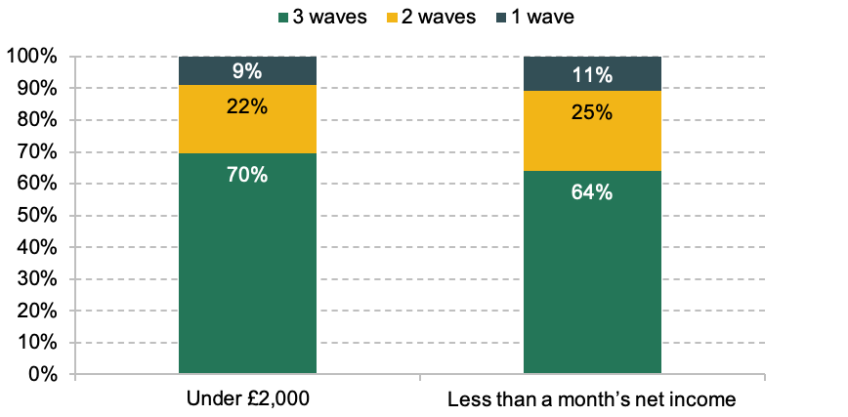
Source: Authors’ calculations using the Wealth and Assets Survey, Wave 5 and Rounds 6 and 7. The last three months of Wave 4 are also included, to account for the fact that the period covered by each dataset shifted when WAS changed from wave-based datasets to round-based datasets.
The same qualitative relationships examined in Section 2.2 – with age, disposable family income, financial literacy and housing tenure – are apparent when considering persistently low financial wealth, although those who have persistently low financial wealth are on average a more deprived group.
We can use regression analysis, as in the earlier section, to get a sense of which factors are associated with having persistently low financial wealth. We use a similar model to that used above, taking covariates measured in the first period (2014–16) except for financial literacy, as that is only measured in the final wave of data (2018–20).
Specifically, we can look just at people with low financial wealth in the first wave of data, and see what predicts whether those people will go on to have persistently low financial wealth. This helps to identify groups of particular concern when observed with low savings at a single point in time, for whom interventions may be more necessary. The results of running this regression are reported in Figure 2.6. Note that the sample size is significantly lower than in Figure 2.2, due to attrition in WAS (since we are looking at those present in all three waves) and the fact that we are restricted to only those with low financial wealth in the first wave.2
- Age: Age is no longer significant when explaining whether people go on to have persistently, as opposed to temporarily, less than £2,000 saved. This is perhaps surprising, since we might expect it to be more likely that younger people would go on to build up higher financial wealth after a single period of low savings.
- Family type: Those in a couple without children are 12 percentage points less likely to go on to have persistently low financial wealth, compared with those in a couple with children. There are no other statistically significant differences. This suggests that couples without children find it easier to accumulate wealth subsequently than other groups.
- Housing tenure: Housing tenure is not significant in distinguishing persistent from temporary financial wealth, although the effects are large and imply that those living with family in the first wave – compared with homeowners – might be less likely to go on to have persistently low financial wealth.
- Income decile: Income decile is strongly and significantly associated with the likelihood of going on to have persistently, rather than temporarily, low financial wealth: those with low financial wealth in the top income decile are 37 percentage points less likely to go on to have persistently low financial wealth than those in the bottom income decile. The results suggest that those with low financial wealth at higher points in the income distribution are more likely to be in this state temporarily, perhaps because they experienced an adverse shock. In contrast, those with low wealth and low incomes are less likely to be able to accumulate wealth.
- Debt holdings: Holding one of the three types of debt we consider is not associated with being more or less likely to have persistently, rather than temporarily, low financial wealth.
- Educational attainment: Having attended university, compared with having left school at 16 or earlier, is associated with a likelihood of going on to have persistently low financial wealth 18 percentage points lower. This is both statistically significant and qualitatively large. One explanation is that graduates often experience stronger earnings growth, thereby leaving them more able to accumulate wealth subsequently.
- Financial literacy: Greater financial literacy is associated with being less likely to have persistently low financial wealth among those with low financial wealth, controlling for other factors. The effects are large: answering two or three questions on financial literacy correctly, compared with answering none correctly, is associated with being around 12–13 percentage points less likely to go on to have persistently low financial wealth.
- Other wealth holdings: Having positive pension or property wealth is mostly not significantly associated with being less likely to have persistent, rather than temporary, low financial wealth, although the estimated effects are negative and large. The absence of statistical significance may result from the fact that we are only looking at those who have low financial wealth in the first wave, fewer of whom have positive pension or property wealth in the first place, rather than resulting from an absence of any relationship.
Figure 2.6. Characteristics associated with having persistently, rather than temporarily, less than £2,000 in financial wealth among the population aged 20–59
Note: Bars represent average marginal effects from a probit regression, where the outcome variable is having less than £2,000 in financial wealth for three out of three waves in which respondents were present, and the population is those with low financial wealth in the first wave. Explanatory variables are age, sex, family type, housing tenure status, equivalised income decile, holding debt, region, education level, financial literacy, and terciles of property and pension wealth, not all of which are illustrated here. ‘Low’, ‘medium’ and ‘high’ levels of pension and property wealth are defined as being in the lowest/middle/top third of the distribution conditional on having positive pension/property wealth. Standard errors are clustered at the household level. Solid bars indicate that the effects are statistically significantly different from zero at the 5% significance level and shaded bars indicate that they are not.
Source: Authors’ calculations using the Wealth and Assets Survey, Wave 5 and Rounds 6 and 7. The last three months of Wave 4 are also included, to account for the fact that the period covered by each dataset shifted when WAS changed from wave-based datasets to round-based datasets.
In summary, those who are particularly deprived among the population of low savers – the lowest-income groups, the least educated and the least financially literate – are most likely to go on to have permanently, rather than temporarily, low savings. The association of low financial literacy with permanently low savings, over and beyond the effects of income and education, again suggests that actions to improve financial literacy might be a way in which policymakers could try to encourage higher savings levels in the population.
2.5 Low financial wealth and not being able to meet an unexpected expense
Liquid financial wealth is, perhaps most importantly for policymakers, a means to insure people against negative shocks. Those who have a robust insurance system – whether from family, friends, other private means or the state – are less of concern. Examining how people would meet an unexpected expense is one way in which we can get at the effect of low financial wealth on financial fragility for different households.
The Wealth and Assets Survey contains questions on how people report that they would meet an unexpected expense of various sizes. The question on which we focus here asks how a respondent would find the money to meet an unexpected major expense, equivalent to their whole income for a month.
Figure 2.7 shows how people report that they would meet an expense of a month’s income, broken down by whether they have less than a month’s income in financial wealth. Notably, 85% of those with a month’s income or more in financial wealth would meet this expense either through their current account or through existing savings; a further 12% would borrow the money or rely on family or friends to help; and only 2% say that they would not be able to find money.
Figure 2.7. Percentage who would meet an expense of a month’s income in different ways, by whether they have less than a month’s income in financial wealth
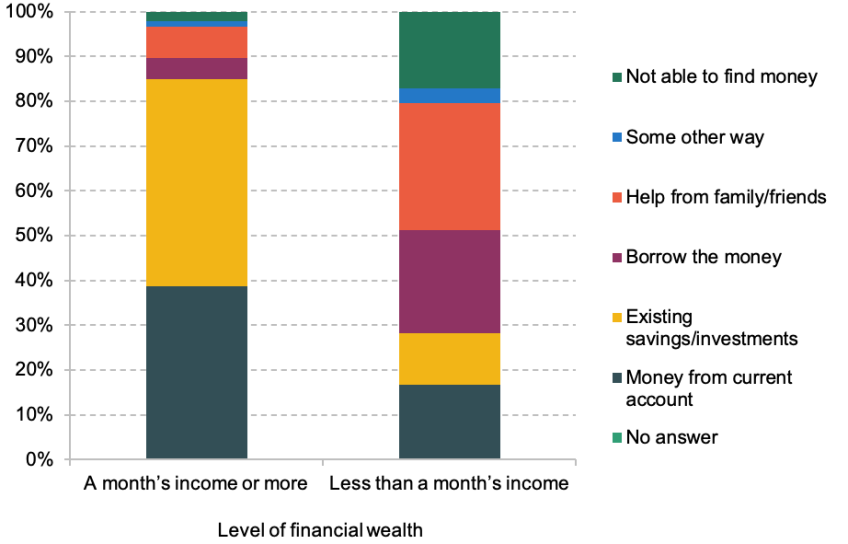
Note: Question asked to those interviewed in person. Respondent’s answer was assigned to others within their benefit unit who did not answer themselves; those to whom answers could not be assigned were excluded. For both groups, less than 0.5% of people gave no answer.
Source: Authors’ calculations using the Wealth and Assets Survey, Round 7.
In contrast, only 28% of those with less than a month’s income saved say that they would meet an expense of a month’s income through their current account or savings. More than 20% would rely on borrowing the money, with potentially worrying consequences for this group’s use of unsecured debt, and 28% say that they would rely on help from family or friends, which raises the question of how confident they could be that this support would be forthcoming. Most concerningly, 17% say that they would not be able to meet this expense at all.
Differences in these methods of meeting an unexpected expense across the income distribution are important. Those on very low incomes are likely to receive higher levels of state insurance if facing an income shock, and so levels of insurance through financial wealth may be less important. Figure 2.8 illustrates how those with less than a month’s income saved say they would meet an unexpected expense by equivalised income decile, showing the proportions who would use each method as a share of the working-age population (top panel) and as a share of those with less than a month’s income saved (bottom panel). As might be expected, those at the bottom of the income distribution with less than a month’s income saved are most likely to report that they would not be able to find money, with more than a third of those with less than a month’s income in the bottom income decile saying this, compared with 0.3% of the top income decile. Substantial fractions of the middle of the income distribution would not be able to find the money to meet an expense of a month’s income, though, at around 12% of the fifth decile. Reliance on family insurance is more common at the bottom of the income distribution, and borrowing the money is more common towards the top.
Figure 2.8. Percentages who would meet an unexpected expense of a month’s income in different ways, broken down by income decile, showing only those with less than a month’s income in financial wealth
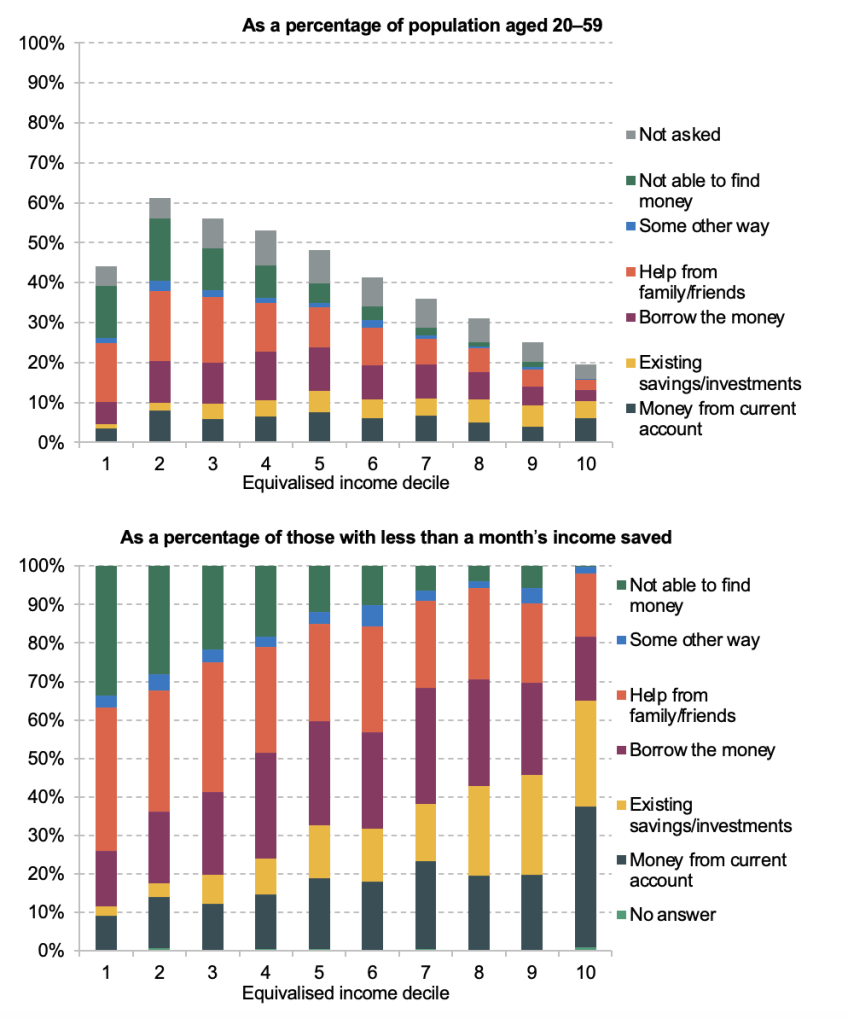
Note: Question asked to those interviewed in person. Respondent’s answer was assigned to others within their benefit unit who did not answer themselves; those to whom answers could not be assigned were assigned ‘Not asked’ in the top panel and excluded in the bottom panel. Income decile is equivalised based on family size and is defined on a family level by age group.
Source: Authors’ calculations using the Wealth and Assets Survey, Round 7.
As discussed, those on the lowest incomes will be protected, to a certain extent, against the impacts of job loss due to the UK’s primarily means-tested working-age benefits system. Those towards the upper end of the income distribution will have more flexibility to cut back on discretionary expenses to cope with the effects of an income shock – indeed, relatively few of those in the top three income deciles report that they would be unable to meet an unexpected expense of a month’s income. Therefore, it is arguably those in the middle of the income distribution, who have low levels of financial wealth, about whom policymakers may want to be particularly concerned.
We find that there are around 8.8 million people in the middle 60% of the disposable income distribution who report having less than a month’s income in financial wealth. Only 2.2 million – a quarter – of this group would be able to meet an unexpected expense of a month’s income through money from their current account or savings. Of the other three-quarters, 1.0 million say that they simply would not be able to find the money for this expense.
Other forms of insurance against an income shock or increase in costs are apparent: a further 1.9 million would rely on borrowing the money, and 2.0 million would need to ask friends or family for help. These groups are clearly financially vulnerable, and will receive minimal state insurance in the event of a job loss or other income shock.
Some of this group will have debt, so it might not necessarily be appropriate for them to accumulate more savings until they have cleared that debt. Of the 1.0 million who would not be able to find the money for an unexpected expense of a month’s income, 53% have one of the three types of debt we consider. And debt levels are higher among those who say they would ask family or friends for help, with 64% of this group having some debt. There are still considerable numbers, though, for whom it would be sensible to direct small amounts of money towards liquid savings over time, in order to slowly build up a safety net of savings which can be used in the event of an unexpected expense or an income shock.
3. Did financial wealth protect households’ living standards during the COVID-19 pandemic?
An important potential role for liquid financial wealth, and a justification for saving in liquid forms rather than more illiquid forms such as a pension, is that this saving can insure families against financial distress following shocks to their standards of living. But this case is not one that should go unexamined. There are other forms of (partial) insurance that help people smooth their standards of living, as described in the previous chapter, even when faced with an economic shock that reduces their income or places additional unexpected demands on their spending. The benefits system, particularly for low-income people with few financial assets, provides an important degree of insurance against income loss, though much less against unemployment than in 2007 (Cribb, Hood and Joyce, 2017). Many people may have access to credit either formally, or informally through gifts or loans from families, as shown in the preceding chapter. And couples may be able to insure one another to some extent: one partner may have the ability to work more in response to income loss from the other.
This chapter seeks to quantify the impact of having low financial wealth on the chances of falling into financial distress, looking at the period during which there were widespread falls in income caused by the COVID-19 pandemic and associated lockdowns, as people lost work and were furloughed. Specifically, we look at whether those with no or low financial wealth were more likely to fall into arrears on their household bills during the first few months of the pandemic.
The impact of having low financial wealth will depend on the specific shock experienced by individuals, on the extent to which individuals had other sources of support that they were able to make use of, and on the extent to which they preferred to make use of these other sources. The pandemic saw not only significant shocks to people’s incomes, but also significant variation in the government support available to people, with those who were furloughed, those who were made unemployed, and those who were self-employed and lost work, receiving different amounts of support at different times. Therefore, this chapter will consider these groups separately, as well as in combination.
3.1 Data
In this chapter, we make use of data from the UK Household Longitudinal Study (UKHLS), also known as ‘Understanding Society’. The UKHLS collects data annually from every individual in a sample of thousands of households, asking questions about their demographic characteristics, incomes and employment status, as well as collecting a range of other details. In addition, from April 2020 to September 2021, adults from the sample were invited nine times to complete an additional COVID-19 questionnaire, to gather extra information on their experiences during the pandemic. In this work, we focus on the first two of these waves, covering April and May 2020.
Our main outcome variable of interest is whether sample members are falling behind on their household bills. This is a better measure of financial distress than looking at falling spending in general, since consumption opportunities more broadly were limited by lockdown and social distancing measures for households, including those not facing increased financial distress. The risk of loss of access to utilities (except water) and the possibility of court action for non-payment of bills suggest that those not paying bills are likely to be facing substantial hardship. In both the COVID-19 and main UKHLS questionnaires, respondents are asked if they are behind on their bills.3 Respondents are invited to say whether they are up to date with their bills, behind on some, or behind on all.4We take the latest pre-COVID measure of arrears on bills for each household, from 2019 (irrespective of whether the 2019 interview occurred in Wave 10 or Wave 11 of UKHLS), and see how the measure changed during the pandemic, depending on the level of savings held.
Questions on financial wealth are not asked regularly by the study, but respondents were asked to detail savings they held in Waves 4 (2012 and 2013) and 8 (2016 and 2017), from sources such as savings accounts and ISAs, listed fully in Appendix A. Based on this, we identify households that have no or low levels (defined throughout the chapter as having less than one month’s worth of net household income) of household savings, using the approach detailed in Appendix A.
The savings information available in UKHLS is incomplete – we do not have information on current account balances. Therefore, we are estimating which households have low or no financial wealth with some degree of error, leading to attenuation in our estimates of the impact of having low or no wealth. Attenuation also comes from the fact that the data on wealth were collected a few years in advance of the shock we are studying, though the findings from the previous chapter that having low financial wealth is a relatively persistent state do give us confidence that this error is not too large. This attenuation means our estimates represent a lower bound of the true effect.
In order to identify those who have been subject to an economic shock during the pandemic, we use the employment status at the time of the interview in the COVID-19 study, and a recall variable (asked in April 2020) which asked about employment status in January or February of 2020. The study also asked employees whether they had been furloughed. We identify three groups who have received an economic shock as a result of COVID-19:
- those who were employed at the beginning of 2020 and furloughed in April;
- those who were self-employed at the beginning of 2020 and in April, but whose hours had dropped to zero in April;
- those who were employed at the beginning of 2020 and had no job in April.
April 2020 was shortly after the start of the first COVID lockdown in the UK. We repeat the analysis, but using data from May 2020 instead of April, to see whether the effects change over time.
As discussed in the preceding chapter, having very low levels of financial wealth is not uncommon. Figure 3.1 shows the distribution of financial wealth for our whole sample, and for those who experienced an economic shock in the pandemic as defined above. Around 27% of respondents do not report holding any amount of financial wealth overall, with this being true of around 29% of those who experienced an economic shock. On the other hand, the top 10% hold upwards of £86,500, or £60,000 amongst those who became unemployed, lost work or were furloughed. These numbers differ from those found in the previous chapter. This is because of the different data source – UKHLS does not ask about as wide a range of wealth sources as WAS – and because the figures here are for household wealth, whereas the previous chapter discusses ‘family’ wealth which, for example, separates out the wealth of adult children who are independent from, but in the same household as, their parents.Figure 3.1. Distribution of household financial wealth
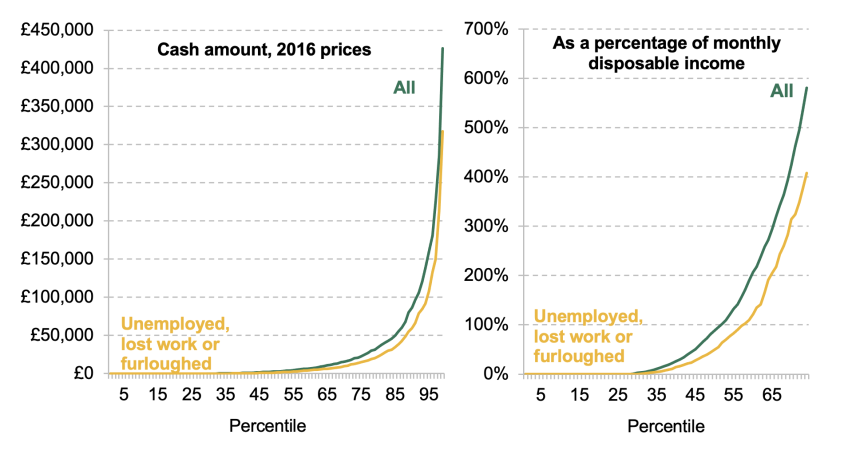
Note: ‘All’ means all observations in April 2020 data with savings information available from Wave 8. ‘Disposable income’ means income from all sources including earnings and benefits, with taxes deducted. Sample is those aged 16–60 at time of sampling in UKHLS Wave 8 (2016–17).
Source: Authors’ calculations using UKHLS, Wave 8, and UKHLS COVID-19 study, Wave 1.
This huge variation in levels of savings suggests significant variation in people’s resilience to shocks, and it is notable that savings levels were lower for those who did experience a job shock during the pandemic. To contextualise these numbers, Figure 3.1 also shows the distribution of wealth as a percentage of monthly net household income. Over half of people report their household wealth is worth less than a month’s income, including 57% of those who subsequently experienced an adverse shock, suggesting their ability to tide themselves over using their savings in the event of a loss of income is limited.
3.2 Prevalence of financial difficulties
We now turn to our measure of financial difficulties – falling into arrears on bills. We use this as it is an objective measure of financial distress, measured both before and during the pandemic. Figure 3.2 plots rates of arrears in bills in 2019 and April 2020 for those who experienced different types of economic hits (became unemployed, furloughed, or self-employed and lost all work) and those who did not. We can see that rates of arrears were similar for those who did not lose work – in fact the rate slightly decreased. On the other hand, those who did stop working for one reason or another, and therefore likely saw a loss of earnings, became over twice as likely to be in arrears on bills.
Figure 3.2. Percentage of people behind on household bills in 2019 and April 2020, split by their economic status in April 2020
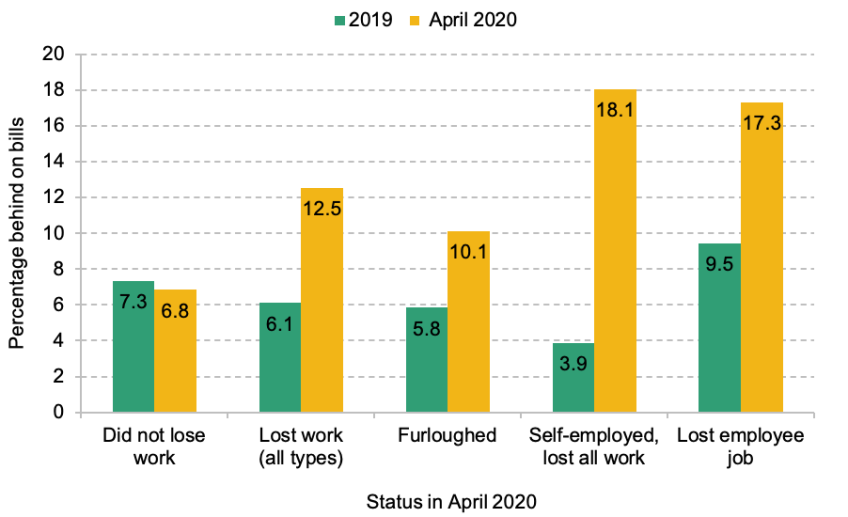
Note: ‘Behind on household bills’ here means the respondent reports being behind on some or all of their bills. Sample is those aged 16–60 at time of sampling in UKHLS Wave 8 (2016–17). 2019 data are drawn from Waves 10 and 11.
Source: Authors’ calculations using UKHLS, Waves 8, 10 and 11, and UKHLS COVID-19 study, Wave 1.
The largest increase in arrears was for the self-employed who lost all work. Partly driving this is the fact that the first payments of the Self-Employed Income Support Scheme (SEISS) did not arrive until late May (see Cribb, Delestre and Johnson (2021)), whereas those who were furloughed were able to receive support much more quickly. Those who lost their jobs and became unemployed also became much more likely to be in arrears on bills.
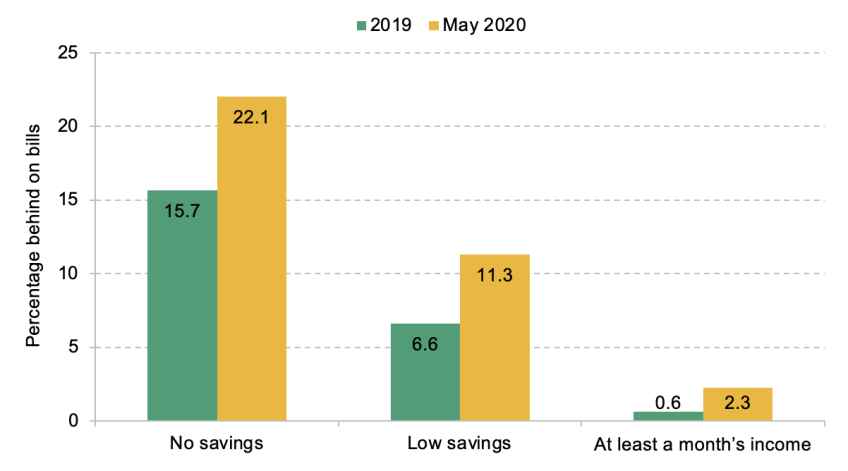
Focusing on those who were furloughed, became unemployed, or were self-employed and lost all work in April 2020, Figure 3.3 shows how arrears in bills varied by level of savings (see Figure B.3 in Appendix B for results from May 2020). Before the pandemic, those with lower levels of financial wealth were already more likely to be in arrears on bills. But the increase in the proportion in arrears by April 2020 was a lot greater for those with low levels of financial wealth than for those with at least a month’s income’s worth of financial wealth, and greater still for those with no financial wealth at all. Of course, this cannot necessarily be interpreted as a causal effect of financial wealth, as those with low savings may have other characteristics associated with greater vulnerability to economic shocks. For example, Crossley et al. (2021) found that those with low pre-COVID household incomes were also more likely to fall into arrears on bills. In Section 3.4, we will offer evidence that this is indeed a causal relationship.
Figure 3.3. Falling behind on household bills, by level of savings, amongst those who were furloughed, became unemployed, or were self-employed and lost all work, in April 2020, compared with 2019
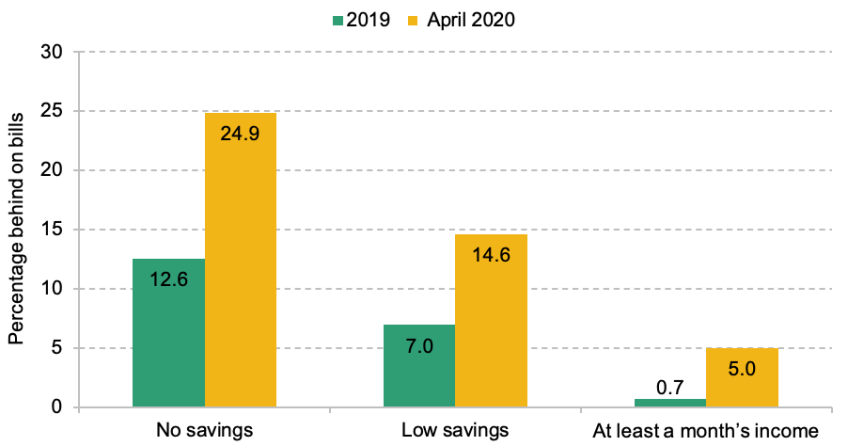
Note: ‘Behind on household bills’ here means the respondent reports being behind on some or all of their bills. Savings are measured in Wave 8. ‘Low savings’ means that the household has positive savings, but of less than a month’s income. Sample is those aged 16–60 at time of sampling in UKHLS Wave 8 (2016–17). 2019 data are drawn from Waves 10 and 11.
Source: Authors’ calculations using UKHLS, Waves 8, 10 and 11, and UKHLS COVID-19 study, Wave 1.
3.3 Estimating the protective effect of financial wealth
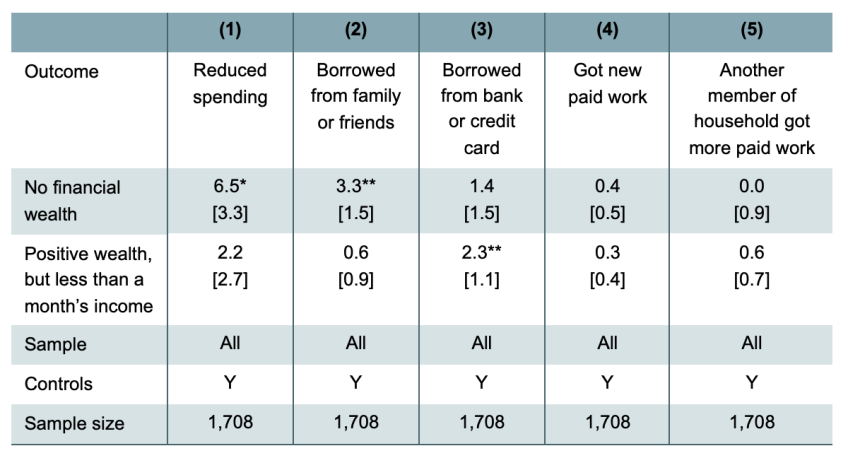
We use regression analysis to estimate the effect of financial wealth, including various controls to reduce bias arising from the fact that those with low financial wealth may be particularly vulnerable to economic shocks in ways not caused by, but correlated with, their low savings. We take as a sample those adults who were furloughed, self-employed and lost all work, or fell out of employment. For this sample, we then estimate the following regression model:
where:
- ∆fi,t+1
 is the change in whether individual i
 is behind on their household bills between time t
 (2019) and time t+1
 (April or May during the pandemic);
 - financialwealthi,t-1
 denotes having low or no financial wealth in 2016;
 - Xi,t-1 is a vector of controls, comprising log (equivalised) household income, education (four groups), age (four groups), sex, marital status (single or in a couple), children (yes/no), housing tenure (four groups) and region, all measured at baseline in 2016.
 (2019) and time t+1
 (April or May during the pandemic);
 denotes having low or no financial wealth in 2016;
∆fi,t+1 takes the value 1 if an individual’s household falls into arrears, 0 if it remains in arrears or not in arrears, and –1 if it is in arrears in 2019 but not in April or May 2020. Therefore, it is a ‘net’ measure of falling into arrears on bills – the proportion of people moving from keeping up with their bills to being in arrears, minus the number moving in the opposite direction. This methodology essentially follows that of Crossley and Low (2014), but our work looks at change in arrears in bills following a shock to labour market earnings rather than change in consumption following job loss. The controls are meant to account for heterogeneity in resilience to economic shocks which is correlated with, but not actually caused by, differences in levels of financial wealth. We estimate the causal effect of financial wealth on falling into arrears if, conditional on these controls, this heterogeneity is eliminated.
3.4 Results
April 2020
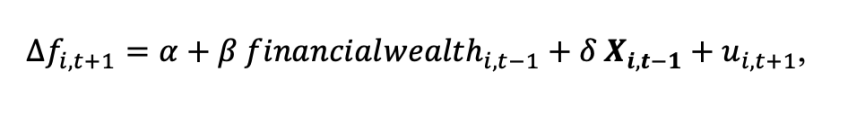
The results of this regression for April 2020 are presented in Table 3.1. We can see that those with no financial wealth were more likely to fall into arrears (6.3 percentage points) than those with at least a month’s income’s worth. The largest estimates are for those who were self-employed and lost all work (15.5ppts) and those who lost their jobs (12.7ppts), which is likely explained by the fact that support for these groups, at least initially, was much lower than support for those on furlough. The estimate for unemployed people is not quite statistically significant, but the sample for this group is small, resulting in large confidence intervals while the point estimate is economically large. These estimates are smaller than those without controls (see Table B.1 in Appendix B), confirming that those with low financial wealth are also less financially resilient in other ways.
Table 3.1. Estimated effect of having low or no savings, compared with having at least a month’s income in financial wealth, on falling into arrears on bills (percentage points), April 2020
Note: * 10% significance, ** 5% significance, *** 1% significance. Robust standard errors reported in square brackets. Controls are listed in Section 3.3.
Source: Authors’ calculations using UKHLS, Waves 8–10, and UKHLS COVID-19 study, Wave 1.
The effect of having low, but positive, financial wealth (compared with having at least a month’s income saved) on the probability of falling into arrears is much smaller for all groups. This is perhaps because in April 2020 the UK had only been locked down for a few weeks, meaning that even a low level of savings could be sufficient to tide many over.
May 2020
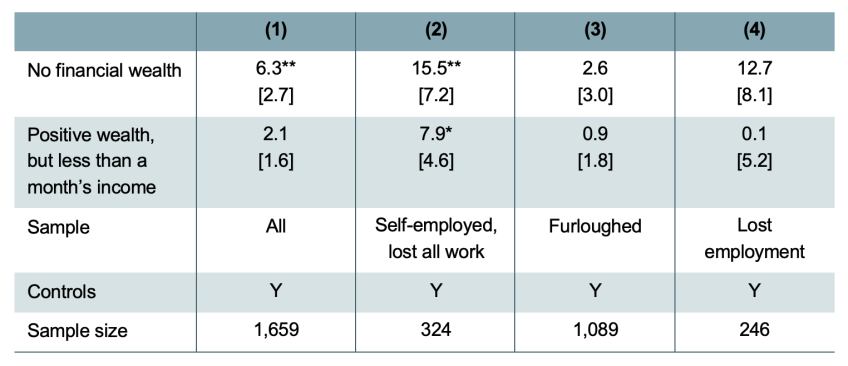
We estimate that the effect of low financial wealth on financial distress was similar in May (see Table 3.2); in fact for most groups the estimates are larger, especially for the effect of having low but positive savings compared with having more than a month’s income in savings. One possible explanation for this is that by May, households going into the pandemic with only low amounts of savings had exhausted these, whereas these low amounts had been enough to support them through to April. It is worth noting that SEISS payments were generally not received until the end of May, and many who may have needed support did not qualify (Cribb, Delestre and Johnson, 2021). So self-employed people had still received only limited support, increasing their reliance on savings. Those who had lost their jobs, on the other hand, may have been able to start receiving benefit payments by May.
Table 3.2. Estimated effect of having low or no savings, compared with having at least a month’s income in financial wealth, on falling into arrears on bills (percentage points), May 2020
Note: The shock groups were redefined for the May analysis, so those in the ‘lost employment’ group were unemployed in May, and analogously for the other groups. * 10% significance, ** 5% significance, *** 1% significance. Robust standard errors reported in square brackets. Controls are listed in Section 3.3.
Source: Authors’ calculations using UKHLS, Waves 8–10, and UKHLS COVID-19 study, Wave 2.
Alternative insurance mechanisms
As discussed in Chapter 2, drawing on savings is only one of the many means people might use to mitigate the impact of an economic shock. Other insurance mechanisms might include drawing on the resources of others in the household, cutting back on spending, or resorting to formal or informal credit. We might think that those with low levels of savings, as well as being more likely to fall into financial distress, will also be more likely to resort to these other measures.
UKHLS allows us to investigate this directly, as respondents who experience a fall in earnings are asked what action they took to mitigate the impact of this. Specifically, they are asked ‘If your household is now earning less than in January/February 2020, have you done any of the following to deal with this?’. Possible responses included:
- reduced spending;
- borrowed from family or friends;
- borrowed from bank or credit card;
- found new work;
- another member of my household found new work or increased hours.
We therefore repeat the above analysis for each of these alternative measures, replacing ∆fi,t+1 with Yi,t+1, where Yi,t+1 takes the value 1 if individuals report taking the respective measure to deal with the loss of earnings, and 0 otherwise (where we look at each measure in turn). This analysis therefore considers respondents’ reports of changes in their behaviour, rather than changes we measure from the data directly.
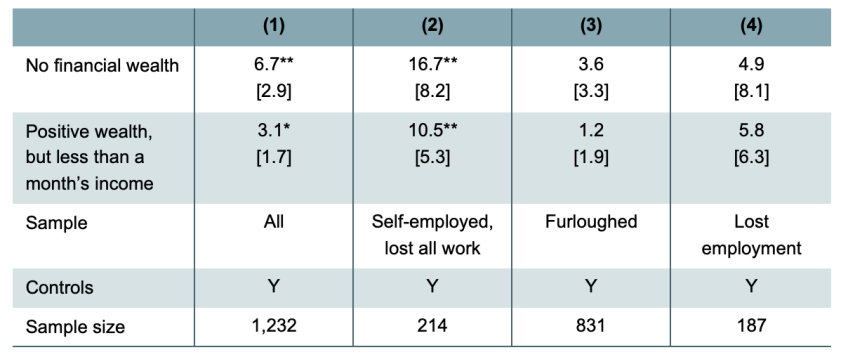
The results are shown in Table 3.3. There is statistically significant evidence that those with no financial wealth were more likely to reduce spending, or rely on informal credit (borrowing from family or friends), than those with at least a month’s income in savings. Those with low levels of financial wealth, in comparison, were more likely to borrow from the bank. One possible explanation is that those with no financial wealth are unable to access formal credit, given their precarious financial situation, whereas those with a small amount of savings are able to qualify. Perhaps unsurprisingly, given the lockdown situation and collapse of labour demand in Spring 2020, there is no evidence of a labour supply response as a way to deal with the financial shock that occurred then.
Table 3.3. Estimated effect of having low or no savings, compared with having at least a month’s income in savings, on other responses (percentage points), April 2020
Note: * 10% significance, ** 5% significance, *** 1% significance. Robust standard errors reported in square brackets. Controls are listed in Section 3.3.
Source: Authors’ calculations using UKHLS, Waves 8–10, and UKHLS COVID-19 study, Wave 1.
However, these results confirm that those with low savings are a little more likely to draw on other insurance mechanisms than those with higher amounts of savings, suggesting substitutability between different mechanisms. These other mechanisms might also help avoid deprivation, but are not costless, requiring potentially sharp reductions in spending, or future debt repayments, which could have been avoided if these households had had a larger stock of savings.
3.5 Summary
This chapter has provided evidence that savings were a means of mitigating the impact of the economic shock of the COVID-19 pandemic. In particular, having liquid financial wealth helped households to avoid falling into arrears on bills at the beginning of the lockdown period, in April and May 2020. Those with no savings were more likely to fall into difficulty at the start of the pandemic’s economic impact in April 2020, and a month later those who had some savings, but only a small amount, were also more likely to fall into arrears. Those with no savings, in particular, had a notably greater risk of falling into arrears than those with at least a month’s income’s worth of financial wealth. Savings were particularly important for those who were self-employed but lost all work, for whom support was very limited in the first couple of months of the pandemic period.
Other insurance mechanisms could substitute for savings to some extent – for example, reducing household spending or accessing credit. Those with no savings were more likely to reduce their spending or to borrow money from friends or family in response to a fall in earnings, compared with those with at least a month’s income in savings. It is interesting that this is in contrast to the findings of other recent research about financial transfers between family members. Boileau and Sturrock (2023) found that financial gifts or loans were associated with getting married or buying a house, and not with protecting people against economic shocks such as being unemployed. One potential reconciliation is that the shock of the pandemic was so unexpected, and occurred at a point when many were saving more due to restricted spending options, that it led to widespread financial help from family members. Another is that there is widespread financial help from family members but at levels below the (at least) £500 captured in the data used by Boileau and Sturrock.
In addition, our analysis finds that those with low levels of savings were more likely to borrow from a bank or credit card. Borrowing may have helped reduce, to some extent, the negative impact of having low or no savings on financial resilience. However, formal borrowing comes with downsides, such as high loan repayments, and is not available to all households.
4. Conclusion
Having low levels of liquid financial wealth is most common among low-income, younger, and less-educated people, perhaps unsurprisingly. But having less than £2,000, or a month’s income, saved is not uncommon even for those who do not fall into these brackets. Large proportions of those in the middle of the income distribution – who will have low earnings replacement rates offered by the state in the event of unemployment or another income shock, and who will typically have relatively less flexibility to cut back on discretionary expenses than higher-income households – have less than £2,000, or a month’s income, saved. This group is one of concern, since they will receive limited insurance and have less flexibility to adjust to income shocks in other ways.
This preponderance of low financial wealth is concerning because of the protective role financial wealth can play in insuring households’ living standards against short-term economic shocks. The pandemic provides important evidence of this. Those with no savings were more likely to fall into financial difficulties immediately in April 2020 at the start of the lockdown period. Savings were particularly important for those who were self-employed but lost all work, for whom state support was very limited in the first couple of months of the pandemic.
Many of those with low levels of financial wealth have other insurance mechanisms to deal with an economic shock. For example, significant numbers report that they would borrow from family and friends if faced with an unexpected major expense. Other mechanisms for dealing with different types of shocks could include cutting back other expenses, claiming benefits or accessing formal credit. During the pandemic, we saw that amongst those who took a hit to their incomes, those with low or no savings were more likely to reduce spending, or access informal or formal credit, than those with higher amounts saved.
However, these responses may not be optimal. Formal credit often has high costs, and when shocks are correlated, friends and family – key providers of informal credit – may also be facing difficulties and be reluctant or unable to assist. Cutting back spending can be difficult, particularly for those who already have low consumption or high pre-committed expenditures such as rent, council tax and utilities. Many with low savings simply cannot access other forms of support during a shock, as evidenced by the increased hardship amongst this group during the pandemic or by the fact that nearly a fifth of those with less than a month’s income saved report they could not meet an unexpected expense equal to a month’s income.
Given all this evidence of the importance of holding liquid wealth, policymakers might wish to try to increase levels of liquid savings in the population. One potential policy avenue is boosting financial literacy levels, given its importance in determining who ends up having low levels of savings. Those who answer more than one of the three survey questions on financial literacy correctly are less likely to have low savings – either less than £2,000 or less than a month’s income – even when controlling for other forms of wealth, income and education. And among those who do have low levels of wealth, this is more likely to be a very fleeting, rather than more longstanding, situation for those with high levels of financial literacy.
The findings in this report quantify the importance of financial wealth for avoiding hardship when faced with large adverse economic shocks. They also quantify the concerning extent to which many families who might lack other insurance mechanisms also have low levels of financial wealth. If more people were induced to save more, perhaps by improving financial literacy, then hardship amongst those in precarious economic circumstances might be reduced in future crises.
Appendix A. Survey questions
Financial literacy questions used in Chapter 2
Interest rate: Suppose you put £100 into a savings account with a guaranteed interest rate of 2% per year. You don’t make any further payments into this account and you don’t withdraw any money. How much would be in the account at the end of the first year, once the interest payment is made? ENTER AMOUNT TO NEAREST POUND
Bank statement: Looking at this example of a bank statement, please can you tell me how much money was in the account at the end of February? ENTER AMOUNT TO NEAREST POUND
Inflation: If the inflation rate is 5% and the interest rate you get on your savings is 3%, will your savings have more, less or the same amount of buying power in a year’s time?
PLEASE SELECT ONE ONLY:
1.More
2.The same
3.Less
4.Don’t know
Questions on financial wealth used in Chapter 3
In each of Waves 4 (2012 and 2013) and 8 (2016 and 2017), individuals are asked: ‘I’d like to ask about any savings or investments you may have. They can be in your name only, or held jointly with someone else. Which of these savings accounts do you have, if any?’.
- Savings or deposit accounts (with bank, post office, building soc)
- National Savings Accounts
- ISA – cash only
- ISA – stocks and shares or PEPs
- Premium Bonds
- Other types of savings accounts
Where they have these accounts, they are asked to specify the amounts held.
We aggregate savings up to the household level. If none of the household members has any savings accounts, we classify that household as having ‘no financial wealth’. If at least one household member does, we aggregate the reported amounts, and if they sum to less than one month’s worth of net household income, we classify the household as having ‘low financial wealth’.
Appendix B. Supplementary figures and tables
Figure B.1. Characteristics associated with having less than a month’s net income in financial wealth among the population aged 20–59
Note: Bars represent average marginal effects from a probit regression, where the outcome variable is having less than a month’s net income in financial wealth. Explanatory variables are age, sex, family type, housing tenure status, equivalised income decile, holding debt, region, education level, financial literacy, and terciles of property and pension wealth, not all of which are illustrated here. ‘Low’, ‘medium’ and ‘high’ levels of pension and property wealth are defined as being in the lowest/middle/top third of the distribution conditional on having positive pension/property wealth. Standard errors are clustered at the household level. Solid bars indicate that the effects are statistically significantly different from zero at the 5% significance level and shaded bars indicate that they are not.
Source: Authors’ calculations using the Wealth and Assets Survey, Round 7.
Figure B.2. Percentage of population aged 20–59 with less than £2,000 in financial wealth, by age, income and housing tenure, over time
Note: Financial wealth and income are measured on a benefit unit (family) level. Income is measured net of direct taxes and is equivalised according to family size using the OECD modified equivalence scale.
Source: Authors’ calculations using the Wealth and Assets Survey, Waves 2–5 and Rounds 6 and 7.
Figure B.3. Falling behind on household bills, by level of savings, amongst those who were furloughed, became unemployed, or were self-employed and lost all work, in May 2020, compared with 2019
Note: ‘Behind on household bills’ here means the respondent reports being behind on some or all of their bills. Savings are measured in Wave 8. ‘Low savings’ means that the household has positive savings, but of less than a month’s income. Sample is those aged 16–60 at time of sampling in UKHLS Wave 8 (2016–17). 2019 data are drawn from Waves 10 and 11.
Source: Authors’ calculations using UKHLS, Waves 8, 10 and 11, and UKHLS COVID-19 study, Wave 2.
Table B.1. Estimated effect of having low or no savings on falling into arrears on bills (percentage points), April 2020, no controls

Note: * 10% significance, ** 5% significance, *** 1% significance. Robust standard errors reported in square brackets.
Source: Authors’ calculations using UKHLS, Waves 8–10, and UKHLS COVID-19 study, Wave 1.
Data
Office for National Statistics, Social Survey Division. (2022). Wealth and Assets Survey, Waves 1-5 and Rounds 5-7, 2006-2020. [data collection]. 17th Edition. UK Data Service. SN: 7215, https://doi.org/10.5255/UKDA-SN-7215-17
University of Essex, Institute for Social and Economic Research. (2021). Understanding Society: COVID-19 Study, 2020-2021. [data collection]. 11th Edition. UK Data Service. SN: 8644, https://doi.org/10.5255/UKDA-SN-8644-11
University of Essex, Institute for Social and Economic Research. (2022). Understanding Society: Waves 1-11, 2009-2020 and Harmonised BHPS: Waves 1-18, 1991-2009. [data collection]. 15th Edition. UK Data Service. SN: 6614, https://doi.org/10.5255/UKDA-SN-6614-16
Endnotes
Authors

Bee Boileau
Bee joined the IFS in 2021 as a Research Economist and works in the Retirement, Saving and Ageing sector.

Jonathan Cribb
Jonathan joined IFS in 2011. His research areas includes: pensions, ageing and demographic change, public sector pay, housing, and inequalities.

Tom Wernham
Tom's main research areas are living standards and poverty, the benefits system, and its interactions with the labour market.
More from IFS
Understand this issue


Policy analysis


Academic research


