
Downloads
Download a PDF of the report here
PDF | 612.42 KB
Executive summary
This report gives a new and up-to-date picture of the giving and receiving of significant intergenerational wealth transfers during life, summarising the findings of two research papers. New data from the Wealth and Assets Survey (WAS) allow us to build a comprehensive picture of the flow of wealth transfers made during life. The WAS asks about the giving and receiving of gifts and loans worth £500 or more between friends and family. We examine the change in patterns of giving over time, who gives and receives transfers, the contribution of these transfers to early-adult-life economic inequalities, and the events associated with giving and receiving wealth transfers during life.
Key findings
1. Over a two-year period, around 5% of adults receive a substantial gift and 2% receive a substantial loan, from friends or family. Over an eight-year period in adults’ 20s and early 30s, around 30% receive at least one transfer. Gift receipt has become slightly more common since 2017 but there is no strong trend of larger amounts being transferred over time.
2. Transfers are very unequally sized. The median gift and median loan received are both around £2,000 but the 10% largest transfers are over £20,500. The largest 5% of transfers made up more than half of the total value of transfers received over 2018–20.
3. Substantial transfers during life are mainly gifts, rather than loans. The annual flow of gifts is around four times the value of the annual flow of loans. In total, these lifetime transfers are around a fifth of the size of the annual flow of inheritances.
4. These transfers overwhelmingly represent gifts from parents to their adult children, with parents giving 83% of the value of gifts and (great-)grandparents contributing just 3%. Some parental giving could be inheritances passed straight on to children, but only 3% of the value of inheritances directly received is matched by a contemporaneous gift being given.
5. Transfers increase inequalities in resources in early adulthood, though their direct impact is modest. The lowest-income fifth receive on average £30 per year in transfers, worth 0.5% of income, during their 20s and early 30s. This compares with £790 per year, or 2.6% of income, for the highest-income fifth.
6. Transfers strengthen the relationship between parents’ and children’s economic resources. They are worth 1% of income for the children of renters, compared with 3% of income for the children of high-educated homeowners. Over half (56%) of the value of transfers is made by the wealthiest fifth of adults.
7. Gift receipt is more frequent for white young adults than for black or Asian young adults. While 1 in 10 white young adults receive a significant gift in a two-year period, around 1 in 25 black Caribbean or black African young adults and less than 1 in 30 Pakistani or Bangladeshi young adults do.
8. Women are more likely than men to receive transfers, especially at younger ages. Even when we control for the differences in their income, wealth level and other characteristics, women are around 1 percentage point more likely to receive gifts than men.
9. Men are more likely to report giving gifts than women, especially at older ages. Controlling for differences in their income, wealth level and other characteristics, men are about 1.5 percentage points more likely to report giving a gift over a two-year period than women.
10. Those in the South West are more likely to make transfers, even accounting for the higher levels of wealth in these regions. This may be driven by differences in the perceived needs of receivers across regions.
11. First home purchase is strongly associated with transfer receipt. Someone moving into homeownership is 9 percentage points – or two-and-a-half times – more likely to receive a gift over the same period than someone who is otherwise similar but did not become a homeowner. Half of the value of gifts received is reported as being used for property purchase or improvement.
12. Marriage is also significantly associated with transfer receipt. Getting married between waves is associated with a 9 percentage point higher rate of receiving a transfer over the same period, compared with someone similar who did not get married between waves.
13. Substantial gifts and loans are less responsive to adverse events such as job loss, income falls and separation from a partner. This is consistent with other evidence that smaller transfers are sometimes made in response to these events.
14. Those with different levels of wealth and from different parental backgrounds report using gifts in different ways. Those with homeowning parents are particularly likely to report using a gift for property purchase or improvement. Those in the bottom-wealth third are more likely than those who are wealthier to report using gifts for the purchase of a new car or driving lessons (16% of the total received), to pay off debts (12% of the total) or for educational or family expenses (10% and 7% of the total, respectively). This differing use of transfers is likely to have knock-on impacts on inequalities in wealth and living standards later in life.
15. Gifts and loans also appear to be made in response to unexpected events in the lives of givers, including being widowed and receiving an inheritance. Women are 20 percentage points more likely to make a gift when becoming widowed, while there is no such increased likelihood for men. This suggests a potential response to a change in control of household finances but may also raise concerns about whether these transfers are always in the giver’s best interests.
Introduction
The value of UK household wealth has roughly doubled compared with incomes in recent decades (Bangham and Leslie, 2019; Bourquin, Brewer and Wernham, 2022). This wealth boom has accrued disproportionately to those at older ages. The growth in house prices since the mid 1990s has largely driven this growth, benefiting older homeowners and meaning later-born generations have been far less likely to move into homeownership than their predecessors. In a further hit to the relative economic fortunes of younger people, earnings growth has been sluggish over the last 15 years and average incomes of people of working age have fallen relative to those of pensioners (Bourquin, Brewer and Wernham, 2022).
Much of the wealth held by older generations will at some point be passed down to today’s younger people. Consequently, inheritances can be expected, roughly, to double compared with receivers’ lifetime incomes in the coming decades (Bourquin, Joyce and Sturrock, 2021). However, inheritances are set to arrive later and later in life, as a result of increasing life expectancies at older ages across generations. Bourquin, Joyce and Sturrock (2020) estimate that the average age at which an individual’s final living parent will die is set to rise from 58 for those born in the 1960s to 64 for those born in the 1980s: a six-year increase in just two decades.
As inheritances are received later, wealth is distributed more unevenly between generations, and as younger generations face low earnings growth and high house prices, wealth transfers made during life may be growing in importance and in size. Despite this, a limited amount is known about this during-life intergenerational wealth flow. It is likely to differ in important ways from the flow of inheritances, since givers have control over the time at which they make transfers if they are made during life, so may decide when to give based on specific events in their or the receiver’s life. For example, givers might play an increasing role in helping younger people get on the housing ladder or providing support during periods of unemployment. During-life transfers may also interact with government policy in important ways: they may respond to inheritance taxation policies, for example, since large gifts made more than seven years before death are not subject to inheritance tax in the UK. Like inheritances, they have important implications for the intergenerational transmission of inequality.
Our focus is on the substantial financial transfers recorded in the Wealth and Assets Survey (WAS), but it is important to note that there will be wealth flows below the £500 threshold that are not included in our study. It is also the case that WAS fails to fully capture the very richest in the UK (Advani, Bangham and Leslie, 2021). We will thus miss some of the gift-giving behaviour of the very wealthiest individuals, but we are still able to describe patterns of gifts and loans for the vast majority of the population.
Trends over time
In a given two-year period, around 5% of adults receive a significant gift and 2% receive a significant loan. Figure 1 shows the percentage of individuals aged 20 or over receiving a significant gift or loan over the preceding two years, for each year from 2008–09 to 2019–20. There is no very strong trend over time, although the receipt of gifts has become more common since 2017.
Over the period 2008–09 to 2019–20, the median size of transfers received, among receivers, has stayed fairly steady at around £2,000 (in 2020 prices). The distribution of transfers is highly unequal, with the largest 10% of transfers being over £20,500. The value of the largest 5% of transfers made up more than half (50.9%) of the total value of transfers reported during 2018–20.
There is some indication that the size of the largest transfers is increasing over time, but, because these are relatively infrequently received, we cannot establish this as a definite trend in our data.
Transfers are primarily in the form of gifts, with the annual flow of gifts over four times the annual flow of loans. In total, this flow is around a fifth of the size of the annual flow of inheritances. The average size of lifetime gifts and loans is significantly smaller than the average inheritance. But their importance will also depend on when in life they are received, and whether they interact with other economic circumstances, events or decisions.
Figure 1. Share of adults receiving a substantial gift or loan in the past two years, by year
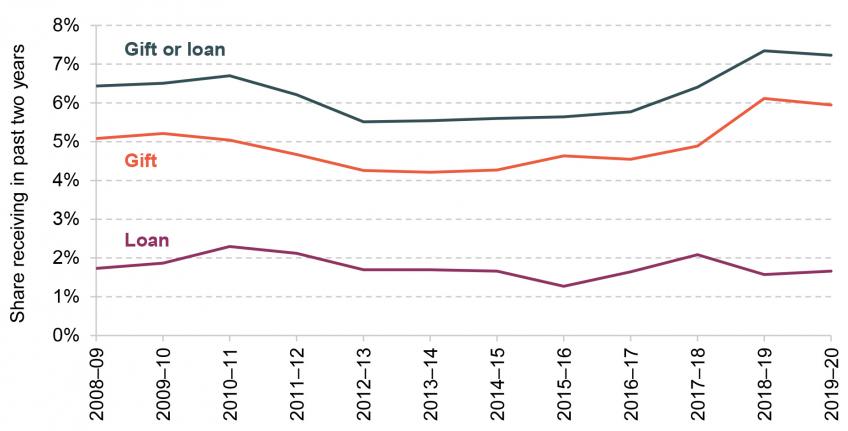
Note: 2008–09 here refers to July 2008 to March 2009, half of WAS wave 2’s time period. The period covered by each wave changed in 2016 when WAS changed from waves to rounds, so 2015–16 covers July 2015 to June 2016, and 2016–17 covers April 2016 to March 2017. The repetition of April–June 2016 is not part of the analysis elsewhere. ‘Adults’ here refers to individuals aged 20 or older.
Source: Wealth and Assets Survey, waves 2 to 5 and rounds 6 and 7.
Who gives to whom?
These transfers are in large part flowing from the old to the young, and, specifically, from parents to children. Those aged 25–34 are the age group most likely to receive a transfer, with around 1 in 10 receiving a gift and 1 in 25 receiving a loan over any two-year period. The probability of transfer receipt declines steadily with age thereafter, falling to around 1 in 50 for those over 70. Giving of transfers is much more frequent for those in their 50s or older, with the over-50 population more than three times as likely to make a transfer as those under 50.
More than two-thirds of gifts are received from recipients’ parents, with a further 9% received from grandparents or great-grandparents, 8% from ‘other’ relatives1 and 4% from non-relatives. Only 3% of gifts were from children to their parents. When accounting for the value of the flow of gifts, parental giving dominates even more. Figure 2 shows the split of gift value by the relation of the giver to the receiver. This shows that 83% of the value of the flow of gifts is received from parents, with grandparents or great-grandparents transferring just 3% of gift value. Despite a narrative about the importance of grandparental giving, we therefore find that this is small in comparison with the role of parents.
Figure 2. Share of gift value received, by relation of giver to receiver
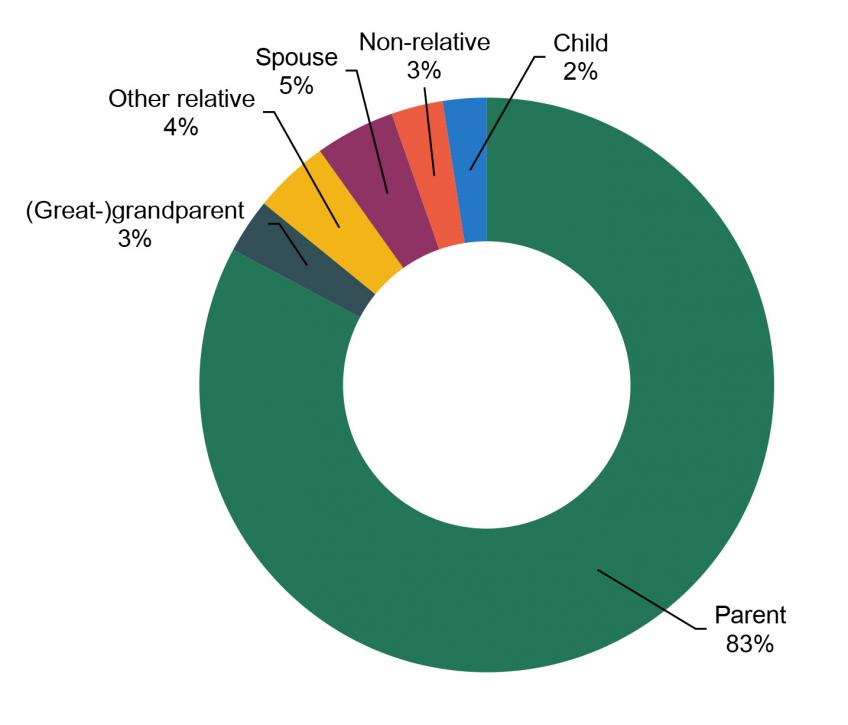
Note: Percentages may not sum to 100 due to rounding.
Source: Wealth and Assets Survey, round 7.
Some parental giving could of course represent inheritances received and (partially) passed on to children. Of those who reported receiving a (non-spousal) inheritance of at least £1,000 in the last two years, 14% reported having made a gift in the same period, compared with 7% of those who did not report receiving an inheritance. These givers passed on an average of 22% of their inheritance, meaning just 3% of the value of the inheritance flow was matched by a contemporaneous gift.
What are the impacts on inequalities?
Given that these transfers mainly arrive when people are in their 20s and 30s, we look at their contribution to inequalities in early-adult life economic resources. We follow a cohort of young adults, initially aged between 19 and 28, over an eight-year period. We compare the cumulative transfers they receive over this period with their total income over that time and with their wealth at the end of the period.
Figure 3 shows the percentage of these individuals who receive a transfer at some point in the eight-year period, and the size of total transfers received as a share of their income over the same eight-year period, splitting by income quintile. Overall, 30% of these young adults received a transfer over the eight-year period, with 5% receiving a transfer of over £20,000 at some point. These transfers were worth 2% of their income over that period. Those with higher incomes were more likely to receive a transfer and received larger amounts, in absolute terms and as a share of their income. The share receiving a transfer over the period rises from 13% in the lowest-income fifth to 54% of the highest-income fifth. Those in the highest-income fifth received an average of £790 per year or 2.6% of their income, compared with £30 per year or 0.5% of income for the lowest-income fifth. These transfers therefore increase inequalities in total resources in early adulthood, before thinking about any knock-on consequences for other outcomes. That said, their overall size is fairly modest.
Figure 3. Cumulative transfer receipt by cumulative income quintile, among individuals in their 20s and early 30s
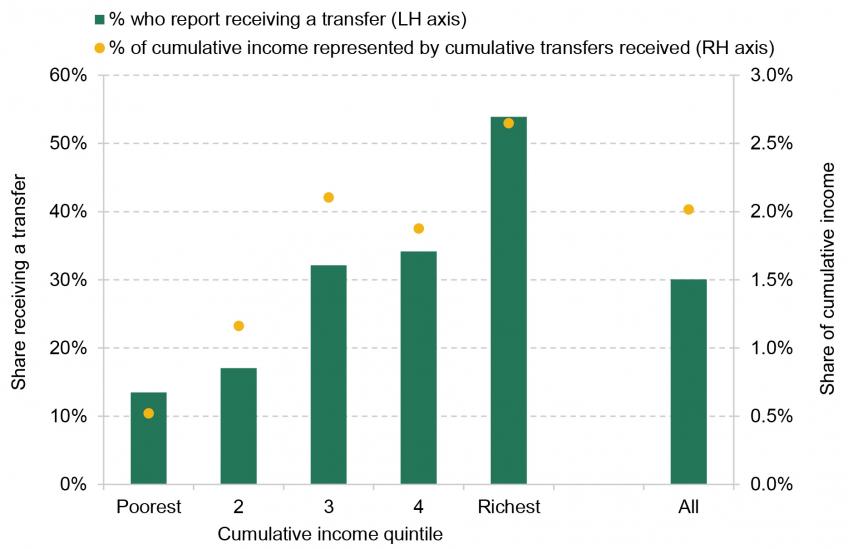
Note: Sample includes individuals present for four consecutive waves of WAS: waves 4 and 5 and rounds 6 and 7. We include interviews in April–June 2012 of wave 3, in order to account for the change in survey timings as WAS switched to rounds.
Source: Wealth and Assets Survey, waves 3 to 5 and rounds 6 and 7.
When comparing transfers received and wealth at the end of the period, we find that transfers received are a larger share of wealth for those with lower levels of wealth. While transfers equate to 30% of wealth in the bottom wealth quintile, they are just 3% in the top wealth quintile. The contrast between the patterns we see across the distribution of wealth and across the distribution of cumulative income reflects the fact that wealth depends not only on levels of transfers and other income but also on how much of these are saved. It is known that individuals with lower lifetime income tend to save a smaller fraction of their income and so transfers will, other things being equal, be larger when compared with their accumulated wealth than for those with higher lifetime income2. Indeed, looking (over the whole population of gift-receivers) at whether gifts are reported as saved or spent, and splitting by wealth quintile, we see that higher proportions of gifts are saved by wealthier recipients and spent by less wealthy recipients.
In the context of intergenerational transfers, differences between those with more or less well-off parents are particularly salient. We split our group of young adults into three groups according to parental background. For those whose parents rented their home when the adult was a teenager, cumulative transfer value represented slightly below 1% of cumulative income. This rose to 2% for those whose parents were homeowners but where neither had a university degree, and was highest – at just over 3% – for those whose parents were homeowners and at least one parent had a university degree. In absolute terms, the average annual transfers received were around £100 for the renter group, £240 for the low-educated homeowner group and £560 for the high-educated homeowner group.
Intergenerational transfers therefore have a direct effect of strengthening the relationship between parents’ and children’s economic resources. This is reinforced by finding that 56% of the value of transfers is made by the wealthiest fifth of people.
Differences between groups
We analyse differences in the rates at which intergenerational transfers are given and received between groups, with potentially important implications for inequalities between these groups.
There are clear differences in the rates of receiving transfers by ethnicity. Figure 4 shows rates of receipt of gifts and loans by ethnicity, considering only those aged 20–39 in order to focus on the ages where transfers are commonly received and to abstract from differences driven by the different age distributions of different ethnic groups. While around 1 in 10 white young adults receive a significant transfer in a two-year period, this rate is much lower, at around 1 in 25, for black Caribbean or black African young adults. The lowest rates of transfer receipt are among Pakistani or Bangladeshi young adults, with 3%, or less than 1 in 30, receiving a substantial gift over a two-year period. Rates of loan receipt are more similar across groups, however.
Figure 4. Share of 20- to 39-year-olds who report transfer receipt in the past two years, by ethnic group
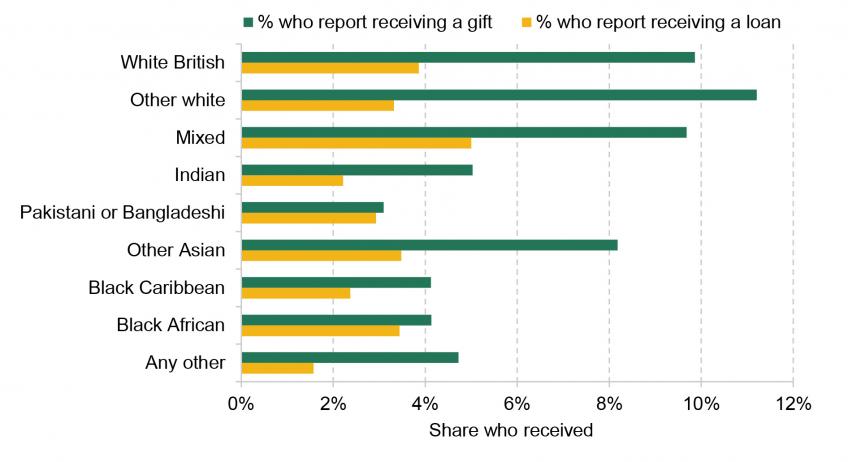
Note: We restrict the sample to those aged 20–39 to avoid capturing the effects of the different age distributions of different ethnic groups.
Source: Wealth and Assets Survey, waves 2 to 5 and rounds 6 and 7.
When controlling for differences in wealth as well as other characteristics, such as age, educational achievement and income, those who are Indian, Pakistani, Bangladeshi, of other Asian ethnicity (excluding Chinese) and black African remain less likely to report having received a gift than those who are white British, by 2–5 percentage points. These are large differences compared with the baseline rate of gift receipt. Intergenerational transfers may thus play a role in driving well-documented wealth gaps by ethnicity (Mirza and Warwick, 2021), leading these wealth differences to be passed down through generations. Future research should investigate this in more detail.
Looking across regions, we see that those in the South West and South East are around twice as likely to make a transfer as those in Scotland, the North West or the North East. This is likely driven in part by the higher wealth levels of the former regions. Even when we control for differences in wealth (and other characteristics), though, those in the South West are still around 3 percentage points more likely to make a gift than those in the North East, North West and Scotland. This may be driven by differences in perceived needs of receivers across regions (we see elevated levels of gift receipt in Yorkshire, London, the South East and the South West).
We turn finally to gender. Even when we control for the differences in their income, wealth level and other characteristics, men – particularly driven by those at older ages – are about 1.5 percentage points more likely to report giving a gift over a two-year period than women. In contrast, at younger ages, women are more likely to receive gifts, driving a 1 percentage point difference in the rate of transfer receipt once characteristics are controlled for.
When and why do people give?
Transfers are generally received early in adult life, and the rates at which transfers are received and given differ between various groups. This raises the question of what prompts these transfers to be made, as well as of what effects they might have on key choices. The fact that large transfers tend to be infrequently received also motivates the question of what prompts the making of transfers. Looking at those present in all seven waves and rounds of WAS and who receive at least one transfer, more than 60% report receiving a transfer at just one interview, with 88% receiving at either one or two interviews.
We shed light on what prompts transfers and, relatedly, what they are used for, by looking at which important life events happen at the same time as transfers are given and received. Specifically, we construct measures of changes in status (such as marrying, moving into unemployment or becoming a homeowner) between two WAS interviews and look at how much more likely someone is to receive a transfer when experiencing these events than when not experiencing these events, controlling for their other characteristics3. We do the same on the giving side with a different set of life events.
Events associated with receiving transfers
Becoming a homeowner is strongly associated with transfer receipt. As shown in Figure 5, someone moving into homeownership is 9 percentage points more likely to receive a gift over the same period than someone who is otherwise similar but did not become a homeowner. Gift receipt rates among those who move into homeownership are 16%, while they are 6% among those who are similar but do not move into homeownership, meaning the former are two-and-a-half times more likely to receive a gift than the latter. While this does not imply causation, it is strongly suggestive of a close relationship between these two events.
Marriage is another event strongly related to gift receipt, with those getting married also 9 percentage points more likely to receive a gift than similar people who did not get married. Those getting married have a rate of gift receipt of 18%, twice as high as the 9% among those with similar characteristics who did not get married. Moving into self-employment is associated with a higher probability of receiving a gift or a loan, though the magnitude of the association is smaller.
Figure 5. Association between life events and the probability of receiving a gift or loan
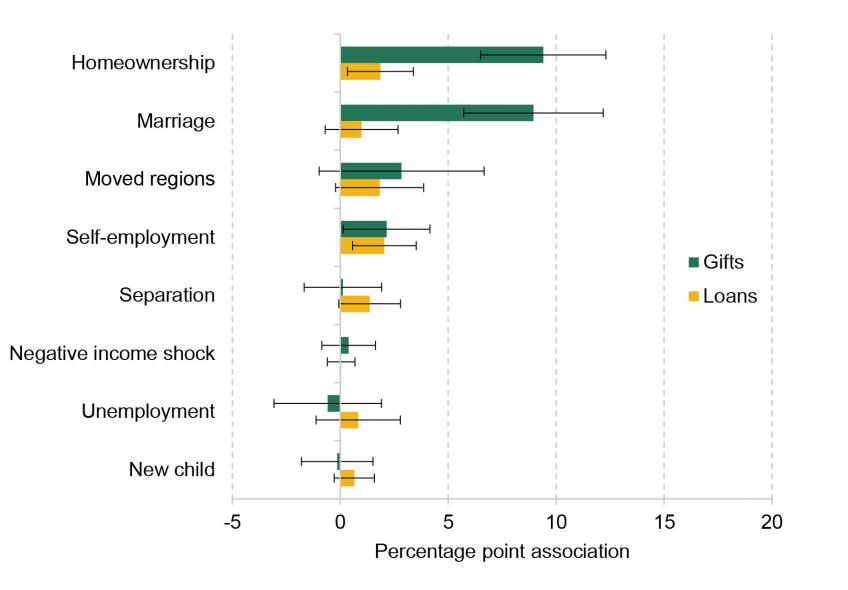
Note: Figure shows the estimated coefficients for each life event from two ordinary least squares (OLS) regressions. The outcome variable is whether or not the individual received a gift/loan. The explanatory variables are indicator variables for having experienced each life event and controls for five-year age group, sex, lagged family wealth quintile, lagged family income quintile, education level, an interaction between parents' housing tenure and educational status when respondent was a child, government office region of residence, family housing tenure status, marital status, number of children in the household, and wave number. Lines show 95% confidence intervals.
Source: Wealth and Assets Survey, waves 3 to 5 and rounds 6 and 7.
In contrast, changes that correspond to negative, and perhaps less anticipated, events – such as separating from a partner, experiencing a fall in income (here measured as a fall of 30% or more between waves), or becoming unemployed – are not significantly associated with receiving the substantial transfers we look at. Other research in the UK, covering transfers that are smaller in size, has found that they are responsive to these sorts of events (Karagiannaki, 2011). An explanation for these apparently contrasting results is that families and friends may respond to these negative events by making small transfers, but not by making ones that are £500 or more in value.
When we consider not just whether a transfer is received but also the amounts transferred, home purchase stands out, with those becoming homeowners 6 percentage points more likely to receive a transfer of over £5,000 than others who were similar but did not become homeowners. While the mean value of transfers received among those receiving any transfer is around £6,500, the mean value for those who reported that they used their gift for property purchase or improvement is over £20,000.
People whose parents have higher socio-economic status are more likely to receive a transfer when becoming homeowners and, among those receiving a gift to help with property purchase, report much larger gifts. Those whose parents were homeowners with at least one of them having a university degree are 12 percentage points more likely than other similar individuals to receive a transfer of over £5,000 when becoming a homeowner. In contrast, those whose parents were renters are not significantly more likely to receive a transfer of over £5,000 when becoming a homeowner compared with other similar individuals. In addition, those whose parents were degree-educated homeowners and who reported receiving a gift to help with property purchase or improvement receive an average of £26,000, compared with £9,900 received by those with parents who were renters.
Gifts and loans show very similar patterns, although loans are less frequently received. Homeownership and self-employment are associated with higher likelihoods of receiving a loan, while marriage is only significantly associated with a higher probability of receiving a gift.
Events associated with giving transfers
Looking at givers, Figure 6 shows that being newly widowed is strongly associated with the making of gifts and loans, while receiving an inheritance of £1,000 or more is associated with making a gift. Being widowed is associated with a 12 percentage point elevated probability of making a transfer, corresponding to a rate of giving that is twice as high as among a comparable group not experiencing this event. In the case of inheritance receipt, the probability of giving is 5 percentage points higher. The timing of these events is likely to be unanticipated to some extent and perhaps leads to a reassessment of individuals’ financial positions. Other events that are more predictable or under the individual’s control, such as starting to draw a pension, paying off a mortgage or retiring, are not significantly associated with higher rates of making transfers.
The association between being widowed and giving a gift is driven by women. Remarkably, they were 20 percentage points more likely to make a gift following this event, compared with a (statistically insignificant) 1 percentage point increased likelihood for men. Women were also 15 percentage points more likely to make a loan when being widowed, with no increase for men. This might be because women have different preferences from their spouse about the making of transfers and are able to give in accordance with these when their partner dies. This finding might also be a cause for concern in case it is driven by women being put under pressure to give, or by women whose spouse was the primary financial decision-maker before their death perhaps being more at risk of making financial decisions that are not necessarily in their best interests.
Figure 6. Association between life events and the probability of giving a gift or loan
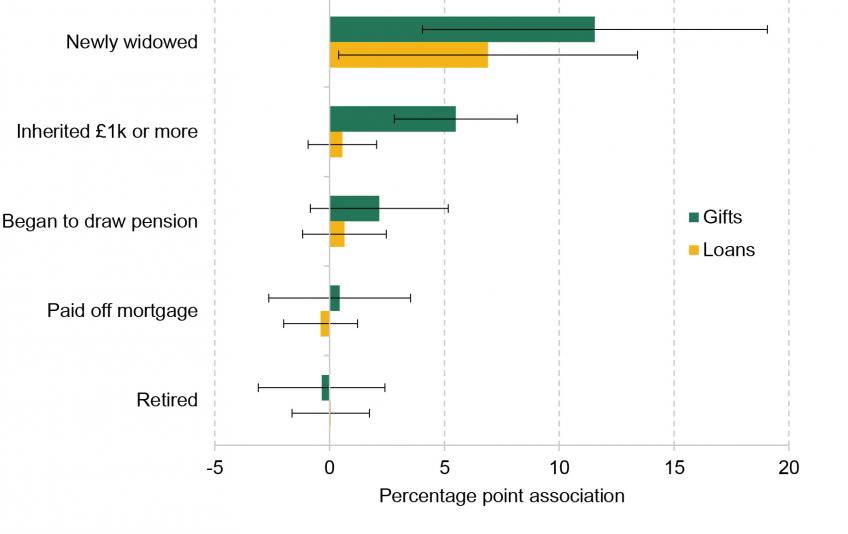
Note: Figure shows the estimated coefficients on each life event from two OLS regressions. The outcome variable is whether or not the individual gave a gift/loan. The explanatory variables are indicator variables for having experienced each life event and controls for five-year age group, sex, lagged family wealth quintile, lagged family income quintile, education level, government office region of residence, family housing tenure status, marital status, number of children in the household, and wave number. Lines show 95% confidence intervals.
Source: Wealth and Assets Survey, round 7.
What events do most to explain the flow of transfers?
We have shown that when certain key events happen, there is a higher chance of transfers being made at the same time. In terms of explaining the flow of wealth, what also matters is how common these events are in the first place. If transfers are very responsive to an event but that event is rare, the overall flow of transfers might remain relatively unexplained.
We therefore look at what proportion of the overall flow of transfers coincides with each of our constructed life events, and how this compares with the rate of these life events in the population as a whole. This gives us an upper bound on the proportion of transfers that might be explained by a life event for receivers and givers. We also examine the proportion of transfers self-reported as being used for different purposes, again giving us a sense of what explains large shares of the overall transfer flow.
These two approaches are complementary: they are able to measure different sets of events and different uses of transfers. Furthermore, while the life events we construct may be viewed as a more ‘objective’ measure of changes, some events may coincide with a transfer without being caused by, or causing, it. The subjective reports of transfer use might be seen as giving a more direct measurement of what drives transfers, but might also suffer from the fact that people could report having used a transfer for a specific purpose even if they would have made that choice in the absence of the transfer.
Over a third (36%) of the flow of the value of transfers is associated with one or more of the events we examine in the lives of receivers. This compares with 18% of the population at large who experience one or more of these events. Movement into homeownership and marriage are the largest contributors both in terms of how much of the flow of wealth is coincident with these events and in terms of how much higher these rates are than for the overall population. For those with university-educated homeowning parents, movement into homeownership coincides with 17% of the flow of gift value, compared with 4% for those with renting parents. On the giving side, despite the fact that being newly widowed appears likely to prompt giving by women, it is only associated with 2% of the total value of gifts given, as becoming widowed does not prompt the giving of particularly large gifts. Inheriting does prompt larger gifts and coincides with 10% of the value of gifts given.
Figure 7. Percentage of gift value accounted for by different self-reported uses
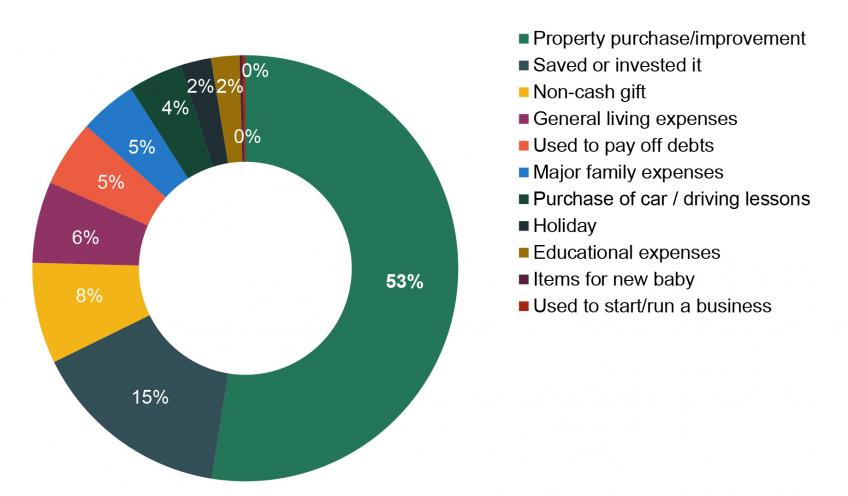
Note: Percentages may not sum to 100 due to rounding.
Source: Wealth and Assets Survey, round 7.
The importance of property purchase is reinforced, and even more strongly brought out, by the reported use of gifts. Figure 7 shows that over half of the value of gifts received (£7.4 billion per year) is reported to be used for property purchase or improvement. This is higher than the figure we obtain using the life event of transition into homeownership, possibly because gifts could also be used when homeowners buy a new home or when they carry out improvements on an existing home. The second most significant reported use of transfers is to save or invest them, at 15% of the total. Other reported uses are smaller in size and this is consistent with our finding that there is not a strong association between negative life events and receipt of transfers (which might show up under ‘general living expenses’).
There are important differences in the reported use of gifts across groups. In line with our analysis of life events coinciding with transfers, 58% of transfer value is reported as being used for property purchase or improvement among those whose parents are university-educated homeowners, compared with 42% for those whose parents are renters. Saving or investing gifts is particularly prominent for those in the middle of the wealth distribution, at 21% of the total received. Those in the bottom-wealth third report that a quarter of the flow of gifts is used for property purchase or improvement and are more likely than those who are wealthier to report using gifts for the purchase of a new car or driving lessons (16% of the total in the bottom third compared with 5% in the top third), to pay off debts (12% of the total in the bottom third, 6% in the top third), for educational expenses (10% of the total in the bottom third, 1% in the top third), for major family expenses (7% of the total in the bottom third, 5% in the top third) or for holidays (7% of the total in the bottom third, 3% in the top third).
Summary
Substantial transfers made during life between friends and family are, primarily, gifts from parents to their children when those children are in their 20s and 30s. These transfers increase inequalities in total resources in early adult life, both in absolute and percentage terms. They also increase the gaps between those with better- and worse-off parents. Transfers are given much more frequently by those in the South than those in the North East and North West of England and Scotland, and are received more than twice as frequently by white young adults as by black and Asian young adults. They could therefore have implications for transmitting existing, and significant, ethnic and regional inequalities in wealth down generations.
The direct contribution of transfers to inequalities in economic resources appears modest. For example, we estimate that while they are worth 1% of income for those in the lowest-income fifth, this rises to 3% for the highest-income fifth. To give further perspective, the annual flow of substantial gifts and loans is around a fifth of the annual flow of inheritances.
These transfers therefore look to be important if they interact with other decisions made in early adult life. The significant transfers that we observe do not look to be given in response to adverse events such as job loss or separation from a partner, although this remains consistent with smaller transfers being given in response to these events. We see instead that, for the significant transfers we examine, there is a strong relationship with property purchase and movement into homeownership. We find that over half of the value of gifts received is reported as being used for property purchase or improvement and that this share is higher for those with homeowning parents, who also receive more valuable gifts for this purpose. Previous IFS research has shown that those with wealthier parents are more likely to get on the housing ladder, even when comparing those with the same level of earnings, than their peers with less wealthy parents, and that they buy more expensive houses compared with their incomes when doing so (Davenport, Levell and Sturrock, 2021). It is likely that these transfers make this possible for some individuals. Those who are less wealthy are more likely to report using the transfers that they receive to meet certain expenses or to repay debts. While these different uses of transfers by wealth and by parental background may well represent the best use of this money given the different situations faced by these different groups, if these transfers allow those from better-off backgrounds to access higher-return assets such as housing, while those from poorer backgrounds spend a greater share of transfers on day-to-day expenses, this could well have knock-on consequences for inequalities in wealth and living standards in later life.
Our findings also suggest that the giving of transfers is prompted by unexpected life events in givers’ lives as well as being driven by the position of receivers. Being widowed or receiving an inheritance may prompt a reassessment of one’s financial situation or mean a change in who controls a household’s financial resources. The finding that women are much more likely to give a gift or loan following the death of their spouse – but that men are not – deserves further investigation, particularly if it could indicate women making, or being pressured to make, choices that are not in their longer-term best interests.
References
Advani, A., Bangham, G. and Leslie, J., 2021. The UK’s wealth distribution and characteristics of high-wealth households. Fiscal Studies, 42(3–4), 397–430, https://doi.org/10.1111/1475-5890.12286.
Bangham, G. and Leslie, J., 2019. Who owns all the pie? The size and distribution of Britain’s £14.6 trillion of wealth. Resolution Foundation, Spotlight, https://www.resolutionfoundation.org/publications/who-owns-all-the-pie/.
Bourquin, P., Brewer, M. and Wernham, T., 2022. Trends in income and wealth inequalities. IFS Deaton Review of Inequalities, https://ifs.org.uk/inequality/trends-in-income-and-wealth-inequalities/.
Bourquin, P., Joyce, R. and Sturrock, D., 2020. Inheritances and inequality within generations. IFS, Report, https://ifs.org.uk/publications/inheritances-and-inequality-within-generations.
Bourquin, P., Joyce, R. and Sturrock, D., 2021. Inheritances and inequality over the life cycle: what will they mean for younger generations? IFS, Report, https://ifs.org.uk/publications/inheritances-and-inequality-over-life-cycle-what-will-they-mean-younger-generations.
Bozio, A., Emmerson, C., O’Dea, C., and Tetlow, G., 2017. Do the rich save more? Evidence from linked survey and administrative data. Oxford Economic Papers, 69(4), 1101–19, https://doi.org/10.1093/oep/gpx024.
Davenport, A., Levell, P. and Sturrock, D., 2021. Why do wealthy parents have wealthy children? IFS, Report, https://ifs.org.uk/publications/why-do-wealthy-parents-have-wealthy-children-0.
Dynan, K., Skinner, J. and Zeldes, S., 2004. Do the rich save more? Journal of Political Economy, 112(2), 397–444, https://doi.org/10.1086/381475.
Fagereng, A., Holm, M. B., Moll, B. and Natvik G., 2019. Saving behavior across the wealth distribution: the importance of capital gains. NBER, Working Paper W26588, https://www.nber.org/papers/w26588.
Karagiannaki, E., 2011. The magnitude and correlates of inter-vivos transfers in the UK. Centre for Analysis of Social Exclusion, CASE Paper 151, https://EconPapers.repec.org/RePEc:cep:sticas:case151.
Mirza, H. and Warwick, R., 2022. Race and ethnicity. IFS Deaton Review of Inequalities, https://ifs.org.uk/inequality/race-and-ethnicity-chapter.
Data
Office for National Statistics, Social Survey Division. (2023). Wealth and Assets Survey, Waves 1-5 and Rounds 5-7, 2006-2020. [data collection]. 17th Edition. UK Data Service. SN: 7215, DOI: 10.5255/UKDA-SN-7215-17
Endnotes
Authors

Bee Boileau
Bee joined the IFS in 2021 as a Research Economist and works in the Retirement, Saving and Ageing sector.

More from IFS
Understand this issue


Policy analysis


Academic research


