
Further education colleges and sixth forms saw some of the largest cuts in spending in the decade up to 2020. Since then, the government has increased funding for colleges and sixth forms. It has also emphasised the role of technical education in the levelling-up agenda and as part of efforts to improve productivity. The sector now faces a range of significant challenges. First, the number of 16- and 17-year-olds is rising rapidly as a result of a population boom moving through the education system. Second, the impact of the pandemic remains significant, with changes in young people’s education decisions and the effects of lost learning. Third, just like everyone, colleges and sixth forms are facing rising costs as a result of rising levels of inflation. In this comment, we outline what is happening to student numbers and the challenges this creates for the sector. We also update our analysis of trends in spending per student and likely future trends in light of current economic forecasts.
Rising numbers of young people in full-time education
There has been a long-run rise in the number of young people in full-time education (see Figure 1). Since the mid 1980s, the proportion of 16- and 17-year-olds in full-time education has more than doubled from around 40% to 84%. This has been accompanied by a decline in the share of this age group in part-time education or training (which includes apprenticeships) and full-time employment.
Part-time education and employment seem to have fallen especially sharply due to the pandemic: full-time employment fell by 5% between 2019 and 2020 while part-time education or training fell by 12% in the same period. Although there has been a slight recovery in part-time education, full-time employment among 16- and 17-year-olds continues to decline. By the end of 2021, only 9% of 16- and 17-year-olds were in part-time education or training and 2% were in full-time employment, which is the lowest level ever recorded.
By the end of 2021, 5% of 16- and 17-year-olds (or around 65,000 young people) were not in education, employment or training (NEET), which represents an increase of almost 15,000 on the previous year. This means that the NEET rate among 16- and 17-year-olds is at its highest level since 2013. Whilst this is still well below the 7–8% seen for most of the 2000s, any increase in the NEET rate for young people is particularly worrying given the potentially detrimental long-run consequences of inactivity for young people.
Figure 1. Participation in education and employment of 16- and 17-year-olds in England
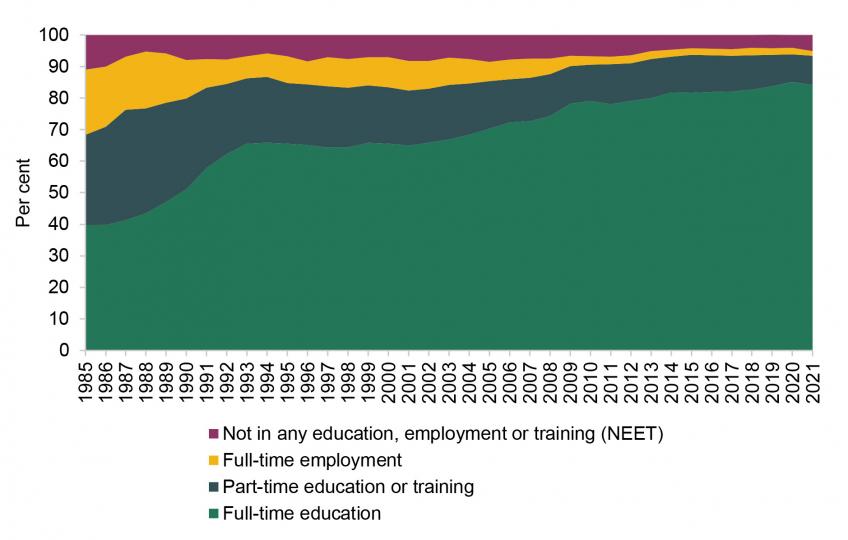
Source: Department for Education, ‘Participation in education, training and employment: 2021’ and ‘Participation in education, training and employment age 16 to 18’.
It is also important to understand the sort of qualifications young people study for (see Figure 2). The majority of young people who continue in education study A levels: 58% of all 16- and 17-year-olds study either solely A levels or a combination of A levels and other qualifications. Most of these students will be undertaking these A levels in school sixth forms or sixth-form colleges.
Under the 16 to 19 funding formula, most of these study programmes attract the national base rate of funding. Between 2013–14 and 2019–20, the national base rate was frozen at £4,000 in cash terms, which means that its real value was eroded by 9%. While it is difficult to make comparisons prior to 2013–14 since funding was calculated on a different basis, we know that policy was equivalent to a cash-terms freeze from 2010–11 to 2013–14. As a result, the real-terms value of funding for most study programmes is likely to have declined by a lot more than 9% over the last decade.
The base rate was increased to £4,188 in 2020–21 and then to £4,542 for 2022–23 (all figures in cash terms). This reflects a policy commitment to fund an extra 40 hours of teaching time for most full-time programmes and T levels, as well as expected inflationary pressures and consolidating the teachers’ pay grant into the main settlement (funding for the cost of higher employer pension contributions remains separate). (See government guidance.)
Although A levels are the most common qualification route, almost 20% of this age group study at least one Applied General Qualification (such as BTECs or Technical Certificates). These are mostly undertaken in further education colleges. In addition to the national base rate of funding, many of these technical qualifications receive extra funding for being more complicated or costly to deliver.
Earlier this year, the first cohort of T-level students – who began their courses in 2020 – received their grades, but only 0.4% of all 16- and 17-year-olds studied these qualifications in 2021 (the most recent year for which we have data). T levels receive funding ranging from £9,446 to £13,068 for a two-year programme of study, depending on the number of planned hours of teaching (see government guidance).
Over time, as more young people take T levels, the government intends to withdraw funding from other overlapping qualifications (such as BTECs). In October 2022, the government published the final list of qualifications that will have their funding withdrawn from August 2024, which amounts to just over 100 qualifications. This includes a range of qualifications, including BTECs and City and Guilds qualifications, in subject areas that overlap with T levels that have been rolled out.
Figure 2. Qualifications studied by 16- and 17-year-olds in England, 2021

Source: Department for Education, ‘Participation institution and qualification data’.
The school-age population rose rapidly over the 2010s. This population boom is now passing into sixth forms and colleges. Between 2019 and 2022, the number of 16- and 17-year-olds in England grew by 9% or an additional 110,000 young people. This age group is projected to continue growing during this decade (see Figure 3). The Office for National Statistics (ONS) projects that the total number of 16- and 17-year-olds in England will grow by a further 6½% or 90,000 between 2022 and 2024. This would make for a 17% rise between 2019 and 2024 – or an extra 200,000 young people. Given current levels of participation, this would equate to over 160,000 extra students. As a result, schools and colleges will have to manage their budgets to educate a far larger number of students.
Beyond 2024, the number of 16- and 17-year-olds is set to continue rising until it peaks at around 1.5 million towards the end of this decade. This includes a further 2% rise between 2024 and 2026. This will make it more difficult to deliver any cuts to spending on colleges and sixth forms between 2024–25 and 2026–27 (years beyond those covered by the 2021 Spending Review).
Figure 3. The projected number of 16- and 17-years-olds in England
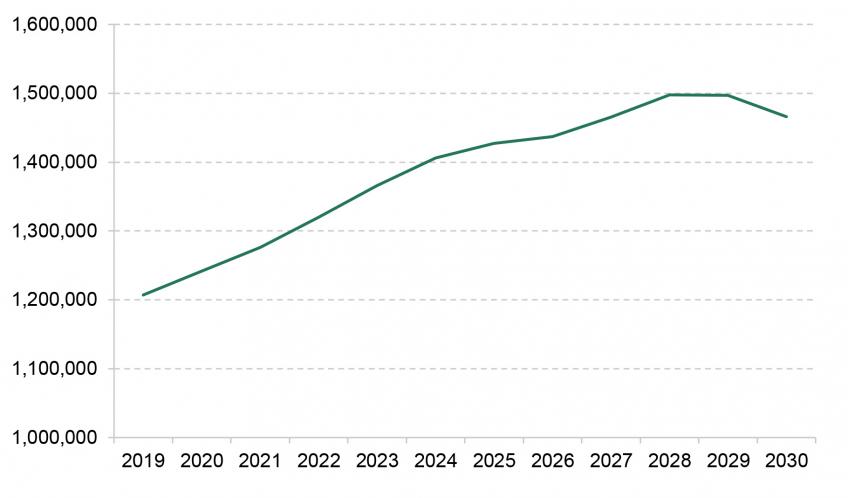
Source: Office for National Statistics, ‘National population projections by single year of age’.
How has spending per student changed over time?
Figure 4 illustrates spending per student aged 16–18 in school sixth forms, further education (FE) colleges and sixth-form colleges in each academic year from 2013–14 onwards. In this graph and the remaining analysis, we consider funding allocated per student aged 16–18, as opposed to actual amounts of spending on students, which could be higher or lower depending on how schools and colleges allocate funding for different stages of education.
Figure 4. Spending per student in further education colleges (16–18), sixth-form colleges and school sixth forms
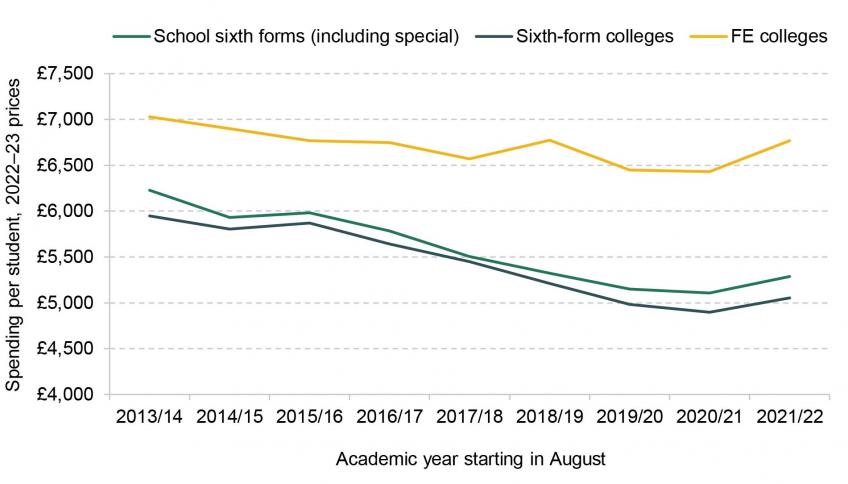
Note and source: See ‘16–18 spending: methods’ in https://ifs.org.uk/data-and-methods; HM Treasury GDP deflators, September 2022, https://www.gov.uk/government/statistics/gdp-deflators-at-market-prices-and-money-gdp-september-2022-quarterly-national-accounts.
In each year, spending per student aged 16–18 is noticeably higher in FE colleges. In the academic year 2021–22, FE colleges spent roughly £6,800 per pupil, compared with £5,300 in school sixth forms and £5,100 in sixth-form colleges. This is because students in FE colleges are more likely to study vocational qualifications and are more likely to come from deprived backgrounds, both of which attract higher levels of funding.
The pace of real-terms cuts between 2013–14 and 2019–20 was similar across school sixth forms and sixth-form colleges, with real-terms cuts of 16–17% since 2013–14. The cuts to FE colleges have been smaller at 8% between 2013–14 and 2019–20. This reflects the fact that FE colleges have gained more from new funding streams aimed at vocational qualifications.
The government has sought to reverse the decline in further education spending by allocating £2.3 billion in additional funding to colleges and sixth forms in 2024–25 compared with 2019–20. However, due to the rapid rise in student numbers, this additional spending only returns spending per student in 2021–22 back to 2018–19 levels, leaving in place much of the cuts in spending per student seen over the previous decade.
Whilst the figures show an apparent cut in spending per pupil in 2020–21, this is entirely driven by the volatility of the GDP deflator and inflation more generally during the pandemic. As a result, changes involving 2020–21 as a start or end year are unlikely to be reliable.
In Figure 5, we look at longer-term trends in spending per student and projected spending per student through to 2024–25 based on current spending plans and inflation forecasts. To do so, we must combine FE and sixth-form colleges, which we refer to as 16–18 colleges, and track spending by financial year instead of academic year.
Over the 2000s, spending per student in colleges increased from around £5,100 per student to reach £7,500 per student in 2010–11, a real-terms increase of nearly 50% or 4% per year. Spending per student in school sixth forms increased from £6,500 in 2002–03 (the earliest data point we have) to roughly £7,200 per student in 2010–11, a total increase of £700 or 11%. The faster growth amongst colleges meant that spending per student was higher in colleges than in school sixth forms in 2010–11, reversing the picture over much of the 2000s when spending per student was higher in school sixth forms. This was partly a deliberate policy choice to reduce the then gap in spending between colleges and school sixth forms.
Since 2010–11, there has been a decline in per-student spending across all types of institutions. Between 2010–11 and 2019–20, spending per student fell by 14% in colleges and 28% in school sixth forms. For colleges, this left spending per student at around the level it was in 2004–05, while spending per student in sixth forms was lower than at any point since at least 2002.
Figure 5. Spending per student in 16–18 colleges and school sixth forms
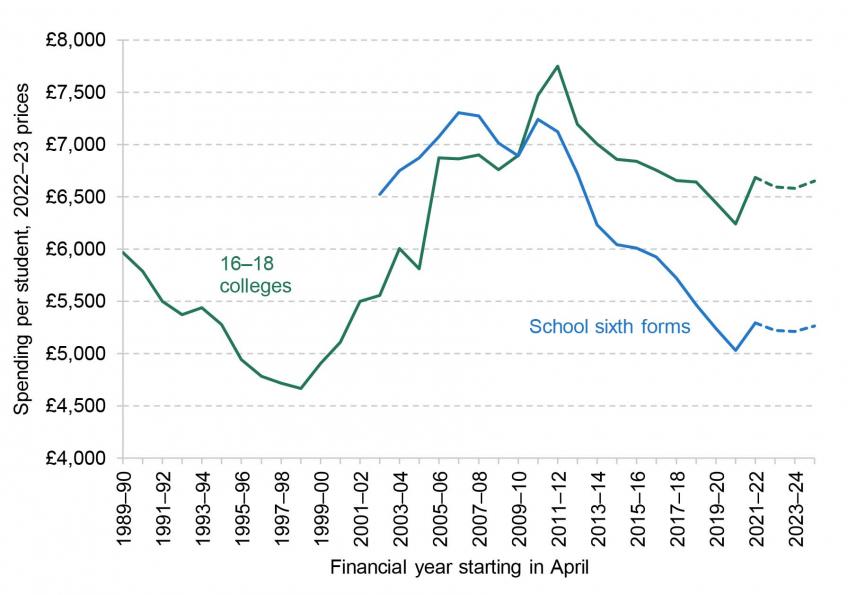
Note and source: See ‘16–18 spending: methods’ in https://ifs.org.uk/data-and-methods. HM Treasury GDP deflators, September2022, https://www.gov.uk/government/statistics/gdp-deflators-at-market-prices-and-money-gdp-september-2022-quarterly-national-accounts. Forecast GDP deflators are from Citi and are those underpinning the analysis in Chapters 3 and 4 of the IFS Green Budget October 2022; they are available upon request.
As mentioned above, the government has allocated a total of £2.3 billion in additional funding for 16–18 education in 2024–25 compared with 2019–20. While this represents a significant injection of additional funding over the next few years, the effect on per-student spending is dampened by rising student numbers and rising levels of inflation.
As a result of rising student numbers and cost pressures, funding per student aged 16–18 is set to plateau after 2021–22 at just over £6,500 in colleges and around £5,200 for school sixth forms. This means that spending per pupil will remain around the same level it was in 2018–19, which is well below the high point seen in the early 2010s. As a result, spending per student aged 16–18 in colleges in 2024–25 will remain about 11% lower in real terms than it was in 2010–11, and about 27% lower in school sixth forms.
Rising costs and resource challenges
These projections up to 2024–25 are based on forecasts for economy-wide inflation (as captured by the GDP deflator) of 6% for 2022–23, just under 5% for 2023–24 and 3% for 2024–25. The key question for determining the scale of resource challenges facing colleges and sixth forms is the extent to which they actually face these levels of inflation.
For school sixth forms, there are good reasons to believe that these figures represent a fair measure of the likely inflation schools will face in the coming years. In a recent report, we estimated that schools’ costs are likely to grow by 6% in 2022–23, reflecting a 5–6% increase in average teacher pay, likely increases in support staff pay of over 8%, and rising energy and food prices. We estimated that school costs are then likely to increase by a further 4% in 2023–24 and 3% in 2024–25.
The picture for colleges could be different as they are not covered by the large increases in teacher pay or support staff pay under the local government settlement. Indeed, the Association of Colleges has so far offered a headline salary rise of 2.5% for college staff in 2022–23, plus non-consolidated cost-of-living payments of £500–£750 for lower-paid staff. This has been rejected by the relevant trade unions. If this offer were delivered, then colleges would probably face a rate of inflation well below the 6% seen across the economy, on average.
There are, however, reasons to believe that the actual pay rise for college staff will need to end up higher than 2.5%. First, a tight labour market is likely to create intense competition for staff. College staff were already paid less than their counterparts in schools. Delivering a significantly lower pay award for college staff than that in schools could risk exacerbating recruitment and retention difficulties at a time when the workforce will need to expand to meet the growing student population. Second, the high level of inflation is likely to create significant pressure and expectations from college staff.
The main challenge is that colleges probably cannot afford that much more given the growth in funding per student. Precise funding allocations for 2022–23 are not yet published. However, the 2021 Spending Review settlement implies cash-terms growth in funding per student of about 4% in 2022–23. This will need to cover extra teaching hours and higher non-staff costs.
Future prospects
The future outlook for sixth forms and colleges will largely depend on the overall outlook for public spending. In his statement on 17 October, the new Chancellor, Jeremy Hunt, signalled a need for public spending cuts in order to meet the government’s medium-term fiscal goals. This could include cuts to previous departmental spending plans (which currently extend up to 2024–25), as well as cuts beyond 2024–25.
Cuts are likely to be extremely hard to deliver in colleges and sixth forms, which have already seen large cuts and where spending per student has still not returned to its 2010 levels. With higher levels of inflation and growth in student numbers, current plans imply a real-terms freeze in spending per student between now and 2024–25. Any reductions in spending plans would therefore imply a return to real-terms cuts in spending per student. Furthermore, a projected 2% rise in the student population between 2024 and 2026 will make it even more difficult to deliver falls in total spending after 2024.
This is also co-funded by the ESRC through the IAA, grant ref ES/T50192X/1
Authors

Luke Sibieta
Luke is a Research Fellow at the IFS and his general research interests include education policy, political economy and poverty and inequality.

Imran Tahir
Imran joined the IFS in 2019 and works in the Education and Skills sector.
More from IFS
Understand this issue


Policy analysis


Academic research


