
Downloads
Download the report PDF
PDF | 576.29 KB
Executive summary
For two decades, official statistics have substantially overstated the size of the UK’s self-employed population and the share of national income flowing to those with the highest incomes. That mismeasurement is the result of a longstanding error in the Survey of Personal Incomes (SPI) – a dataset derived from administrative tax returns and made publicly available by HM Revenue and Customs (HMRC). While rectified from 2018–19 onwards, earlier statistics remain uncorrected, leaving a gap in the statistical record.
We present new data that fill that gap. These data show not only that the self-employed population has been consistently overestimated by the SPI, but also that the global financial crisis of 2007–08 was a significant turning point, after which the growth in the UK’s self-employed population accelerated substantially. The new data also show that previously published statistics meaningfully overstate UK income inequality – our corrected data reduce the estimated share of income attributable to both the top 1% and top 0.1% over the affected period.
Key findings
- In 2018–19, HMRC made a major correction to the SPI methodology. The magnitude of this change was very large, reducing (for example) the measured size of the UK’s self-employed population by 11%.
- This report uses newly constructed data covering the period from 1996–97 to 2020–21 and capturing over 99% of all tax returns. Using these data, we describe how the number of self-employed people and the top income share have evolved.
- The new IFS series shows that the population of unincorporated self-employed (sole traders and partners) is, and has long been, smaller than described by official statistics. On average, between 2002–03 and 2017–18, the SPI overcounted the number of individuals making income from unincorporated self-employment by more than 500,000 a year.
- Underlying trends in self-employment are also substantially different from those recorded in the SPI. While the SPI records a steady, long-term increase in the self-employed population since 2000–01, the IFS series shows growth in self-employment to have been substantially slower prior to 2009–10, only accelerating after that point. This highlights an important question for future research: why did self-employment begin growing more rapidly after the financial crisis?
- The IFS series shows the SPI to have substantially overstated the population of incorporated business owners. This overestimate widened gradually between 2000–01 and the financial crisis, before stabilising at an excess of around 100,000. The true number of incorporated business owners was therefore smaller and grew more slowly than was recorded by the SPI between 2000–01 and 2017–18.
- The share of income attributable to those with the highest incomes is lower than previous measures suggest. In 2017–18, for example, the IFS series records the share of total taxable income flowing to the top 1% to be 12.6% (compared to 13.1% in the uncorrected HMRC data). In the same year, the share of income flowing to the top 0.1% is also reduced from 5.3% to 5.1%.
1. Introduction
How has the number of self-employed people in the UK changed over time? What share of taxable income flows to those with the highest incomes? These questions are commonly studied using the SPI, a dataset derived from administrative tax returns and made publicly available by HMRC. However, a recent methodological change by HMRC means that key statistics computed using these data must be reassessed. IFS researchers have compiled newly corrected data to re-establish several basic facts about the evolution of the UK labour market over the past two decades.
The SPI is an anonymised random sample of tax records produced annually by HMRC, providing relatively detailed information on individual-level taxable incomes.1 This represents a crucial source of information for understanding the changing landscape of individuals’ incomes in the UK. This is particularly true for certain groups, such as those with the very highest incomes and the self-employed, that are often poorly captured by survey-based methods of data collection. The SPI is not only widely used by scholars,2 but also forms the basis of much of the internal modelling and forecasting carried out by HMRC, the Treasury and the devolved administrations; as well as being the basis for numerous accredited official statistics.3
It was therefore a point of more than technical significance when the 2018–19 edition of the data was published with a major methodological revision. The revision (which we describe in detail in the Appendix to this report) corrected an error that had led to previous editions of the SPI substantially overestimating the population of taxpayers filing self-assessment (SA) tax returns. This is a group that encompasses the self-employed, those in receipt of certain capital incomes and the highest earners. The magnitude of the change was large. To take one example, the total measured self-employed population in 2018–19 fell by 11% (or over 600,000 taxpayers) due to the change.
Counting the number of tax returns received sounds easy – and would be if HMRC received all returns before the SPI needed to be produced. In practice, the process is complicated because the SPI is compiled before all SA tax returns have been received. HMRC therefore has to estimate how many returns (and from what types of people) they still expect to get. Prior to 2018–19, this was done in a way that led to a significant overestimate of the number of SA returns. HMRC have now corrected this error in a sensible manner. The result is that – from 2018–19 onwards – published data now offer a far better reflection of reality than those published under the prior methodology. It remains the case, however, that 2018–19 now represents a major break point in the SPI data; with data before that date having been produced using the previous (erroneous) method. The result is a serious gap in our understanding of some of the most important macro-economic trends in the UK labour market and income distribution. Simply put, we cannot use the SPI to understand what happened between 1996–97 (when SA tax returns – and the accompanying methodological error in accounting for those return – were first introduced) and 2018–19.
The object of this report is to shed light on the key labour market trends over this period. The source of the error affecting the SPI prior to 2018–19 was an overestimate of the number of individuals expected to file an SA tax return substantially later than the official 31 January deadline.4 We therefore construct a set of consistent data series by using, for the first time, datasets containing the full population of SA tax filers, meaning that no estimate of the number of late filers is required. This allows us to fill the current gap in the statistical record.5
We focus on two subsets of the population that are of particular interest to researchers and policymakers: the self-employed and those with the highest incomes. Both of these are groups that are required to file SA tax returns, meaning that statistics relating to them are likely to have been affected by the flawed pre-2018–19 SPI methodology. In Section 2, we examine how our understanding of the evolution of various forms of self-employment changes once the corrected methodology is projected backward to earlier years. In Section 3, we carry out a similar exercise for those with the highest incomes, paying particular attention to the top 1% and top 0.1% of adults.
2. Self-employment
One of the most notable trends in the UK labour market over the course of the last 25 years has been the rising prevalence of self-employed work. Survey data suggest that, since the turn of the millennium, the number of self-employed people in the UK has undergone a steady increase from around 3.25 million individuals in 2000 to around 5 million in 2020 (Office for National Statistics, 2018; Cribb, Miller and Pope, 2019; Giupponi and Xu, 2020). Prior to HMRC’s 2018–19 revision of the SPI, these trends were broadly echoed by data derived from tax returns, with the number of individuals reporting income from self-employment increasing from around 3.8 million in 2000–01 to 5.2 million in 2017–18 (we return to the differences between survey- and tax-based measures of self-employment below) – an increase of over 35%. This substantial growth in the number of self-employed far outstrips the change in the number of employees over the same period, which grew by only 13% (Office for National Statistics, 2025).
Our newly corrected series, however, paints a contrasting picture. Figure 1 compares the number of individuals receiving income from unincorporated self-employment (i.e. profits derived from sole trading or a partnership) in the SPI6 and in the (corrected) IFS series. First, the IFS series demonstrates that published statistics derived from the SPI have, for decades, been substantially overestimating the size of the self-employed population. On average, between 2002–03 and 2017–18, the SPI overcounted the number of individuals making income from unincorporated self-employment by more than 500,000 a year (equating to an average overestimate of 14%). This discrepancy between previously published data and the IFS series has also grown over time. This means that the SPI provides a misleading picture not only of the historic level of self-employment in the UK labour market, but also of its trend.
The SPI, as set out in Figure 1, records a broadly linear increase in the self-employed population between 2000–01 and 2017–18 (the year prior to HMRC’s methodological revision) – with a brief interruption in the aftermath of the financial crisis. The trend in the IFS series is different. Instead of a steady increase in the self-employed population after 2000–01, the IFS series records a far more gradual increase in the years prior to the financial crisis. Indeed, while the self-employed population increased by almost 600,000 between 2002–03 and 2008–09 in the SPI, the comparable figure in the corrected IFS series is just 200,000. Not until 2010–11 does the IFS series begin recording growth in the self-employed population at a rate comparable to that in the SPI.
The new data shown in Figure 1 therefore suggest not only that the self-employed population is, and has long been, smaller than described by official statistics, but that the entire narrative regarding recent growth of self-employment in the UK may need to be recast. Rather than pointing to a steady, long-term increase in the self-employed population, the IFS series suggests that an inflection point occurred in the years following the financial crisis. This opens up an important new question for future research: why did self-employment begin growing more rapidly in those years?
Figure 1. Total number of unincorporated self-employed
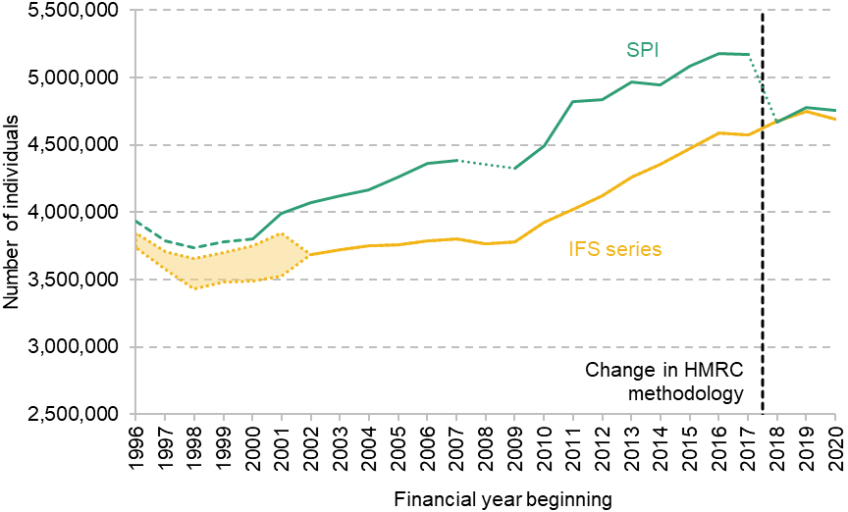
Note: This figure shows the total number of individuals recording positive profits from either sole trading or a partnership. No SPI data are available for the 2008–09 financial year or prior to 2000–01. Prior to 2000–01, the dashed green line augments the July extract of SA tax returns (with grossing factors applied) by the average ratio between that series and the SPI between 2000–01 and 2004–05. Prior to 2002–03, only upper and lower bounds (see the Appendix for details) can be provided for the IFS series. The values encompassed by these bounds are shown by the shaded yellow region. From 2017–18 onwards, the trading allowance provides that those with self-employment income of less than £1,000 need not file an SA tax return. As a result, tax data will not comprehensively capture those with small amounts of self-employment income.
Source: Authors’ analysis of HMRC administrative data.
In addition to the substantial growth in the self-employed population described in Figure 1, recent decades have also seen rapid growth in the number of individuals who own and manage their own incorporated businesses (see Cribb, Miller and Pope, 2019). Figure 2 compares the growth in the population of these ‘company owner–managers’ in the SPI and the corrected IFS series.7 As with the unincorporated self-employed, the IFS series reveals that official statistics have been erroneously inflating the size of the company owner–manager population. This overestimate widened gradually between 2000–01 and the financial crisis, before stabilising at an excess of around 100,000. Unlike the unincorporated self-employed (growth in which the SPI overstates prior to the financial crisis), the growth in the number of company owner–managers prior to 2008 is robust to the IFS correction (albeit at a somewhat lower rate).
Figure 2. Total number of incorporated owner–managers

Note: This figure shows the total number of individuals flagged as being the director of a closely held company. No SPI data are available for the 2008–09 financial year or prior to 2000–01. Prior to 2000–01, the dashed line augments the July extract of SA tax returns (with grossing factors applied) by the average ratio between this series and the SPI between 2000–01 and 2004–05. Prior to 2002–03, only upper and lower bounds (see the Appendix for details) can be provided for the IFS series. The values encompassed by these bounds are shown by the shaded yellow region.
Source: Authors’ analysis of HMRC administrative data.
How do these trends compare to survey data?
One question raised by these newly corrected series is how the tax data compare with evidence drawn from surveys. Figure 3 compares the tax-derived data series with the most widely used survey-based measure of self-employment drawn from the Office for National Statistics’ Labour Force Survey (LFS). The main LFS measure of self-employment is intended to encompass both the unincorporated self-employed and owner–managers of incorporated businesses. We therefore compare the LFS with tax-derived series that include both of these groups (effectively encompassing anyone who would be classified as self-employed in either Figure 1 or Figure 2).
The first point of difference between the LFS series and the two tax-derived series is that the level of self-employment recorded in the LFS is considerably lower in all years – even when compared with the IFS series. This is largely explained by the fact that the LFS measure of self-employment is based on whether an individual reports their ‘main job’ as being self-employed, while the tax-based measures shown in Figure 3 include all individuals with self-employment income (whether or not self-employment is their main job).
More meaningful than a comparison of levels, therefore, is a comparison of trends. Notably, the trend in self-employment seen in the LFS data is very similar to that seen in the IFS series – with slower growth in the years leading up to the financial crisis, followed by an acceleration thereafter. This differs from the uncorrected SPI, which records a relatively constant growth rate in self-employment (with the exception of a dip in the aftermath of the financial crisis) over the first two decades of the twenty-first century.
Strikingly, the LFS also records a precipitous fall in the self-employed population between 2019–20 and 2021–22, from just under 5.0 million to just over 4.2 million. Tax-derived measures of self-employment are available only with a considerable lag (owing partly to the fact that self-employed tax returns need only be submitted ten months after the end of the financial year to which they pertain). Nevertheless, tax-derived data are available for both 2020–21 and 2021–22, and in neither year do these data record a significant decline in self-employment.8 The fact that the large falls in self-employment seen in the LFS are not corroborated by the evidence of tax returns may lend credence to the hypothesis advanced by the Office for National Statistics (Leaker, 2021) that the fall in self-employment seen in the LFS reflects changing perceptions of what constitutes self-employment as a result of interaction with self-employed income support schemes during the COVID-19 pandemic.9
Figure 3. Total number of incorporated and unincorporated self-employed
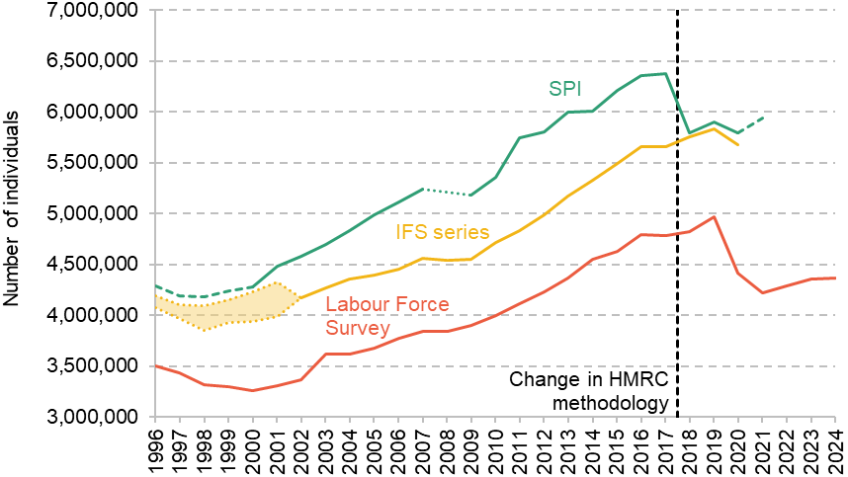
Note: The SPI and the IFS series show the total number of individuals either flagged as being the director of a closely held company or with positive profits from unincorporated self-employment. No SPI data are available for the 2008–09 financial year or prior to 2000–01. Prior to 2000–01, the dashed line augments the July extract of SA tax returns (with grossing factors applied) by the average ratio between this series and the SPI between 2000–01 and 2004–05. Prior to 2002–03, only upper and lower bounds (see the Appendix for details) can be provided for the IFS series. The values encompassed by these bounds are shown by the shaded yellow region. See note to Figure 1. SPI figures for 2021–22 (marked with a dashed line) are taken from the SPI Public Use Tape.
Source: HMRC administrative data; Office for National Statistics (https://www.ons.gov.uk/employmentandlabourmarket/peopleinwork/employmentandemployeetypes/timeseries/mgrq/lms).
3. Top incomes
The share of income flowing to the top 1% is a metric that has attracted considerable academic and policy interest. Survey data struggle to properly measure those with the very highest incomes, so top income shares are typically calculated using data derived from administrative tax returns; see, for example, Piketty and Saez (2003) and Atkinson (2005). In this section, we set out how the level and trend of top income shares change when calculated using the IFS series.
Figure 4 shows the share of income flowing to the top 1% of UK adults in both the SPI data and our corrected series. From at least 2005–06 onwards, the SPI overstates the top 1% share by around 0.5 percentage points. In 2017–18, for example, our correction reduces the top 1% share from 13.1% to 12.6%. While this may sound modest, it represents an overstatement of the aggregate income of the top 1% by roughly £9 billion per year, in today’s terms.
Figure 4. Top 1% income share

Note: This figure shows the total income of the top 1% of adults (those aged 16 and older). Definition of income excludes pension contributions but includes pension withdrawals. The denominator is calculated from the UK National Accounts in line with the methodology set out in Advani, Summers and Tarrant (2023).
Source: HMRC administrative data; UK National Accounts (Blue Book) 2024 (https://www.ons.gov.uk/economy/grossdomesticproductgdp/compendium/unitedkingdomnationalaccountsthebluebook/2024); Office for National Statistics, Nomis, Population estimates – local authority based by single year of age (https://www.nomisweb.co.uk/datasets/pestsyoala).
Figure 5 repeats the exercise above for the top 0.1% of adults. Again, the SPI consistently overstates the share of income flowing to this group (other than in 2009–10 when it slightly underestimated the true share) from 2007–08 onwards. However, the change is less dramatic than for the top 1% with the uncorrected data overstating the top 0.1% share by only 0.1 percentage points on average between 2007–08 and 2017–18.
Figure 5. Total income share of the top 0.1%

Note: This figure shows the total income of the top 0.1% of adults (those aged 16 and older). Definition of income excludes pension contributions but includes pension withdrawals. The denominator is calculated from the UK National Accounts in line with the methodology set out in Advani, Summers and Tarrant (2023).
Source: HMRC administrative data; UK National Accounts (Blue Book) 2024 (https://www.ons.gov.uk/economy/grossdomesticproductgdp/compendium/unitedkingdomnationalaccountsthebluebook/2024); Office for National Statistics, Nomis, Population estimates – local authority based by single year of age (https://www.nomisweb.co.uk/datasets/pestsyoala).
Appendix
In this appendix, we provide a detailed summary of the nature of the revision made to the HMRC’s SA-derived data series from 2018–19 onwards, and the steps taken in this report to calculate a consistent set of time series.
HMRC's change of methodology
The collection of income tax is operationalised by HMRC through the use of two distinct computer systems. The first, and largest, is the National Insurance and PAYE Service (NPS) system, which covers all employees and occupational pension recipients with a Pay As You Earn (PAYE) record. The second is the Computerised Environment for Self-Assessment (CESA), which is used to process the SA tax returns of those with incomes from sources other than employment and private pensions (such as dividends, rental income and profits from unincorporated self-employment) as well as individuals with high incomes10 or particularly complex tax affairs.
To bring together these separate sources of data on the UK’s population of income tax and National Insurance payers, HMRC undertakes each year to produce a unified dataset called the Survey of Personal Incomes (SPI). The SPI is an anonymised dataset constructed using random samples drawn from each of the operational computer systems outlined above with varying sampling rates based on the taxpayer characteristics.11 The SPI is widely used across government and underpins not only many of the modelling and forecasting exercises of the HMRC and Treasury but also feeds into official published statistics such as the National Accounts.12
In constructing the SPI, HMRC samples from the population of SA returns in the April following the end of the tax year to which they pertain (SA returns for the 2023–24 tax year, for instance, were sampled from in April 2025). For each tax return included in the SPI sample, HMRC creates a ‘grossing factor’ (i.e. a weight) allowing users of the dataset to gross up the random sample to match population totals. These grossing factors are composed of four components:
- Sampling rate. This captures the rate at which returns within a given stratum were sampled.13 For example, if the sampling rate for returns with a given set of characteristics was 10%, the sampling rate grossing factor would be set to 10.
- ‘Invalid views’ cases. In cases where incomplete taxpayer information is held by HMRC (known as invalid views cases), returns are stored separately to the sampled population. Most commonly, invalid views cases are those where no valid postcode has been provided by the taxpayer. However, this category also encompasses the small number of cases where it was not possible for HMRC to capture the full tax return. For these cases, data are held only on the tax liability of the individual and not on individual components of income. In order to account for the fact that invalid views cases are not sampled, an adjustment is made to the SPI grossing factors. For example, if the inclusion of invalid views returns, within a given stratum, would have increased the population from which the sample was drawn by 1%, then the invalid views grossing factor would be set to 1.01 to that stratum.
- ‘Out of data’ returns. In addition to the invalid views cases, a small number of SA returns are held outside of the sampled population for reasons other than the lack of a valid postcode; for example, because they are deemed to be especially sensitive by HMRC. There are typically very few such returns.14 In order to account for their absence, HMRC applies a uniform grossing factor across all sampled strata.
- Late filers. While the deadline for taxpayers to submit SA returns is 31 January following the end of the tax year (i.e. several months prior to when the SPI sampling takes place) to which they pertain, it is nevertheless the case that some taxpayers will file their returns after the date when the SPI sampling takes place. In recognition of this, HMRC accompanies its sampling of SA returns with an estimate of the number of late filers who will eventually submit a return.
The revision made to HMRC’s calculation of grossing factors revolves around the fourth of these adjustments. Prior to 2018–19, the adjustment for late filers was made under the assumption that the total number of returns that would ultimately be received would be equal to the number of returns received by the sampling date plus the total number of issued SA tax returns not yet received by that date. This adjustment was then applied as a uniform grossing factor to all records. For example, suppose that on the date when the sampling was undertaken, 10,000,000 individuals had filed SA returns and a further 500,000 individuals had been issued with a notice to file by HMRC but had not yet submitted a return. In this case, a grossing factor of 1.0515 would have been applied to all sampled returns.
In May 2018, the Scottish Fiscal Commission reported that there was a significant discrepancy between its forecast of 2016–17 income tax liabilities and the outturn tax receipts reported by HMRC.16 This finding ultimately prompted HMRC to investigate the assumptions underpinning the adjustment for late filers described above. By looking at historical data, HMRC concluded that the assumption that all those issued with a notice to file an SA tax return would ultimately do so was incorrect, leading to a significant overestimate of the true population of SA taxpayers. Indeed, HMRC found that, in recent years, fewer than half of those issued with a notice to file, who had not submitted a return by the time the SPI sampling was undertaken, ultimately filed a return.17
From the 2018–19 edition of the dataset onwards, therefore, the SPI was constructed using a revised methodology for accounting for late filers. This involved two improvements to the approach outlined above:
- The grossing factor now incorporates an empirical estimate (based on past years) of the share of returns that will be filed late.
- Rather than being applied uniformly to all SA returns, the grossing factor is calculated on a stratified basis (with strata defined based on income level and income source). This allows for differential late-filing propensities across different groups.
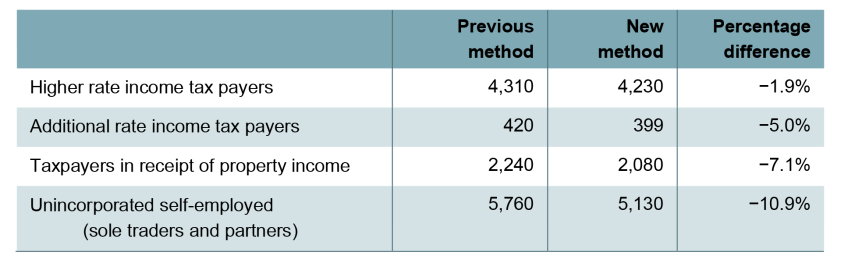
The combined impact of these changes is substantial. Table A1 sets out the change in aggregate taxpayer numbers in the 2018–19 edition of the SPI under both the old and new methodologies.
Table A1. Number of individuals (thousands) under old and new late-filing methodologies, 2018–19 SPI
Source: HMRC, Personal Incomes Statistics 2018 to 2019 Supporting documentation, p.11 (https://assets.publishing.service.gov.uk/media/6062e594e90e072d9b2287fb/SPI_National_Statistics_Supporting_Documentation_201819.pdf).
Construction of consistent time series
To construct the set of consistent time series (i.e. the IFS series) set out in this report, we draw on the SA taxpayer calculation tables. These tables (accessed within the HMRC’s secure Datalab) contain anonymised individual-level tax records for all SA taxpayers. While very similar to the tables from which the SPI is sampled, these tables contain the full set of tax returns received by HMRC as of the summer of 2024, meaning that no adjustment need be made to account for late filers. Furthermore, the tables include the records of all tax filers, regardless of whether a valid postcode was available for them or not, meaning that no adjustment is required to adjust for invalid views cases excluded on the basis of incomplete taxpayer address information (see above).
These tables represent the most comprehensive data currently available on the population of SA tax filers. The only returns not included in these tables are: (i) those that are held outside of the main data because they are deemed to be particularly sensitive; and (ii) invalid views cases (see above) for which HMRC was unable to capture the full return. There are typically only a very small number of these returns, and therefore we do not expect their absence to have a substantial impact on accuracy. To our knowledge, this is the first time that the full SA taxpayer calculation tables have been used by researchers outside of HMRC.
The full SA taxpayer calculation tables are available for analysis only from 2002–03 onwards. Prior to this, we make use of a sample SA tax returns extracted in early July of the year of the SA filing deadline18 to construct upper and lower bounds, between which we can be confident that the true number of taxpayers will fall. This extract represents a more complete sample than the data from which the SPI is sampled (the SPI extract is taken in early April of the same year, meaning that our data contain any additional returns received in the three intervening months). Nevertheless, returns received after the July extract date will still be excluded from the data.
The lower bound is calculated using this (unweighted) July extract of tax returns (as we know that the final tax filing population will be at least this large). The upper bound, meanwhile, is calculated using the contemporary grossing factors supplied by HMRC. As described above, these grossing factors contain the implicit assumption that all issued returns will ultimately be filed, which severely overestimates the final number of returns received. We can therefore assume with a high degree of confidence that the true tax filing population will fall below what these figures suggest it to be.19
References
Advani, A., Summers, A. and Tarrant, H., 2023. Measuring top income shares in the UK. Journal of the Royal Statistics Society: Series A, 186, 241–58, https://doi.org/10.1093/jrsssa/qnac008.
Atkinson, A., 2005. Top incomes in the UK over the 20th century. Journal of the Royal Statistics Society: Series A, 168, 325–43, https://academic.oup.com/jrsssa/article/168/2/325/7084311.
Corlett, A. and Slaughter, H., 2024. Measuring up? Exploring data discrepancies in the Labour Force Survey. Resolution Foundation Spotlight, https://www.resolutionfoundation.org/app/uploads/2024/08/Measuring-up.pdf.
Cribb, J., Miller, H. and Pope, T., 2019. Who are business owners and what are they doing? IFS Report. https://ifs.org.uk/publications/who-are-business-owners-and-what-are-they-doing.
Delestre, I., Kopczuk, W., Miller, H. and Smith, K., 2024. Top income inequality and tax policy. Oxford Open Economics, 3 (Suppl_1), 1086–112, https://academic.oup.com/ooec/article/3/Supplement_1/i1086/7708125.
Giupponi, G. and Xu, X., 2020. What does the rise of self-employment tell us about the UK labour market? IFS Report, https://ifs.org.uk/publications/what-does-rise-self-employment-tell-us-about-uk-labour-market.
HM Revenue and Customs, 2018. Agent Update: Issue 69, HMRC Agent Update series, https://tinyurl.com/musx386e.
HM Revenue and Customs, 2024. Survey of Personal Incomes Public Use Tape, 2021–2022. [data collection]. UK Data Service. SN: 9309, http://doi.org/10.5255/UKDA-SN-9309-1.
Leaker, D., 2021. Painting the full picture: what our statistics tell us about the labour market. Office for National Statistics blog, https://blog.ons.gov.uk/2021/01/29/painting-the-full-picture-what-our-statistics-tell-us-about-the-labour-market/.
Office for National Statistics, 2018. Trends in self-employment in the UK, https://www.ons.gov.uk/employmentandlabourmarket/peopleinwork/employmentandemployeetypes/articles/trendsinselfemploymentintheuk/2018-02-07.
Office for National Statistics, 2025. A01: summary of labour market statistics, https://www.ons.gov.uk/employmentandlabourmarket/peopleinwork/employmentandemployeetypes/datasets/summaryoflabourmarketstatistics.
Piketty, T. and Saez, E., 2003. Income inequality in the United States, 1913–1998. Quarterly Journal of Economics, 118, 1–41, https://academic.oup.com/qje/article-abstract/118/1/1/1917000.
Scottish Fiscal Commission, 2018. Scotland’s Economic and Fiscal Forecasts – May 2018, https://fiscalcommission.scot/publications/scotlands-economic-and-fiscal-forecasts-may-2018/.
Endnotes
Authors

Isaac Delestre
Isaac is a Senior Research Economist in the Taxation sector, focusing on the taxation of high-income individuals and closely-held corporate entities.

Bo Jacobs-Strom

Helen Miller
Helen joined the IFS in 2007. She has almost two decades of experience analysing UK fiscal policy and providing trusted advice to policymakers.

Kate Smith
Kate is an IFS Research Fellow and an Assistant Professor at LSE, interested in public finance, industrial organisation and applied microeconomics.
More from IFS
Understand this issue


Policy analysis


Academic research


