
Downloads
Executive Summary
In recent years, some of the most talked-about trends in the UK labour market have concerned the growth of ‘non-standard’ or ‘alternative’ forms of work. These have been central to concerns over inequalities stemming from the world of work – either because they are seen as symptoms of a situation in which good opportunities in traditional employment are no longer available for all, or because the newer forms of employment are themselves seen as helping to drive new inequalities by undermining workers’ protections or conditions.
In this briefing note, we focus on a relatively easily quantifiable form of ‘alternative’ working arrangement: namely, ‘solo self-employment’ – sole traders or company owner-managers without employees. In recent years, this category accounts for a very large amount of the growth in non-traditional employment forms, and indeed a large amount of the growth in overall employment. It encompasses a variety of non-standard arrangements, such as independent contractors and ‘gig-economy’ workers. Growing concerns about the employment conditions, job security and career prospects of the solo self-employed have made this group highly salient in the policy debate. The self-employed have also been particularly hard hit by the current COVID-19 crisis.
We uncover a number of facts that help us understand the relationship between solo self employment and inequalities. There is great diversity within the group of solo self-employed, and the occupations in which solo self-employment has been increasing include professional jobs as well as those typically found towards the bottom end of the pay scale. But overall this growing group are much more likely to have low earnings than employees. Crucially, there are several pieces of evidence that some of the group are solo self-employed because they cannot find suitable opportunities in traditional employment. They are more likely than employees to want to work more hours than they currently are working, and to have recently been unemployed or inactive – a gap that has opened up only since the turn of the century. And areas with more growth in solo self-employment tend to see less growth in employee wages. To some extent, then, it seems that solo self-employment – and the weaker employment protections that typically exist within it – is something that people have found themselves having to settle for in the absence of better alternatives.
Key findings
1. ‘Solo’ self-employment (that is, sole traders or company owner-managers with no employees) has risen dramatically in the UK since the 1970s. In 1975, 8% of workers were self-employed; by 2019, this had increased to more than 14%. This rise has been entirely driven by ‘solo self-employment’, i.e. own-account workers without employees. Solo self-employment accounts for over a third of all employment growth since the onset of the financial crisis. The level and growth of solo self-employment in the UK are among the highest in OECD countries.
2. The solo self-employed earn less than employees on average and the gap has widened over time. Median pre-tax earnings among the solo self-employed in 2018–19 were 30% lower than those among employees. Over half of the solo self-employed earned less than £300 a week, compared with just a third of employees, though the shares with very high earnings are similar, owing to more polarised earnings among the self-employed. Their median real earnings have dropped significantly since the onset of the financial crisis, and in 2018–19 were still 13% below their pre-crisis level. By comparison, employee earnings had recovered their pre- financial-crisis level by 2016–17.
3. The recent rise in solo self-employment has taken place across the wage distribution. The increase in solo self-employment has not been confined to low-paid jobs. Its prevalence increased among high-paid occupations such as managers and IT professionals as well as among hairdressers, cleaners and drivers, reflecting a shift in the contractual nature of work across a wide range of occupations. The share of workers who are solo self-employed has increased relatively evenly across the wage distribution.
4. Many enter solo self-employment from unemployment or inactivity. Nearly a quarter (23%) of new solo self-employed workers were unemployed in the previous quarter, and a further 31% were inactive. The recent rise in solo self-employment has not been driven by flows from unemployment – not surprising given that, until COVID-19, unemployment had been at historical lows. But relative to employees, the solo self-employed do appear to be an increasingly marginalised group: they were no more likely to have been recently unemployed or inactive than employees in 2000, but by 2019 they were 45% more likely to have been. Moreover, consistent with solo self-employment being a fall-back option, the share of solo self-employed workers who were recently out of work increased sharply around the Great Recession.
5. Many solo self-employed workers are underemployed. The solo self-employed work fewer hours than employees and the self-employed with employees. They have had the highest level of underemployment throughout the past 20 years, with more than 15% wanting to work longer hours at the peak of the recession and close to 12% in 2019. Again, the gap between the solo self-employed and employees has widened over time. Whilst rates of underemployment were roughly the same across employees and the solo self-employed in 2000, by 2019 the solo self-employed were 28% more likely to want longer hours. This suggests that the solo self-employed are increasingly those with poor alternative options.
6. A higher prevalence of solo self-employment is associated with downward pressure on employee wages – further evidence that it is, in part, a symptom of a lack of opportunity in the traditional employee–employer labour market. When looking both across countries and across parts of the UK, areas that experience increases in solo self-employment tend to also experience slower growth in employee wages. This suggests that some of the solo self-employed play a similar role to the unemployed, in providing a ‘reserve army’ of potential employees which reduces the bargaining power of existing employees, and hence restrains wage growth. This in turn suggests that some of the solo self-employed would opt for traditional employment if they could secure the opportunity: for them, self-employment is a fall-back option rather than a preference. Notably, this seems to be true for some professionals as well as those in lower-paid occupations.
6. However, well-being is higher among the solo self-employed. Prior to the pandemic, the solo self-employed had higher levels of job satisfaction, were more likely to report being happy and to consider their lives worthwhile, and reported lower levels of anxiety than employees. There may be non-pecuniary benefits that compensate for lower earnings, even for those who only became self-employed as a result of poor labour market opportunities. That said, the well-being of the self-employed as measured in relatively stable economic times may not fully account for the additional risks and insecurities that some of them face, which can come home to roost during more turbulent times such as the current crisis.
Solo self-employment has risen over the last 20 years
Self-employment in the UK has risen dramatically since the 1970s. In 1975, one in twelve workers was self-employed; by 2019, this had increased to one in seven workers (Figure 1). Following a brief inversion of the trend in the late 1990s, self-employment has been rising steadily since 2000.
This rise has been entirely driven by a rise in ‘solo self-employment’ – own-account workers without employees – who now account for one in eight workers. The vast majority (85% in 2019) of the solo self-employed are sole traders – unincorporated businesses with a single owner and no employees – though the prevalence of those who run their businesses as limited liability companies (owner-managers) has increased over time. The share of self-employed workers with employees has been declining since the late 1980s. This has resulted in a profound shift in the nature of self-employment: nearly half (44%) of the self-employed had employees in 1975, compared with just 15% in 2019. By the end of 2019, there were nearly 4 million solo self-employed workers in the UK, up from 2.3 million in 2000.
Table A1 in the appendix shows that solo self-employment exists across all demographic groups, though it is more common among older workers, men and those living in London and the South. The prevalence of and growth in solo self-employment have been relatively similar across ethnic groups, education levels and regions outside the South of England. Table A1 also shows that solo self-employment has increased across nearly all industries and occupations – a point we explore in more detail below.
Figure 1. Self-employment as a share of all workers, 1975 to Q4 2019

Note: Workers aged 16–64 only. Self-employed includes sole traders and company owner-managers. Excludes Q1 1994 which is missing information on solo self-employment.
Source: Labour Force Survey, 1975 to Q4 2019.
Figure 2. Change in employment since Q1 2008, Q2 2008 to Q4 2019

Note: Workers aged 16–64 only. Self-employed includes sole traders and company owner-managers.
Source: Labour Force Survey, Q1 2008 to Q4 2019.
Figure 3. Solo self-employment as a share of all workers, 2000 and 2019

Note: Workers aged 15–64 only (16–64 in the US). The figures for European countries exclude owner-managers. The figures for Canada include both unincorporated and incorporated own-account workers.
Source: Data for European countries are taken from Eurostat, employment by sex, age and professional status. Data for Canada and the US are taken from (i) OECD, self-employed without employees (indicator), doi: 10.1787/5d5d0d63-en (accessed on 14 September 2020) and (ii) OECD, employment rate (indicator), doi: 10.1787/1de68a9b-en (accessed on 14 September 2020).
Growth in solo self-employment accounts for over a third (38%) of all employment growth since the onset of the financial crisis (Figure 2). Notably, sole traders were the only employment group that experienced positive growth during the Great Recession. The number of solo self-employed owner-managers has also grown since 2013, accounting for 12% of total employment growth since 2008 despite only making up 2% of all workers in 2019.
The growth in solo self-employment in the UK has also been remarkable by international standards. The majority of other OECD countries have experienced little change or a reduction in the share of workers in solo self-employment since 2000, with the exception of Italy, the Netherlands, France and Luxembourg (Figure 3). As of 2019, the UK had the second-highest level of solo self-employment as a percentage of total employment, with only Italy higher (at 15%). The UK experienced one of the largest rises in solo self-employment over this period both in percentage terms (52%) and in terms of the percentage point increase (4 percentage points) since 2000, second only to the Netherlands.
The solo self-employed earn less than employees and the gap has widened over time
Median pre-tax earnings were £276 a week among the solo self-employed in 2018–19, compared with £395 a week among employees. This average figure masks substantial variation in earnings. Figure 4 shows the distribution of total reported weekly earnings among employees, sole traders and solo self-employed owner-managers in 2018–19. Over half (55%) of sole traders earn less than £300 a week, compared with a third (33%) of employees. The earnings of owner-managers without employees are more polarised: 50% earn less than £300 a week, but 11% have very high earnings of over £1,200 a week, compared with just 5% of employees and 3% of sole traders. Further, owner-managers are incentivised by the tax system to retain income within their companies (and are shown to do so; see Cribb, Miller and Pope (2019)), so their true earnings will be higher than the earnings they draw down.
It is worth noting that these figures are also likely to underestimate actual self-employment income due to under-reporting. Because of the lack of third-party reporting of their incomes, the self-employed have more opportunities to engage in avoidance or evasion than employees. There is extensive evidence of under-reporting of self-employment incomes in both administrative and survey data, using random audits of tax forms (Advani, 2017) as well as methods that compare consumption and incomes (Engström and Hagen, 2017; Hurst, Li and Pugsley, 2014).1 A recent study using UK data estimates that sole trader incomes are underestimated by 10–13% (Cribb and Xu, 2020) – if so, this would narrow (but far from close) the gap between employee and solo self-employed incomes.
Figure 4. Distribution of weekly earnings, 2018–19
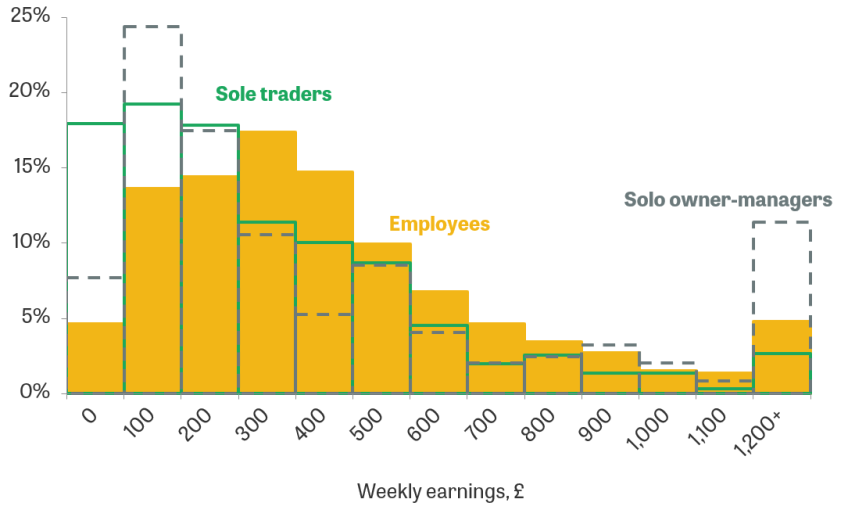
Note: Workers aged 16–64 only. Earnings in £100 bands, e.g. 100 refers to earnings between £100 and £200. Only includes earnings and employment status in main job. Directors of limited liability companies are normally treated as employees in the Family Resources Survey. Solo self-employed owner-managers are identified as either (i) self-employed workers who report being directors of their own companies with no other employees or (ii) employees in companies in which the respondent is the sole employee in the entire organisation. Directors of larger companies are classified as employees.
Source: Family Resources Survey, 2018–19.
Figure 5. Median real weekly earnings relative to 2007–08, 2007–08 to 2018–19

Note: Workers aged 16–64 only. Deflated using the Consumer Prices Index (CPI).
Source: Family Resources Survey, 2007–08 to 2018–19.
The gap in earnings between sole traders and employees has widened over the last decade.2 Figure 5 shows that the median real weekly earnings of sole traders have dropped significantly since the onset of the financial crisis, mainly due to a reduction in hours worked. Compared with their 2007–08 level, they were almost 25% lower in 2012–13 and still 13% below their pre-crisis level in 2018–19. By comparison, employees’ earnings have displayed a milder drop (less than 10% by 2012–13) and had rebounded to pre-crisis levels by 2016–17.
Analysis of administrative data paints a similar picture. Cribb, Miller and Pope (2019) provide an in-depth study of business owners in the UK using administrative tax records from HM Revenue & Customs (HMRC). Their analysis reveals that mean taxable incomes of sole traders was £21,000 in 2015–16, over £10,000 lower than for employees. The income sole traders derive from their businesses (that is, excluding other income sources such as private investments and pensions) is even lower, at just £12,100, and has fallen by 21% in real terms since the onset of the financial crisis in 2007–08. Cribb et al. show that this decline was driven by falling profits among those who remained in self-employment throughout the period, rather than by new entrants into self-employment or those who leave self-employment.
Self-employed workers and employees have also seen a divergence in their retirement savings. Crawford and Karjalainen (2020) document that while pension participation among private sector employees was around the same level as for the self-employed in 1998 (around 48%), by 2018 only 16% of the self-employed contributed to a private pension plan, with employees being four times as likely to contribute. Only a small part of this decline can be attributed to changes in the composition of self-employment. A larger role is played by a decrease in the propensity to save among the self-employed, especially those who had traditionally been saving more – namely, those with longer tenure in self-employment and those on higher incomes. The divergence in pension savings between employees and the self-employed cannot be explained by different trends in the use of other financial assets – for example, savings accounts or housing wealth.
The rise in solo self-employment has taken place across the wage distribution
The sharp rise in solo self-employment and the growing disparity in earnings have raised concerns about the quality of self-employed jobs and what this means for the UK labour market. A host of drivers have been proposed for the rise in self-employment, from tax incentives (Adam, Miller and Pope, 2017) to an ageing population (Tatomir, 2015). More prominently, there is a concern that the rise in solo self-employment and the ‘gig economy’ reflects a lack of good employment opportunities, especially after the Great Recession. There has also been increased focus on workers’ bargaining power vis-à-vis their employers, who may use ‘bogus self-employment’ as a way to bypass labour protection laws and shift risk onto workers.
Table 1. Top 10 occupations with largest increase in number of solo self-employed, 2000 to 2019

a The increase in ‘agricultural and related trades’ is driven by an increase in solo self-employed gardeners and groundsmen.
b Nearly all solo self-employed workers who are ‘teaching and educational professionals’ are in the ‘not elsewhere classified’ unit, which includes private tuition and teaching English as a foreign language.
Note: Workers aged 16–64 only. Self-employed includes sole traders and company owner-managers. Occupations in 2000 are converted into three-digit SOC 2010 categories using gender-specific probabilistic mapping.
Source: Labour Force Survey, Q1–Q4 2000 and Q1–Q4 2019.
However, it is worth remembering that the solo self-employed are an extremely diverse group, spanning cleaners and Deliveroo drivers at one end to barristers and management consultants at the other. Table A1 in the appendix shows that the solo self-employed can be found across a wide range of industries, occupations and demographic groups. A recent typology of self-employed workers identifies six clusters based on demographic and work characteristics (Blundell, 2019). These range from ‘London professionals’, who are typically highly educated workers in the finance sector, to ‘low-educated young men’, who are more likely to be from ethnic minorities and predominantly work as road transport drivers.
We find that the recent increase in solo self-employment has not been confined to low-skilled, low-wage jobs. Table 1 lists the 10 detailed occupations that have seen the largest increase in the number of solo self-employed workers since 2000, which jointly account for 62% of the total increase in solo self-employment over the last two decades. The occupations listed in Table 1 range from the very low-paid (‘elementary cleaning occupations’) to the very high-paid (‘functional managers and directors’).
The share of workers who are solo self-employed has increased substantially in some of these occupations, more than doubling among ‘elementary cleaning occupations’ and ‘functional managers and directors’ and trebling among hairdressers. This reflects a shift in the contractual nature of work from traditional employment to self-employment across a wide range of occupations.
Figure 6. Solo self-employment as a share of all workers by median occupation wage quintile, 2000 and 2019

Note: Workers aged 16–64 only. Self-employed includes sole traders and company owner-managers. Occupations defined by two-digit SOC 2000 codes.
Source: Labour Force Survey, Q1–Q4 2000 and Q1–Q4 2019; Annual Survey of Hours and Earnings, 2000.
More generally, the rise in solo self-employment has taken place relatively evenly across the wage distribution. This can be seen in Figure 6, which ranks occupations into quintiles based on median employee wages in 2000.3 The yellow bars and the tops of the combined bars show the share of workers who were solo self-employed in each quintile of the (occupational) wage distribution in 2000 and 2019 respectively. We see that solo self-employment as a share of all workers increased relatively evenly in percentage-point terms across the wage distribution. In percentage terms, the increase was largest at the top and bottom of the wage distribution, where initial levels of solo self-employment were lowest.
Solo self-employment appears to occupy an intermediate state on the margins of employment
Despite variation in the nature of solo self-employed jobs and earnings, there is evidence to suggest that solo self-employment sometimes serves as a marginal form of work on the boundaries of employment. First, many people enter solo self-employment after falling out of employment (Cribb and Xu, 2020). The share of solo self-employed workers who were previously unemployed or inactive increased sharply around the Great Recession, and is still higher than in the early 2000s. Second, the solo self-employed are more likely than employees (or the self-employed with employees) to want to work longer hours than they currently work. Third, the rate of solo self-employment in an area appears to put downward pressure on employees’ wages – suggesting that the solo self-employed reduce employees’ bargaining power with their employers by acting as a ‘reserve army’ of potential alternative employees. We document each of these facts below. All three facts suggest that solo self-employment is often something that people do when they would prefer a more typical employment arrangement but cannot find such an opportunity.
Many enter solo self-employment from unemployment or inactivity
In recent work, Cribb and Xu (2020) use annual panel data to track the outcomes of individuals as they move into solo self-employment for the first time.4 They find that 44% of those entering solo self-employment between 2009 and 2019 were unemployed or inactive at some point in the year before entry. Rates of unemployment and inactivity rise sharply in the run-up to entering solo self-employment, from 30% three years before to 37% one year before entry, which is consistent with people using self-employment as a way to maintain their incomes in the face of employment shocks. 11% of those who were employed one year before entry also had a spell of unemployment or inactivity between survey waves (that is, less than one year before entry), compared with just 1% of those who move into self-employment with employees. A substantial share of those who became unemployed or inactive in the run-up to entering solo self-employment report being dismissed or made redundant from their previous job.
The fall in employment in the run-up to entering solo self-employment is particularly pronounced for those entering professional occupations. This suggests that whilst professionals are a minority of the solo self-employed, the use of self-employment as a ‘fall-back’ or ‘insurance’ option may be particularly common for this group.
Figure 7 shows the share of people who move into solo self-employment who were unemployed or inactive in the previous quarter. It is based on data from the Labour Force Survey, a different data set from the one Cribb and Xu (2020) use, and considers all entries into solo self-employment from other employment states, including by people who have been solo self-employed in the past. In 2019, nearly a quarter (23%) of new solo self-employed workers were unemployed in the previous quarter, and 31% were economically inactive. The share of entries from unemployment doubled over the Great Recession, from 14% in 2008 to 28% in 2009 and 2010, which is consistent with people becoming solo self-employed in response to poor labour market conditions. The high shares in 1993–94 may reflect a spike around the recession of the early 1990s.5
Figure 7. Share of new solo self-employed workers who were unemployed or inactive in the previous quarter, 1993 to 2019

Note: Workers aged 16–64 only. Self-employed includes sole traders and company owner-managers. New solo self-employed defined as those who were not in solo self-employment in the previous quarter.
Source: Labour Force Survey Five-Quarter Longitudinal Dataset, Q4 1992 to Q3 2019.
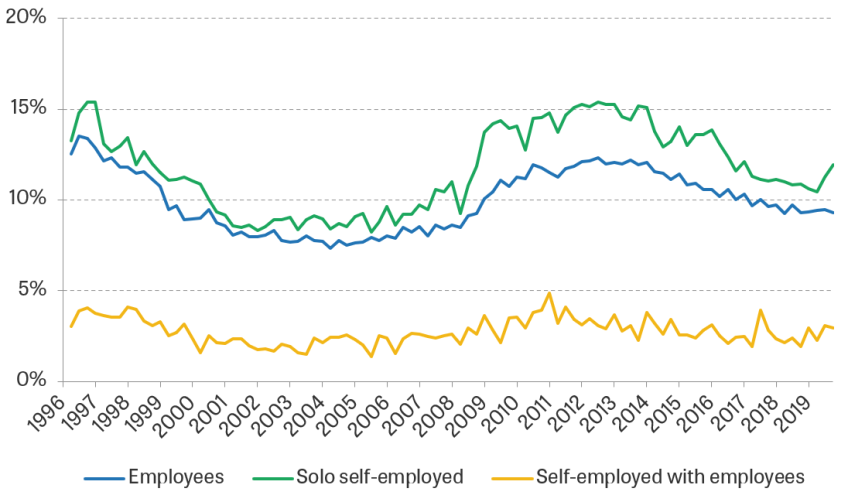
Figure 8. Share of workers who were unemployed or inactive in the previous quarter, 1993 to 2019

Note: Workers aged 16–64 only. Self-employed includes sole traders and company owner-managers.
Source: Labour Force Survey Five-Quarter Longitudinal Dataset, Q4 1992 to Q3 2019.
Figure 8 shows that the share of all workers who were unemployed or inactive in the previous quarter is higher for the solo self-employed than for employees.6 This share increased sharply for the solo self-employed around the Great Recession, from 3% in 2007–08 to 5% in 2009, reflecting the rise in new entrants from unemployment seen above. In contrast, there was little change in the share of employees who were unemployed or inactive in the previous quarter around 2008.
Figures 7 and 8 do not suggest that the long-term rise in solo self-employment is driven by people who were previously unemployed: the share of solo self-employed workers who were recently unemployed was not notably higher in 2019 than in 2000. This is not surprising given that unemployment as a whole has been very low (until the COVID-19 crisis). What the figures do suggest is that the solo self-employed may be increasingly drawn from those who face poor employment prospects relative to those who remain in standard employment – a hypothesis for which we show more supporting evidence below. Whilst the share of recently non-employed workers was the same across the solo self-employed and employees in 2000, by the end of 2019 the solo self-employed were nearly 1.5 times more likely to have been recently unemployed or inactive than employees.
Many solo self-employed workers are underemployed
Recent survey evidence shows that, on average, the solo self-employed in the UK work 8–9 fewer hours per week than the self-employed with employees and traditional full-time employees (Boeri et al., 2020). The data also show that around half of the solo self-employed work part-time (less than 35 hours a week), which is twice as high as the rate for the self-employed with employees. A third of those working part-time in solo self-employment report doing so for economic reasons – slack business conditions or the inability to find full-time work – or due to seasonal work.
Evidence from the Labour Force Survey reveals that solo self-employed has been the employment type with the highest level of underemployment over the past 20 years, defined as wanting to work longer hours (Panel A of Figure 9). During the Great Recession, the rate of underemployment reached 15% among the solo self-employed, 12% among employees and a mere 4% among the self-employed with employees. The rate of overemployment – that is, the fraction who would like to work shorter hours for less pay – is the mirror image of underemployment (Panel B of Figure 9): since the early 2000s (when the questions were first asked), the solo self-employed have consistently had the lowest levels of overemployment.
Taken together, this suggests that a significant fraction of the solo self-employed are underemployed. As with Figure 8, Figure 9 suggests that the solo self-employed are increasingly being drawn from those with poor alternative options. Panel A shows that whilst a roughly equal share of employees and the solo self-employed wanted to work longer hours at the end of 2000, by the end of 2019 the solo self-employed were 2.6 percentage points or 28% more likely to be underemployed. Similarly, Panel B shows that the gap in the rate of overemployment between employees and the solo self-employed has widened over the past two decades, from 1.4 percentage points (14%) in mid 2001 to 2.3 percentage points (22%) by the end of 2019.
Figure 9. Underemployment and overemployment by employment type
Panel A. Share desiring longer hours
Panel B. Share desiring shorter hours

Note: Workers aged 16–64 only. Workers are classed as underemployed if they (i) would prefer longer hours in their current job, (ii) want longer hours in a new job or (iii) are looking for an additional job. Overemployment is defined analogously. The data start recording underemployment in Q2 1996 and overemployment in Q2 2001.
Source: Quarterly Labour Force Survey, Q2 1996 to Q4 2019.
Solo self-employment puts downward pressure on employees’ wages
The argument that higher levels of unemployment restrain real wage growth among workers is widely recognised in economics and there is a substantial empirical evidence base for it. In times of higher unemployment, greater competition for jobs among the unemployed and poorer outside options for the employed limit the bargaining power of both groups with employers (or potential employers), and hence hold back wage growth. A similar argument can be made for underemployment, which measures the extent to which workers would like to work longer hours. As underemployed workers are substitutes for fully employed workers who are satisfied with their hours, elevated levels of underemployment can slow down wage growth (Bell and Blanchflower, 2019).
If the rise of solo self-employment partly reflects people moving into jobs with poor outside options, solo self-employment may contribute further to this ‘slack’ in the labour market. Using data from across OECD countries, Boeri et al. (2020) show that the rate of solo self-employment contributes to explaining wage moderation over and above other forms of labour market slack (in particular, unemployment and underemployment). Here, we now show that the negative relationship between the solo self-employment rate and real wage growth holds when tested on UK data at the local labour market level, as measured by travel-to-work areas (TTWAs).
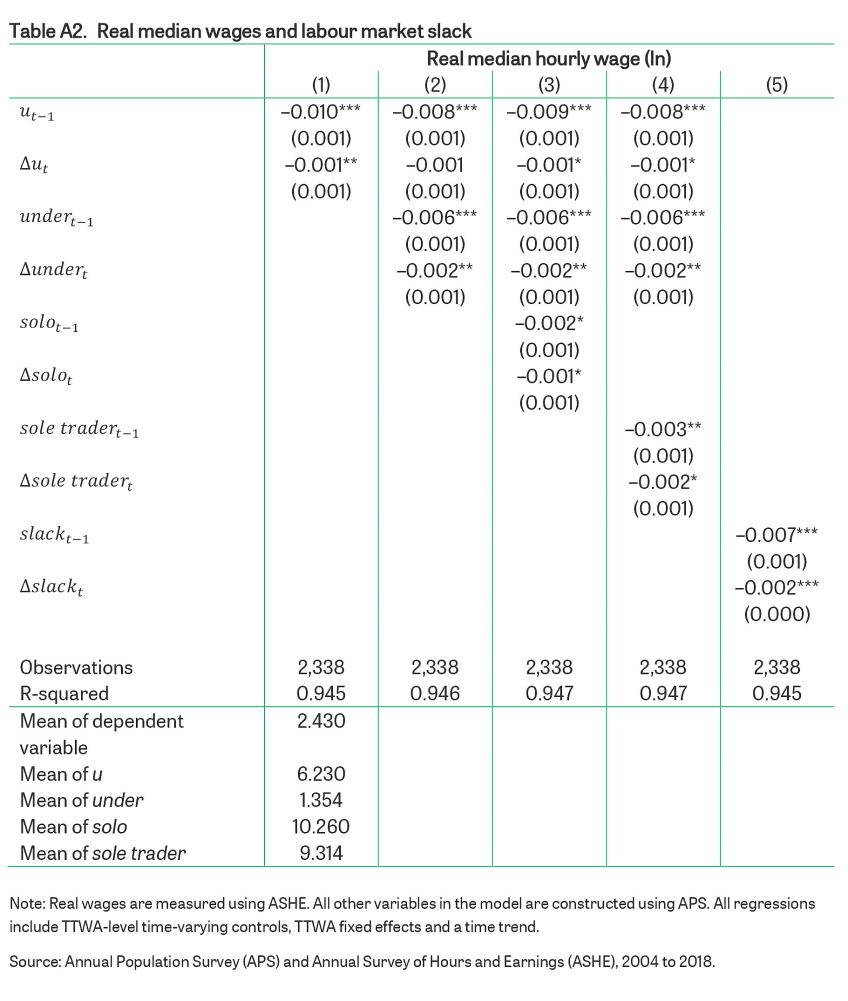
The empirical relationship between wage growth and labour market slack – the so-called ‘wage curve’ – is traditionally estimated using a statistical regression which relates wage growth to the unemployment rate in the previous year (typically controlling for the change in the unemployment rate between the two years)7. Column 1 of Table A2 in the appendix reports the estimated coefficients of this simple model estimated at the TTWA level, using data on English and Welsh TTWAs from 2004 to 2018. Our outcome measure is median log real hourly wages among employees, which is more accurately measured than self-employed wages. The estimates indicate that a 1 percentage point increase in the previous year’s unemployment rate is associated with a 1% decrease in real wage growth.
We consider a set of ‘augmented’ wage curves in which we progressively include additional measures of labour market slack: the underemployment rate among employees (column 2), the solo self-employment rate (column 3) and the rate of sole traders, excluding owner-managers (column 4).8 For comparability, all additional measures are measured as a share of the whole labour force. We also consider a combined measure of slack which is the sum of the unemployment, underemployment and solo self-employment rates (column 5).
Column 2 of Table A2 shows that a 1 percentage point increase in the lagged underemployment rate is associated with a 0.6% decrease in real wage growth. The estimates in column 3 (column 4) show that the solo self-employment rate (the sole trader rate) is also negatively and statistically significantly correlated with real median hourly wage growth. The inclusion of these variables in the regression adds explanatory power over and above the traditional measures of labour market slack. The estimates in column 4 indicate that a 1 percentage point increase in the sole trader rate is associated with a 0.3% drop in real wage growth. The effect is approximately a third of that associated with unemployment and a half of that associated with underemployment.
It is worth being clear on two points. First, because our outcome measure is real employee wage growth, this is not a reflection of lower wages among the solo self-employed – instead, a rise in solo self-employment (and sole traders in particular) appears to put downward pressure on the wages of employees. Second, the magnitude of the impact of solo self-employment on average employee wages is, unsurprisingly, quite small. Our point is not that this is a massively important factor when it comes to explaining the macroeconomics of what happens to employee wages. The importance of this finding is in what it tells us about the solo self-employed, not employees: namely, that some of the solo self-employed would move into traditional employment if they could find an opportunity. In those cases, solo self-employment is a symptom of a lack of good opportunities in the traditional labour market.
To understand how the effect of unemployment, underemployment and sole traders on wages differs across the wage distribution, we estimate the regression separately for wages in each decile of the wage distribution. The estimates are reported in Figure 10. The results show that local unemployment and underemployment mainly depress wages at the bottom of the wage distribution, which is consistent with the notion that unemployed and underemployed individuals tend to be closer substitutes of low-wage workers.
Figure 10. Estimates of the effects of labour market slack across the wage distribution

Note: Real wages are measured using ASHE. All other variables in the model are constructed using APS.
Source: Annual Population Survey (APS) and Annual Survey of Hours and Earnings (ASHE), 2004 to 2018.
Interestingly, the (much more moderate) effect of the sole trader rate on real wages is more uniform across the wage distribution, suggesting that solo self-employment reflects some degree of slack even among the higher-skilled. This is consistent with the finding in Cribb and Xu (2020) that the spike in unemployment and inactivity in the run-up to entering solo self-employment is particularly pronounced for those in professional jobs.
Well-being remains higher among the solo self-employed
The analysis above paints a rather bleak picture of solo self-employment. In many cases, solo self-employment appears to be a fall-back option, and an additional source of labour market slack which puts downward pressure on wages.
At the same time, a number of studies have documented higher job satisfaction among the self-employed in a number of developed countries (Cribb and Xu, 2020; Benz and Frey, 2008; Clark and Senik, 2006; Hundley, 2001; Blanchflower, Oswald and Stutzer, 2001; Blanchflower and Oswald, 1998). Figure 11 shows that the solo self-employed are also more likely to report being happy and to consider their lives worthwhile. They also report lower levels of anxiety than employees (not shown on the figure). The exception to the rule is life satisfaction, where the solo self-employed previously reported lower levels of well-being, but in recent years have caught up with employees; the difference is now negligible and statistically insignificant.
Further, whilst self-reported well-being measures have been improving for all employment groups in recent years, they appear to have improved more among the solo self-employed. This may seem surprising given the evidence above, which suggests that solo self-employment is often, and perhaps increasingly, an insurance option for those without better job opportunities. If more people are pushed into solo self-employment, rather than actively choosing it because of their preferences, we might expect the well-being of the solo self-employed as a group to fall over time.
The analysis of well-being trajectories in Cribb and Xu (2020) may reconcile these two notions. It finds that despite lower earnings, becoming solo self-employed improves well-being on average and, crucially, that the improvement in job satisfaction appears to hold even among groups who may have been pushed into self-employment (those who had a spell of unemployment or inactivity in the previous year, and those who did not expect to start their own business in the previous year). This suggests that there may be non-pecuniary benefits of solo self-employment that, on average, compensate for lower earnings, even for individuals who may have become solo self-employed as a result of poor labour market opportunities.
Figure 11. Self-reported well-being measures, 2011 to 2018

Note: Workers aged 16–64 only. Self-employed includes sole traders and company owner-managers. Well-being measures are scored on a scale of 1 to 10.
Source: Annual Population Survey, 2011 to 2018.
That said, the well-being of the solo self-employed as measured in normal times may not fully account for the additional risks that they may later face during a crisis. The data presented in Figure 11 capture a period of relative economic stability, after the Great Recession (when the Office for National Statistics began collecting well-being data) and before the current COVID-19 crisis. Recent studies have found that the self-employed have been particularly hard hit by the pandemic (Blundell and Machin, 2020; Benzeval et al., 2020; Adams-Prassl et al., 2020). The well-being of the self-employed may also have suffered as a result of the economic shock or as a result of heightened awareness of their exposure to economic shocks.
Conclusion
The rise in solo self-employment over the past 40 years has significantly altered the landscape of work in the UK. Its growth has occurred across the wage and skills distribution, leading to a diverse pool of solo self-employed workers right across the UK labour market.
Many explanations have been put forward for the rise in self-employment, from tax incentives (Adam, Miller and Pope, 2017) to an ageing population (Tatomir, 2015). The evidence brought together in this briefing note suggests that part of the rise in solo self-employment reflects underlying labour market weaknesses. We show that whilst there is great diversity among the solo self-employed, as a group they are characterised by high underemployment and a high share of entries from unemployment and inactivity, both of which peaked during the Great Recession. Consistent with the interpretation of solo self-employment as a fall-back option for many, we have shown that changes in solo self-employment explain patterns of wage moderation in the UK labour market, above and beyond canonical measures of labour market slack (unemployment and underemployment).
At the same time, job satisfaction remains high among the self-employed. We have documented that the solo self-employed have higher reported rates of happiness and sense of self-worth, as well as lower reported anxiety compared with employees. This suggests that there may be non-pecuniary aspects associated with solo self-employment that compensate for lower earnings.
Appendix
Table A1. Characteristics of solo self-employed, 2000 and 2019

References
Adam, S., Miller, H., and Pope, T. (2017), ‘Tax, Legal Form and the Gig Economy’, in C. Emmerson, P. Johnson and R. Joyce (eds), The IFS Green Budget: February 2017, https://www.ifs.org.uk/publications/8872.
Adams-Prassl, A., Boneva, T., Golin, M., and Rauh, C. (2020), ‘Inequality in the Impact of the Coronavirus Shock: Evidence from Real Time Surveys’, Journal of Public Economics, 189, 104245, https://doi.org/10.1016/j.jpubeco.2020.104245.
Advani, A. (2017), ‘Who Does and Doesn’t Pay Taxes?’, Institute for Fiscal Studies (IFS), Briefing Note BN218, https://doi.org/10.1920/BN.IFS.2017.BN0218.
Bell, D. N. F., and Blanchflower, D. G. (2019), ‘Underemployment in the US and Europe’, Industrial and Labor Relations Review, https://doi.org/10.1177%2F0019793919886527.
Benz, M., and Frey, B. S. (2008), ‘Being Independent Is a Great Thing: Subjective Evaluations of Self-Employment and Hierarchy’, Economica, 75, 362–83, https://doi.org/10.1111/j.1468-0335.2007.00594.x.
Benzeval, M., Burton, J., Crossley, T., Fisher, P., Jӓckle, A., Low, H., and Read, B. (2020), ‘The Idiosyncratic Impact of an Aggregate Shock: The Distributional Consequences of COVID-19’, Institute for Fiscal Studies (IFS), Working Paper W20/15, https://doi.org/10.1920/wp.ifs.2020.1520.
Blanchflower, D. G., and Oswald, A. J. (1998), ‘What Makes an Entrepreneur?’, Journal of Labor Economics, 16, 26–60, https://doi.org/10.1086/209881.
Blanchflower, D. G., Oswald, A. J., and Stutzer, A. (2001), ‘Latent Entrepreneurship across Nations’, European Economic Review, 45, 680–91, https://doi.org/10.1016/S0014-2921(01)00137-4.
Blundell, J. (2019), ‘Clusters in UK Self-Employment’, Centre for Economic Performance (CEP), Occasional Paper 48, http://cep.lse.ac.uk/pubs/download/occasional/op048.pdf.
Blundell, J., and Machin, S. (2020), ‘Self-Employment in the Covid-19 Crisis’, Centre for Economic Performance (CEP), Covid-19 Analysis, Paper 3, http://cep.lse.ac.uk/pubs/download/cepcovid-19-003.pdf.
Boeri, T., Giupponi, G., Krueger, A. B., and Machin, S. (2020), ‘Solo Self-Employment and Alternative Work Arrangements: A Cross-Country Perspective on the Changing Composition of Jobs’, Journal of Economic Perspectives, 34, 170–95, https://doi.org/10.1257/jep.34.1.170.
Clark, A. E., and Senik, C. (2006), ‘The (Unexpected) Structure of “Rents” on the French and British Labour Markets’, Journal of Socio-Economics, 35, 180–96, https://doi.org/10.1016/j.socec.2005.11.010.
Crawford, R., and Karjalainen, H. (2020), Retirement Saving of the Self-Employed, Institute for Fiscal Studies (IFS), Report R181, https://doi.org/10.1920/re.ifs.2020.0181.
Cribb, J., Miller, H., and Pope, T. (2019), Who Are Business Owners and What Are They Doing?, Institute for Fiscal Studies (IFS), Report 158, https://doi.org/10.1920/re.ifs.2019.0158.
Cribb, J., and Xu, X. (2020), ‘Going Solo: How Starting Solo Self-Employment Affects Incomes and Well-Being’, Institute for Fiscal Studies (IFS), Working Paper W20/23, https://doi.org/10.1920/wp.ifs.2020.2320.
Engström, P., and Hagen, J. (2017), ‘Income Underreporting among the Self-Employed: A Permanent Income Approach’, European Economic Review, 92, 92–109, https://doi.org/10.1016/j.euroecorev.2016.12.001.
Hundley, G. (2001), ‘Why and When Are the Self-Employed More Satisfied with Their Work?’, Industrial Relations, 40, 293–316, https://doi.org/10.1111/0019-8676.00209.
Hurst, E., Li, G., and Pugsley, B. (2014), ‘Are Household Surveys Like Tax Forms? Evidence from Income Underreporting of the Self-Employed’, Review of Economics and Statistics, 96, 19–33, https://doi.org/10.1162/REST_a_00363.
Tatomir, S. (2015), ‘Self-Employment: What Can We Learn from Recent Developments?’, Bank of England Quarterly Bulletin, 2015 Q1, 56–66, https://www.bankofengland.co.uk/-/media/boe/files/quarterly-bulletin/2015/self-employment-what-can-we-learn-from-recent-developments.pdf?la=en&hash=96C1AEA6273E02BB85B671DF95519E17BE87A3E9.
Data
Department for Work and Pensions, Office for National Statistics, NatCen Social Research. (2020). Family Resources Survey, 2018-2019. [data collection]. UK Data Service. SN: 8633, http://doi.org/10.5255/UKDA-SN-8633-1
Eurostat. (2020). Employment by Sex, Age and Professional Status [lfsa_egaps]. https://appsso.eurostat.ec.europa.eu/nui/show.do?dataset=lfsa_egaps&lang=en
Northern Ireland Statistics and Research Agency (NISRA), Office for National Statistics, Social Survey Division. (2020). Quarterly Labour Force Survey, October - December, 2019. [data collection]. UK Data Service. SN: 8614, http://doi.org/10.5255/UKDA-SN-8614-1
OECD. (2020). Employment rate [indicator]. doi: 10.1787/1de68a9b-en (accessed on 14 September 2020)
OECD. (2020). Self-employed without employees [indicator]. doi: 10.1787/5d5d0d63-en (Accessed on 14 September 2020)
Office for National Statistics. (2020). Annual Survey of Hours and Earnings, 1997-2019: Secure Access. [data collection]. 16th Edition. UK Data Service. SN: 6689, http://doi.org/10.5255/UKDA-SN-6689-15
Office for National Statistics. (2020). Labour Force Survey Five-Quarter Longitudinal Dataset, July 2018 - September 2019. [data collection]. UK Data Service. SN: 8587, http://doi.org/10.5255/UKDA-SN-8587-1
Office for National Statistics, Social Survey Division. (2020). Annual Population Survey, January - December, 2018. [data collection]. 5th Edition. UK Data Service. SN: 8461, http://doi.org/10.5255/UKDA-SN-8461-5
Office of Population Censuses and Surveys, Social Survey Division. (2004). Labour Force Survey, 1991. [data collection]. 4th Edition. UK Data Service. SN: 2875, http://doi.org/10.5255/UKDA-SN-2875-1
Endnotes
Authors

Giulia Giupponi
Giulia, an Assistant Professor of Economics at Bocconi University, studies the employment and welfare effects of social insurance and minimum wages.

Xiaowei Xu
Xiaowei joined the IFS in 2018 and works in the Income, Work and Welfare sector.
More from IFS
Understand this issue


Policy analysis


Academic research


