A significant number of adults with mental or physical ill-health or disability require support with the routine activities of daily living – such as cooking, cleaning and dressing themselves – or to ensure their safety and welfare (and the safety and welfare of others). That is, they require some form of ’social care’.
The majority of care for these people is provided informally, by friends and family. Other individuals, especially those with more substantial needs, and perhaps without a relative or friend with sufficient time or ability to care for them, are in receipt of formal care by paid carers. Some of these individuals will have purchased formal care privately. However, public funding in England is available for those above a threshold level of care need and with assets below a certain level. This publicly funded social care is organised largely by the approximately 150 LAs with social care responsibilities.
In this report, we examine the extent to which the level of LA social care spending per adult varied around England in 2015–16, and the extent to which these spending differences correlated with local demographic and socio-economic characteristics, and assessed local relative spending needs for adult social care as of the last official assessment in 2013–14. We also consider how social care spending changed between 2009–10 and 2015–16: a six-year period during which LAs saw an average real-terms cut to their overall budget for local services of 20%. Previous work by Institute for Fiscal Studies (IFS) researchers (Luchinskaya, Simpson and Stoye, 2017) has already shown that at a national level, social care spending was relatively protected, falling by 6.4% in real terms (after accounting for financial transfers from the NHS to support social care services). However, big differences in cuts to overall service budgets in different LAs (Amin Smith et al., 2016), and the different choices made by LAs on how to allocate these cuts across service areas, mean that changes in spending on social care also vary significantly across England. We again examine the correlation between these changes in spending and local demographic and socio-economic characteristics.
The rest of the paper describes how social care is organised and funded in England. Then, the reports examines how spending on social care organised by LAs varied across England in 2015–16, and finally we show how this had changed since 2009–10.
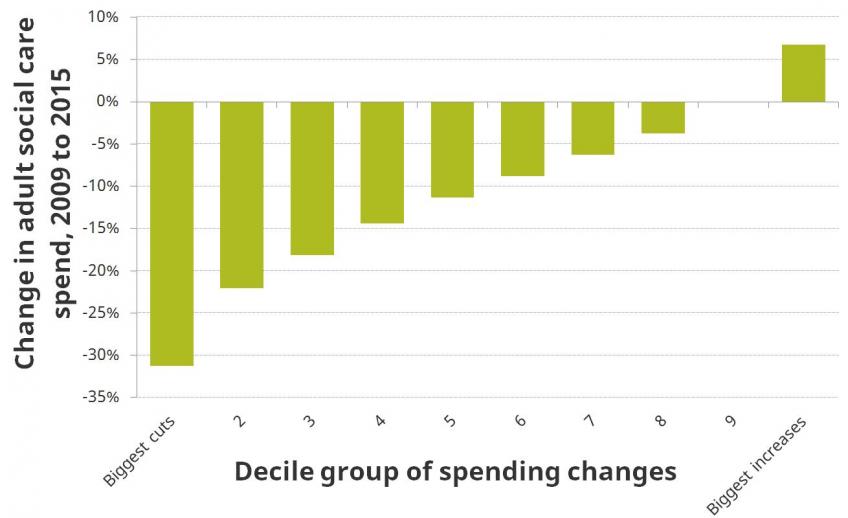
Figure. Real-terms change in adult social care spending per adult by deciles of cuts, 2009–10 to 2015–16 (%)
LA-organised care and the local government finance system
LAs organise and (partially) fund a range of adult social care services for their local populations, including short- and long-term residential, community and day care, and support for carers |
| Use of this funding is rationed using both care-needs assessments and eligibility criteria, and a financial means-test. Since April 2014, the needs assessment process has been set nationally, and all LAs must use eligibility criteria that are at least as generous as a national minimum standard. By excluding the value of the primary residence of the care-receiver, the means-test for home-based and day care is more generous than that for residential care. |
Conditional upon meeting national minimum assessment standards, and eligibility criteria, LAs decide how much of their overall revenues to allocate to adult social care services |
| A number of factors will affect how much different LAs allocate to social care. Most obvious are the local population’s need for social care, and the costs different LAs face in providing care. However, spending will also be affected by whether the LA goes beyond the minimum national eligibility standards, the quality of care it provides and the level of co-payment fees it charges. Different LAs will make different trade-offs between social care, other services and council tax rates. |
LA revenues include council tax, business rates, grants from central government and financial transfers from the NHS to LAs to support social care services via the Better Care Fund |
| Historically, central government grants to LAs were based, at least notionally, on an assessment of local spending needs (including for adult social care) and the amount each LA could raise via council tax. Recent years have seen moves away from this system: the annual updating of needs assessments was ended and, more generally, recent cuts to LA budgets have fallen much heavier on those relatively poorer, more needy areas that depend more on central government grants. These changes will have affected funding available for social care. |
In addition to care provided by LAs, formal social care services are paid for and organised by the NHS and by individuals and their families |
| The NHS organises and funds care for those individuals with the highest medical and care needs through its Continuing Healthcare programme. Individuals requiring care, but who are ineligible for support from their LA or the NHS (or their friends, families or charities), can purchase formal care services from private providers. Data issues prevent in-depth analysis of these expenditures, and how they vary across LA areas. |
Adult social care spending in 2015–16
Net adult social care expenditure by LAs in England in 2015–16 amounted to £16.4 billion in 2016–17 prices, including £1.84 billion of NHS funding via the Better Care Fund |
| This is equivalent to £381 per adult (aged 18 or over) resident of England. However, there is significant variation in social care spending across the country: 10% of LAs spend less than £325 per adult resident, while 10% spend more than £445 per adult resident. At a regional level, spending per adult resident is over £390 in the East, North East and South West of England, and around £360 or lower in Yorkshire and The Humber and East Midlands. |
Income from fees and charges amounted to £2.7 billion in the same year, on an average of £63 per resident adult |
| There is also significant variation in the amount LAs raise from fees and charges on users of adult social care services: 10% raise less than £35, while 10% raise £96 or more. There is little correlation between the amount LAs raise in fees and charges, and the amount they themselves spend on adult social care. |
There is a positive correlation between levels of spending on adult social care services, and overall levels of spending on services by LAs |
| However, there is also significant variation in the proportion of service budgets (excluding education and public health) that is allocated to adult social care: less than 29% in a tenth of LAs, but more than 45% in another tenth, compared with an average of 38% across England. |
The raw correlation between spending on social care per adult resident and the proportion of the population that is aged 65 or over is virtually zero |
| This seems to reflect the fact that many older people live in areas that have other characteristics – such as low levels of deprivation or earnings – associated with relatively low spending. This masks the underlying positive, although modest, correlation between social care spending and the proportion of the population that is aged 65 or over. There are also modest positive correlations between social care spending and the proportion of the population that is entitled to means-tested benefits or aged 18–65 and claiming a disability benefit. |
There is some positive correlation between the assessed levels of relative social care spending needs per adult (as of 2013–14, when the last official assessment was undertaken) and actual spending on social care per adult |
| However, only 13% of the variation in actual spending can be explained by this needs assessment. This could reflect several factors: the official needs assessment may not capture true relative needs; relative needs may have changed significantly between 2013–14 and 2015–16; and/or factors other than differences in needs (such as differences in the priority placed on social care, or differences in the cost-efficiency of service delivery) could play a significant role in determining spending levels. |
Changes to adult social care spending since 2009–10
Changes in social care spending per adult between 2009–10 and 2015–16 varied widely across England, with around one-in-ten LAs cutting spending by more than 25%, while another one-in-seven increased spending |
| Cuts have been far larger, on average, in London (18%) and the metropolitan districts (16%) covering other urban areas such as Greater Manchester, Tyneside and Greater Birmingham, than in the rest of the country. Outside these areas, cuts have been larger in the north of England than the south, on average. |
Over this period, the distribution of spending across the country has narrowed |
| The gap between the 90th and 10th percentiles of the social care spending distribution fell from £158 to £121 per adult, or in percentage terms from 43% to 37%. |
Cuts to social care spending have been greater in areas that initially had high levels of spending |
| Every £10 increase in social care spending per adult in 2009–10 is associated with an increase in subsequent cuts of around 1 percentage point, on average. Cuts have also been larger in LAs that were more reliant on grants for their overall revenues in 2009–10. Both likely reflect the fact that high-spending and more grant-reliant LAs have seen larger cuts to their overall budgets. |
Cuts have been greater in areas that seem to have relatively high levels of spending needs |
| LAs that had higher levels of deprivation, more working age disability benefit claimants and more adults on pension credit, and therefore were assessed to have relatively high levels of spending need in 2009–10, made larger cuts to adult social care spending, on average, over the subsequent six years. |
