For many children, 31 October is an important date. Beyond its reputation as the spookiest day of the year, for children in the final year of primary school (or at least their parents) in England it is also the deadline for submitting their secondary school choices. In contrast, their counterparts in Scotland recognise 31 October primarily for its Halloween celebration, as the default is for children to attend their local catchment area school.
One of the most striking differences between education in Scotland and England is how each nation allocates pupils to schools. Parents in England must ‘express a preference’ for the school(s) they would like their child to attend. In Scotland, meanwhile, each address is assigned to a single secondary school and by default children will attend this catchment area school. No parent makes a choice in Scotland unless they submit a ‘placing request’ to attend an alternative school. This is not encouraged, and is used by fewer than 15% of parents in practice. In Scotland, therefore, where you live is a much more important factor for where you go to school than in England.
The school assignment process may affect the mix of families in schools and neighbourhoods. When residential location guarantees access to a school, this creates strong incentives for parents (or prospective parents) to move to specific neighbourhoods to access ‘desirable’ schools. This, in turn, increases demand for properties and pushes up local house prices. Access to certain schools may become the preserve of determined families who can afford to live in sought-after catchment areas and this process of sorting is likely to lead to less diversity in the social make-up of neighbourhoods and schools.
Such sorting across schools and neighbourhoods can have important effects on social mobility through educational expectations and attainment, in addition to shaping individuals’ beliefs and attitudes.
In this comment, we discuss findings from recent early-stage research into how these different ways of assigning pupils to schools in Scotland and England are associated with the sorting of low-income pupils across schools and low-income people across neighbourhoods.
Scottish schools are more reflective of their local areas
Given the strict catchment area system in Scotland, we find indeed that schools in Scotland more closely mirror their neighbourhood composition than in England.
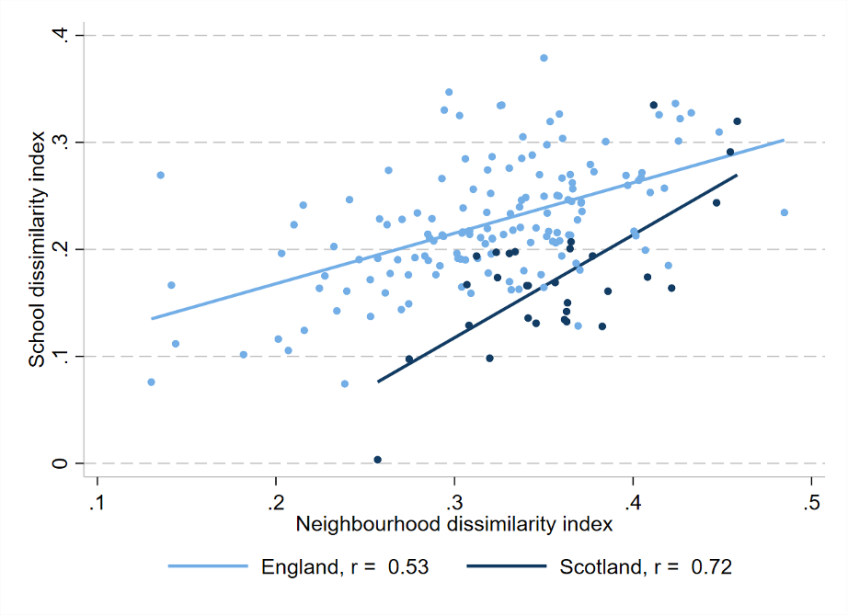
For each local authority in Scotland and England, we calculate the level of segregation in its schools and neighbourhoods, using the ‘dissimilarity index’. This captures how unevenly low-income pupils and residents are distributed across schools and neighbourhoods within a local authority, for instance Coventry (England) or Aberdeen City (Scotland). A higher score on the dissimilarity index indicates that the local authority has more income-segregated schools or neighbourhoods. A score of zero, for example, indicates no segregation (i.e. each school’s intake or each neighbourhood’s population is the same as the local authority average in terms of income), while a value close to 1 suggests very low levels of mixing between low-income pupils and other pupils or low-income people and other residents in schools and neighbourhoods, respectively. Figure 1 plots these measures of segregation in schools and neighbourhoods for each local authority in England (light blue) and Scotland (dark blue).
Figure 1. School and neighbourhood segregation at local authority level in Scotland and England

Note: Each point represents one local authority. Lines of best fit and correlation coefficient, r, are reported for both countries. Local authorities with five or fewer schools are dropped. Neighbourhood refers to a lower-level super output area (LSOA) in England and a data zone in Scotland.
In both countries, local authorities with more segregated neighbourhoods tend to have more segregated schools, as shown by the positive sloping line in each case. Yet, the link is stronger in Scotland compared with England: the correlation between school and neighbourhood segregation is 0.7 in Scotland versus just 0.5 in England (or 0.6 if we exclude grammar schools, which draw from wider geographic areas). This suggests that Scottish schools are more representative of their local areas, and that any segregation in neighbourhoods shows up in the education system. But to what extent does the strict catchment area system also increase segregation in neighbourhoods?
Greater sorting into areas with ‘good’ schools in Scotland
Neighbourhoods attached to ‘good’ schools might have other desirable attributes that also increase demand, and therefore prices – for example, parks, good quality housing stock and access to public transport. Among all these other factors, how can we isolate only the ‘catchment area’ effect? By zooming in to a small set of neighbourhoods around catchment boundaries, we can be confident other neighbourhood amenities – the parks, etc. – are as similar as possible for all these neighbourhoods. Either side of the catchment area boundary, the only thing that changes is local school quality; higher house prices on one side of the boundary, therefore, can be more confidently attributed to the local school.
We compare property prices on either side of catchment area boundaries, for pairs of neighbourhoods that sit on either side of the boundary. This can be done for the whole of Scotland, and in England for local authorities that primarily use pre-defined catchment areas in their admissions arrangements. The key difference between the two countries, however, is that residence within a catchment area does not guarantee admission to the catchment area school in England.
The higher-performing school in the pair is defined as the school with the higher percentage of pupils achieving at least five A*–C grades at GCSE, including English and maths in England, and the percentage achieving at least five awards at SCQF level 5 or above in Scotland. Pairs of schools can either have small or large differences in school performance across the boundary. On average, the difference is 0.66 standard deviations in England and 0.74 standard deviations in Scotland.
In Scotland, the average property price premium for homes located on the side of the higher-performing school is greater than in England (8% versus 3%), suggesting that in Scotland – where location within a catchment area guarantees access – there is relatively higher demand for living in areas with ‘better’ schools. This then translates into greater sorting of residents by socio-economic background around catchment boundaries: for example, the share of households in a professional occupation is 2.4 percentage points higher in Scotland on the high-performing side of the boundary, compared to only 0.9 percentage points in England. Taken together, this suggests that school assignment policies can have knock-on effects for the diversity of neighbourhoods.
The school segregation puzzle
The implication of a strict school catchment area system for neighbourhood segregation is clear: bundling school attendance together with residential choice creates incentives to sort into neighbourhoods with ‘better’ schools. To the extent that more-affluent families are better able to do this than low-income families, all else equal, this produces more-segregated neighbourhoods. The outcome of this system for segregation across schools, however, is more ambiguous.
In both England and Scotland, schools are segregated by income: some schools have very few low-income pupils while in others, more than half of students are from low-income households (based on a proxy measure of eligibility for free school meals). That said, overall, English schools are more segregated than Scottish schools. For each local authority in England and Scotland, we calculate the difference in share of low-income pupils between the school with the highest and lowest share. In the median local authority in England, the school with the largest percentage of poor pupils is 27 percentage points higher than the school with the smallest percentage. In Scotland, this gap is 16 percentage points. This is also reflected in the dissimilarity index: 22% of pupils would need to be reallocated across schools to achieve an equal distribution of low-income pupils in England, compared to 17% in Scotland.
Given the stronger relationship between neighbourhood and school segregation in Scotland (as shown in Figure 1) and similar levels of neighbourhood segregation in both countries, it is perhaps surprising that school segregation is higher in England. This finding suggests that in Scotland, neighbourhood segregation is a strong predictor of school segregation, but in England other factors are more important.
What could these factors be? Our results hold even when we exclude English local authorities with a high share of selective (grammar) schools. Similarly, it holds when excluding London, meaning that the effect is not driven by distinct patterns in England’s capital. It could be that the same system of school choice that reduces the need for families to sort geographically, may make it easier for different types of students to select different types of schools in England, for example. Or the presence of quasi-selective schools in England that are permitted to select up to 10% of their intake according to ‘aptitude’ may increase segregation of pupils by income. At this stage in our research, we cannot disentangle which, if any, of these explanations is true – we have been able to control for grammar schools but not these quasi-selective schools, for example. However, this puzzle points to the complexity of the underlying mechanisms governing the processes of school and neighbourhood segregation across countries.
The case studies of Scotland and England therefore highlight the ways in which educational systems may influence segregation. But, as shown, the relationships are not always straightforward. Understanding these mechanisms is vital for improving children’s outcomes and promoting social mobility, and future work will seek to study the causal role that school assignment plays in shaping the composition of schools and neighbourhoods.


