IFS Election 2017 analysis is being produced with funding from the Nuffield Foundation as part of its work to ensure public debate in the run-up to the general election is informed by independent and rigorous evidence. For more information, go to www.nuffieldfoundation.org. The Joseph Rowntree Foundation has also supported this research as part of its programme of research and innovative development projects, which it hopes will be of value to policymakers, practitioners and service users. All views are those of the authors.
Key findings
1. Real average (median) income is only around 5% higher now than it was in 2007–08. This is more than 10% lower than might have been expected before the recession, based upon the historical growth rate.
2. This masks substantial differences across age groups: average income among 22 to 30 year-olds is only now recovering its 2007–08 level, having been hit hard by the recession. By contrast, pensioners have seen sustained increases in their incomes, with their average income growing by nearly 15% over the same period.
3. The weakness in income growth has been seen across the income distribution. Growth in incomes has been slightly slower for high-income households (reducing income inequality), though they benefited most from falls in mortgage interest payments. But the slow growth in income among lower-income households has led to overall and child absolute poverty rates (on the official government definition) falling by just 2 and 3 percentage points respectively – in contrast to 13 and 15 percentage point falls over the previous decade.
4. Our projections suggest that, if the Office for Budget Responsibility (OBR) are correct about the outlook for employment, earnings and inflation, there will be no real growth in median income over the next two years, and only modest growth thereafter. This would leave incomes in 2021-22 more than 15% below where we might have expected before the financial crisis hit, based on historical growth rates – equivalent to over £5,000 per household per year on average.
5. We also project increases in inequality: both because forecast growth in average real earnings would benefit higher income households more than lower income ones, and because cuts in the real value of benefits will reduce incomes among poorer working age households. Real incomes are projected to fall among the poorest 20% of households over the next five years, with households with children being particularly affected.
A deep recession and slow recovery means average incomes are currently more than 10% below their long run trend...
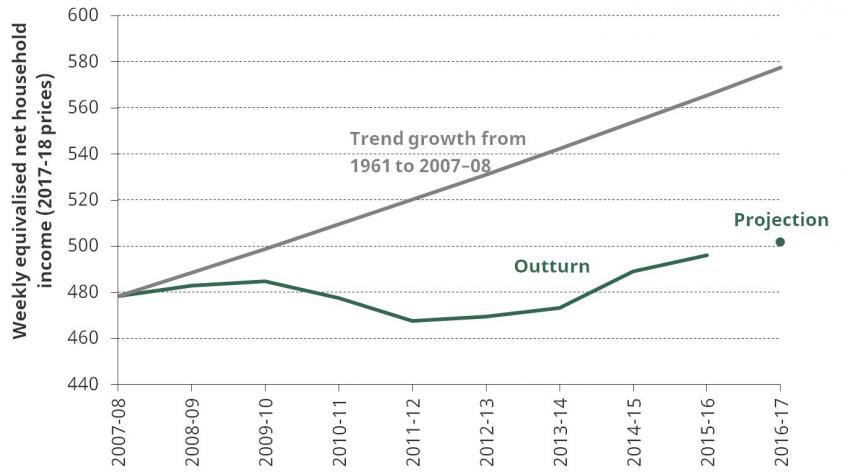
Figure 1. Real median income, 2007-08 to 2016-17 [download the data]
Note: Outturn data are used up to 2015-16, and then growth rates from Hood and Waters (2017a). See Appendix A for further details.
Source: Authors’ calculations using Family Resource Survey and projections from Hood and Waters (2017a).
Figure 1 shows the path of real median equivalised household incomes between 2007–08 and 2015–16 (the latest year for which data are available), together with our projection for 2016–17. It also shows how median income would have evolved had it grown at the average growth rate seen between 1961 and 2007–08.
Average incomes rose slightly in the immediate wake of the recession, but declined sharply between 2009–10 and 2011–12 thanks to a large fall in real earnings. Continued weakness in real earnings led to only slow growth in real incomes in the following two years. Between 2013–14 and 2016–17 employment continued to rise and lower inflation boosted real earnings, leading to real income growing by a total of around 6% – roughly in line with the historical trend rate of growth.
Despite that modest recovery over the last 3 years, average income in 2016–17 is projected to be just 5% above its 2007–08 level. This means it is more than 10% below where we might have reasonably expected back in 2007–08, based on the long run pre-recession trend growth rate. This slow growth has been seen across the regions and nations of the UK (see Appendix B).
...with the young faring much worse than the old
Figure 2. Changes in real median income by age group before and after housing costs have been deducted (BHC and AHC), 2007-08 to 2016-17 [download the data]
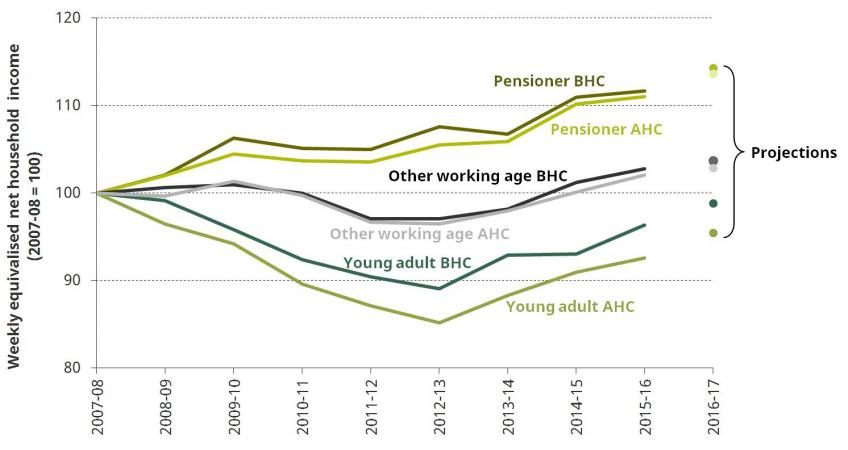
Note and sources: See Figure 1. Pensioners are defined as those aged 65 or above; other working aged are defined as those aged between 31 and 64; and young adults are defined as those aged 22 to 30.
Figure 2 shows how real median incomes have grown for young adults (aged 22-30), other working age adults (aged 31-64), and pensioners (defined here as those aged 65 and over), both before and after deducting housing costs (BHC and AHC).[1] The recession had relatively little impact on median pensioner income, which is projected to have been nearly 15% higher in 2016–17 than in 2007–08. This increase is both the result of some individual pensioners experiencing growth in incomes from one year to the next (for example as a result of the ‘triple lock’ on the state pension) and, importantly, the fact that those newly retiring tend to have larger pension entitlements than previous waves of retirees.
By contrast, young adults were hit hard by the recession, with median income for that group falling by more than 10% between 2007–08 and 2012–13. Their incomes have since bounced back relatively strongly, but their median income is only now recovering the level it was at in 2007–08.
Those aged between 31 and 64 were less affected by the recession than young adults, but slow growth since means their average incomes are only slightly higher than in 2007–08.
High- and low- income households have both shared in this decade of slow income growth
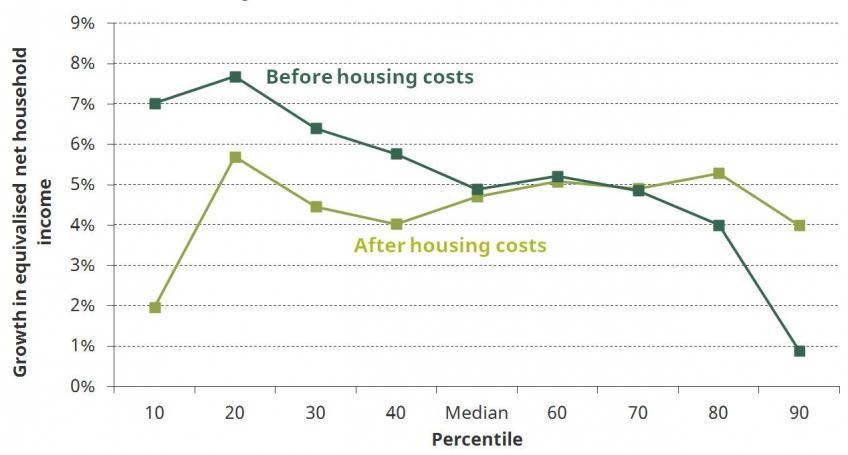
Figure 3. Change in income between 2007–08 and 2016–17 at selected percentiles, before and after housing costs have been deducted [download the data]
Note and sources: See Figure 1.
The weakness in average income growth has been mirrored across the income distribution. The 10th and 20th percentiles (lower-income households) have seen income growth before housing costs (BHC) of 7-8% since 2007–08 – equivalent to just 0.8% per year. But higher-income households have seen even slower growth (with 0.4% annual growth at the 80th percentile and almost no growth at the 90th), leading to a fall in inequality measured BHC. This pattern is driven by rising benefit income between 2007–08 and 2009–10 (boosting the incomes of low-income households) and falling real earnings between 2009–10 and 2011–12 (hitting high-income households). Since then, weak earnings growth and strong employment growth have combined to stop inequality bouncing back.
If measured on an after-housing-cost (AHC) basis – which there is a strong case for – inequality is little changed, with similar growth across most of the distribution. This is driven by the falls in mortgage interest rates during the recession benefiting higher income households by more than low income ones, which mostly offset the reduction in inequality seen in BHC incomes.[2]
These changes leave inequality around the same level as it was in the early 1990s, following the big increases in the 1980s. Note however that the share of income going to the top 1% of households rose significantly between the early 1990s and the onset of the recession (it has since fallen back slightly).
Little growth in real incomes among poorer households has led to almost no change in absolute poverty
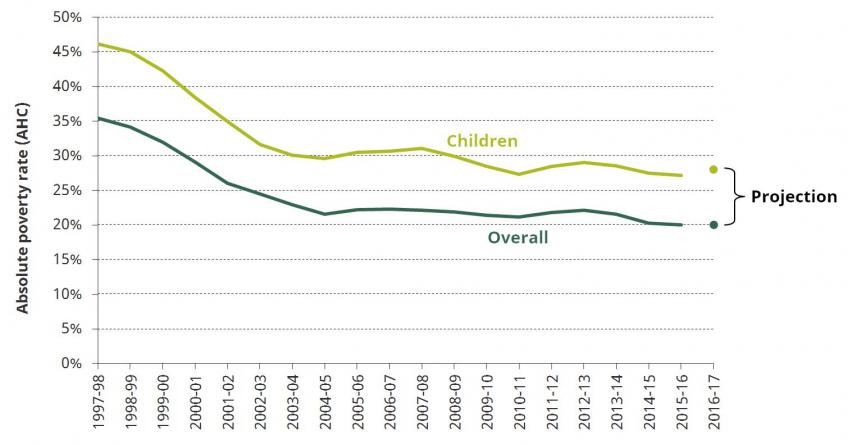
Figure 4. Absolute poverty rates measured after housing costs have been deducted, overall and children, 1997-98 to 2016-17 [download the data]
Note and sources: See Figure 1.
Figure 4 shows the path of overall and child absolute after-housing-cost (AHC) poverty since 1997–98, measured using the government’s official absolute poverty line (fixed at 60% of 2010–11 median income in real terms).
Since the real incomes of poorer households (after you account for housing costs) have grown little since the recession, absolute poverty - which compares incomes to a fixed real-terms poverty line - has not fallen much over the past decade: 2 percentage points across the population as a whole, and 3 percentage points among children. There is little difference in poverty trends among pensioners, working-age parents and working-age adults without children.
This comes in stark contrast to the previous decade: between 1997–98 and 2007–08 , absolute poverty fell by 13 percentage points overall, mainly thanks to sharp falls in absolute pensioner poverty and a 15 percentage point fall in absolute child poverty. Note, though, that the end of the period of steep declines in absolute poverty was a few years before the financial crisis hit, from around 2004-05.
No growth in median income expected for next 2 years, and not much after that either...
Figure 5. Projected annual change in real median income, 2012-13 to 2021-22 [download the data]
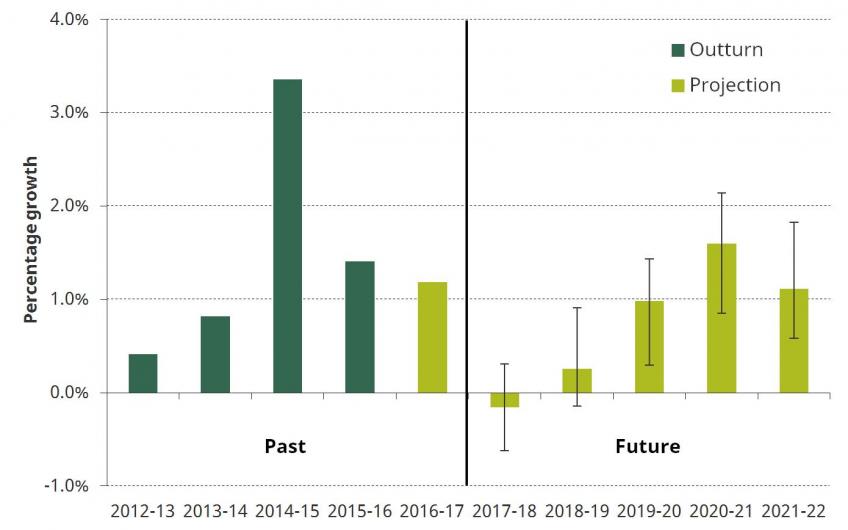
Note and sources: See Figure 1. The vertical black bars indicate projections for incomes if earnings grew one percentage point per year faster or slower than the OBR forecast.
Looking forward, Figure 5 shows historical and projected growth rates for real median income based upon forecasts from the Office for Budget Responsibility (OBR) and the government’s current policy plans.[3] The vertical black bars indicate our projections for income growth if earnings grew one percentage point per year faster or slower than the OBR forecast. The figure shows that – if the OBR’s forecasts turn out to be right and the government follows through on its plans – we would expect no growth in real median income at all over the next two years.
Beyond that, our projections suggest that while income growth will be somewhat stronger, it will be still be well below the long-run trend of 2% a year, leaving median income less than 5% higher in 2021–22 than it was in 2016-17. This weak projected growth is largely explained by the OBR’s expectations that real earnings will grow slowly over the next five years. Indeed, even if earnings grow one percentage point faster than the OBR forecast – which would imply stronger growth than almost all forecasters expect – we still project annual income growth would be below its historical average of 2%.
...leaving real median income in 2021-22 substantially below its long run trend
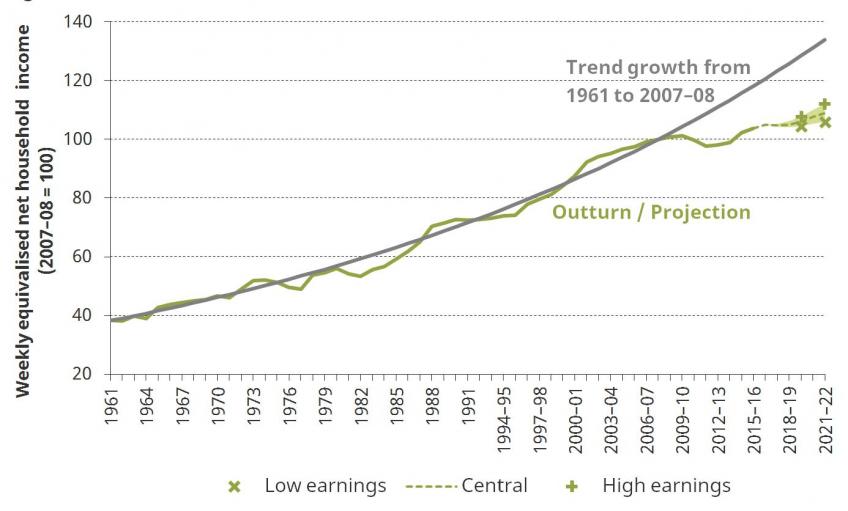
Figure 6. Real median income, 1961 to 2021–22 [download the data]
Note and sources: See Figure 1.
Figure 6 shows real median equivalised household income between 1961 and 2015-16, together with our projection up to 2021-22 and the pre-recession trend. As with the previous figure, we also illustrate ‘high’ and ‘low’ earnings scenarios, under which earnings grow one percentage point per year faster or slower than the OBR expect. The figure shows that five years from now real median income is likely to be more than 15% below where we might have expected before the recession given the long run trend – even if earnings grow one percentage point faster each year than the OBR expect (the ‘high earnings’ scenario). This gap is equivalent to over £5,000 per household. There is no point over the last 60 years at which average income has been so far below the level implied by its historical trend growth rate.
Despite this spectacularly poor period of income growth, it is worth remembering that even in our low earnings scenario the level of real median income in 2021-22 is likely to be around double what it was in the early 1980s.
Inequality is projected to rise over the next five years...
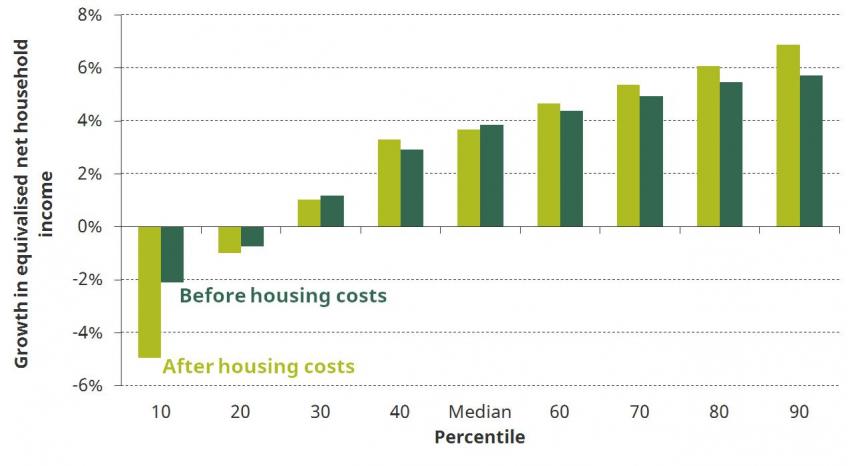
Figure 7. Projected change in income between 2016-17 and 2021-22 at selected percentiles, before and after housing costs have been deducted [download the data]
Note and sources: See Figure 1.
While income inequality has fallen slightly since the recession, Figure 7 shows a projected increase in inequality over the next five years. We project real income falls at the 10th and 20th percentile, particularly when measured on an AHC basis, and modest rises in the top half of the income distribution.
The reason for this pattern is twofold. First, the OBR expect real earnings to rise over the period, but employment to be little changed. Since earnings make up a larger share of income for higher income households, rising real earnings tend to benefit higher income household more than lower income ones. Conversely, rising employment tends to benefit lower income households more than earnings growth for those already in work. Hence if OBR forecasts turn out to have been over-optimistic on earnings growth and under-optimistic on employment growth, inequality would likely increase by less than projected (and may not increase at all). In fact this is essentially what has happened over the past five years.
The second reason for the projected rise in inequality is cuts to working-age benefits. Since the vast majority of working-age benefit spending is targeted at lower income households, real cuts in these benefits tend to reduce incomes among those households the most. Of particular importance here is the freeze in working-age benefit rates until March 2020, the limiting of entitlement to two children in tax credits, and the roll-out of universal credit.[4]
... with the incomes of low-income households with children projected to fall in real terms
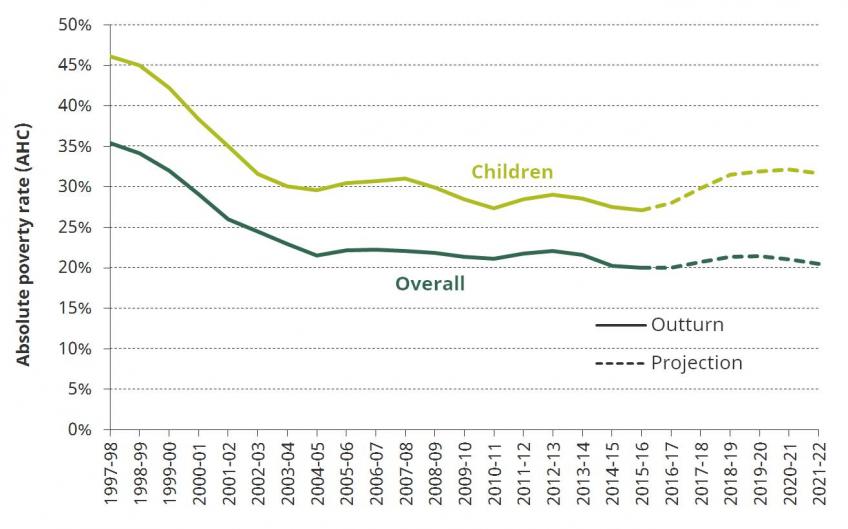
Figure 8. Absolute poverty rates measured after housing costs have been deducted, overall and children, 1997-98 to 2021-22 [download the data]
Note and sources: See Figure 1.
Figure 8 shows our projection for overall and child absolute poverty, measured on an AHC basis. We project a rise in absolute child poverty (implying a real fall in the incomes of low-income families with children), taking it back to around the rate it was at in the early 2000s. This increase is explained by planned cuts to working-age benefits, which are a major source of income for these households.
Our projection suggests little change in overall absolute poverty rates in the coming years, extending the pattern seen since 2004-05. This stability might seem somewhat surprising since we project real AHC income falls at the 10th and 20th percentiles of the distribution. The explanation is that our projections suggest falls in income only in the bottom 20% or so of the income distribution. Since the poverty rate is around 20%, incomes are projected to fall primarily for the part of the distribution already below the poverty line.
Notes
[1] Note that these averages do not say anything about the prospects of particular young or old people, as the individuals included in the groups change over time as people age. This is particularly important for those over 65, where part of the reason for strong growth is the higher pension entitlements of the newly retiring.
[2] See Chapter 3 of Belfield et al. (2016).
[3] These projections use the OBR’s November 2016 forecast, rather than the March 2017 forecast. However, for the variables we use (primarily earnings, inflation, and employment) there was little change between the two, and so our projections are little affected. This is discussed in further detail in Appendix A.
[4] See Hood and Waters (2017b).
Please see pdf version of this briefing note for appendices.
IFS Election 2017 analysis is being produced with funding from the Nuffield Foundation as part of its work to ensure public debate in the run-up to the general election is informed by independent and rigorous evidence. For more information, go to http://www.nuffieldfoundation.org.
