Downloads
Download the report as a PDF
PDF | 1.36 MB
Executive summary
The UK government is consulting on significant reforms to how funding from central government is allocated between English councils. From 2026–27, there will be a new system for allocating funding between councils, which will take account of new official assessments of councils’ spending needs and their relative abilities to raise revenues themselves via council tax. Changes will be phased in over three years to ease the transition, with funding floors in place to limit losses for those receiving less funding under the new system than currently.
These reforms are welcome: for arguably 20 years, England has lacked a rational system for allocating funding between councils. But after so long without such a system, reintroducing one will mean a significant redistribution of funding around the country. And there are different options for key elements of the system, which could have significant effects on the financial impacts of the final package of reforms.
This report therefore analyses the potential impact of the proposed reforms across councils, and how this will depend on choices the UK government makes about several key elements of the new system. It can be read in conjunction with our formal response to the government’s consultation. Because key elements of the system are still being consulted upon, and the government plans to take account of new data when calculating the final funding allocations for councils, the figures in this report should be taken as indicative of general patterns and trade-offs, rather than as precise forecasts.
The government’s proposed approach
As part of its consultation, the government has set out its proposed approach for most parts of the new funding allocation system, and a three-year transition to new funding allocations:
- Differences in spending needs due to differences in the demand for and cost of delivering local services will be accounted for. The government proposes separate spending needs formulas for certain services (adult social care, children’s services, home-to-school transport, temporary accommodation, highways maintenance and fire services) and a general formula (the Foundation Formula) for other services. Differences in labour, property and travel costs would be accounted for, potentially with an adjustment for ‘remoteness’ also being made.
- An assessment will be made of how much councils can raise via council tax, based on modelled revenues if their tax rate was equal to the average tax rate across all councils. Adjusting for these resources is intended to achieve ‘full equalisation’ of revenue-raising capacity, i.e. to ensure that councils would receive the share of overall funding that they are assessed to need, if they were to set their council tax level to the national average.
- Assessments of spending needs and revenue-raising capacity will be fully updated again at some point in the future (likely three or six years). In the interim, the government proposes to account for projected changes in population and assumed increases in council tax levels, but not to account for changes in council tax bases (i.e. the number of properties on which council tax is levied).
- Every council’s new funding allocation will be phased in over three years in equal steps (i.e. one-third each year), and funding floors will be applied to limit losses for those councils seeing cash-terms reductions in funding.
Key areas still under discussion
While the government makes clear its proposed approach in most areas, there are several areas where responses to the ongoing consultation may lead to changes that have important implications for councils’ funding. Particularly important are:
- The assumed council tax rate used for assessing revenue-raising capacity. Setting this assumed (‘notional’) council tax rate below the actual average would mean taking less account of councils’ revenue-raising capacity, allocating more central government funding to councils whose share of assessed revenue-raising capacity is higher than their share of assessed spending needs. This was the approach historically taken in England and currently taken in Scotland.
- Whether to account for projected changes in population, tax base growth and assumed tax rate increases in future years.
- The weights to apply to different services when assessing councils’ overall spending needs.
Key findings
- The reformed funding allocation system will redistribute significant amounts of money between councils. If it was introduced in full immediately, we estimate that the government’s baseline reform proposals would see funding reduced by a combined £2.1 billion for 186 councils, and increased by the same combined amount for 161 others. One-in-ten councils would see a fall in overall funding (including from council tax) of 14% or more, while another one-in-ten would see an increase of 10% or more.
- The government does not propose to move immediately to the updated allocations but instead to phase them in over three years, and provide funding floors for those councils due to see cash-terms reductions in funding. Over this period, increases in grant funding from central government, business rates and especially council tax will increase the average council’s overall funding by close to 15% in cash terms compared with this year, or 8% in real terms. However, we estimate that around one-in-four councils would see a real-terms fall in overall funding over the next three years, with around 30 on the lowest funding floors seeing real-terms cuts of 11–12%. Conversely, another one-in-four councils would see a real-terms increase of 12% or more.
- Different types of councils would fare differently. The biggest losers are set to be inner London boroughs, and especially those in inner West London. In particular, we estimate that Camden, Hammersmith & Fulham, Kensington & Chelsea, Wandsworth and Westminster would see funding fall by over a quarter if the reforms were introduced immediately, and would all be on the lowest funding floor and so face a real-terms cut of 11–12% over the next three years even if they increased their council tax by the maximum allowed each year. Shire district councils see the widest range of impacts, with some losing significantly as their growth in business rates revenue is redistributed to other areas (e.g. Cherwell, Mid Suffolk and North West Leicestershire). Other more urban shire districts (e.g. Crawley, Harlow and Norwich) are set to be the biggest winners from the reforms.
- The government has highlighted deprivation as a factor it thinks leads to higher spending needs. It is therefore somewhat surprising that, on average, councils in the most deprived 30% of areas would see very similar changes in overall funding over the next three years to those for councils in the middle 40% of areas. Similarly, after losing out in the 2025–26 Local Government Finance Settlement, rural areas feared losing from these reforms. However, the average change in overall funding for councils in the least densely populated tenth of areas in England is set to be the same as the average for England as a whole. This likely reflects the inclusion of a ‘remoteness adjustment’ in the spending needs assessments which increases assessed needs for councils far from large towns. Some of the biggest gainers from the full set of reforms are areas with high but not the highest population densities, mainly consisting of outer London boroughs, urban unitary authorities (such as Blackpool, Nottingham and Slough) and metropolitan districts (such as Manchester and Wolverhampton). These would gain even more if the ‘remoteness adjustment’ was not included.
- Regionally, London is the biggest loser, with a cash-terms increase in funding of only 8% over the next three years. This is driven by large losses in inner London (–1%), with outer London as a whole set to fare slightly better than average (+15%). Outside of London, the East Midlands (+22%) and Yorkshire & the Humber (+19%) are set to see the biggest increases in funding over the next three years under the baseline reform proposals, with the South East set to see the smallest increases (+13%).
- A key aim of the government is for the reforms to align funding more closely with councils’ needs. While true spending needs are unknown, it is possible to compare the share of funding that councils receive with their share of assessed needs under the government’s proposed new assessments. Stripping out the effects of councils’ decisions to set above- or below-average council tax rates (which they must bear the financial effects of), we estimate that by 2028–29, the vast majority (85%) of councils will receive a share of funding within 2% of their share of spending needs, compared with fewer than one-in-five in the absence of reform. The exceptions would be those councils on funding floors, which would continue to be ‘over-funded’ compared with their assessed needs, despite facing significant real-terms cuts.
- Rather than assess councils’ revenue-raising capacity using a notional council tax rate equal to the average rate charged by councils, the government could use a lower rate. This would make sense if it felt local areas where households pay more tax for a given band D tax rate, due to more properties being in higher tax bands, should be able to benefit from higher spending or lower tax rates. However, taking less account of council tax revenue capacity by setting a notional tax rate much below the average tax rate would mean deprived areas (which can raise less from council tax) would see smaller increases in funding over the next three years than affluent areas (which can raise more from council tax). For example, a notional council tax rate equal to 85% of the actual average would mean the most deprived three-tenths of councils would see an increase of 13%, compared with 15% for the least deprived three-tenths. Similarly, not accounting for future increases in the average council tax rate would penalise more deprived areas.
- The government proposes to account for differences in projected population growth when setting funding allocations for future years. However, population projections are subject to significant errors which means that it is unclear whether using them would better align funding with need than not accounting for projected growth. The government could therefore instead choose to wait until the next full reset of spending needs assessments before updating population figures (based on actual changes in populations). If it did this, the tenth of councils with the lowest projected growth in population would have 1.4% more funding in 2028–29 than under the baseline proposals, and the tenth of councils with the fastest projected growth in population would have 1.4% less funding.
- The government proposes to use the share of spending on different services in 2023–24 to weight the contribution of each service to its overall assessments of councils’ spending needs. However, recent years have seen a growing fraction of spending go towards social care services, temporary accommodation, and home-to-school transport for children with special educational needs. The government could choose to project forward the spending shares. If it were to assume recent trends were to continue, for example, our modelling suggests outer London boroughs and shire counties would see small increases in funding compared with its baseline proposals. But shire districts and fire authorities would potentially see much smaller increases in funding, as most spending on these services is undertaken at upper-tier council level (social care and home-to-school transport) or in urban areas (temporary accommodation).
1. Introduction
As highlighted in numerous reports (e.g. Local Government Association, 2024; Muldoon-Smith et al., 2024; Phillips, 2024), England has for too long lacked a proper system for allocating funding from central government between councils. Instead, the last 12 years have seen a series of ad hoc changes in funding for different councils that have not reflected changes in their populations, let alone other characteristics (such as deprivation and ill health) that affect their spending needs. And, at least according to the spending needs formulas used between 2006–07 and 2013–14, these ad hoc changes led to councils serving the most deprived communities receiving too small a share of funding, with those serving the least deprived communities receiving too large a share of funding (Ogden et al., 2022 and 2023).
It is therefore welcome that the UK government is consulting on reintroducing a more rational system for allocating funding between councils as part of its broader plans for local government funding reform (Ministry of Housing, Communities and Local Government, 2025b). This will include revised and updated assessments of councils’ spending needs, as well as of their abilities to raise revenues themselves via council tax. The above-baseline growth in local business rates revenues that councils have retained since 2013–14 will be redistributed in line with these new assessments. And there will be a three-year transition to the new funding allocations (between 2026–27 and 2028–29), with funding floors capping the fall in funding for those councils set to see a cash-terms reduction under the new system. Broader changes to funding arrangements will see the consolidation of smaller grants into larger funding pots, a review of reporting requirements and statutory duties, and potential changes to how fees and charges for certain services are set.
After many years without a proper system for allocating funding between councils, the new system will entail a significant redistribution of funding. While the consultation makes clear the government has preferred approaches for many elements of the new system, it does leave open the possibility of changes based on feedback from councils and stakeholders. Individual councils will need to understand the impact of both the government’s proposed approach and alternative options as they plan their response to the consultation, and update their medium-term financial plans. The Local Government Association (LGA) and specialist consultancies will be supporting councils to do this. But it is also important to understand the impacts across types of councils and places: what are the patterns of likely winners and losers? Do the impacts align with the government’s stated objectives for reform? And are there tweaks to the reforms that could better achieve the government’s stated objectives?
This report therefore analyses how the proposed reforms could affect different types of councils (such as county councils, district councils and unitary councils) and different types of places (such as more deprived and less deprived areas, and different regions). It proceeds as follows. Chapter 2 sets out the government’s proposed approach for the new funding system and analyses impacts by council type, local area characteristics and region. Chapter 3 then examines how different options for some key features of the system will affect the distribution of funding across councils. Chapter 4 offers concluding remarks. Appendix A provides information on our modelling approach, including assumptions we have made where the UK government’s consultation document does not provide full details on what the government intends.
2. The potential impact of the government’s approach
This chapter analyses the impact of the government’s proposed approach to the reform of how central government funding is allocated to local councils. It first sets out the key elements of that proposed approach, and then analyses impacts across councils: by type; by the characteristics of their local areas; and by region of the country. It goes on to analyse the extent to which the reforms will achieve the government’s aim of aligning funding with spending needs.
2.1 The government’s proposed approach
Following its first consultation on the principles of local government finance reform (Ministry of Housing, Communities and Local Government (MHCLG), 2025a), the government’s latest consultation (MHCLG, 2025b) invites views on a more specific set of proposals for the English local government finance system from 2026–27 onwards. Most of these relate to how central government funding allocations for different councils are calculated, and these are the focus of this report.
We understand that the government’s proposed approach to reforming funding allocations consists of the following:
- Accounting for differences in spending needs due to differences in the demand for and cost of delivering local services.
- The government proposes separate spending needs formulas for certain services (adult social care, children’s services, home-to-school transport, temporary accommodation, highways maintenance and fire services) and a general formula (the Foundation Formula) for other services. Each formula is based on the characteristics of councils and their populations, with a set of weights to apply to these characteristics estimated based on either statistical analysis of their relationship with spending (or service usage) or judgement of their importance for spending.
- The government proposes to account for council-level differences in labour costs, property costs and travel times for service providers. Differences in these costs would be estimated using a mix of survey, administrative and geographic data, and their weights in councils’ overall costs would be based on a mix of budget and survey data.
- The government proposes to weight the formulas for different services based on the average share of councils’ spending on these services as of 2023–24 when calculating overall spending needs assessments.
- Accounting for how much councils can raise themselves via council tax.
- The government proposes to assess this using an assumed council tax rate (a ‘notional’ rate) equal to the average council tax rate across all councils, in order to achieve ‘full equalisation’ of revenue-raising capacity.
- When assessing revenue-raising capacity, the government proposes to take full account of mandatory council tax exemptions and discounts and no account of discretionary council tax discounts and premiums that councils decide for themselves. It will take full account of mandatory pension age means-tested council tax support (CTS) and will use a statistical proxy to account for discretionary working-age CTS.
- The government also proposes to assume a common council tax collection rate across all councils, rather than accounting for differences in how often residents do not pay the tax that is due.
- Fully resetting the business rates system from 2026–27.
- Accrued above-baseline growth in business rates revenues, which councils have been able to retain since 2013–14, will be redistributed based on updated assessments of needs.
- Following this redistribution of past growth, councils will be able to benefit from future growth in business rates revenues from 2026–27 onwards, until the system is reset again.
- Projecting forward certain key variables over time to help keep the system more up to date in between full updates of assessments of spending needs and revenue-raising capacity.
- The government proposes to account for projected changes in population in assessing councils’ relative spending needs.
- The government also proposes to account for assumed increases in council tax rates.
- In contrast, the government does not propose to account for assumed increases in council tax bases (i.e. the number of properties subject to council tax) except when calculating overall revenues for the application of a funding floor (see below).
- Phasing in every council’s new funding allocation over three years.
- The government proposes to phase in new allocations in equal steps between 2026–27 and 2028–29 (i.e. one third each year).
- The government also proposes to apply funding floors for those councils seeing cash-terms reductions in funding. These floors would be between 0% and –7% depending on the size of funding cut faced by different councils.
These plans may change as a result of consultation responses, and some of the data underlying particular aspects of the system (such as measures of deprivation, local labour costs and local tax bases) are subject to updating prior to the introduction of the new system. Bearing this in mind, we model the impact across councils of what we term the government’s ‘proposed’ approach to reform. The consultation document does not provide enough detail to be confident of modelling the reforms precisely as government intends them to be implemented. Although MHCLG has provided clarifications and suggested specific modelling approaches to us and other organisations modelling the reforms, we have necessarily had to make some assumptions about specific elements of reforms in order to produce estimates of the impacts of reforms.
Information on these assumptions is provided in Appendix A. Most importantly, we assume the following:
- The £3.4 billion in additional grant funding confirmed for local government in the 2025 Spending Review is phased in linearly between 2026–27 and 2028–29 (i.e. £0.567 billion in 2026–27, £1.133 billion in 2027–28 and £1.7 billion in 2028–29).
- The notional council tax rate assumed by the government would increase in line with Office for Budget Responsibility (OBR) forecasts, and the actual council tax charged by councils would increase in line with referendum limits.
- All above-baseline growth in business rates revenues since 2013–14 is redistributed as part of updated funding allocations, including growth in areas with enhanced business rates retention pilots.
- The weights applied to the spending needs formulas for different services when assessing overall spending needs are held fixed.
- A funding floor of –6% relative to overall funding in 2025–26 applies to all councils that would see a fall of more than 5%, with a floor of 0% applied to all other councils.
- And we exclude the Greater London Authority from all calculations and analysis, because no information is as yet available for how funding for its non-fire responsibilities (including for Transport for London) will be calculated.
Following discussions with MHCLG, we believe these are reasonable assumptions. But together with changes as a result of consultation responses, and updates to data, the fact that ultimate decisions will likely differ somewhat from these assumptions means that our modelling results should be taken as indicative rather than definitive.
2.2 Impact of the government’s approach across types of councils and places
Given this, our analysis focuses on impacts across groupings of councils: their type (e.g. district, county, unitary authority); their level of deprivation and urbanity; and their geographical location (e.g. North East, South East of England). There is significant variation within these groupings though, reflecting the complex interactions between the different elements of the new funding system, and the ad hoc and outdated nature of current funding allocations. We discuss the scale of variation and highlight a few councils we are confident are ‘outliers’ for their groups, but refrain from providing full council-level figures given the remaining uncertainties in the modelling. As discussed in the introduction, councils will be working with specialist consultancies to understand impacts for their specific areas.
We illustrate the impacts of the proposed funding reforms in two ways:
- First, we show how funding from government grants, business rates and council tax in each of 2026–27, 2027–28 and 2028–29 compares with the funding received in 2025–26, accounting for phasing and funding floors.
- Second, to isolate the effects of the reforms themselves (from increases in the total amount of funding being provided in grants, business rates and council tax), we estimate the impact of the reformed system if it came in fully in the current financial year, 2025–26. Doing it for this year, rather than a future year (such as 2028–29) means that we do not need to make an assumption for how funding would have been allocated in the absence of reforms.
We estimate that if they were fully in place this year, the reforms would reduce funding for 186 councils by a combined total of £2.1 billion, increasing funding for 161 others by an equivalent amount.
Impacts by council type
Table 2.1 shows results by council type. The first three columns show our estimates of how cash-terms funding would change over each of the next three years compared with the current financial year, 2025–26, including the effects of phasing and funding floors. The final column shows our estimates of the impact of the funding reforms themselves, based on if they were fully in place in the current financial year (and without funding floors). This gives an indication of their long-term effects (after the funding floors eventually expire).
Table 2.1. Changes in cash-terms funding compared with current financial year (2025–26), by council type

Note: First three columns show our estimates of cash-terms changes in overall funding since 2025–26, under the government’s baseline reform proposals (including the impact of phasing and funding floors). ‘Reforms’ column shows our estimates of the impact of the funding reforms themselves, based on if they were fully in place in the current financial year (and without funding floors).
Source: Authors’ calculations.
The table shows that, on average, councils of all types bar inner London boroughs would see cash-terms increases in funding (and indeed real-terms increases in funding) over the next three years under our baseline scenario for the reformed funding system. Shire districts and fire authorities would see smaller cash-terms increases (10–12% by 2028–29) than the upper- and single-tier councils outside of inner London (15–17%, on average). Inner London boroughs would, on average, see around a 1% cash-terms fall in funding between this year and 2028–29 even with the funding floors, which translates into a real-terms fall in funding of around 7%. This reflects declines in inner London boroughs’ share of assessed needs, and the effect of accounting for council tax revenue-raising capacity assuming a notional tax rate of 100% of the average for England as a whole in areas where many properties are in high council tax bands but the tax rates charged are low (such as Camden, Kensington & Chelsea, Westminster and Wandsworth).
These figures though include the impact of increases in the overall amount of funding for local government over the next three years – from higher council tax and business rates revenues and increases in grant funding from central government. Isolating the effects of the reforms themselves, the final column of the table shows that if the updated funding allocations were introduced immediately, without floors, inner London boroughs would see a reduction in funding of nearly one-fifth (–19%). There would also be small reductions, on average, for shire districts (–3%) and fire authorities (–3%), and counties would see little change. There would be small increases (2–3%), on average, for outer London boroughs, metropolitan districts and unitary authorities.
There is a wide range of impacts within these groupings, and especially for shire district areas. Shire districts (alongside inner London boroughs) make up most of the biggest losers from the updated funding allocations, but also some of the biggest gainers. For example, if the reforms were introduced in full this year, Cherwell, Cotswold, Harborough, Mid Suffolk and North West Leicestershire are estimated to see falls in funding of a quarter or more, driven to a large extent by the redistribution of the significant above-baseline business rates growth they currently enjoy. At the other end of the spectrum, a number of more urban shire district authorities, such as Crawley, Harlow, Norwich, Stevenage and Worthing, are estimated to see an increase in funding of over a fifth, with reductions in their shares of assessed spending needs being more than offset by the currently separate grant funding (largely for social care) being rolled into the funding allocation system and the reintroduction of council tax equalisation. Looking at overall changes in funding between this year and 2028–29, including the impacts of funding floors, while multiple shire districts would be on the funding floors (of up to –7%), districts such as Crawley, Harlow, Norwich, Stevenage and Worthing would see increases in funding of a third or more.
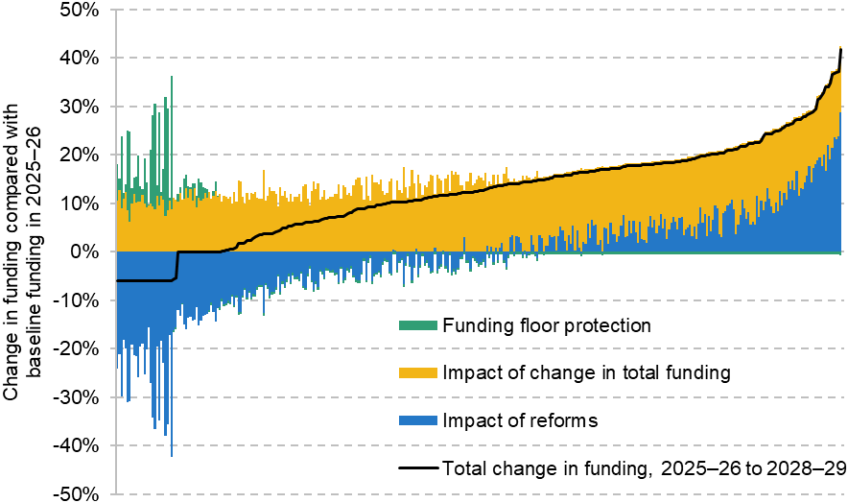
More generally, Figure 2.1 shows our estimates of the change in funding by council. The blue bars show how funding would change if the baseline reform system were introduced in full this year, the yellow bars the impact of changes in overall funding between 2025–26 and 2028–29 (such as increases in council tax and business rates revenues and grant funding) under the reformed system, and the green bars the amount of funding floor protection received as of 2028–29. The black line shows the overall cash-terms change in funding between this year and 2028–29 taking account of funding floors and the funding top-sliced from the Local Government Finance Settlement to fund the floors.
Figure 2.1. Breakdown of percentage cash-terms changes in funding compared with current financial year (2025–26) for individual authorities
Note: Negative funding floor protection for most areas reflects assumption that floor protection is funded by reducing funding allocations to all authorities. Includes fire authorities.
Source: Authors’ calculations.
The graph shows that we estimate just under half of councils would gain if the reformed system were to be introduced in full this year, but around 60 would see losses of more than 10% of their funding. With assumed growth in council tax and business rates revenues and grant funding, some of these will nonetheless see small cash increases in their funding between 2025–26 and 2028–29. We estimate around 45 of these councils would receive some floor protection in 2028–29 (positive green bars), with some seeing their funding flat in cash terms as a result, and others subject to a lower floor and seeing cash-terms cuts. We estimate around 30 councils will see their funding increase by at least a quarter in cash terms (18% in real terms) over the next three years.
Impacts by local area characteristics
Deprivation
Figures 2.2 and 2.3 show results by upper-tier council-level deprivation according to the 2019 English Index of Multiple Deprivation (IMD), pooling shire districts and counties in two-tier areas. Figure 2.2 shows our estimates for the changes in funding for the next three years compared with the current financial year, 2025–26. Figure 2.3 shows our estimates of the impact of the funding reforms themselves, based on if they were fully in place in the current financial year.
Figure 2.2 shows that, on average, upper-tier council areas of all levels of deprivation are set to see increases in funding over each of the next three years. We estimate the increases to be substantially larger for the most deprived tenth of areas (18%) than for the least deprived tenth (9%) – which is barely any increase in real-terms (just 2.6% over these three years). But more generally, there is no consistent pattern across levels of deprivation, with the increases for the fourth most deprived and seventh most deprived groups being similar to that for the most deprived group, for example. Indeed, the average estimated change in funding over the next three years for the councils in the middle four deprivation decile groups is very similar to the average for those in the three most deprived deciles (9.6% versus 9.8% in real terms). One of the government’s stated objectives for the reforms was to ensure that deprived areas – which previous research at IFS has shown faced bigger cuts to funding in the 2010s which have only been partially undone (Ogden and Phillips, 2024a) – received an appropriate share of funding. It is therefore perhaps surprising that there is not a stronger link between deprivation and estimated funding changes. It is worth noting though that the increases in grant funding this year (2025–26) – including the introduction of a new £600 million ‘Recovery Grant’ – were highly targeted at councils serving deprived areas (Ogden and Phillips, 2024b). These changes were badged as a stepping stone to the wider reforms now being consulted on.
Figure 2.2. Cash-terms changes in funding compared with current financial year (2025–26), by deprivation decile group of upper-tier council area (%)

Note: Areas grouped by decile of area deprivation (average score from IMD2019) at the upper-tier local authority level. Excludes separate fire authorities.
Source: Authors’ calculations.
Turning to changes in funding as a result of the reforms themselves, Figure 2.3 strips out the effects of increases in funding over the next three years to focus on the effects of the reforms themselves. This does show a slightly stronger relationship. For example, while we estimate that the baseline reform system would increase funding by 3%, on average, for the three most deprived decile groups of upper-tier council areas, it would increase it by 1%, on average, for the middle four decile groups, and reduce it by 3%, on average, for the three least deprived groups. As we show in Section 2.3, this pattern largely reflects the high level of equalisation (100%) for council tax revenue-raising capacity proposed by the government.
Figure 2.3. Cash-terms changes in funding as a result of the reforms (as if in place in 2025–26), by deprivation decile group of upper-tier council area (%)

Note: Areas grouped by decile of area deprivation (average score from IMD2019) at the upper-tier local authority level. Excludes separate fire authorities.
Source: Authors’ calculations.
As with council types, there is significant variation in estimated impacts of reform within deprivation decile groups. For example, if the reformed system were introduced in full this year, we estimate that a few council areas among the most deprived fifth would see small reductions in funding, while a few others would see increases in funding of over 10% (Bradford, Nottingham and Middlesbrough). Conversely, among the least deprived, while some upper-tier council areas (such as Bracknell Forest and Windsor & Maidenhead) are estimated to see reductions in funding of over 10% as a result of the reform, at least one (Rutland) is estimated to see an increase. Again the differentiated pattern reflects the interaction of the different elements of the reform system and the ad hoc allocations councils receive under the current system.
Population density
Table 2.2 shows results by population density of upper-tier council area, pooling shire districts and counties in two-tier areas. Given concerns that rural areas would lose out from the reforms to the local government finance system (as they did from the 2025–26 Local Government Finance Settlement), it is perhaps surprising that there is no strong consistent pattern with respect to population density over most of the distribution of population density. Indeed, the areas with the least dense populations are set to see a similar change in funding over the next three years to the average for England as a whole. This likely reflects the fact that the government’s baseline reform proposal includes a ‘remoteness adjustment’ in the new funding system, which increases the assessed spending needs of council areas far from large towns (defined as those with a population over 75,000 or more), which will also typically be the most rural and least densely populated.
Table 2.2. Cash-terms changes in funding compared with current financial year (2025–26), by population density of upper-tier council area

Note: Excludes separate fire authorities. Areas grouped by decile of population density at the upper-tier local authority level. First three columns show our estimates of cash-terms changes in overall funding since 2025–26, under the government’s baseline reform proposals (including the impact of phasing and funding floors). ‘Reforms’ column shows our estimates of the impact of the funding reforms themselves, based on if they were fully in place in the current financial year (and without funding floors).
Source: Authors’ calculations.
Those areas that are relatively densely populated (decile groups 7 to 9) are set to see above-average increases of 17–19%. But the most densely populated tenth of council areas is set to see just a 1% cash-terms increase in funding over the next three years, equivalent to a 5% real-terms cut. This reflects the fact that most of this group is made up of inner London boroughs which, as mentioned above, look set to fare particularly poorly from the funding reforms.
This can be seen even more clearly in the final column of the table, which isolates the effects of the reforms themselves and models them as if they were fully in place this year. This shows that the most densely populated tenth of councils would see a 15% reduction in funding under such a scenario, compared with increases of 4–5% for the next most densely populated groups, and little change for the least densely populated group.
As with council types and deprivation groups, there is significant variation within these population density groups though. For example, among the least densely populated tenth of upper-tier council areas, some such as Cumberland and Westmorland & Furness would see their funding fall by over 5% if the reformed system were fully introduced immediately. Conversely, the councils making up Lincolnshire are set to see an increase of around 10%. Similarly, whereas four inner West London councils in the most dense tenth of councils would see falls of around 30% or more (Hammersmith & Fulham, Kensington & Chelsea, Wandsworth and Westminster) if the reforms were introduced fully immediately, parts of outer East London (Newham and Waltham Forest) in this group would see reductions less than a tenth as large. This again illustrates the highly variable impacts of the reforms across councils.
Impacts by region
Table 2.3 shows results by region, and again pools shire districts and counties. The reductions in funding for London have already been discussed. The final column of the table shows that the reforms themselves are also set to slightly reduce funding for councils in the South East and South West of England, on average. In contrast, funding is set to increase most for the East Midlands and Yorkshire & the Humber. Councils in the South East of England, where many properties are in high council tax bands, are likely to be adversely affected by the reintroduction of assessments of council tax revenue-raising capacity and the notional tax rate of 100% of the average that the government proposes to use. Increases for the East Midlands and Yorkshire & the Humber are likely to reflect a range of factors, including having more properties in lower tax bands (and so gaining from council tax equalisation) and benefiting from updates to spending needs assessments. Gains in the North East may be lower than expected given its low council tax revenue capacity, in part because its population has grown slowly in recent years (and the updated funding allocations will account for this).
Table 2.3. Cash-terms changes in funding compared with current financial year (2025–26), by region

Note: Regions in order from north to south of England, in line with official region numbers. Excludes fire authorities. First three columns show our estimates of cash-terms changes in overall funding since 2025–26, under the government’s baseline reform proposals (including the impact of phasing and funding floors). ‘Reforms’ column shows our estimates of the impact of the funding reforms themselves, based on if they were fully in place in the current financial year (and without funding floors).
Source: Authors’ calculations.
Of course, each region sees significant cross-council variation. For example, the East Midlands sees both some of the biggest losers at the shire district level (such as North West Leicestershire, Harborough, South Derbyshire and Rushcliffe) and some of the gainers in its more urban districts and unitary authorities (such as Derby, Lincoln, Mansfield and Nottingham). And while the South East sees some of the largest falls for upper- and single-tier councils outside of London (such as Windsor & Maidenhead, Wokingham, Bracknell Forest and Surrey), it also sees some large gains among its shire districts (Crawley, Worthing, Epsom & Ewell and Fareham).
2.3 Will the reforms help align funding with spending needs?
An important aim of the government’s reforms is to ensure local government funding is ‘fair and better aligned with relative need, cost and resources’ (MHCLG, 2025b). Once the government’s reforms have been fully phased in (in 2028–29), to what extent will they achieve this alignment? In Figures 2.4 and 2.5, we show the percentage difference between each council’s share of overall local government funding and its share of assessed spending need, and term this the ‘gap between relative funding and relative spending needs’, as in Ogden et al. (2023). If funding were perfectly aligned to needs, every council would have a gap of 0%. In each case, we use the government’s proposed assessments of relative needs to reflect its view of how needs are distributed across councils.
Figure 2.4 shows the gaps between relative funding and relative needs given the council tax rates actually set by different councils. The horizontal axis shows our estimates of the size of the gaps in 2028–29 if the local government funding system was not reformed, and if instead each council retained its above-baseline business rates growth, received the same share of grant funding as in 2025–26, and made maximum use of flexibilities to increase council tax each year. The vertical axis shows our estimates of the size of the gaps in 2028–29 if the local government funding system is reformed in line with the government’s baseline proposals. The graph shows that under both the unreformed and reformed system, many councils would have shares of funding that significantly differ from their shares of assessed spending need. For example, one-in-ten councils would have a gap of –12% or below in 2028–29 in the absence of reform (meaning a share of funding at least 12% below their share of needs), whilst another one-in-ten would have a gap of +14% or above (meaning a share of funding at least 14% above their share of needs). The fact that the trend line is less steep than the 45-degree line shows that, on average, gaps would be somewhat smaller under a reformed local government finance system. For example, one-in-ten would have a gap of –10% or below, while another one-in-ten would have a gap of +11% or above. Under the reformed system, it is areas that set above-average council tax rates in 2025–26 (purple) that are estimated to have funding above their share of needs in 2028– 29, and the converse for those setting below-average council tax rates (yellow). This would not be the case in the absence of reform.
Figure 2.4. Projected gaps between relative funding and relative spending needs under unreformed funding system and government’s baseline reform proposals, with actual council tax

Note: ‘Gap between relative funding and relative spending needs’ is the percentage difference between each local authority’s share of overall local government funding and its share of assessed spending need.
Source: Authors’ calculations.
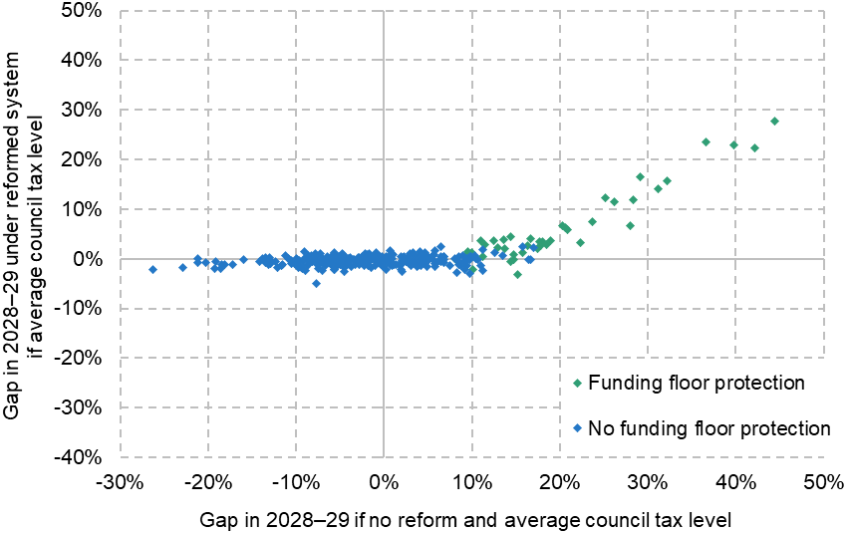
Figure 2.5 shows that the funding gaps in 2028–29 if the system was reformed would largely be explained by two factors though: variation in the council tax charged by councils; and the funding floors protecting some councils from very large funding cuts following the reforms. In particular, it shows the scale of relative funding gaps if all councils set their council tax at the average rate for their council type (which is the notional rate used to assess revenue-raising capacity under the government’s baseline reforms). The graph shows that without reform there would still be significant gaps in funding even if all councils set the same tax rate, with fewer than one-in-five councils receiving a share of funding within 2% of their share of spending needs. At the extremes, 30 councils would have a share of funding at least 10% below their share of needs, while around 50 would have a share at least 10% above. The latter group is disproportionately councils that benefit from floor protection under the reformed system.
Figure 2.5. Projected gaps between relative funding and relative spending needs under unreformed funding system and government’s baseline reform proposals, if all set council tax level to the national average
Note: ‘Gap between relative funding and relative spending needs’ is the percentage difference between each local authority’s share of overall local government funding and its share of assessed spending need.
Source: Authors’ calculations.
Under the government’s baseline reform proposals, substantial differences between relative funding and relative needs would remain only for those councils in receipt of funding floor protection in 2028–29 (shown in green), which as a result are relatively ‘over-funded’ compared with the assessment of their spending needs. Overall, 85% of councils would be expected to receive a share of funding in 2028–29 within 2% of their share of spending needs if they set their council tax at the average rate for their council type, which rises to 94% amongst those not receiving floor protection.
It is not a flaw of the system that councils that set higher-than-average (or lower-than-average) council tax receive a share of funding that is higher (or lower) than their share of assessed needs: it is a key part of it. As discussed in our formal response to the government’s consultation (Ogden and Phillips, 2025a), it is important to assess revenue-raising capacity and allocate funding accordingly based on a notional tax rate, rather than on the actual tax rates charged, so that councils’ council-tax-setting incentives are not distorted. Councils should gain (or lose) funding from setting a higher (or lower) tax rate, and so those setting above-average (or below-average) tax rates should receive a higher (or lower) share of overall funding, respectively, than their share of assessed needs.
3. How would different reform options change things?
This chapter examines how different options for particular elements of the system would affect councils across England, and whether tweaks to planned reforms could help the government better achieve its objectives. It is not an exhaustive exercise: the consultation asks questions about too many elements of the funding reform to cover in this report. Instead, we focus on those which may have an important impact on funding allocations, where opinions among councils and stakeholders are likely to differ, and where the government may be open to tweaking its reforms. This includes how and the extent to which to account for council tax revenue-raising power; the use of projections of population, tax base and tax rate growth over the three years covered by the 2025 Spending Review and upcoming multi-year Local Government Finance Settlement; and changes to the weights (or ‘control totals’) for different services in overall spending needs assessments.
3.1 Taking less account of council tax revenue-raising power
We first consider the impact of assessing council tax revenue-raising capacity using a notional council tax rate that is less than the average tax rate.
As discussed in our formal response to the consultation (Ogden and Phillips, 2025b), using a notional tax rate equal to the average would be consistent with an aim that if all councils set the same council tax rate at that average, they should be able to afford the same set of services (at least according to the relative spending needs formulas in place). But alternatively, one may believe that areas with many properties in higher tax bands and where residents typically pay more in council tax should retain some of the benefit to provide a greater quality and/or range of services or to charge lower tax rates. In that case, one would want to assume a notional band D rate that is lower than the average (and perhaps undertake no council tax equalisation whatsoever). Other parts of the UK make different decisions on this: the notional rate is close to the average in Wales (100% equalisation), whereas it is closer to 60% of the average in Scotland (60% equalisation). In the 2000s, England’s system used a rate of approximately 85%. It is therefore worth considering what the impacts of less than 100% equalisation for council tax would be.
Figure 3.1 shows how using notional tax rates of (a) 85% of the average tax rate (in line with historical practice in England) and (b) 60% of the average tax rate (in line with Scotland) would affect the funding allocations for different types of councils (top panel) and by upper-tier council-level deprivation (bottom panel). More specifically, the figure shows the cash-terms change in funding between the current year (2025–26) and 2028–29 under both the baseline assumption (100% of average) and each of these variants.
Figure 3.1. Cash-terms changes in funding between 2025–26 and 2028–29 under baseline approach and alternative systems with lower notional council tax rates

Note: Deprivation groups exclude separate fire authorities.
Source: Authors’ calculations.
Figure 3.1 shows that the degree of equalisation for council tax revenues has a significant bearing on funding allocations. For council types, the biggest effects are on metropolitan districts and shire counties. Under partial equalisation, metropolitan districts would see a substantially smaller increase in funding than under 100% equalisation: for example, if the notional band D rate was set at 60% of the average, funding would increase by an average of 11% between this year and 2028–29, compared with 17% under the baseline assumption of 100% equalisation. This is because metropolitan districts have a higher share of assessed need than of revenue-raising capacity, and so when revenue-raising capacity is accounted for less strongly, less funding is redistributed to metropolitan districts to offset their low revenue-raising capacity. Conversely, for shire counties, the increase would be 21% with a notional council tax rate of 60% of the average, as opposed to 16% under full equalisation. This is because county councils have a higher share of revenue-raising capacity than of assessed need, and so when revenue-raising capacity is accounted for less strongly, less funding is redistributed away from them to support other councils.
The bottom panel of the figure shows that patterns are even stronger when looking at effects by deprivation. As discussed earlier, even under the government’s suggested approach of 100% equalisation, the average change in funding for the most deprived three-tenths of councils is little different from that for the middle four-tenths of councils, but is higher than among the least deprived. However, if a notional council tax rate of 85% of the average rate was assumed, deprived areas would fare worse, with an increase in funding between this year and 2028–29 averaging 13% for the most deprived three-tenths of council areas, compared with 16% (15%) for those with middling (low) levels of deprivation. With a notional rate of 60% of the average rate assumed, the most deprived three-tenths would see an increase in funding of just 9% over the next three years, compared with 15% for the middle four-tenths and 19% for the least deprived three-tenths of councils. Again this reflects patterns of needs and revenue-raising capacity: deprived areas typically have higher shares of assessed needs than of revenue-raising capacity, whereas more affluent areas typically have higher shares of revenue-raising capacity than of assessed needs.
Therefore, if the government wants to avoid the reforms of local government funding adversely affecting more deprived parts of England, it will need to set a notional rate of council tax of close to 100% of the average tax rate charged by councils (at least given other elements of its proposed reforms).
3.2 Not accounting for population projections
The government’s baseline proposals involve using projections of population growth to update its assessments of council spending needs for changes in the number of residents in each council over the Spending Review period. To the extent that population projections are correlated with actual changes in population, and these are correlated with the overall changes in councils’ spending needs (which will also depend on the demographics of local populations, not just their overall sizes), this will help keep the system more up to date in between full updates of spending needs assessments. However, some councils have raised concerns that population projections can be inaccurate, especially given uncertainty about levels of international migration.
It is impossible to know how accurate current population projections will be. However, we note that historically, population projections have been on the borderline of being sufficiently accurate to be appropriate for use in allocating funding, as discussed in our formal response to the consultation (Ogden and Phillips, 2025b). The case for accounting for differences in projected population growth is therefore not clear cut.
Figure 3.2 shows how big a difference not accounting for population would make to changes in councils’ funding over the next three years under a reformed local government finance system. It shows that among council types, the biggest differences would be for outer London boroughs, which would see a bigger increase in funding (of around 16.6% as opposed to 15.3%) over the next three years if its slower projected population growth was not accounted for. It would mean slightly faster growth in funding for the most deprived areas (19.0% versus 18.4%) for the most deprived and slightly slower growth for the least deprived areas (8.0% versus 8.5%), reflecting their below- and above-average projected population growth.
Figure 3.2. Cash-terms changes in funding between 2025–26 and 2028–29 under baseline approach and if not accounting for projected population growth

Note: Deprivation groups exclude separate fire authorities.
Source: Authors’ calculations.
Of course, the biggest differences are between those places projected to have the slowest population growth (or a population decline) and those projected to have the fastest population growth. Not accounting for projected population growth would increase funding for the tenth of councils with the lowest projected growth rates by 1.4% in 2028–29, but reduce it by an equivalent amount for those with the highest projected growth rates. These may seem relatively small differences but would mean that, if population projections are borne out, real-terms funding per capita would grow 2.8 times faster (an average of 3.4% a year compared with 1.2% a year) for those with the slowest projected population growth rates than for those with the highest projected population growth rates (these percentages compare with 2.9% and 1.7% a year, respectively, under the baseline reform proposals). If population projections prove inaccurate though, accounting for them could widen rather than reduce gaps between funding and spending needs.
3.3 Tax base and rate projections
In its baseline reform proposals, the government proposes to account for increases in the notional council tax rate in between full resets of spending needs and revenue-raising capacity assessments, but not any projected increase in the council tax base (i.e. the number of properties) on which this tax is charged. Figure 3.3 illustrates how varying these plans would affect the change in funding for different groups of councils.
Figure 3.3. Cash-terms changes in funding between 2025–26 and 2028–29 under baseline approach and alternative assumptions about council tax rates and bases

Note: Deprivation groups exclude separate fire authorities.
Source: Authors’ calculations.
Compare first the black dots (estimated changes in funding between 2025–26 and 2028–29 under the government’s baseline reform proposals) and the blue dots (the same, but not accounting for assumed increases in the average council tax rate when setting the notional rate for future years). The graph shows that not accounting for increases in the average council tax rate in future years would mean smaller increases in funding over the next three years for metropolitan districts (14.8% versus 16.6%) and bigger increases for shire counties (17.5% versus 16.1%). The bottom panel shows it would mean smaller increases in funding for councils in deprived areas (15.6% versus 18.4% for the most deprived tenth) and bigger increases for those in more affluent areas (11.0% versus 8.5% for the least deprived tenth).
This is because not accounting for increases in the average tax rate over time means that the notional rate falls as a share of the average, reducing the extent to which council tax revenue-raising power is accounted for when allocating central government funding to councils. This hurts areas with weak revenue-raising capacity relative to their spending needs (such as metropolitan districts and deprived areas) and helps areas with strong revenue-raising capacity relative to their needs (such as shire counties and affluent areas).
By not accounting for future projected tax base growth, the government’s baseline reform proposals do not reflect the fact that a given percentage increase in the local tax base (e.g. from new housing construction) raises different amounts for different places. The yellow dots show how funding would change if tax bases for all councils were accounted for under the assumption that all would grow in line with the OBR’s forecast for England as a whole. They show that doing so would slightly boost funding for more deprived areas and reduce funding for more affluent areas. But the effects would be much smaller, reflecting the fact that tax base growth forecasts (1% a year) are slower than tax rate increase forecasts (4.3% a year).
Rather than use the OBR’s national forecast for all councils, another option would be for the government to use council-specific tax base projections: this is what it has typically done when projecting forward councils’ funding from one year to the next as part of the Local Government Finance Settlement, and when setting ‘funding floors’ in recent years. Such projections have been based on historical growth rates, and implicitly assume areas that have seen high tax base growth historically (e.g. due to lots of new housing construction) will continue to see high growth rates in future, and vice versa. Taking account of historical tax base growth in each area would make little difference to patterns by type of council or region but would make a substantial difference for some individual authorities. For instance, if the government chose to use council-specific projections based on historical growth, authorities such as Cornwall, Milton Keynes and South Hams – which have experienced tax base growth of more than 3% per year on average between 2021 and 2025 – would receive at least 3.0% less funding in 2028–29.
3.4 Alternative weights for different services
The government’s baseline reform proposals involve weighting the individual spending needs formulas for different services according to the share of council spending on those services as of 2023–24, when assessing overall spending needs. Implicitly, therefore, the spending needs assessments assume these shares will remain the same in future years. However, as discussed in Ogden and Phillips (2024a), the composition of council spending has been changing over time, with services for high-needs or vulnerable residents (such as adults’ and children’s social care, temporary accommodation, and home-to-school transport, particularly for children with special educational needs) taking up a growing share of councils’ budgets. Table 3.1 shows the weights used under the government’s baseline reform proposal, and variant weights that assume the trend towards a higher share of budgets going towards these high-needs services (and a lower share for other services) continues.1
Table 3.1. Weights (‘control totals’) for different service formulas, 2028–29

Note: The weights applied to each Relative Needs Formula (RNF) to arrive at an overall assessment of relative need for each local authority are termed ‘control totals’ in the consultation documents.
Source: MHCLG (2025) for baseline. Authors’ assumptions for variant.
Figure 3.4 shows that projecting forward the spending weights in this way would, by increasing their shares of assessed needs, increase funding for most upper-tier councils, and especially outer London boroughs and shire counties. Gains to inner London boroughs are muted, on average, because so many are on the funding floor (so any increase in their assessed spending needs just reduces their ‘funding floor protection’, rather than increasing their actual funding). Conversely, shire district councils and fire authorities would see lower funding as their shares of assessed needs would be lower. For example, rather than increase by 9.8% over the next three years under our modelling of the government’s baseline reform proposals, shire districts would see an average increase in funding of just 4.4% in cash terms by 2028–29 – equivalent to a 1.3% real-terms reduction. Several districts, including Broadland, Breckland, Gedling and Lichfield, that might expect real-terms increases in funding of at least 5% under the baseline approach would instead see real-terms reductions.
Figure 3.4. Cash-terms changes in funding between 2025–26 and 2028–29 under baseline approach and alternative spending needs formula weightings

Note: Deprivation groups exclude separate fire authorities.
Source: Authors’ calculations.
The weights applied to different services in the overall spending needs assessment is therefore an important determinant of how different councils will fare in the coming years. The government should therefore consider carefully whether to vary the weights over time as the demands placed on different service areas, and hence on different councils’ budgets, evolve differentially.
4. Concluding remarks
This report has examined the potential impacts of the upcoming reforms to the English local government funding system on the funding that will be available to different councils with different characteristics. Our precise quantitative results should only be seen as indicative – the government has yet to determine the final parameters of the funding system and has not specified its main proposals in enough detail to model them with complete confidence. Several findings stand out though.
First is just how large the funding changes some councils are set to see are. If the full reforms were introduced immediately this year, one-in-ten councils would see a fall in overall funding (including from council tax) of 14% or more, while another one-in-ten would see an increase of 10% or more. Even accounting for a three-year transition (and increases in overall funding during that period) and funding floors for the biggest losers, we estimate that around one-in-four would see a real-terms fall in funding over the next three years, with around 30 on the lowest funding floors seeing real-terms cuts of 11–12%. Conversely, another one-in-four councils would see a real-terms increase of 12% or more.
Second is that while the reforms will align central government funding with assessed spending needs much more closely for most councils, some of the approximately 30 councils on the lowest funding floors will still receive significantly ‘too much’ funding, at least according to the updated spending needs assessments. This begs the question of what happens in 2029–30 and beyond: will these floors continue into the next Spending Review and multi-year Local Government Finance Settlement periods? And how will councils facing potentially five further years on the floor, and hence seeing no cash-terms increase in funding (and perhaps a further 10% real-terms decrease in funding) fare?
Third is that despite big changes in councils’ funding allocations and an expectation that deprived and urban areas would win at the expense of more affluent and rural areas, the government’s baseline funding reform proposals are not particularly redistributive to poor, urban areas of England. Some deprived council areas – such as South Tyneside and Sunderland in the North East – are set to be big losers from the reforms, in part reflecting their slow population growth now being accounted for. And if the government were to move away from its current plan to fully account for differences in how much councils can raise via council tax by setting the notional rate of council tax used to assess revenue-raising capacity below the average rate, then deprived areas would see funding redistributed towards more affluent areas of the country.
Fourth is that the government needs to carefully think how the demands for and costs of the different services that councils provide will evolve over the coming years, and the extent it wants to future-proof funding allocations for these changes. Using the shares of spending on different services in 2023–24 to weight different services when assessing overall spending needs may mean that councils most affected by growing pressures on social care, special needs home-to-school transport, and temporary accommodation, struggle to keep pace with those rising demands. Projecting the demand for and cost of different services is not necessarily straightforward though, especially given uncertainty about how fast and to what extent efforts to reduce financial pressures for these services will bear fruit.
Fifth, these reforms will be taking place at a time when councils are facing significant pressures and other major changes. The reintroduction of a proper system to assess councils’ spending needs and revenue-raising capacity and to allocate funding accordingly is welcome given how arbitrary existing funding allocations have become. Notwithstanding the short-term difficulties it will cause for ‘losing’ councils, it could also help with the longer-term financial sustainability of the sector by helping ensure funding reflects local circumstances – and changes in such circumstances over time. But it is only a very small part of the funding sustainability puzzle. Even more important will be efforts to reduce the demands for and the costs of delivering services, and especially the most costly services used by high-needs individuals. This will likely require changes in not only how local government services are delivered, but also how central government services are delivered and interact with local government services. The government and councils will also need to work hard to maximise the benefits and minimise the costs of the planned mergers of upper- and lower-tier councils in two-tier areas to create a new wave of unitary authorities responsible for all council services in their areas. This is likely to require additional up-front expenditure (e.g. for effective project planning, shadow operations in the run-up to mergers, and new administrative and operational systems) to unlock potential economies of scale and scope, and boost productivity further down the line. The government will therefore likely need to provide additional funding outside of the main reformed local government finance system to help ensure its wider reforms of local government are successful.
Finally, the scale of changes in funding some councils are set to face over the next three years is a reminder of how arbitrary funding allocations can become in the absence of a proper local government finance system. To avoid similarly large changes in future decades, these reforms cannot be a one-off: the new funding system must be updated on a periodic basis so that it continues to reflect local circumstances, and remains aligned with government objectives. It is therefore welcome that the government’s consultation envisages the new system will be updated over time. It is also welcome that the proposed funding system has a degree of flexibility so that it can be adapted by future governments as their precise objectives change.
Appendix A. Methodology
Information on the assumptions we make and the data we use to model the government’s proposed reforms (which we term the ‘baseline’ reform proposals) is set out below. The information is provided to inform other organisations modelling the reforms and local government finance professionals of our approach, and we therefore use technical terminology.
Council tax
We estimate each council’s notional council tax revenues for the purposes of assessing council tax revenue-raising capacity as follows:
- To estimate each council’s council tax base, we use data from Council Taxbase 2024 in England and apply adjustments for mandatory premiums and exemptions as described in K: Technical Annex on Resources Adjustment.
- We model an adjustment for the costs of working-age council tax support (CTS) by estimating the regression proposed in the consultation documents. This is based on: the proportion of Band D equivalent dwellings in a billing authority area that receive working-age CTS based on Council Taxbase statistics; each area’s population-weighted IMD score (IMD2019); and the proportion of the total resident population that is of working age (18–64) based on ONS mid-2023 estimates.
- We make no adjustment for discretionary exemptions or premiums, and make no adjustment for council tax non-collection (which is equivalent to assuming a 100% collection rate in all areas).
- From 2024–25 to 2025–26, we assume that the council tax taxbase in each area grows in line with the change in the ‘tax base for council tax setting purposes’ between the same years, based on council tax levels data 2025-26.
- We assume no growth in the council tax taxbase from 2025–26 onwards.
- We estimate the national average council tax level in 2025–26 to be £1,916, and assume that this rises in line with the latest OBR forecast (4.3%) for the increase in the council tax level in England each year as of the March 2025 Economic and Fiscal Outlook.
- We assume the notional council tax level is set at 100% of this average, implying notional council tax levels of: £1,999 in 2026–27, £2,085 in 2027–28 and £2,174 in 2028–29.
- In each area, these notional council tax revenues are assumed to be shared between the different types of council based on the resource tier splits published in table 7 of the consultation document. We assume these are fixed until 2028–29.
We separately estimate a measure of council tax revenues to be used both for the purposes of applying a funding floor and for reporting changes in each area’s actual revenues. This is based on:
- Each area’s council tax base for council tax setting purposes from council tax levels data 2025–26.
- Thereafter we assume council tax base growth in every area in line with the OBR forecast for the council tax base in England each year as of the March 2025 Economic and Fiscal Outlook (1.0%, 1.1%, 1.0%).
- Actual council tax levels set by each authority in 2025–26 are taken as the starting point. These reflect any decisions by councils to increase levels by less than the full referendum limits in 2025–26, and any exceptional rises allowed to some authorities in that year.
- The council tax level of each authority is then assumed to rise each year in line with the council tax referendum principles which applied in 2025–26 (5% for authorities with social care responsibility; the greater of 3% or £5 for shire districts and £5 for fire authorities). We have not modelled any exceptional rises in council tax levels after 2025–26.
Grant funding
As well as revenues from council tax, we estimate revenues from grant funding:
- We take figures for compensation for under-indexing of the business rates multiplier, and from various grants, from the final Local Government Finance Settlement 2025. In our measure of revenues in 2025, and in future years, we include all grants in core spending power except the Children’s Social Care Prevention Grant (£270 million in 2025–26) which will instead form part of a separate ‘Children, Families and Youth Grant’ outside of the new core funding allocations.
- We add a portion of each area’s allocation from the Homelessness Prevention Grant in 2025–26. We include 45% of this funding, the share which we understand from a recent consultation that government intends to be for temporary accommodation and which will be rolled into Revenue Support Grant.
- We do not model or include consolidated grants which will remain outside of the new core funding allocations, including proposed consolidated grants for homelessness and rough sleeping; public health; crisis and resilience; and children, families and youth. The consultation documents suggest that each of these will be worth at least £500 million, but did not provide enough information to model their distribution or any potential changes. To the extent that these continued to be allocated broadly in line with the existing grants they replace, including these would slightly change the magnitude of percentage increases and decreases in overall funding, but would not alter patterns of relative gains/losses.
- We assume that total grant funding to local government increases by £0.57 billion in 2026–27, £1.13 billion in 2027–28 and £1.7 billion in 2028–29, to give cumulative total additional grant funding of £3.4 billion over the three years, as was described at the Spending Review. We understand that other organisations modelling the reforms may have made different assumptions about how this funding will be phased over the three years.
Business rates
We also estimate each authority’s above-baseline business rates growth as of 2025–26. This involves: multiplying each area’s non-domestic rating income by its tier share; adding in section 31 grants to compensate for policies that have reduced business rates yields, including for under-indexation of the business rates multipliers; adding in top-ups and tariffs and applying the associated top-up and tariff adjustments that adjust the tariffs and top-ups for under-indexation of the business rates multipliers; and calculating and applying safety-net and levy payments. This provides the amount of funding received under the business rates retention system that is potentially subject to a reset. We then subtract baseline funding and compensation for under-indexation of baseline funding to calculate the above-baseline growth, which is to be redistributed as part of the business rates reset). These calculations are based on:
- forecasts for non-domestic rates collected by councils in 2025–26 (NNDR1s 2025–26);
- key information for local authorities from the final settlement 2025;
- supplementary information reflecting 50% retention arrangements in pilot areas;
- allocations of business rates green plant and machinery exemption compensation;
- the latest published business rates levy and safety net calculator which is for 2024–25.
We include this measure of above-baseline growth in our measure of revenues in 2025–26, and assume that all growth (including all growth in pilot areas) is fully reset from 2026–27 (although it is subject to phasing, as described below). We do not model the impact of business rates pools.
Overall funding in the absence of reform
We estimate the total amount of actual funding available to local government in each year, including under a reformed system. In the absence of reform, we assume that:
- Council tax revenues in each area would increase to reflect maximum use of referendum limits each year and council tax taxbase growth in line with OBR forecasts.
- Retained business rates revenues (baseline funding plus compensation for under-indexation) would increase in each area each year in line with the latest OBR forecast for consumer price index (CPI) inflation in Q3 of the previous year.
- Each area would receive the same share of grant funding (including Revenue Support Grant) as it did in 2025–26, with the total amount of grant funding increasing as described above, to give cumulative total additional grant funding of £3.4 billion over the three years.
- Each area would retain above-baseline growth already accrued (in flat cash terms) but would not accrue further growth.
We understand that our treatment of compensation for historical under-indexation in years after 2025–26 may differ from that of MHCLG. If funding for historical under-indexation compensation was no longer assumed to continue to increase in line with inflation, this would reduce the total amount of funding available to local government in 2028–29 by around £190 million (0.2%).
Overall funding under the reformed system
To model the impact of reforms, we estimate each council’s share of overall need based on the relative needs shares of each area in 2025–26, and the weights applied to different services (‘control totals’), as per the consultation document (A: Consultation Needs calculator). After 2025–26, we assume that the relative needs shares of each area evolve in proportion with projected growth in total resident population of each area based on ONS 2022-based subnational population projections.
In modelling each area’s revenues under a reformed system, we first follow the approach described in section 2 of the consultation document to calculate ‘target allocations’ of overall funding from grants plus business rates (Settlement Funding Assessment, SFA) in each year (2026–27 to 2028–29) as if the reformed allocations were brought in immediately in 2026–27.
- To do this, we calculate the total notional amount of funding to be allocated, which is the total amount of actual funding, less council tax revenues, plus notional council tax revenues. The ‘target allocations’ are estimated as if this total notional amount were to be allocated under the new system every year.
- Each area’s SFA is equal to its share of overall need multiplied by this total notional funding, less its notional council tax revenues.
- We check no council would be awarded negative SFA in any year, as government proposes to prevent any area having a negative SFA. This is not relevant for any council under our modelling of the government’s proposed approach.
We then model reform allocations being phased in over three years. It has been difficult to understand precisely how government proposes this phasing be implemented, but we model this in a way that we believe is consistent with information from the published consultation documents and MHCLG’s communications to stakeholders. We model this as follows:
- A measure of ‘new funding’ (the £3.4 billion increase in grant funding, plus the impact of future indexation of retained business rates revenues) is distributed fully to authorities in proportion to their ‘target allocations’ under the new system each year.
- The ‘existing funding’ (existing grants and above-baseline growth), which is assumed to stay flat in cash terms, is phased in over the three years. More specifically, some portion (⅓ in 2026–27, ⅔ in 2027–28 and all ‘existing funding’ in the final year) is distributed in proportion with ‘target allocations’ under the new system, with the remaining share (⅔ in 2026–27, ⅓ in 2027–28) allocated in proportion with the shares of this ‘existing funding’ each area received in 2025–26.
There is significant uncertainty over this aspect of the reforms, although it matters more for the path of funding, than for each council’s final position in 2028–29. For instance, we apply future indexation to the existing compensation for historical under-indexation in the system, and distribute this as ‘new funding’. Without this indexation, the new allocations would be phased in slightly more slowly.
We add these phased allocations of SFA to a measure of council tax (assuming maximum use of council tax flexibilities and OBR forecast base growth) in order to apply funding floors. Government has said that most areas will have their revenues protected in cash terms (a 0% cash funding floor, assuming they make maximum use of council tax flexibilities).
However, this would leave some areas far from their ‘target allocations’ in 2028–29. The government has suggested that some authorities, where their new share of funding is furthest from their current share of funding, will require bespoke treatment through the transition. We have assumed that those which would be furthest away if they were subject to a 0% floor are instead subject to a lower floor at 94% of their funding baseline in 2025–26. We have assumed that: if an authority’s funding without the floor would in 2028–29 be at least 5% below its ‘target allocation’, its SFA is set such that its funding does not fall below 94% of its funding in 2025–26 in cash terms; and if its funding would be within 5%, it is subject to a 0% floor.
- We assume the cost of funding these floors (approximately £40 million in 2026–27 and £340 million in 2028–29) would be met by reducing funding to all councils proportionately. This moves small numbers of councils below floors and requires further funding for floor protection. We iterate in this way until the remaining cost of unfunded floors would be less than £1 million and assume MHCLG finds this from somewhere outside of the settlement.
On specific councils:
- We exclude the Greater London Authority (GLA) entirely from the modelling as it is difficult to separate out a share of baseline funding and above-baseline growth in 2025–26 which is for fire as opposed to other functions. It is unclear exactly how the GLA will be treated under the new system. Given the GLA has substantial retained above-baseline growth, and a fairly high share of assessed need (21% of national fire need and 0.9% of overall need), differences in the treatment of the GLA may explain some differences between our modelling and that produced by other organisations.
- We also exclude the Isles of Scilly entirely from the modelling, as needs shares are not available. We do not anticipate that this will have a substantial impact on results for other authorities.
- We exclude most combined authorities but include the Greater Manchester Combined Authority (GMCA), for which the government has published a needs share. We treat the GMCA as a fire authority.
References
Local Government Association (2024) Local Government White Paper. https://www.local.gov.uk/local-government-white-paper.
Ministry of Housing, Communities and Local Government (2025a) Local authority funding reform: objectives and principles consultation. https://www.gov.uk/government/consultations/local-authority-funding-reform-objectives-and-principles.
Ministry of Housing, Communities and Local Government (2025b) The Fair Funding Review 2.0. https://www.gov.uk/government/consultations/the-fair-funding-review-20.
Muldoon-Smith, K., Walker, A. and Stride, G. (2024) Learning from local government finance across the world: proposals for improving the finance resilience of local government in England. Local Government Information Unit (LGiU) Local Democracy Research Centre report, https://lgiu.org/publication/learning-from-local-government-finance-across-the-world/.
Ogden, K. and Phillips, D. (2024a) How have English councils’ funding and spending changed? 2010 to 2024. IFS report, https://ifs.org.uk/publications/how-have-english-councils-funding-and-spending-changed-2010-2024.
Ogden, K. and Phillips, D. (2024b) The 2025–26 English Local Government Finance Settlement explained. IFS comment, https://ifs.org.uk/articles/2025-26-english-local-government-finance-settlement-explained.
Ogden, K. and Phillips, D. (2025a) Response to ‘Local authority funding reform: objectives and principles’ consultation by MHCLG. IFS comment, https://ifs.org.uk/articles/response-local-authority-funding-reform-objectives-and-principles-consultation-mhclg.
Ogden, K. and Phillips, D. (2025b) Response to Fair Funding Review 2.0 consultation. IFS comment, https://ifs.org.uk/articles/response-fair-funding-review-20-consultation-mhclg.
Ogden, K., Phillips, D., Sibieta, L., Warner, M. and Zaranko, B. (2022) Does funding follow need? An analysis of the geographic distribution of public spending in England. IFS report, https://ifs.org.uk/publications/does-funding-follow-need-analysis-geographic-distribution-public-spending-england.
Ogden, K., Phillips, D. and Warner, M. (2023) How much public spending does each area receive? Local authority level estimates of health, police, school and local government spending. IFS report, https://ifs.org.uk/publications/how-much-public-spending-does-each-area-receive-local-authority-level-estimates-health.
Phillips, D. (2024) Reforming local government funding in England: the issues and options. IFS report, https://ifs.org.uk/publications/reforming-local-government-funding-england-issues-and-options.
Acknowledgements
The authors gratefully acknowledge funding from the Health Foundation (grant FR-0006408) as part of their work on understanding the effects of local government finance systems on funding, service provision, quality and outcomes. The authors gratefully acknowledge the support of the ESRC Centre for the Microeconomic Analysis of Public Policy (ES/T014334/1).
In addition, the authors would like to thank Katherine Merrifield and Gwen Nightingale from the Health Foundation and the members of the project advisory group (Stephen Aldridge, Kirill Borusyak, Sophie Broadfield, Vicky Davis, Mel Lock, Graeme McDonald, Jeff Matsu, Kitty Stewart, Rachael Wardell) for helpful comments and suggestions. They would also like to thank colleagues at the Ministry of Housing, Communities and Local Government, as well as Adrian Jenkins (Pixel Financial Management) and Michael McVicker (London Councils), for helpful discussions. Any errors or omissions are the responsibility of the authors only.
Endnotes
Authors

Kate Ogden
Kate joined the IFS in 2020 and works on local government finance and higher education.

David Phillips
David is Head of Devolved and Local Government Finance. He also works on tax in developing countries as part of our TaxDev centre.
More from IFS
Understand this issue


Policy analysis


Academic research