It is now just over two years since the UK’s vote to leave the European Union. Since then, it is fair to say that there has been a confusing barrage of apparently contradictory claims about the state of the economy.
In truth, there is much we still do not know. There is a huge amount of uncertainty over how the UK’s trading relationship with the EU will change in the coming years, let alone what impact those changes will have on the economy and living standards. It is also often difficult to separate signal from noise in economic data.
Nonetheless, enough data has been released to allow us to be reasonably confident about some of the short term effects of the vote to leave on the UK economy.
First, there is the impact on Gross Domestic Product (GDP). This is one of the most fundamental measures of economic performance, measuring the total amount of goods and services produced in the UK. Assessing how the growth rate of GDP has been affected by the vote to leave is difficult; however from what we can tell the impact so far appears to have been negative.
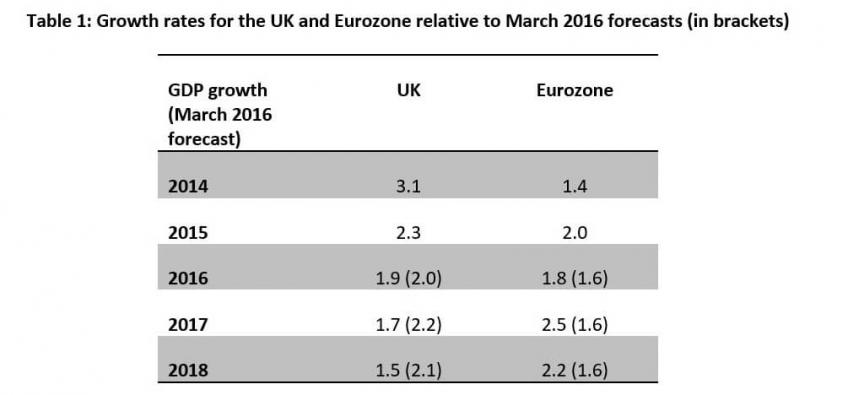
Table 1 shows that growth in UK GDP slowed in 2016 and 2017 compared with both pre-referendum growth rates and the pre-referendum forecast for growth in that year from the Office for Budget Responsibility (OBR). Growth in the Eurozone economies, by contrast, accelerated in 2017, comfortably exceeding the OBR’s pre-referendum predictions.

The individual factors behind this slowdown in growth between 2016 and 2017 varied. In 2016, household consumption growth was strong, but this was offset by imports growing faster than exports, meaning the net trade balance subtracted strongly from GDP.
In 2017, by contrast, exports grew faster than imports, but household consumption growth slowed markedly. Because consumption continued to grow faster than household incomes, however, the 2017 annual household saving rate was lower than at any time since records began in 1963. This may well turn out to be a drag on future consumption growth.
Another contributing factor to the deceleration in GDP growth in both 2016 and 2017 was a slowdown in the growth of business investment. Business investment growth was 2.4% in 2017, significantly below a pre-referendum OBR forecast of 6.1%. Business investment fell by 0.5% in 2016, also lower than its pre-referendum forecast for 2.6% growth. In 2015, by contrast, it grew by 3.7%.
These figures do not definitively show an effect of the referendum, but a slowdown in investment spending would be unsurprising. The EU is the UK’s largest trading partner, with exports to the EU accounting for 12% of UK GDP. Uncertainty over the nature of trade barriers has been shown to affect firms’ willingness to invest in export operations in other contexts.
Surveys of firms in the wake of the referendum also suggest that uncertainty is weighing on investment decisions more generally. Based on the results of these surveys for instance, researchers at the Bank of England estimate that uncertainty and reduced expectations of future sales resulting from Brexit led to a 3-4% reduction in (nominal) investment spending between mid 2016- and mid-2017.
What does all this imply about the cumulative output loss as a result of the vote?
One approach to assessing this is to compare the UK’s recent growth rates to a combination of countries whose economies tended to move in similar ways in the years prior to the referendum. The most recent estimates of referendum’s impact using this method put it at 2.1% of GDP by the first quarter of 2018. However this is just one of various approaches one might take. Surveying results from a host of different methods for assessing the output loss, the Financial Times place the referendum’s impact on output at 1-2% of GDP. A hit to GDP of this size would imply a reduction in national output of between £20 and £40 billion – amounting to an average impact of roughly £700 – £1,500 per household.
Living standards will also have been affected by a more obvious and immediate effect of the vote to leave: a fall in the sterling exchange rate. The effective exchange rate, measuring sterling against a group of currencies, fell by 10% from 23 to 27 June 2016.
This decline has persisted, and sterling is now around 11% lower than its value on referendum day, presumably reflecting nervousness among investors about returns to investments in the UK.
By increasing the cost of imports, this decline has pushed up prices through a temporary increase in the rate of inflation. CPI inflation reached a peak of 3.1% in November 2017, up from 0.5% in June 2016.
Not all of this increase is due to the depreciation in sterling, but there is little doubt that the fall in the exchange rate has increased the overall price level. Research by the Centre for Economic Performance at LSE shows that price increases were greater for the goods and services which were more likely to be imported.
By July 2017 they estimate that the sterling depreciation had added 1.7% to the CPI. This estimate is roughly consistent with predictions the OBR made in 2016 that the exchange rate deprecation would add 2% to prices.
Since late 2017, inflation has fallen back somewhat, but because workers’ pay growth did not keep pace with inflation, the real value of the earnings has been eroded.
Again, we do not know exactly what would have happened to either earnings or inflation had the UK not voted to leave. However, it is worth noting that, after a long period of poor and (at times) negative real earnings growth since the recession, real average weekly earnings had been increasing relatively robustly in 2015 and 2016. In December 2015 these were growing at an annual rate of 1.7%, a figure which had fallen to -0.1% in December 2017. So far in 2018, earnings growth has been sluggish but positive, rising at an annual rate of just 0.1% in April 2018.
One bright spot in the post-Brexit landscape is a fall in the UK’s already low unemployment rate. This reached 4.2% in February to April 2018 – its lowest rate since the 1970s, and lower than 4.9% in the three months preceding the referendum.
Another area where current outturns do not appear to have got worse relative to pre-referendum forecasts is the public finances. The latest estimated outturn for borrowing in 2017-18 was £39.5bn, similar to the March 2016 forecast for that year.
Given that economic growth has been significantly lower than forecast, this is surprising and reflects better than expected receipts from a number of taxes, as well as some underspends by government departments. While the hit to growth described above is undoubtedly bad for the longer-run state of the public finances, some of these forecast changes for future years are due to the OBR’s generally gloomier outlook for future productivity growth. These cannot be entirely ascribed to Brexit.
Overall though, it looks as though the Leave vote has had a negative impact on UK growth and living standards.
This article was originally published by the UK in a Changing Europe and is reproduced here with full permission. Peter Levell is Brexit research coordinator for ‘The economic impacts of post-Brexit trade options‘ team at The UK in a Changing Europe and Senior research economist at the Institute for Fiscal Studies.


