
Downloads
Download report pdf
PDF | 825.05 KB
The number of self-employed workers has been rising rapidly in the UK in recent decades. At the same time, private pension participation among this group has fallen sharply, leading to increasing concern among policymakers about the preparedness for retirement of self-employed workers. This report documents and analyses private pension saving using administrative data that follows the UK self-employed population over the decade from 2005–06 to 2014–15.
We focus on a particular subset of the self-employed population, namely the working-age long-term self-employed (defined as those aged 22–64 who have been self-employed with no employment income for at least 5 years). We use a data set of Self Assessment tax returns, which self-employed workers have to submit each year to HM Revenue and Customs. We first document how the characteristics of the working-age long-term self-employed have changed over this period. We then focus on trends in pension participation and contribution amounts for this group of workers.
Key findings
1. Incomes of the working-age long-term self-employed fell significantly over the decade from 2005–06 to 2014–15. Median earnings decreased from £17,850 to £12,640 per year (in 2015–16 prices), equivalent to a 29% decrease. The distribution of self-employment incomes is less unequal after the financial crisis than before due to top incomes falling by more than the bottom incomes.
2. The self-employed tend to have more volatile incomes than employees. With administrative tax data, we can follow self-employed individuals over time and measure their year-to-year income volatility. The volatility of self-employed incomes (as measured by the coefficient of variation of annual income) increased slightly between 2006–07 (where the data are unaffected by the Great Recession) and 2011–12 (where the previous 5 years include the Great Recession and its immediate aftermath), but returned to pre-financial crisis levels by 2014–15.
3. Private pension participation among the self-employed fell dramatically between 2005–06 and 2014–15. Among the working-age long-term self-employed, the private pension participation rate fell from 33% in 2005–06 to just 14% in 2014–15. Participation rates were even lower among those who had been self-employed for less than 5 years – the private pension participation rate among all working-age self-employed individuals with no employment income fell from 26% to 11% over this period.
4. Private pension participation rates among the long-term working-age self-employed fell across men and women and all income, age and industry groups. For example, private pension participation rates in the construction sector (which is the most common single industry among the self-employed) fell from 38% to 12% between 2005–06 and 2014–15.
5. Lower incomes and higher income volatility have been offered as plausible explanations for lower rates of saving into illiquid pension assets among the self-employed. We find that pension participation is higher among those with higher income (both from self-employment and other sources), those with less volatile income (as measured by the coefficient of variation of annual income), and among those having a good income year (income in the current year being higher than the 5-year average). However, these effects are economically small – for example, an increase of £1,000 in self-employment earnings is associated with only a 0.5 percentage point increase in pension participation.
6.The changing composition of the self-employed population explains only about a third of the decline in pension participation between 2005–06 and 2014–15, even after including a wide range of individual characteristics such as income and income volatility measures in the analysis. Therefore the majority of the decline in private pension participation among the self-employed cannot be explained by changes in the characteristics of the self-employed population that are observed in tax data.
7.Among those of the working-age long-term self-employed who were saving into a pension, average (mean) annual pension contributions increased over time, from £4,390 to £5,810 (in 2015–16 prices) or from 10% to 12% of total income. However, median contributions remained stable, implying that most of the increase in contributions took place at the top of the distribution of contributions. Perhaps surprisingly, the changing composition of the self-employed does not appear to be a driving force behind this change: the time trends of contributions are very similar for the sample of the self-employed who were saving into a pension consistently throughout the sample period.
1. Introduction
The number of self-employed workers in the UK has risen rapidly in recent decades. At the same time, retirement saving in private pensions among this group has declined sharply. While automatic enrolment has been successful at increasing workplace pension participation among employees, retirement saving among the self-employed has become an area of increased focus and concern for policymakers.
Previous research, using survey data from the Family Resources Survey and Wealth and Assets Survey, found that private pension participation among the working-age self-employed population (who were receiving most of their income from self-employment) had been falling steadily since the late 1990s (Crawford and Karjalainen, 2020). This report will explore the same question but using a different data set, the Self Assessment tax returns which nearly all self-employed workers have to submit to HM Revenue and Customs (HMRC) for each year that they are in business.1
The Self Assessment form records income from all sources, and the self-employed are also asked to report pension contributions they have made to any pension schemes. Using administrative data has a number of benefits. First, given that these data cover almost all of the self-employed population, we have a very large sample, which allows us to measure and to document things such as income and pension contributions. This is in stark contrast to most household surveys, as even the largest household surveys will only capture a limited number of self-employed people and taxable incomes and pension contributions will not always be measured accurately. Second, administrative tax records are a panel data set, meaning that people can be followed over time. Thus with this data set we can study aspects of the self-employed workforce which have been either difficult, or even impossible, to study in the past, such as volatility of incomes (how incomes change from year to year), and their relationship with pension saving.
We focus our analysis on a particular subset of the self-employed population, namely the working-age long-term self-employed, defined as those aged 22–64 who have been self-employed with no employment income for at least 5 years. This is in order to focus on a group for whom self-employment is a long-term main economic activity, rather than people who are only just starting out in a business, or who undertake self-employed activity – perhaps in the gig economy – as a way of supplementing their main employment income.
This report is structured as follows. In Section 2 we start by describing the characteristics of the sample of the self-employed we use for our analysis, also providing evidence for how incomes and volatility of incomes have changed over time among the self-employed. In Section 3 we document changes in pension participation among this group, and analyse to what extent the changing composition of the self-employed can explain the decline in participation. In Section 4 we look at trends in the level of contributions among the self-employed who are saving into a pension. Section 5 concludes.
2. Characteristics of the self-employed
In this section we document trends in characteristics, incomes, and individual income volatility of self-employed people over our sample period from 2005–06 to 2014–15. A key reason to do this is to examine whether there are any potential changes in characteristics of the self-employed workforce that could be helpful in understanding changes in pension participation – examined in more detail in the following section.
In this report we focus on the population of working-age long-term self-employed, defined as those aged 22–64 who have been self-employed with no employment income for at least 5 years. The long-term self-employed are less likely to have alternative pension arrangements from spells as employees, and will largely have to rely on saving during self-employment to fund retirement (alongside their state pension). This group makes up about a half of the self-employed population in the tax return data (out of everyone who reports any self-employment income).2 In the analysis in this report we use a 10% random sample of the full sample (for computational purposes). The number of working-age long-term self-employed individuals in the random 10% sample of the data was nearly 185,000 in 2014–15.3
Table 2.1 shows selected characteristics and how their prevalence has changed among the working-age long-term self-employed over this period. We already know that the composition of the overall self-employed population has changed over our sample period; Cribb, Miller and Pope (2019) find that the self-employed people in the tax records are increasingly sole traders and are more likely to be immigrants.
Table 2.1 shows that over the decade we study (2005–06 to 2014–15), the average age of the working-age long-term self-employed remained relatively stable at 49 years. Nearly two-thirds had been self-employed for 9 years or more in 2014–15, down from 77% in 2005–06. The fact that the long-term self-employed have been self-employed for less time is consistent with the fact that the self-employed population is increasing in size, driven by new people entering self-employment.
Cribb, Miller and Pope (2019) found that the increase in the number of self-employed people has been largely driven by an increase in sole traders rather than partners. This is also true among the long-term self-employed: among our sample the proportion who are partners (rather than sole traders) decreased from 33% to 22% between 2005–06 and 2014–15.
Finally, the proportion of the long-term self-employed who are women increased slightly from 24% in 2005–06 to 27% in 2014–15, while the proportion who are immigrants (people who arrived in the UK after their 16th birthday) more than doubled from 5% to 12%. The proportion of the self-employed who live in London increased from 11% to 14%, which implies a 47% increase in the number of working-age long-term self-employed people living in London between 2005–06 and 2014–15.4
Table 2.1. Characteristics of the self-employed in 2005–06 and 2014–15
| 2005–06 | 2014–15 |
Average age (years) | 48.6 | 48.5 |
Percentage who are self-employed for at least 9 years | 77% | 65% |
Percentage who are immigrants | 5% | 12% |
Percentage who are women | 24% | 27% |
Percentage who are partners | 33% | 22% |
Percentage living in London | 11% | 14% |
Note: Sample is working-age self-employed workers with no income from employment, who have been self-employed for at least 5 years. Sample size 159,946 and 184,953 in 2005–06 and 2014–15, respectively.
Source: Author’s calculations using HMRC Self Assessment data for 2005–06 and 2014–15.
2.1 Level and volatility of incomes
The HMRC tax data allow researchers to follow the same people over time, which means that we can document both the level and volatility of income among the self-employed over time. Figure 2.1 illustrates how the median (50th percentile), 25th, and 75th percentiles of self-employment earnings evolved among our sample over the sample period. All figures are adjusted for Consumer Price Inflation and expressed in 2015–16 prices. Figure 2.1 shows that the median income of the self-employed declined in real terms over this period from about £17,850 to around £12,640, equivalent to a 29% real-terms decrease. The gap between the median employee and self-employed earnings also increased over this period – employee median earnings increased in real terms from £19,350 to £22,870 between 2005–06 and 2014–15.
The 25th percentile income remained more stable, declining from £8,795 to £7,710, although this is still a 12% real-terms decrease over 9 years. We also see a large change higher up the distribution. Between 2005–06 and 2014–15 the 75th percentile of self-employed income decreased by 28% from £33,120 to £23,830. It seems that top incomes fell most dramatically after the financial crisis (after 2007–08), and then stabilised in the years from 2012–13 to 2014–15. As a result of this, Figure 2.1 makes it clear that the distribution of self-employment incomes is narrower – i.e. less unequal – after the financial crisis than before, and this narrowing was driven by top incomes falling by more than the bottom incomes.
Figure 2.1. Distribution of self-employment earnings and median employee earnings over time

Note: Self-employed sample is working-age self-employed workers with no income from employment, who have been self-employed for at least 5 years. Employee sample is all working-age employees.
Source: Author’s calculations using HMRC Self Assessment data and the Annual Survey of Hours and Earnings from 2005–06 to 2014–15.
In Figure 2.2 we show two additional income statistics: how the proportion of the self-employed who are earning less than £10,000 per year (in 2015–16 prices) and the proportion of the self-employed with earnings above the higher-rate tax threshold (which was £42,385 in 2015–16) changed over time. This figure tells a similar story to the above. The proportion of the self-employed with earnings below £10,000 started increasing sharply after the financial crisis, rising from 25% in 2006–07 to 37% in 2012–13, and then fell to 32% by 2014–15. Consistent with top incomes falling, the proportion of the self-employed with earnings above the higher-rate tax threshold fell from 17% to 12% over this period (despite the higher-rate tax threshold falling by 12% in real terms over this period).5
Figure 2.2. Proportion of the self-employed with income less than £10,000 per year and income above the higher-rate tax threshold

Note: Sample is working-age self-employed workers with no income from employment, who have been self-employed for at least 5 years.
Source: Author’s calculations using HMRC Self Assessment data from 2005–06 to 2014–15.
One important factor about the self-employed is that their incomes are likely to be more volatile than those of employees (particularly employees who remain working for the same employer), as ‘good’ and ‘bad’ years for the business feed directly into the self-employed person’s income. More volatile incomes could mean that self-employed people would prefer not to lock away savings in a pension which they cannot access until they are aged at least 55, but would prefer to keep savings in more liquid forms.
We can use the panel aspect of the HMRC data to measure year-to-year changes in the respondents’ incomes, and to document how they change over time. We can also document trends in the average ‘coefficient of variation’ of the incomes of the self-employed (the ratio of the 5-year standard deviation and mean of total income for each individual). The downside of our data set is that incomes are reported annually, which means that we can only measure year-to-year changes in incomes rather than being able to assess any seasonality or other within-year variation in incomes.
Figure 2.3 shows the distribution of year-to-year percentage changes in incomes of the self-employed population, pooling data from 2005–06 to 2014–15. The yellow bars illustrate year-to-year changes in self-employment earnings, and the green bars refer to changes in total income. The figure shows that the distributions of year-to-year changes in total income and self-employment earnings are very similar. In particular, for both income definitions the most common (modal) change in year-to-year incomes is a 0–5% real-terms decrease. Among this sample of the long-term self-employed, year-to-year reductions in real incomes (both total income and self-employment income) are roughly as common as real-terms increases in incomes. Figure A4.1 in Appendix 4 shows a comparison of earnings changes between the self-employed and employees. The comparison shows that among employees there is much more mass around changes close to 0%. This confirms that large year-to-year real changes, and decreases in real earnings in particular, are more likely among the self-employed than among employees.
Figure 2.3. Distribution of year-to-year percentage changes in pre-tax self-employment and total income

Note: Pooled data from 2005–06 to 2014–15. Sample is working-age self-employed workers with no income from employment, who have been self-employed for at least 5 years. We do not show those with previous tax year income of less than £1,000 (0.6% of sample when considering total income and 1.4% when considering self-employment income). 0.5% of the sample have changes to their total income larger than 200% from year to year. The equivalent figure is 0.8% for self-employment income.
Source: Author’s calculations using HMRC Self Assessment data from 2005–06 to 2014–15.
In addition to pooling data across tax years, we can also look at how year-to-year percentage changes in incomes and income volatility have changed over time. Figure 2.4 shows the time series of the average (mean and median) percentage changes in total income, as well as the average coefficient of variation of total income among the long-term self-employed. Average incomes fell after the financial crisis, and the median percentage change in incomes only became positive in 2013–14. The mean percentage changes are higher than median, which implies that some of the self-employed experience much higher rates of income growth, pushing up the mean rates (which is also evident from the longer right tail of Figure 2.3).
While the percentage change figures give us information on how incomes are changing on average year-to-year, to understand how volatility of incomes has changed over time, we look at the coefficient of variation. This is a measure of volatility defined as the ratio of standard deviation of income and mean income, measured over the current year and the preceding four tax years. According to this measure, volatility of self-employed incomes increased slightly between 2006–07 (where the data is unaffected by the Great Recession) and 2011–12 (where the previous 5 years include the Great Recession and its immediate aftermath). However, income volatility returned to the pre-financial crisis levels by 2014–15.
Figure 2.4. Time series of distribution of year-to-year percentage changes and 5-year coefficient of variation in real terms total income

Note: Coefficient of variation is defined as the ratio of the standard deviation and mean of the individual’s total income over the last 5 years. Both measures are winsorised at the 99th percentile. Sample is working-age self-employed workers with no income from employment, who have been self-employed for at least 5 years.
Source: Author’s calculations using HMRC Self Assessment data from 2005–06 to 2014–15.
This section has documented the characteristics and changes in those characteristics for long-term self-employed people in HMRC administrative tax data, including changes in incomes and volatility of incomes. The characteristics of the self-employed changed significantly between the mid-2000s and the mid-2010s in a number of ways. In particular, average incomes fell, with many more people earning low amounts, and an increasingly small share paying higher-rate tax at the end of the period. In addition, we find large growth in the number of sole traders in comparison to partners, and a rapid increase in the share of the self-employed workforce who are immigrants.
3. Pension participation
In this section we examine trends in pension participation of the long-term self-employed between the mid-2000s and mid-2010s. We start by looking at how pension participation rates evolved over time, and then discuss associations between pension participation and various characteristics, and whether the observed changes in those characteristics discussed in the previous section can rationalise the change in pension participation.
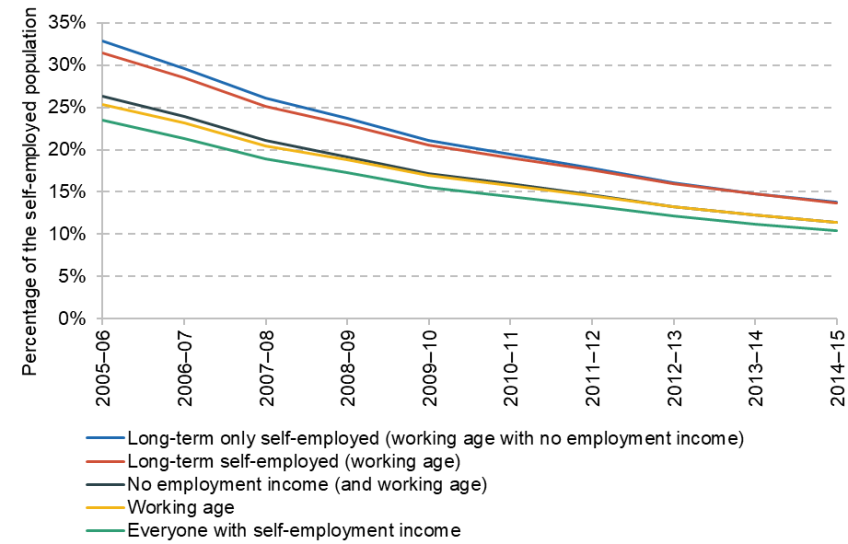
Figure 3.1 shows the proportion of the self-employed workforce who are contributing to a pension under different definitions of self-employment. The bottom line (green) shows pension participation among everyone completing a self-employment tax return.6 We see that pension participation among this group falls from 23% to 10% over this period. However, this sample definition includes people who are past state pension age. It also includes people who may get some of their income from employment, and some of those people might have workplace pensions provided through their employers which we would not be able to observe in our data.7 Thus the next two lines in Figure 3.1 show pension participation among the self-employed who are of working age (22–64, the yellow line), and then those of the working-age self-employed who have no employment income (the black line). With each new definition our sample becomes narrower and pension participation slightly higher, but the declining trend of pension participation is the same across all definitions of the self-employed. The falls in pension participation seem to happen continuously throughout the period at a relatively smooth rate.
Finally, we restrict our sample to those who are long-term self-employed and those who are long-term fully self-employed (have had no employment income in at least 5 years). The latter group is our sample of interest in this report, and we see that pension participation among this group is higher than for any other definition, at 33% in the first year. However, we also see the largest fall in pension participation among this group compared to any other definition of the self-employed, from 33% to 14% over the period. While pension participation among the working-age long-term self-employed is higher than among the rest of the self-employed, it is worth noting that pension participation among this group is still significantly lower than among employees whose pension participation rate in April 2014 was 59% (even before automatic enrolment was fully rolled out), rising to 79% by April 2021.8
Figure 3.1. Pension participation for different definitions of the self-employed population over time
Source: Author’s calculations using HMRC Self Assessment data from 2005–06 to 2014–15.
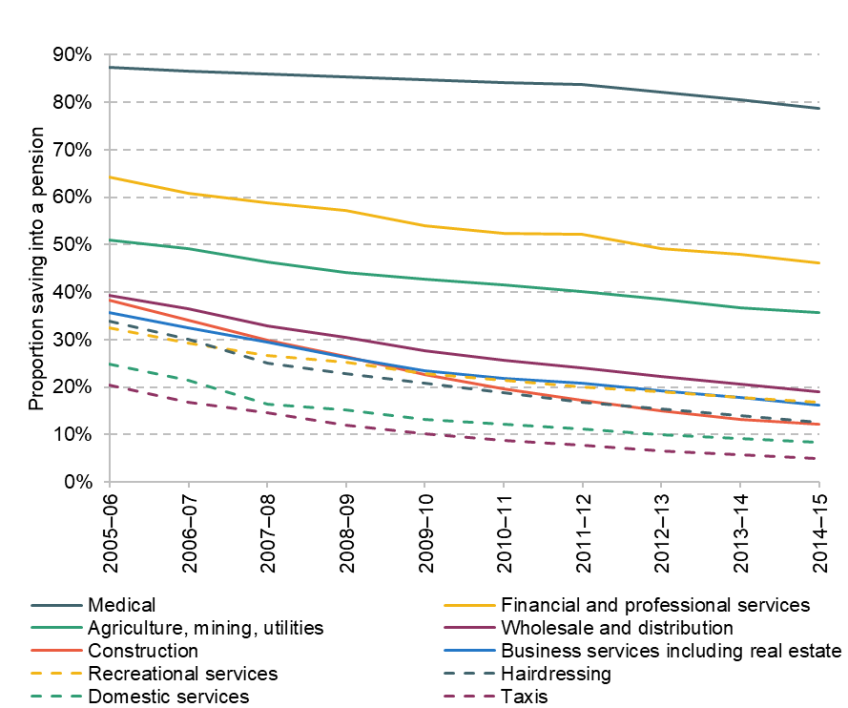
We can also look at pension saving among different groups, in order to understand whether pension saving declined more among certain groups of the long-term self-employed. Crawford and Karjalainen (2020) found using survey data that pension saving among the self-employed fell across the board between 1998–99 and 2018–19, even among groups that initially had higher levels of participation, such as higher earners and those who had been self-employed for longer. Table A4.2 in Appendix 4 and Figure 3.2 shows that we find a similar pattern in the tax records data – private pension participation rates fell across both sexes and all different income, age, and industry groups of the long-term self-employed between 2005–06 and 2014–15. For example, private pension participation rate among those earning less than £8,000 per year (in 2015–16 prices) fell from 20% to 7%, and among those earning more than £26,000 per year from 56% to 36%.
Figure 3.2. Pension participation for different sub-groups of the self-employed population over time
A: Income groups

B: Age groups

C: Selected industry groups
Note: Income bands based on 2015–16 prices.
Source: Author’s calculations using HMRC Self Assessment data from 2005–06 to 2014–15.
Focusing on participation rates by industry, we also see some interesting differences. In particular, private pension participation rates in construction, which is the most common single industry among the self-employed (28% of the sample in 2014–15), fell from 38% to 12% over this period. Participation rates in some of the industries with initially higher pension coverage did not fall quite as dramatically – pension participation among the medical profession (2% of the self-employed) declined from 87% to 79%, and among those in financial and professional services (5% of the self-employed) from 64% to 46%. Thus the largest falls were not always occurring among industries with highest coverage to start with. However, the declining trend of pension participation is evident across all industries.
3.1 Pension participation and characteristics
We know from previous research (using household survey data) that certain characteristics (such as age, earnings, tenure in self-employment, and working full-time) are positively associated with pension participation (Crawford and Karjalainen, 2020). We will now examine the relationship between a number of characteristics and pension participation in the administrative tax data. While the administrative data lack some of the information we have access to in survey data (household characteristics such as marital status, partner’s income, or number of children, and some individual characteristics such as educational background), a clear benefit of the administrative data is that we have very large sample sizes and we can follow the same people over time, which allows us to include measures of people’s income volatility in our analysis.
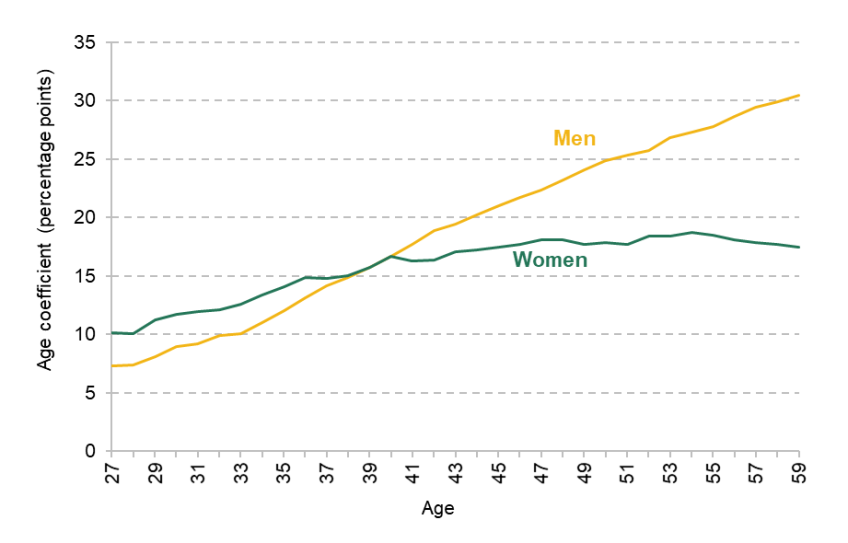
Table A4.2 in Appendix 4 shows differences in pension membership between different groups of people. However, in order to examine the relationship between pension saving and individual characteristics, we run a linear regression of pension participation on a number of characteristics. This allows us to comment on the association between specific characteristics and pension participation, holding other characteristics constant. Table 3.1 shows the results from this regression. In addition to the variables in the table, in the regression we also control for single-year age dummies interacted with a female dummy variable. Figure 3.3 illustrates the female and male age coefficients for ages 27–59 from the regression.9
As discussed, we control for both income and income volatility in the regression. We include average self-employment income and the coefficient of variation of self-employment income as regressors, where both are measured based on earnings from the current year and past 4 years (i.e. a 5-year average). We also include a measure for whether the current tax year was better or worse than the recent average income year by deducting the 5-year average earnings from the current year’s earnings. We also linearly control for income from other sources than self-employment.
Table 3.1. Linear probability model of pension participation on characteristics
Characteristic | Association with pension participation (percentage points) | |
Partner | 5.6 | *** |
Immigrant | –7.6 | *** |
Has been self-employed for more than 9 years | 10.9 | *** |
Average self-employment income (in £000s) | 0.5 | *** |
This year's income less average income (in £000s) | 0.4 | *** |
Coefficient of variation of income | –3.0 | *** |
Income from other sources (in £000s) | 0.1 | *** |
Has property income | 2.5 | *** |
Has taxable pension or benefit income | –11.5 | *** |
Observations | 1,101,430 |
|
R-squared | 0.19 |
|
Note: Also controlling for single-year age dummies (interacted with a female dummy), region dummies and industry dummies. Figures are coefficients (multiplied by 100) from a linear probability model of pension participation on individual characteristics. For example, the interpretation of 5.6 for ‘partner’ is that the probability of a partner saving into a pension was 5.6 percentage points higher than for a sole trader (all else equal). Standard errors clustered at individual level.
*** indicates statistical significance at the 0.1% level. Sample is working-age self-employed workers with no income from employment, who have been self-employed for at least 5 years.
Source: Author’s calculations using HMRC Self Assessment data from 2005–06 to 2014–15.
These results show that pension participation is positively and substantially associated with being a partner, being born in the UK and having been self-employed for 9 years or more. In terms of the income variables, pension participation is positively associated with having higher average earnings (having £1,000 higher average self-employment earnings is associated with 0.5 percentage points higher pension participation), currently having a good earnings year (having £1,000 higher self-employment earnings in the current year than the 5-year average is associated with 0.4 percentage points higher pension participation), having higher income from other sources (having £1,000 higher income from other sources than self-employment is associated with 0.1 percentage point higher pension participation), and having any property income (having any property income is associated with a 2.5 percentage point higher pension participation).
Pension participation is negatively associated with having more volatile earnings in the past 5 years, as measured by the coefficient of variation. An increase in the coefficient of variation from 8% to 63% – an increase from the 10th to the 90th percentile values in 2014–15 – is associated with a 2 percentage point decrease in pension participation. These results are consistent with a story of pension participation being less likely among those of the self-employed whose income is more volatile across years, and those whose income is lower in the current year than their usual average income, although the magnitude of these effects is relatively small.
Figure 3.3 shows the age coefficients from the same regression for men and women. Figure A3.1 in Appendix 3 shows that pension participation rates among women were lower than among men in all years of our analysis, although some of this may be explained by the fact that average incomes are also lower among self-employed women than self-employed men (as shown in Table A3.1 and Figure A3.2). Figure 3.3 shows that after controlling for everything else, the pension participation rates of men and women are very similar up to age 40. A gap between male and female pension participation rates starts opening up after age 40, and the difference in participation rates is statistically significant from age 49. The gap also keeps on growing throughout the 50s – keeping all else equal, men aged 59 are 13 percentage points more likely to be saving into a pension than women of the same age. Thus, even after controlling for income and other characteristics, differences in pension participation rates between men and women remain especially among the older self-employed workers.
Figure 3.3. Pension participation rates of men and women by age, relative to participation at age 22, after taking account of income and other observed characteristics
Note: Coefficients (multiplied by 100) from a linear probability model of pension participation on individual characteristics, as described in the notes to Table 3.1. Coefficients from age 23 to 26 are suppressed due to statistical imprecision as age groups at those ages are small. The age coefficients are statistically significantly different from each other from age 49 onwards. Sample is working-age self-employed workers with no income from employment, who have been self-employed for at least 5 years.
Source: Author’s calculations using HMRC Self Assessment data from 2005–06 to 2014–15.
As the self-employed population has grown over time, the average characteristics of the group have changed. Given this, it is important to understand how much of the decline in pension participation can be explained by changes in characteristics of the self-employed population. In order to assess this, we can run a thought experiment where we allow the average characteristics of the population to change but keep the relationships between characteristics and pension participation constant.
Figure 3.4 shows the results from this thought experiment. The sum of the light green and yellow bars shows the predicted pension participation rate when we fix the relationships between characteristics and pension participation at 2005–06 levels, and only allow the average characteristics of the population to change. The dark green bars are the proportion of the decline in pension participation which can be explained by changes in characteristics, while the yellow bars illustrate the proportion that remains unexplained. We find that the change in characteristics alone would have led to a decline in pension saving of 7 percentage points, while the actual pension participation rate fell by 22 percentage points. This means that the changing characteristics can explain a third of the decline in pension participation of the long-term self-employed between 2005–06 and 2014–15.
Figure 3.4. Pension participation over time, actual and predicted if composition of self-employed workforce was unchanged since 2005–06

Note: The ‘actual level’ bar differs from Figure 3.1 because the sample is further restricted to those for whom none of the variables are missing in any period. The sum of the light green and yellow bars shows the mean predicted values from the predictions created from a regression similar to the one presented in Table 3.1, but only estimated using data from 2005–06. Sample is working-age self-employed workers with no income from employment, who have been self-employed for at least 5 years.
Source: Author’s calculations using HMRC Self Assessment data from 2005–06 to 2014–15.
This thought experiment illustrates that the changing composition of the self-employed workforce explains some of the change in pension participation among this group. However, more than half of the difference remains unexplained, even despite the inclusion of income volatility measures, which have been unavailable in most of the previous research on the pension saving of the self-employed. This is consistent with the finding that the magnitude of the associations between income measures (as well as other observed characteristics) and pension participation is economically small.
These results are similar to findings from previous work examining the working age self-employed population using survey data. Crawford and Karjalainen (2020) found that at most 14% of the decline in private pension participation among the self-employed between 1998–99 and 2018–19 could be explained by changes in the characteristics of the self-employed population that were observed in the cross-sectional household survey data that they use. This is less than we find with the HMRC data, where a third of the decline could be explained by changes in characteristics. The gap seems to be driven by differences in the income data – the association between income and pension participation is stronger in the HMRC data, and the recorded fall in self-employment earnings, especially at the top of the income distribution (where most of the pension saving occurs), is starker in the tax data.10 However, with both data sets the same key conclusion applies: the majority of the decline in private pension participation of the self-employed cannot be explained by changes in observed characteristics of the self-employed population.
4. Pension contributions
It is not only important for retirement incomes whether people participate in a pension scheme, but also how much they contribute. In this section we focus on those of the working-age long-term self-employed who are saving into a pension, and document trends in the level of pension contributions among the contributors in more detail.
Figure 4.1 shows the mean and median contributions over time among the working-age long-term self-employed. Mean contributions among those who are saving into a pension are shown as solid lines and median contributions among those who are saving into a pension as dashed lines. Mean contributions among the full sample are shown as dotted lines. Green lines show contributions as a percentage of total income (right-hand axis) and yellow lines show annual contributions in 2015–16 prices (left-hand axis).
The figure shows that mean pension contributions among people who are contributing to a pension increased over time, both in real-pound terms (from £4,390 to £5,810) and as a percentage of income (from 10% to 12%), while median contributions remained relatively stable (changing from £1,760 to £1,700 and from 7% to 8%). The fact that median values stayed relatively stable while mean values increased implies that contributions are increasing more at the top of the distribution.11
Among the full sample of working-age long-term self-employed, including those who were not saving into a pension, the average (mean) annual contributions fell from £1,362 to £800 ((in 2015–16 prices) or from 3% to 2% of total income over this period.
Figure 4.1. Contributions over time, in pounds per annum (at 2015–16 prices) and as a proportion of total income

Note: Both measures are winsorised at the 99th percentile. Sample is working-age self-employed workers with no income from employment, who have been self-employed for at least 5 years and who are saving into a pension.
Source: Author’s calculations using HMRC Self Assessment data from 2005–06 to 2014–15.
When looking at contributions among those who are saving into a pension, given that pension participation fell sharply over this period, the composition of those saving into a pension has also changed. Thus the upward trend in mean contributions could be driven by a compositional effect, where those who stopped saving were saving at lower saving rates, or it could be because those who continue saving are increasing their saving rates (or a combination of these two explanations).
To assess how those who remain in the sample throughout the period change their pension contributions over time, we can look at a ‘balanced panel’ of (the same) self-employed workers who made pension contributions in every year over the 10-year sample period from 2005–06 to 2014–15. It is worth noting that within the balanced panel, the panel is getting older each year and thus any changes in contributions will to some extent be a combination of life-cycle patterns (of people ageing) as well as time trends in contributions.
Figure 4.2 shows average contributions over time, similar to Figure 4.1, but only for the balanced panel of the self-employed who made contributions over the whole 10-year period. The trends in average contributions among this balanced panel of savers are remarkably similar to the cross-sectional picture. Mean contributions increased from £4,570 to £5,440 in real-pound terms and from 9% to 11% as a percentage of income. Median contributions decreased from £1,940 to £1,680 in real term pounds and increased from 6% to 7% as a percentage of income. This suggests that the role of the changing composition is less important in driving the upward trend in contributions, as mean contributions are also increasing among the balanced panel of savers.
Figure 4.2. Contributions over time among a balanced panel of savers

Note: Both measures are winsorised at the 99th percentile. Sample is working-age self-employed workers with no income from employment, who have been self-employed for at least 5 years and who have been consistently saving into a pension between 2005–06 and 2014–15.
Source: Author’s calculations using HMRC Self Assessment data from 2005–06 to 2014–15.
5. Summary
This report has provided new detail on how pension saving among the self-employed evolved in the UK over the decade from 2005–06 to 2014–15. We first documented how the characteristics of the working-age long-term self-employed changed over this period, and then focused on trends in pension participation and contribution amounts.
We found that while the pension participation rates among the long-term self-employed are slightly higher than among the overall self-employed population, there was a similar dramatic decline in pension participation among all groups. In particular, private pension participation rates in construction, which is the most common single industry among the self-employed, fell from 38% to 12% over this period. Participation rates in some of the industries with initially higher pension coverage did not fall quite as dramatically – pension participation among the medical profession (2% of the self-employed) declined from 87% to 79%.
Given the administrative tax records, we were able to analyse the effect of volatility of incomes on pension participation, and found that those with more volatile incomes are less likely to be participating in a pension. This is also true for those who have lower income, as well as those who are experiencing a ‘bad’ year in terms of their income compared to their 5-year average income. However, these effects are economically small – for example, an increase of £1,000 in self-employment earnings is associated with only a 0.5 percentage point increase in pension participation.
Even after taking into account the large falls in average levels of income and changes in income volatility over this period, only about a third of the decline in pension participation can be explained by changing characteristics and composition of the self-employed population. This is more than previous work using survey data found (Crawford and Karjalainen, 2020), but majority of the decline still cannot be explained by changes in individual and job characteristics that are observed in tax data.
Among those of the self-employed saving into a pension, mean amounts contributed increased over time, while median amounts remained relatively stable. This implies that contributions rose over time, but only for the upper part of the distribution. We see similar trends in pension contributions among the subset of the self-employed whom we observe saving into a pension for the whole 10-year period. This suggests that the trend of mean contributions increasing over time is not fully driven by the changing composition of savers, as this also takes place among those who are consistently saving into a pension.
References
Crawford, R. and Karjalainen, H., 2020. Retirement saving of the self-employed. Institute for Fiscal Studies (IFS) Report R181, https://ifs.org.uk/publications/retirement-saving-self-employed.
Cribb, J., Miller, H. and Pope, T., 2019. Who are business owners and what are they doing? Institute for Fiscal Studies (IFS) Report R158, https://ifs.org.uk/publications/who-are-business-owners-and-what-are-they-doing.
Acknowledgements
The author would like to thank Rowena Crawford for assistance with the analysis, and Carl Emmerson, Jonathan Cribb and David Sturrock for helpful feedback and comments. The author would also like to thank Laurence O’Brien for assistance with the Annual Survey of Hours and Earnings (ASHE) data. This research was funded by the IFS Retirement Saving Consortium (2018–20), which comprised Age UK, the Association of British Insurers, Aviva UK, Canada Life, the Chartered Insurance Institute, the Department for Work and Pensions, the Investment Association, Legal and General Investment Management, and the Money and Pensions Service. Support from the ESRC Centre for the Microeconomic Analysis of Public Policy (ES/M010147/1) is also gratefully acknowledged. This work was produced using statistical data from the ASHE, provided by the Office for National Statistics (ONS). The use of the ONS statistical data in this work does not imply endorsement of the ONS in relation to the interpretation or analysis of the statistical data. This work contains statistical data from HM Revenue and Customs (HMRC) which is Crown Copyright. The research data sets used may not exactly reproduce HMRC aggregates. The use of HMRC statistical data in this work does not imply the endorsement of HMRC in relation to the interpretation or analysis of the information.
Appendix 1
Description of the data set12
This report draws on administrative data from tax records provided by HMRC. For our analysis we use the universe of self-assessed income tax records. In the current data set we observe detailed income data (and reliable pension variables) from 2001–02, and as we focus on the long-term self-employed we only use data from 2005–06. We only use data up to 2014–15, because we exclude the first and last year of data for each individual, as we do not know whether they were self-employed the whole tax year in those years.
Between 8 million and 11 million people submit Self Assessment income tax forms each year (the majority of UK adults are not required to do so). All self-employed people (sole traders earning over £1,000 per year and all partners) and all company directors are required to submit a Self Assessment tax return.13 These data therefore cover the universe of people running their own business for the duration of their time as a self-employed person, but will only include a selected subset in periods beforehand or afterwards. Each individual has a unique identifier in the data, based on their National Insurance (NI) number, which means that we can follow people over time.
Information on sole traders
We define a sole trader as a person who submits at least one self-employment Self Assessment income tax page (SA103) and reports positive sales. This definition captures all people who actively trade as a sole trader in the fiscal year in question. It does not require that self-employment is their only, or even their main, source of income, although in most of our analysis in this report we limit the sample to those of the sole traders who do not have any income from employment (i.e. as an employee of a different employer). The SA103 form includes variables such as reported turnover (sales), taxable profit (which is turnover net of allowable costs) and capital allowances (the subset of allowable costs that are deductions for plant and machinery investment). In our analysis we also utilise a Standard Industry Classification (SIC) code created by HMRC based on information reported on the tax form, converting a text-box description of the business industry into the appropriate SIC code. In around 25% of cases, HMRC is unable to assign a business to an industry. In those cases, this information is missing.
Other people who need to complete a Self Assessment tax return include anyone earning over £100,000 and anyone earning income that is not taxed at source (e.g. property income, foreign income or income from trusts). In the small minority of cases where more than one page is submitted (i.e. the person has more than one self-employed business), the data take totals (at the individual level) for each variable.
A more granular breakdown of costs (the amount spent on salary, debt interest, travel expenses, etc.) is available for a subset of sole traders in each year with turnover above a threshold level (equal to the VAT threshold in recent years). This accounts for a small minority of sole traders, and so we do not utilise this information when describing the sole trader population here.
We define a partner as a person who submits at least one partnership Self Assessment income tax page (SA104). This definition captures all people who report being a partner in a partnership in the fiscal year in question (each partner in a partnership must submit an SA104 tax form). Unlike for sole traders, the tax form does not provide information on the business activities (turnover and costs, including capital allowances) of the partnership. This information is provided to HMRC on the SA800 tax form (submitted at the partnership level, rather than by each partner). These data are not currently available to researchers. The partnership (SA104) tax form does provide information on the partnership profits assigned to the partner and the industry in which the partnership is based, again utilising a SIC code created by HMRC based on information reported on the tax form.
Information on taxable incomes
Business owners do not only receive income from their business. We use variables based on the SA302 tax calculation form, which is derived from Self Assessment forms by HMRC. It records an individual’s total taxable income, broken down by income source. As well as self-employment (sole trader) and partnership profits, the data set also provides income from employment and directorships, dividends, pensions, interest, property, share schemes, trusts and estates, and foreign income. We measure whether a sole trader or partner is also an employee based on whether they have positive income from employment in the relevant fiscal year, and record them as having more employment income than income from their business if employment income is higher than self-employment (sole trader) and partnership profits, respectively.
Information on individual characteristics
Based on information provided on the tax form, we have variables that capture basic demographic characteristics (age, gender and region). We are also able to identify people who are foreign born and who moved to the UK after the age of 16. To participate in the UK labour market (as an employee, a self-employed person, a company director or even someone eligible for unemployment benefits), a person requires a unique NI number. For people residing in the UK on their 16th birthday, their NI number is issued then. A foreign national who works in the UK will have their NI number issued when they start working in the UK. NI numbers are issued in sequence, meaning that, based on the first two characters of the NI number, it is possible to work out when it was issued. The data also provide information on age. We say that an individual is foreign born if they received their NI number after they were 16.
Appendix 2
Sample selection
Every individual in the UK with annual sole trader earnings of more than £1,000 or with any partnership income has to submit a Self Assessment tax return. In our analysis we want to focus on a specific group of the self-employed – those who are of working age so would be captured by the automatic enrolment age bracket if they were employees, and those who have been self-employed for a number of years without employee income, in order to make sure they do not have an employee pension that we cannot observe.
More specifically, in the main analysis:
we only include those aged 22–64;
we only include those who have no income from being an employee;
we only include those whom we observe in the data for five consecutive years with no employment income;
we exclude the first and last year that we observe someone in the data, as we cannot know if they have been self-employed for all of the tax year or only a part of it, so including those years would distort our income calculations.
Given these restrictions, and the fact that we observe incomes from tax year 2001–02 to 2015–16, we can use data from 2005–06 to 2014–15. Figure A2.1 shows how much these restrictions cut down the sample from the overall population of everyone submitting a Self Assessment tax return. Most of our analysis uses the sample of the working-age long-term self-employed, which is equivalent to about 50% of the full sample of those submitting a Self Assessment tax return.
Figure A2.1. Proportion of all self-employed in each sample definition, over time

Source: Author’s calculations using HMRC Self Assessment data from 2005–06 to 2014–15.
In this report we have used a 10% random sample of the full population for computational purposes. Table A2.1 shows the number of observations over time for the full self-employed population and our sample of interest.
Table A2.1. Sample size over time
| Everyone with self-employment income | Long-term only self-employed (working-age with no employment income) |
2005–06 | 322,403 | 159,946 |
2006–07 | 324,713 | 160,024 |
2007–08 | 329,598 | 160,531 |
2008–09 | 335,210 | 162,052 |
2009–10 | 343,418 | 167,151 |
2010–11 | 347,088 | 170,164 |
2011–12 | 358,571 | 175,119 |
2012–13 | 370,017 | 180,101 |
2013–14 | 378,576 | 183,379 |
2014–15 | 384,031 | 184,953 |
Source: Author’s calculations using HMRC Self Assessment data from 2005–06 to 2014–15.
Appendix 3
Gender differences
Figure A3.1. Pension participation of the working-age long-term self-employed by gender over time

Note: Sample is working-age self-employed workers with no income from employment, who have been self-employed for at least 5 years.
Source: Author’s calculations using HMRC Self Assessment data from 2005–06 to 2014–15.
Table A3.1. Characteristics among the working-age long-term self-employed by gender, 2014–15
| Men | Women |
Average age (years) | 48 | 49 |
Proportion self-employed 9+ years | 67% | 60% |
Proportion immigrants | 12% | 12% |
Proportion partners | 20% | 27% |
Proportion living in London | 14% | 14% |
Proportion earning less than £10k | 28% | 44% |
Proportion earning above higher-rate tax threshold | 12% | 11% |
Agriculture, mining, utilities | 7% | 5% |
Manufacturing | 4% | 3% |
Construction | 38% | 2% |
Wholesale and distribution | 8% | 9% |
Hotels | 3% | 5% |
Transport excluding taxis | 2% | 1% |
Taxis | 8% | 1% |
Financial and professional services | 4% | 5% |
Business services including real estate | 9% | 17% |
Medical | 2% | 4% |
Other health, educational and social services | 2% | 8% |
Recreational services | 3% | 6% |
Hairdressing | 1% | 15% |
Domestic services | 5% | 15% |
Note: Sample is working-age self-employed workers with no income from employment, who have been self-employed for at least 5 years.
Source: Author’s calculations using HMRC Self Assessment data for 2014–15.
Figure A3.2. Self-employed earnings by gender over time, pounds per year, 2015–16 prices

Note: Sample is working-age self-employed workers with no income from employment, who have been self-employed for at least 5 years.Source: Author’s calculations using HMRC Self Assessment data from 2005–06 to 2014–15.
Appendix 4
Additional results
Figure A4.1. Distribution of year-to-year percentage changes in pre-tax earnings

Notes: Pooled data from 2005–06 to 2014–15. Sample is working-age self-employed workers with no income from employment, who have been self-employed for at least 5 years, and all working-age employees. Earnings of the self-employed refer to earnings from self-employment only, and the notes from Figure 2.3 for the distribution of year-to-year percentage changes in self-employment income also apply here.
Source: Author’s calculations using HMRC Self Assessment data 2005–06 to 2014–15 and the Annual Survey of Hours and Earnings from 2005–06 to 2014–15.
Table A4.1. Proportion of the long-term self-employed in each of the subgroups
| 2005–06 | 2014–15 |
Incomes £0–8k | 17% | 22% |
Incomes £8–14k | 18% | 28% |
Incomes £14–26k | 26% | 26% |
Incomes £26k+ | 38% | 25% |
Age 21–34 | 7% | 9% |
Age 35–44 | 27% | 23% |
Age 45–54 | 33% | 38% |
Age 55–64 | 32% | 30% |
Proportion above higher-rate tax threshold | 17% | 12% |
Has property income | 11% | 13% |
Has taxable pension or benefit income | 10% | 9% |
Industry |
|
|
Agriculture, mining, utilities | 9% | 6% |
Manufacturing | 5% | 4% |
Construction | 25% | 28% |
Wholesale and distribution | 14% | 8% |
Hotels | 4% | 3% |
Transport excluding taxis | 2% | 2% |
Taxis | 5% | 6% |
Financial and professional services | 6% | 5% |
Business services including real estate | 9% | 11% |
Medical | 3% | 2% |
Other health, educational and social services | 4% | 4% |
Recreational services | 4% | 4% |
Hairdressing | 4% | 5% |
Domestic services | 5% | 8% |
| 2005–06 | 2014–15 |
Region |
|
|
North East | 3% | 3% |
North West | 10% | 9% |
Yorkshire and the Humber | 8% | 8% |
East Midlands | 7% | 7% |
West Midlands | 8% | 8% |
East of England | 11% | 11% |
London | 11% | 14% |
South East | 15% | 15% |
South West | 11% | 10% |
Wales | 5% | 5% |
Scotland | 7% | 7% |
Northern Ireland | 4% | 3% |
Note: Income bands expressed in 2015–16 prices.
Source: Author’s calculations using HMRC Self Assessment data from 2005–06 to 2014–15.
Table A4.2. Pension membership among different groups of the long-term self-employed
| 2005–06 | 2014–15 |
Incomes £0–8k | 20% | 7% |
Incomes £8–14k | 28% | 10% |
Incomes £14–26k | 37% | 16% |
Incomes £26k+ | 56% | 36% |
Female | 31% | 16% |
Male | 43% | 18% |
Age 21–34 | 22% | 4% |
Age 35–44 | 37% | 12% |
Age 45–54 | 45% | 21% |
Age 55–64 | 41% | 22% |
Partners | 50% | 33% |
Sole traders | 36% | 14% |
Industry |
|
|
Agriculture, mining, utilities | 51% | 36% |
Manufacturing | 40% | 18% |
Construction | 38% | 12% |
Wholesale and distribution | 39% | 19% |
Hotels | 31% | 13% |
Transport excluding taxis | 40% | 14% |
Taxis | 20% | 5% |
Financial and professional services | 64% | 46% |
Business services including real estate | 36% | 16% |
Medical | 87% | 79% |
Other health, educational and social services | 37% | 16% |
Recreational services | 32% | 17% |
Hairdressing | 34% | 13% |
Domestic services | 25% | 8% |
Note: Income bands expressed in 2015–16 prices.
Source: Author’s calculations using HMRC Self Assessment data from 2005–06 to 2014–15.
Endnotes
Authors

Heidi Karjalainen
Heidi is a Senior Research Economist in the Retirement, Saving & Ageing sector. Her current research is on pensions and saving for retirement.
More from IFS
Understand this issue


Policy analysis


Academic research


