
Downloads

Download chapter as a PDF
PDF | 1.63 MB
Personal independence payment (PIP) is the main working-age disability benefit in England and Wales. Eligibility is based only on whether someone has difficulty carrying out daily tasks – it is not means-tested on income or wealth, nor linked to work status. In this chapter, we use the term ‘disability benefits’ to refer to PIP and disability living allowance (DLA) – an equivalent benefit that PIP has gradually replaced for working-age adults since 2013.
The government has set up a review – the Timms Review – which is working with disabled people to make recommendations, due this autumn, on the design of the disability benefit system. The Timms Review has declared the current system ‘no longer fit for purpose’ and is exploring structural changes to how eligibility for the benefit is assessed and what type of support recipients receive. It has committed to only make recommendations that leave spending on disability benefits in line with or below the current forecasts for spending. The government may choose to implement some reforms to the disability benefit system at the Budget.
This chapter outlines what is known about the effectiveness of the current disability benefit system and the experiences of recipients and it explores potential options for reforming the structure of disability benefits. We focus on the question of how to structure the system rather than on how much to spend on the system. The structural reforms we study would either leave total spending unchanged or reduce spending if implemented in isolation. However, each reform could be combined with changes in the amount provided per claimant to achieve any level of total spending on the system. For example, a reform that reduced eligibility could be combined with an increase in award amounts to leave total spending unchanged.
Key findings
- The share of 16- to 64-year-olds claiming disability benefits increased from 5.5% in August 2019 to 8.2% in August 2025. There have been large increases across all ages and health conditions, with the fastest proportional increases for claims relating to mental health, learning and neurodevelopmental conditions and claims from younger adults.
- Rising numbers of people claiming disability benefits has pushed costs up. Spending on working-age disability benefits has risen in real terms from £14 billion in 2019–20 to £25 billion in 2025–26. This, combined with rising spending on other health-related benefits, is the main reason that total benefit spending on working-age adults and children rose from 4.3% of GDP in 2019–20 to 4.7% of GDP in 2025–26 (from £127 billion to £148 billion in today’s prices). This puts total working-age benefit spending as a share of GDP around the level it was at in 2015–16. Working-age disability benefits now make up a much greater share of total benefit spending on working-age adults and children – 21% now, up from 11% in 2015–16. Official forecasts suggest working-age disability benefit spending will rise further to £34 billion in 2030–31 (1.0% of GDP and 26% of non-pensioner benefit spending).
- PIP claimants are more likely to report struggling to afford essentials than both disabled people who do not claim PIP and non-disabled people. 51% of PIP claimants are in ‘material deprivation’ (meaning they report being unable to afford five or more basic essentials out of a list of 21 items), higher than the share of people with disabilities who do not claim PIP (33%) and much higher than the same figure for people without disabilities (15%). Those who claim PIP tend to have lower household incomes than those without disabilities, which explains part of the difference, but substantial gaps remain even when comparing households with the same incomes. One reason for this could be that people with disabilities have higher living costs. These gaps in material deprivation provide one rationale for benefits that provide additional income to people with disabilities.
- PIP claimants are also more likely to report low life satisfaction than both disabled people who do not claim PIP and non-disabled people. 26% of PIP claimants report low levels of life satisfaction, compared with 16% of disabled people not claiming PIP and 4% of people without disabilities. Again, gaps remain when comparing people with similar levels of income. This could be driven by disabled people having higher living costs, or because of other impacts of having a disability on well-being. Another reason that governments may want to provide additional support to disabled people is to improve their well-being. If this is the government’s priority, it should look to provide the most cost-effective support to improve well-being for disabled people. This could be providing cash in some instances, but it also may be providing in-kind support such as therapy, which has been shown to improve well-being for people with mental health issues.
- PIP currently gives the same amount of money to people with very different levels of assessed disability. PIP assessments assign ‘points’ to applicants, based upon the number and severity of difficulties they have with daily living activities and with mobility. To get the highest daily living component of PIP (currently worth £5,960 per year), claimants need to score 12 or more points. 53% of claimants reach this threshold, and 26% of claimants get 16 points or more and 5% get at least 31 points – yet these claimants all receive the same benefit amount. There is a case for tying support more closely to the degree of disability. If done using the current PIP assessment, this would particularly benefit younger claimants and claimants with learning disabilities or cerebral palsy, who are particularly likely to score a very high number of points.
- Currently, assessors award PIP based on an assessment of the applicant’s difficulties doing certain tasks. One potential reform would be to also require specific medical diagnoses to qualify. This would introduce an extra, potentially more objective, check on the disability of the claimant. However, requiring any medical diagnosis would only have a modest impact on the number of people who are eligible because 85% of PIP claimants already report having a medical diagnosis and 69% report having multiple diagnoses for different conditions – and these figures would likely rise if PIP receipt required a diagnosis. Alternatively, the government could restrict PIP eligibility to just a subset of medical diagnoses, which would deliver bigger savings, at the cost of more people losing access to PIP. Making PIP conditional on medical diagnoses could remove some of the subjectivity of the current assessment, although medical diagnoses also often require some subjective judgement. It would also put additional costs on both applicants and the health system and may push more people to seek private diagnoses for health conditions.
- Another commonly discussed option is for PIP to treat mental and physical health conditions differently, perhaps substantially reducing entitlements for the former. Administrative data show that 45% of existing PIP claimants have, when assessed, a mental health condition or a learning or neurodevelopmental condition listed as their main disabling condition. One way of restricting access to PIP for those with mental health conditions would be to require that claimants have a physical health diagnosis. This would significantly reduce the cost of PIP. However, these savings are both uncertain and likely far smaller than that 45% headline might suggest, for two reasons. First, two-thirds of claimants with a diagnosis for a mental health, learning or neurodevelopmental condition (irrespective of whether it is the ‘main’ condition) also report a physical health diagnosis. Second, more claimants would likely obtain a physical diagnosis if it was a requirement for PIP receipt. If the government wanted to make bigger savings, it could restrict access only to those with certain physical health diagnoses.
- The government could reduce the generosity of the disability benefit system specifically for young people, perhaps if it considers any negative effects of receiving these benefits to be larger for those who have a whole working life ahead of them. There are 689,000 people under 30 who claim PIP (20% of the total working-age PIP caseload), accounting for £5.5 billion per year in spending. However, young PIP recipients are disproportionately likely to have the most severe disabilities; 12% of 16- to 19-year-old recipients receive at least 31 points in the PIP daily living assessment, compared with 5% among all PIP recipients. If policymakers wanted to keep providing PIP for young people with more severe disabilities (proxied as those who get the highest possible award) while removing it for others, the impact on the caseload and spending would fall to 327,000 and £2.2 billion respectively, before accounting for any behavioural responses.
- One unusual feature of PIP relative to other benefits is that it is not means-tested, so high-income households can claim it. If the main goal of the benefit is to reduce inequalities arising from disability, there is a good case for keeping PIP as a non-means-tested benefit. Alternatively, if greater weight is placed on ensuring that disabled people can obtain a minimum standard of living, there is a stronger argument for means-testing PIP – something recently proposed by Reform UK, though the Timms Review has indicated it will recommend keeping PIP non-means-tested. Means-testing PIP, by integrating it into universal credit, would deliver a saving of £8.2 billion (33% of PIP spending) if claimant behaviour did not respond to the change. However, in reality, the saving will be somewhat smaller due to behavioural responses. In response to the change, more people would claim universal credit in order to keep their PIP, and fewer people would work as the reform would weaken work incentives.
7.1 Introduction
Since 2019, there has been a big increase in the number of people claiming personal independence payment (PIP) or equivalent legacy benefits. PIP is a cash payment with the stated purpose of providing additional income to cover extra living costs faced by disabled people. In August 2025, 8.2% of people aged 16–64 in England and Wales claimed disability benefits, up from 5.5% in August 2019.
More people claiming a disability benefit has led to increased spending on them. Spending on working-age adults increased from £14 billion in today’s prices in 2019–20 (0.5% of GDP) to £25 billion in 2025–26 (0.8% of GDP). Spending is forecast to increase further to £34 billion by 2030–31 (Department for Work and Pensions, 2026c). Working-age disability benefits now make up a much greater share of total benefit spending on working-age adults and children – 21% now compared with 11% in 2015–16. Rising spending on these benefits is one of several factors putting upward pressure on total public spending. Cuts to disability benefits would be one way the Chancellor could reduce the broader pressures on the public finances (see Chapter 2 of the Green Budget).
In response to these trends, the government announced its intention to reform PIP. It has commissioned the Timms Review of PIP, which is being co-produced with disabled people. In its interim report in July, the Timms Review declared that PIP was ‘no longer fit for purpose’, and it is due to make recommendations on the future disability benefit system in a final report in the autumn. The government has also commissioned a review into the employment and education outcomes of 16- to 24-year-olds (the Milburn Review), which is also due to report this autumn and could include recommendations about PIP for people aged under 25 in particular. The Chancellor may choose to propose reforms to PIP at the Budget.
The government faces a choice over both how much to spend on disability benefits in total and how to distribute that spending to different people. In this chapter, we discuss a range of potential options for changing the structure of the disability benefit system inspired by proposals made by commentators, political parties and systems in other countries. We focus primarily on the question of how to distribute a given level of spending, but we also briefly discuss options that could reduce total spending.
PIP has three key features that distinguish it from other health-related benefits. First, it is not means-tested: the amount you can claim does not vary based on your other income. Second, you can apply for it while in or out of work. Third, claims for it are assessed based on applicants’ ability to do day-to-day activities such as washing themselves or preparing food, rather than on their ability to work. Disability living allowance (DLA), which PIP has gradually replaced since 2013, shares a similar structure. Throughout this chapter, we will refer to PIP and DLA jointly as ‘disability benefits’, and spending or caseload numbers will include claimants of either benefit unless otherwise stated.
Any reform to PIP should consider it in combination with the other types of support available to disabled people. There are other health-related benefits, most notably incapacity benefits, the biggest of which is the health element of universal credit. The rationale for incapacity benefits is to support people whose disability limits their ability to work. Accordingly, most incapacity benefits are means-tested, applicants need to be out of work (or working limited hours) to apply for them and they are awarded based on an assessment of how the applicant’s disability affects their ability to work. People can claim both incapacity and disability benefits, and around half of those who claim either type of benefit also claim the other. There has been a big increase in claims for and spending on incapacity benefits since the COVID-19 pandemic, but in this chapter we focus on options for disability benefits as they are the focus of the Timms Review.
Many disability benefit recipients also receive state support for their health conditions from the adult social care system or from the healthcare system. Young adults could also be getting support for their special educational needs through the education system. While considering how to reform the disability benefit system, the government needs to account for interactions across these different systems, look for ways of joining up support and consider whether it is providing the right balance of support for disabled people.
In this chapter, we focus on the disability benefit system in England and Wales. Since 2020, disability benefits have been devolved to Scotland and the Scottish Government has replaced PIP with the adult disability payment (ADP), which functions in a similar way but with a different assessment system.1 Any reforms to disability benefits in England and Wales would not directly affect the disability benefit system in Scotland, but reforms that affected the amount spent on disability benefits could alter total funding for the Scottish Government.2 Disability benefits are also devolved in Northern Ireland, but in practice the Northern Irish system matches the system in England and Wales almost exactly.
We also restrict our attention to working-age PIP claimants. Under-16s and pensioners are not eligible to apply for PIP and instead can apply for alternative disability benefits (child disability living allowance for under-16s, attendance allowance for pensioners). However, if someone is claiming PIP when they reach pension age, they can continue to receive PIP (instead of attendance allowance). In this report, the numbers we quote do not include pension-age PIP claimants, of which there are 697,000 currently.
The rest of the report is structured as follows: Section 7.2 explains how PIP currently works and highlights some issues with the way eligibility is currently assessed, Section 7.3 describes who claims PIP and documents recent trends in claimant numbers, Section 7.4 discusses what government might be trying to achieve with a disability benefit, Section 7.5 examines some options for policy changes to PIP and Section 7.6 concludes.
7.2 How does PIP currently work?
In this section, we summarise how PIP currently works and some of the challenges with the current system.
PIP has two components: a ‘daily living’ component and a ‘mobility’ component. The daily living component is assessed based on the applicant’s ability to do various day-to-day activities and the mobility element is assessed based on the applicant’s ability to get around.
How are new applications to PIP assessed?
To apply for PIP, an applicant needs to go through a multi-stage process. First, they phone the Department for Work and Pensions (DWP) to register their interest in applying.3 Second, they fill in a form, either online or on paper, which details how their condition(s) affects them, which they must provide evidence to support. For those with the most severe conditions, the government might judge this form to be sufficient evidence and then allocate them an award without further assessment.4 Otherwise, the applicant is invited to a face-to-face or virtual assessment where an assessor asks for more evidence to support the individual’s claim. The assessment process itself is costly: assessments currently cost on average £326 each (National Audit Office, 2023), or £0.2 billion per year in total (around 1% of spending on awards). The government then decides whether to award the applicant PIP and what level of PIP to award them.5
The government assesses PIP applicants based on their ability to do various activities. The daily living component is assessed based on 12 activities. For example, one activity is ‘preparing food’, where applicants are given scores depending on whether they can prepare and cook food (either unaided, with help or not at all, with the score increasing in how much assistance they need). The mobility component is scored on only two activities: applicants’ ability to ‘plan and follow journeys’ and applicants’ ability to ‘move around’. These questions are thus not directly linked to whether the applicant has a given medical condition but instead seek to assess the functional impairment that an applicant has overall. Each of the activities requires subjective judgements on the part of the assessor and applicant as to their ability to do various activities and, as we discuss later, this leads to arbitrary variation in assessment scores across assessors.
How much money do PIP recipients get?
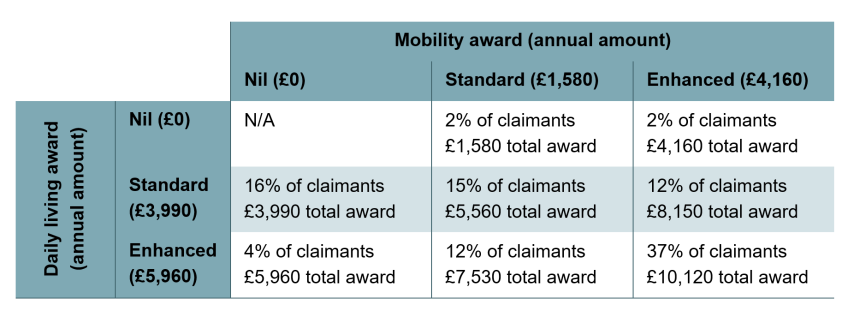
For either element, recipients can receive a standard or enhanced award, depending on their score on each part of the assessment; recipients can also receive both the daily living and the mobility component. Table 7.1 shows the distribution of awards amongst PIP claimants in November 2025. While the average amount received is £7,420 per year, 37% of claimants received both the enhanced daily living component and the enhanced mobility component, leading to a total award of £10,120 a year.
Table 7.1. Share of PIP claimants aged 16–64 receiving different awards and the annual amounts
Note: England and Wales only. Includes a small number of disability living allowance claimants aged 16–64. Rounded to nearest £10. Totals may not sum due to rounding. Shares of claimants are as of November 2025, and award amounts are as of 2026–27.
Source: Authors’ analysis of Department for Work and Pensions Stat-Xplore data for November 2025.
Applicants’ experience of the assessment
Many applicants to PIP report concerns, worries or negative experiences relating to the assessment process. A common complaint is that the process requires a lot of work from the applicant to evidence their claim. One Timms Review respondent said: ‘It is an extremely longwinded and unnecessarily complex process, which places additional stress on individuals who are already vulnerable’. In a survey of people considering applying to PIP, just over half reported having worries about applying, and 11% worried that the application would be too difficult (Barry et al., 2018).
Another common complaint is that the assessment feels inquisitory rather than supportive. One respondent to the Timms Review said: ‘I felt like I was being crossexamined, not supported. Every answer I gave felt like it was being used against me’. In a survey of applicants going through an assessment, nearly a quarter of applicants reported that the assessor did not listen to them (Barry et al., 2018). All else equal, clearly the government should try to improve applicants’ experience of the assessment, though it will need to weigh this up against other objectives such as the accuracy of the assessment, clarity of the assessment criteria and costs of carrying the assessments out. The Timms Review’s ‘emerging recommendations’ in September 2026 suggest a number of reforms designed to improve the experience of applying for PIP, such as making the forms easier to complete and providing advocacy services for claimants who struggle to articulate the effects of their condition (Department for Work and Pensions, 2026d).
The design of the application process also affects who applies for PIP. The more time-consuming and difficult the application process is, the fewer people are likely to apply. This effect reduces the fiscal cost of the scheme, by reducing both the number of assessments, which are costly in themselves, and the number of actual awards.
A crucial question is who gets ‘screened out’ from applying by these sorts of barriers, and how likely they would be to be accepted if they had applied. When the US Social Security Administration closed field offices in the US where claimants could get support to apply for disability insurance, fewer people applied and those dissuaded from applying were on average more disabled than the typical applicant (Deshpande and Li, 2019). In contrast, when the UK government trialled an online form for applying for PIP, applications increased by 27%, but these additional applications were much less likely to be accepted than the average applicant (Department for Work and Pensions, 2026b), suggesting that those screened out by the previous application process typically had lower levels of need than those who would have applied anyway. If it is considering reforming the assessment process, the government should therefore consider the effects of changes on who applies for PIP.
Inconsistency in assessment outcomes
Another key consideration in the design of the disability benefit system is the extent to which the test can consistently and correctly assess people. This matters both because the government presumably wants to treat people who are similarly impacted by their conditions similarly, and because targeting is worse if the system is noisy (some people who the government wants to get support may miss out, or people who the government does not want to get support may receive it).
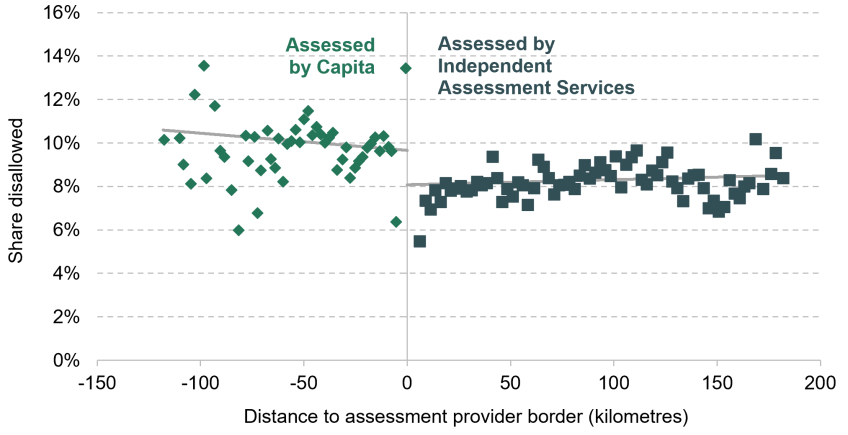
Figure 7.1 shows an example of the noise in the PIP assessment by examining one source of this inconsistency: which of the two PIP assessment providers handles the application. Those who live in the Midlands, Wales and Northern Ireland are assessed by Capita, while those who live in the South or North of England or Scotland are assessed by Independent Assessment Services (IAS). We compare the experiences of those being assessed either side of the southern border between the two providers, between the Midlands and the South. Since differences in the application process between providers could alter who decides to apply in the first place, we include only reassessments of people who previously claimed DLA, the disability benefit that PIP replaced.6 All DLA claimants were automatically reassessed as part of the transition to PIP, and so should be comparable across the border. Instead, we find that those who lived just on the Capita side of the border had around a 9.7% chance of being rejected, whereas those who lived just on the IAS side had an 8.1% chance (a 1.6 percentage point difference or, in proportional terms, a 20% difference). This is evidence that there are different interpretations of the assessment process across the providers and this leads to arbitrary variation in treatment of applicants.
Figure 7.1. Border discontinuity in disallowance rates for DLA to PIP reassessments across two assessment providers for PIP
Note: Analysis of southern border between Capita and Independent Assessment Services. Includes all DLA to PIP reassessments carried out in 2013–25. Estimated difference is based on difference in fitted line either side of the border. Each point represents a Middle Layer Super Output Area, an area containing between 2,000 and 6,000 households.
Source: Authors’ analysis of Department for Work and Pensions Stat-Xplore.
This is evidence of variation in treatment between assessment providers, but it is likely that there is also variation between the individual assessors employed by each provider. One piece of evidence for this is that unsuccessful applicants can apply to ask a second assessor to review their application.7 When this occurs, 15% of initially rejected applications are awarded PIP following review. While some of these overturned decisions occur because the applicant provides more evidence as part of their appeal, some of these decisions are likely overturned simply due to differences in interpretations across assessors. Evidence suggests there is considerable variation between assessors for disability-related benefits in the US, for example (Maestas, Mullen and Strand, 2013; French and Song, 2014).
This inconsistency in how claimants are assessed weakens the case for having a disability benefit system. Imagine an extreme case where the disability benefit assessment is purely random, and so someone with a severe disability and someone with no disability have the same probability of being accepted onto the benefit. In this case, there would clearly be little point in having a disability benefit system, since the government cannot target money to those with a disability. Conversely, if the disability benefit assessment can accurately differentiate between people with more or less severe disabilities, policymakers can target greater resources towards those with greater levels of disability.
There may be things the government could do to reduce the variability of assessments, and indeed the Timms Review’s ‘emerging recommendations’ suggest several reforms along these lines. Some may be relatively low-cost – for instance, introducing a framework for assessments to improve consistency across assessment providers. However, others (not included in the ‘emerging recommendations’) – such as collecting more information from applicants and perhaps making the assessments longer – may lead government to incur greater direct costs. Such reforms may also make the assessment more intrusive or demanding for applicants. The government should weigh these costs against the benefits of more accurate assessments.
The degree of noise and variation in the PIP assessment may vary between people with different conditions and different levels of severity. For example, some types of conditions may receive more consistent assessment than other types of conditions, even in a functional assessment that asks the same questions of all applicants. All else equal, the government may want to offer higher payments to groups of applicants for whom the assessment is more reliable, as there will be less risk that they are receiving more support than the government intends. This is one reason to potentially treat mental and physical health conditions differently, something we examine in more detail in Section 7.5.
How much can applicant behaviour change awards?
It is possible that applicant or assessor behaviour might change in response to changes in the assessment criteria. At its most extreme, this could be fraud, in which someone reports a health condition or functional disability that they do not actually have or exaggerates a condition to cross a threshold within the PIP assessment.8 More benignly, applicants will put more effort into providing evidence to meet the criteria of the assessment the more important it is. For instance, medical evidence that supports an applicant’s account can strengthen a PIP application. Getting this evidence requires effort and, in some instances, financial cost on the applicant’s part. The more important this evidence is for the result of the application, the more effort an applicant is likely to put into providing that evidence.
The scale of behavioural responses to assessment criteria is difficult to measure directly; we do not have a good measure of functional disability other than the one in the PIP assessment. However, during the transition from DLA to PIP, there was strong evidence of a behavioural response among those with lower levels of disability. The DLA daily living component had three levels.9 PIP retained only the middle and upper levels. Modelling conducted by the government prior to the transition projected that it would reduce spending by 27% and the working-age caseload by 28%, mostly driven by people with the lowest daily living award under DLA receiving nothing under PIP (Office for Budget Responsibility, 2019). This initial modelling was based on trial assessments, which were carried out without any stakes for the applicants – they did not determine award amounts – and so did not account for incentive effects on claimant behaviour. If anything, the reform increased spending (Office for Budget Responsibility estimates suggest by 15–21%), likely in part because applicants responded to the reforms by better tailoring their applications to the PIP criteria than the initial modelling suggested they would. This example suggests that claimant behavioural response to changes in assessments can be significant.
Basing the assessment on more verifiable information would limit the scope for claimant behaviour to affect awards, but this would have to be traded off against the risk of denying support to people who have severe but difficult-to-verify limitations.
When are PIP claimants reassessed?
Most claimants for PIP are periodically reassessed (formally, ‘reviewed’).10 When that reassessment takes place depends on the outcome of their initial assessment. Those assessed to have a more changeable health condition can be reassessed as soon as three years after their initial assessment, whereas those with severe conditions that the government judges unlikely to change are given only a light-touch review after ten years. For claimants who get a full review, the government sends them another form to detail how their condition(s) affects their ability to do day-to-day activities and then can ask them to attend another in-person or virtual assessment.
The government faces a difficult decision in setting the frequency of reassessments. 18% of planned reassessments end in claimants losing access to PIP, and for another 25% the amount they receive changes (either increasing or decreasing). Each reassessment comes at an administrative cost for the government and requires effort on the part of claimants, who often describe the process as unpleasant. There are also operational limits to the number of reassessments that providers can currently carry out. Indeed, the default review period was recently increased from two years to three to reduce operational pressures on the assessors. The other side of the trade-off is that more frequent reassessments mean that support is more closely linked to claimants’ existing conditions.
Lessons from the current system for any proposed reforms
A potential pitfall for policymakers when considering reforming PIP is to consider the question ‘Who do we want to target resources towards?’ and not ask two other important questions: ‘How well can any assessment process identify those we want to target resources towards?’ and ‘How does the assessment process itself affect the well-being of applicants?’. The evidence from this section shows that there are three key issues with the PIP assessment: some applicants find it difficult or stressful; there is arbitrary variation in the treatment of similar claimants; and the assessment criteria are to some degree subjective, leading to the risk that applicants’ behaviour can affect the outcomes of their assessment. While it is unlikely any of these issues can be entirely avoided, any proposal for reform should consider how the new system compares on these issues relative to the current system.
7.3 Trends in disability benefit claims
In this section, we document who claims disability benefits, look at how this has changed over time and review what is known about potential causes of recent changes.
Who are PIP claimants?
Severity of disability
There are many different definitions of disability. The most commonly used one is the Equality Act definition that to have a disability someone must have a condition that lasts or is expected to last 12 months or longer that limits their day-to-day activities. In 2024, 22% of working-age adults in England and Wales reported a disability based on this definition.11 The share of people reporting a disability in the UK has risen to record highs according to most data sources, though there are differences across sources, and some even suggest that there has not been an increase (Latimer, Ray-Chaudhuri and Waters, 2025).
Although 22% of working-age adults reported a disability in 2024, only 7.5% of working-age adults claimed PIP (or an equivalent benefit). This suggests that a majority of those who report having a disability are not claiming disability benefits. Someone who reports a disability might not claim disability benefits for two reasons. First, their disability may not be sufficiently severe or not limit their day-to-day activities in the kinds of ways the PIP assessment tests for, meaning they are ineligible for PIP. Second, they might not apply for PIP despite being eligible, because they choose not to or because they are not aware of the benefit or that they would be eligible for it.
In order to assess the severity of disability among PIP claimants and compare it with other disabled people and the broader population, we use Understanding Society, a representative survey of UK households. As a proxy for the severity of disability, we use a set of questions asking whether respondents experience difficulties in a range of different areas (mobility, manual dexterity, personal care, etc.) and count the number of areas in which they have a difficulty. This list is similar to, but not the same as, the questions asked in the PIP assessment, so it is possible that some differences reflect this distinction. Answers to these questions, as well as benefit receipt itself, are self-reported in the survey. Some PIP recipients may not mention when surveyed that they receive the benefit, creating some measurement error. Readers should therefore focus on the broad relationships rather than the specific figures in this analysis.
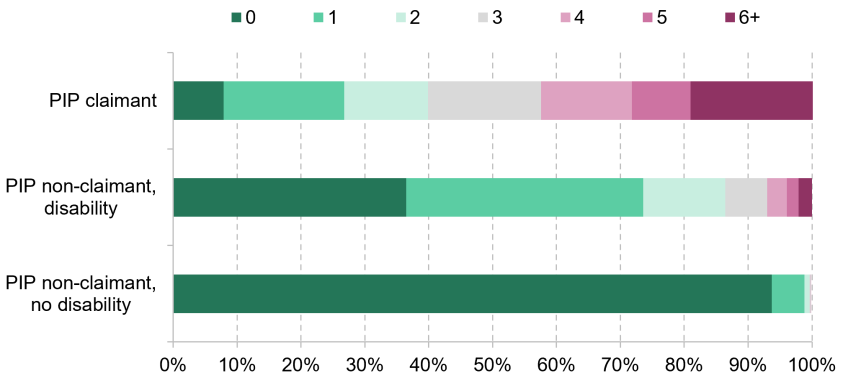
Figure 7.2 plots the number of day-to-day activities that PIP claimants and non-claimants say they find difficult due to health conditions. It shows that PIP claimants are more likely to report multiple difficulties with day-to-day activities than PIP non-claimants, including PIP non-claimants with disabilities. The median person who has a disability but does not claim PIP reports difficulties with one activity, while the median PIP claimant reports difficulties with three activities. This is what we would expect given that PIP eligibility is specifically assessed on applicants’ ability to do various day-to-day activities.
Figure 7.2. Number of day-to-day activities where respondents report difficulties, by PIP status
Note: The ‘PIP claimant’ group includes a small share (7%) of PIP claimants who do not report a disability. The sample is restricted to working-age people in England or Wales.
Source: Authors’ analysis of Understanding Society, 2023–24.
Figure 7.2 also shows that there is considerable variation in the number of day-to-day activities that PIP claimants have difficulties with: 19% of PIP claimants report difficulty with six or more day-to-day activities, while 27% of PIP claimants report difficulties with one or fewer. This variation across PIP claimants raises an important question for policymakers around the extent to which they want to target awards towards those with the highest needs or to provide broad support for everyone above a certain level of need. We discuss this further in Section 7.5.
Nature of disability
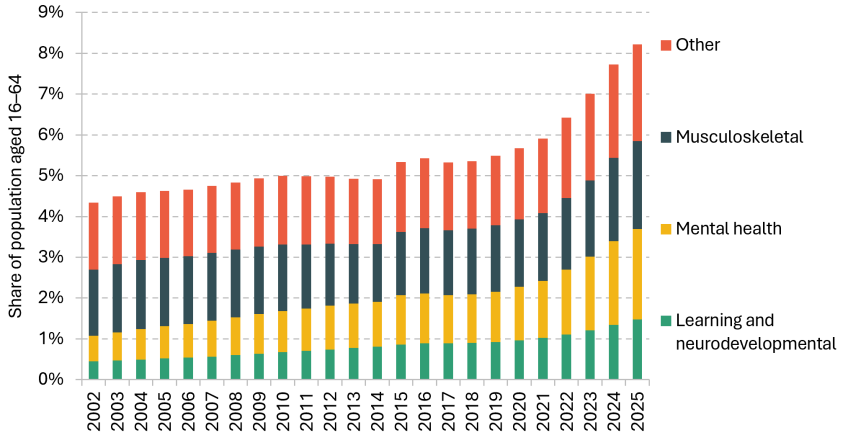
Figure 7.3 shows the share of working-age people who claimed disability benefits over time, broken down by their main health condition, as recorded in the assessment. Two points are worth drawing out. First, the share of the working-age population claiming disability benefits grew gradually from 4% in 2002 to 5% in 2019 before increasing much faster, reaching 8% in 2025. Second, the types of conditions for which people claim disability benefits have changed over time. In 2002, 25% of disability benefit recipients claimed primarily for a mental health condition or a learning or neurodevelopmental condition;12 by 2025, this had risen to 45%. The shift towards these types of primary conditions has occurred steadily over the last 20 years. Of the increase in claims since 2019, about half is in mental health, neurodevelopmental or learning conditions – so while rising demand for support related to mental health is a big part of the recent rises in claimant numbers, it is not the whole story.
Figure 7.3. Disability benefit claims as a percentage of 16–64 population by condition over time
Note: All data relate to August of the year shown.
Source: Authors’ analysis of Department for Work and Pensions Stat-Xplore.
Age
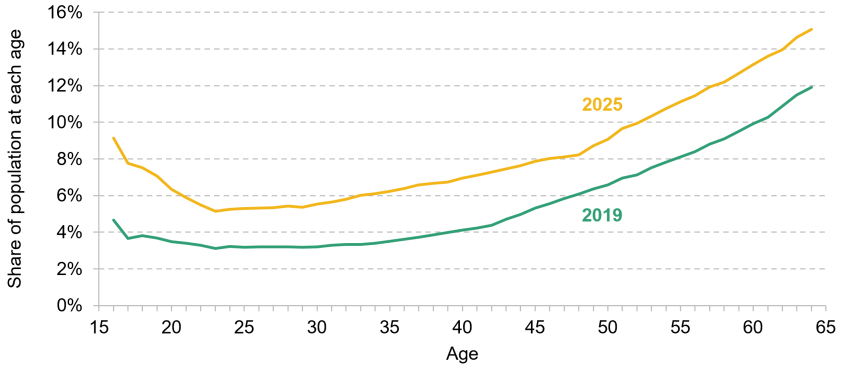
Figure 7.4 shows, by age, the shares of the population that claimed disability benefits in 2019 and in 2025. It reveals two key points about the disability benefit system. First, older adults are in general more likely to claim disability benefits than younger adults.13 Around 5% of 25-year-olds claim a disability benefit, but this rises to 11% among 55-year-olds. This echoes patterns in reported disability and is likely due to older adults picking up additional health conditions as they age.
Figure 7.4. Share of people of each single year of age claiming disability benefits in 2019 and 2025
Note: Data as of August each year.
Source: Authors’ analysis of Department for Work and Pensions Stat-Xplore and ONS population data.
Second, Figure 7.4 shows that the increase in disability benefit claims since 2019 occurred across all ages. The share of the population claiming disability benefits increased fairly uniformly – by between 2 and 3 percentage points – among most age groups. This implies slightly faster growth in proportional terms for younger claimants, but still fast growth for people in their 50s and 60s. Growth has been even faster amongst teenagers. The share of 16-year-olds claiming a disability benefit increased from 5% to 9%. This is related to the growth in claims for child DLA, which have grown even faster than claims for PIP. (See Latimer, Sibieta and Snape (2025) for a detailed discussion of child DLA trends.) Some of these 16-year-olds are still claiming child DLA while they are waiting for their PIP application to be processed, and others will have started their PIP claims. In other work, we have also shown the increase has occurred relatively evenly (in proportional terms) across different parts of England and Wales (Latimer, Pflanz and Waters, 2024).
Why has the number of people claiming disability benefits risen since 2019?
Despite much research, it is still unclear what drove the large increase in disability benefit claims since the start of the pandemic. We know that at least two-thirds of the increase is due to more people starting new claims for PIP, with the rest relating to fewer people ending their PIP claims (Latimer, Pflanz and Waters, 2024). But it is not known exactly why there has been such a big increase in new applications for PIP.
One theory is that it is due to worsening health following the pandemic. As Figure 7.3 shows, the growth in disability benefit claims started increasing dramatically from 2021 onwards. Latimer, Ray-Chaudhuri and Waters (2025) show there is mixed evidence across sources about what has happened to the overall prevalence of long-term health conditions, but all sources show that adults have gradually become more likely to report mental health conditions through the 2010s, and this has continued into the 2020s. There is no consensus on the cause of this increase. There does not seem to have been a sudden surge in reported health conditions post-pandemic that mirrors the growth in disability benefit claims. Changes in population health are likely to be part of the story, although they are unlikely to be the whole story.
Another theory is that the increase in claims is related to the rising cost of living. People with varying levels of disability may have responded to the rising cost of living in 2022 by looking for additional sources of income and therefore applied for PIP if they were not already claiming it. One supporting piece of evidence for this is that Citizens Advice received a large increase in the number of requests for advice on financial issues such as rising energy costs in 2022–23 and it also provided about a quarter of clients who it advised on these issues with advice on PIP (Department for Work and Pensions, 2026a, annex b). We have also found evidence that cuts to non-disability-related benefits led to more people claiming disability benefits (Cribb et al., 2025). While these cuts occurred too early to explain the post-pandemic rise in disability benefits, they provide some supporting evidence that some people respond to falls in their income by applying for disability benefits.
Finally, there is a set of explanations that suggest the increase in claims relates specifically to the design of the UK’s benefit system. One explanation could be that the move from in-person assessments to remote assessments (either video calls or phone calls) may have induced more people to apply, possibly because some potential applicants find face-to-face assessments stressful or expect more scrutiny of their claim in such assessments. There is no evidence currently available that isolates the impact of this change. An alternative story is that fixed features of PIP which have not changed since the pandemic (such as the assessment criteria or the ability to apply in or out of work) make PIP particularly responsive to the rising cost of living and the rise in reported mental health conditions that have occurred since the pandemic. This might explain why the kinds of rises seen for PIP have not been repeated in other countries (Latimer, Pflanz and Waters, 2024).
Naturally, the lack of a clear understanding of what has driven the rise makes designing policy more challenging.
7.4 What is the purpose of the disability benefit system?
Before considering options for reforming PIP, it is helpful to zoom out and consider what the government might be trying to achieve with a disability benefit, and how PIP relates to those goals.
We begin by discussing what outcome arising from disability the benefit is supposed to target. We consider two possible options: the additional costs of disability; and reductions in well-being or life satisfaction arising from disability. Then, we move on to the distributional goals policymakers might have with the benefit: reducing incidence of particularly poor outcomes for disabled people, or reducing inequalities between disabled and non-disabled people. Finally, we briefly discuss what form the benefit could take, such as cash or benefits in kind, and how this relates to what the government wants the benefit to achieve.
What outcome arising from disability should disability benefits target?
The additional costs of disability
Policymakers may want a disability benefit to address the additional costs faced by individuals as a result of their disability. This is the government’s stated rationale for PIP. Intuitively, this rationale is straightforward: it is easy to think of examples of specific additional costs for people with certain disabilities. For instance, someone with mobility needs may need to take taxis more often or someone who requires a ventilator needs to pay to charge it and maintain it.
Whatever form the support takes, putting this ‘additional costs’ rationale into practice requires a definition of ‘the additional costs of disability’. We understand additional costs here to mean the extra costs one would incur in order to do a particular set of activities. The additional cost a disabled person faces (compared with a non-disabled person) to visit the local shops might be minor; the additional cost for them to travel across the world might be much larger. Policymakers must therefore consider which of these activities PIP should cover the additional costs of.
The Timms Review Steering Group has attempted to tackle this issue, stating that the purpose of PIP should be to ‘reduce the inequalities they [D/deaf people and people with disabilities] face in participating in everyday life through a contribution towards the extra costs of disability’. ‘Participating in everyday life’ implies the government wants PIP to cover costs associated with a given set of activities. However, what these activities are is not obvious. A minimal definition might, in principle, include only the basic functions of human life such as eating, sleeping and bathing, while a broader definition might also include being able to participate in social, leisure and civic activities. PIP currently assesses people both on their ability to undertake basic functions such as ‘preparing food’ or ‘washing themselves’ and on social activity such as ‘engaging with others face-to-face’. The more activities included in the definition, the more additional costs arising from disability the benefit would need to cover.
Whatever the set of activities the policymaker has in mind, they need to determine the additional costs disabled people face in doing those activities. We consider here how a policymaker can estimate average additional costs to inform the appropriate level of PIP awards, potentially conditional on a range of characteristics, rather than how they could estimate the additional costs facing a specific individual.14
One approach is to estimate costs ‘directly’ by surveying people on the goods and services they would need to pay for, and hence the costs they would face, if they were to do the set of activities the government wishes to target.15 The survey could ask this of those with and those without disabilities, compare the two, and attribute the difference to additional costs arising from disability. For example, if one activity in scope was having a clean home, a person with arthritis might explain that they would need a cleaner, and the cost for that would be included in the measure of the additional costs they face. Inevitably, some sort of averaging across disabled people (and conditions) would be required to produce an estimate of the additional costs of disability. The Timms Review is in the process of carrying out a survey of additional costs along these sorts of lines. However, this approach has drawbacks. The person being surveyed might not know what items they would need to pay for in order to do a listed activity, especially if it is not something they do at the moment. There is also an ambiguity in the goods and services one needs to do a particular activity: for example, a person may be able to do an activity without support, but not without significant effort or even pain.
These challenges with directly measuring disability-related costs have led researchers to explore alternatives. One alternative is to try to infer the additional costs of disability based on observed differences in living standards between people with disabilities and without (Zaidi and Burchardt, 2005; Scope, 2025; Banks et al., 2026). Ideally, this would involve comparing a measure of living standards that captured the specific set of activities that the government wanted to estimate the costs of (such as activities required to ‘participate in everyday life’, as discussed above). In the absence of that, a commonly used measure of living standards is material deprivation. Households are asked whether they are able to afford a number of essential goods and services (e.g. fresh fruit and vegetables or the ability to heat the home adequately). In line with standard practice, we use the term ‘materially deprived’ to refer to anyone who cannot afford five or more essentials.
Figure 7.5 shows the share of different groups that are materially deprived, separately by decile of household income.16 PIP claimants with low incomes are the most likely group to be materially deprived – 62% of PIP claimants on below-average income are in material deprivation. Even among those who have the same level of income, people with disabilities are much more likely to be materially deprived than other adults, and PIP claimants are more likely again. These gaps remain even for relatively well-off PIP claimants – 34% of PIP claimants who have above-median incomes are materially deprived compared with only 5% of people above median income without a disability. Put another way, claiming PIP is associated with as large an increase in material deprivation as having a much lower income: non-disabled people in the second income decile are about as likely to be materially deprived as PIP recipients in the seventh decile, whose incomes are 135% higher.17
Figure 7.5. Percentage of group in material deprivation for working-age PIP claimants and for other working-age people with and without disabilities, by decile of household income
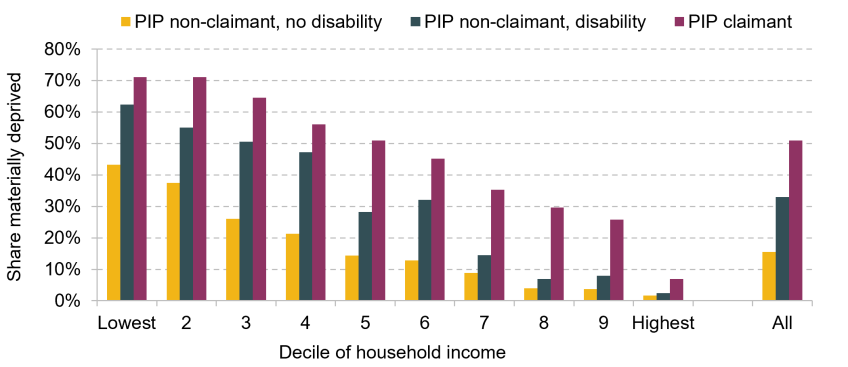
Note: Household income is equivalised and is after housing costs. Disability is self-reported. Someone is classified as materially deprived if they report they are unable to afford five or more essentials. The full list of material deprivation questions is provided in Appendix 7A.
Source: Authors’ calculations using Family Resources Survey, 2024–25.
The gaps in material deprivation between those who have the same income provide some evidence of the additional costs of disability. Disabled people may find some of the list of essentials in the material deprivation measure more expensive. For instance, one of the listed essentials is heating; some disabled people might require their home to be kept at a higher temperature as a result of their health condition and so might be more likely to report not being able to afford to heat their home adequately. Furthermore, disabled people may face additional costs for activities that are not included in the list of essentials, but paying for those additional costs may leave them with insufficient funds to afford the essentials that are on the list.
While this analysis is certainly suggestive of the existence of considerable additional costs, it is imperfect as a means to quantify them precisely. First, there may be other differences between people with and without disabilities, unrelated to additional costs, which cause these differences. For instance, disabled people may have lower levels of savings, for a given level of income, which might make it harder for them to afford essentials. Second, higher-income disabled people may face additional costs but still be able to afford the list of essentials. In that case, a small measured gap in material deprivation (such as the one we see in the top decile) would not necessarily imply that those costs were small, only that they were insufficient to push high-income individuals into material deprivation.
Reductions in well-being or life satisfaction arising from disability
As well as potentially increasing living costs, having a disability in itself is likely to reduce well-being or life satisfaction. This is an alternative outcome arising from disability that policymakers may want to address. Extra income is a means of achieving this in so far as it improves life satisfaction (and, as we show below, the two are correlated).
Figure 7.6 shows the share of people reporting low levels of life satisfaction (defined as reporting a score of 4 or below on a 10-point life satisfaction scale) by income and disability status. Similar to the picture for material deprivation, disabled people are more likely to report low life satisfaction than the general population and this relationship holds within income groups. Even PIP recipients in the top half of incomes report having lower levels of life satisfaction than those who are not disabled in the bottom income decile. This suggests that there is a significant life satisfaction ‘penalty’ associated with disability which policymakers may want to try to offset – though, as with the material deprivation comparison above, there may be differences other than disability between people with and without disabilities which contribute to these life satisfaction gaps.18
Figure 7.6. Percentage of group reporting low life satisfaction for working-age PIP claimants and for other working-age people with and without disabilities, by household income
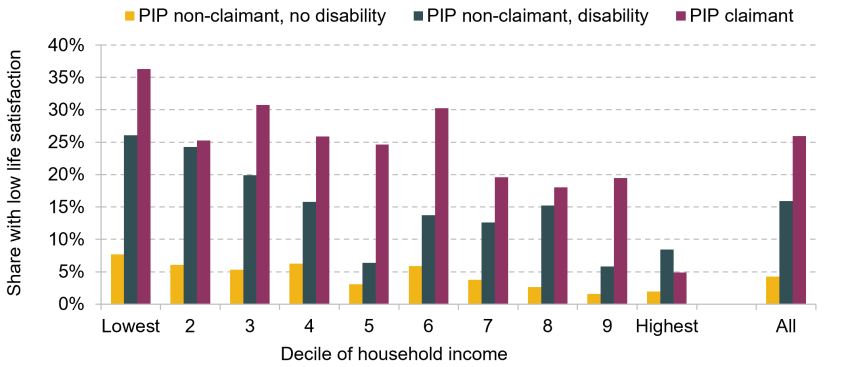
Note: Household income is equivalised and is after housing costs. Disability is self-reported. Low life satisfaction is defined as answering the question ‘Overall, how satisfied are you with your life nowadays?’ with a 4 or below on a 10-point scale.
Source: Authors’ calculations using Family Resources Survey, 2024–25.
What distributional goals might policymakers want to achieve with disability benefits?
After deciding what outcome arising from disability is the target of the benefit, policymakers need to decide what distributional goals they want to achieve with it.
One option is to attempt to reduce the incidence of very poor outcomes among disabled people. For example, policymakers may be concerned about the additional costs of disability for low-income disabled people specifically, because they want to ensure that the standard of living of disabled people does not drop below a certain threshold. Figures 7.5 and 7.6 show that people on low incomes and with a disability are the most likely to report not being able to afford essentials and to report low levels of satisfaction with their lives. On either of these measures, the government would most efficiently target those with the worst outcomes by means-testing disability benefits so that all of the support goes to those with both disabilities and low incomes. We explore the option of means-testing in detail in Section 7.5.
Another option is to try to reduce inequalities between disabled and non-disabled people, irrespective of their income. If this is the aim, then the case for keeping PIP non-means-tested is stronger. Disability-related costs, or life satisfaction penalties, may be large even among those on higher incomes – indeed, Figures 7.5 and 7.6 show that, apart from in the top income decile, there are substantial gaps in material deprivation and life satisfaction between people with and without disabilities across the income distribution. These inequalities could justify keeping PIP as a non-means-tested benefit, that is available to disabled people even on fairly high incomes given they may still be worse off than similarly high-income non-disabled people.19
Of course, the government may want to achieve both of these goals to some extent – it need not choose only one of the two objectives. However, given limited resources, it would then need to balance the amounts spent on achieving each objective. It could potentially do this by providing a mixture of means-tested and non-means-tested support.
What form should disability support take?
The government could choose to provide support to disabled people in many ways. For example, rather than providing a cash benefit, it could provide in-kind support (such as subsidised social care or healthcare) or vouchers (which we discuss in Section 7.5). Cash support, such as PIP, may be a particularly attractive option if the government’s aim is to address the additional costs of disability and resulting low material living standards, since these are fundamentally financial problems. A particular advantage of cash is that it enables claimants to choose how to spend the benefit (and they could, for example, spend it on social care or healthcare). If there are large differences among claimants in the specific goods or services needed to address the impact of their disability, providing cash rather than in-kind support could be especially advantageous to claimants and imply a lower administrative burden than in-kind support.
It is less obvious that cash is the right form of support if the goal is to address reductions in well-being arising from disability. If cash was very effective at improving well-being, we would expect PIP recipients with high incomes to be much less likely to report low life satisfaction than PIP recipients with low incomes. In fact, Figure 7.6 shows that while PIP recipients with high incomes are less likely to report low life satisfaction than those with low incomes, these differences in life satisfaction across income deciles are small relative to the differences between PIP claimants and people without disabilities. Research also tends to find that additional income can increase well-being but that the effects of this are relatively small and can be short-lived (Thomson et al., 2022; Miller et al., 2024). All this suggests that even fairly high PIP awards may not fully close well-being gaps that are associated with disability.20
Alternative forms of support might have a bigger positive effect on well-being for a given level of spending. For instance, one alternative could be increased investment in mental health treatment, which has been shown to be effective at improving well-being for those with mental health conditions (Cuijpers et al., 2013; Oparina, Krekel and Srisuma, 2024). If the government wants to improve well-being for disabled people, it should evaluate the cost-effectiveness of different forms of support rather than necessarily defaulting to cash.
7.5 Potential reforms
Finally, we present a range of options for reforming PIP. The government faces choices around the structure of disability benefits such as how should eligibility be assessed, should the benefit be cash or in-kind support and how much should awards vary between claimants? For any given structure, the government can also decide how much it wants to spend overall. It may decide it wants to spend more or less on PIP than it does currently – £25 billion a year on working-age claimants, an amount that is due to rise to £34 billion by 2030–31.
The simplest way to change spending on PIP would be to change all award levels proportionally. A reform that increased or reduced award amounts by 10% for all claimants would increase or reduce spending on working-age adults by £2.5 billion before accounting for any behavioural responses. On average, each claimant would receive £740 a year more or less in income. The government could also change the thresholds required to qualify for each level of PIP or alter the number of points that questions (or levels within a question) are associated with. Increasing the threshold to qualify or reducing the points scored on each question would result in fewer claimants qualifying, reducing spending.
The government has asked the Timms Review to look at options for changing the structure of PIP rather than immediately increasing or decreasing spending, and so, in the rest of this section, we focus on options for structural reform. We discuss seven options that illustrate the range of different types of changes the government could make to the disability benefit system. For each reform, we provide relevant context, model how it might change the caseload where possible, and discuss the advantages and disadvantages of the change.
The seven reforms we consider are:
- Changing the distribution of awards while maintaining a functional assessment
- Requiring a medical diagnosis
- Treating mental and physical illness differently
- Age-dependent disability benefits
- Issuing vouchers in place of cash for some or all awards
- Providing services in place of cash for some or all awards
- Means-testing PIP
Each of these reforms could be combined with changes in award amounts to achieve different levels of total spending on the system. For instance, restricting access to PIP for younger claimants would reduce spending if it was not combined with any other reforms. We illustrate the possible scale of some cost reductions that could be made, if desired. We note, however, that the government could choose to recycle any savings from a particular change into higher awards for remaining PIP claimants, leaving total PIP spending unchanged, or into other forms of support for disabled people, such as the direct provision of health or social care support.
Changing the distribution of awards while maintaining a functional assessment
One option is to continue to assess eligibility for PIP based on measures of functional disability but to change how awards are allocated. This could involve changing the severity of disability required to qualify for each level of award, changing the number of levels or the value of award they attract, or some combination of these. These choices determine how many people receive at least some PIP, and the share of overall PIP spending that is received by those with the most severe disabilities.
Although each of the two components of PIP – daily living and mobility – is currently available at only two levels (standard and enhanced), the PIP assessment involves a more granular numeric points system. Individuals are given scores on a range of individual activities, with the score for each corresponding to a level of difficulty the individual has with the activity in question.
Figure 7.7 shows the share of successful applicants who receive each number of points in total. Because the charts are among PIP claimants only, there are few people who score below the eight-point threshold – the only individuals in this category are people who qualify only for the PIP component that is not the one shown on the chart (either mobility or daily living).
Figure 7.7. Distribution of PIP points, by PIP component
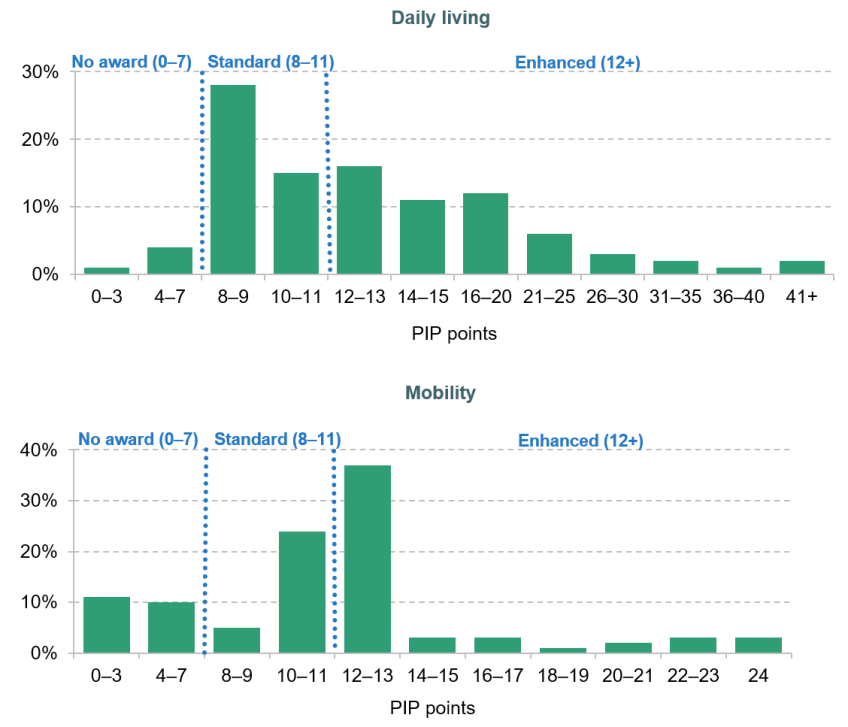
Note: Award distribution is among successful applicants for at least one component of PIP, and relates to claimants as of January 2024.
Source: Authors’ analysis of Department for Work and Pensions Pathways to Work Evidence Pack 2024.
Even among people granted enhanced awards (and, to a lesser extent, standard awards), there is significant variation in scores. Indeed, many PIP claimants receive many more points than are needed to qualify for the enhanced level of support. For example, for the daily living component, among those who receive the enhanced level (scoring at least 12 points), around half receive at least 16 points and 9% (5% of all PIP claimants) receive at least 31. There are fewer questions for the mobility component, resulting in a smaller variation in scores, though still among enhanced mobility recipients there are 6% who receive the maximum 24 points.
It seems very likely that someone who scores 12 in the assessment for the daily living component, and thus just qualifies for the enhanced award, will have different needs and costs from someone who scores over 30. For instance, someone who cannot wash and bathe themselves and needs assistance to dress or undress their upper body would receive 12 points on the daily living assessment and only just qualify for the enhanced level. Someone who cannot wash and bathe themselves, cannot dress or undress at all, cannot express or understand verbal information at all even with communication support, and needs prompting to be able to read or understand basic written information would receive 32 points. But both would currently be awarded the same level of the daily living component of PIP, worth £5,960 per year.21
If needs do vary substantially between people with different scores, there would be a case for (for a given budget) awarding greater support to those with very high scores, and lower awards for people who only just cross one of the existing thresholds. Such a change would make those with a lower level of disability worse off but would target the existing budget to those with higher needs.
There are many ways to make the system more sensitive to the level of assessed disability. For example, PIP could have more than two levels of award for each component. A simple illustrative alternative, which we model here, is a £-per-point system in which claimants receive an award that is proportional to the number of points they receive in the PIP assessment. We maintain the restriction that no award is made for the first seven points scored on either the daily living or mobility component. Figure 7.8 shows the award given for each number of points under such a proportional system, compared with the current system. We set the award for each point at a level to keep overall spending on each component the same as it is currently (before accounting for any behavioural changes). This would mean that a person scoring 12 points in the daily living assessment would get £4,240 per year (£1,720 less than now), while a person scoring 32 points would get £11,310 (£5,350 more than now).
Figure 7.8. PIP daily living award by points under current and proportional systems
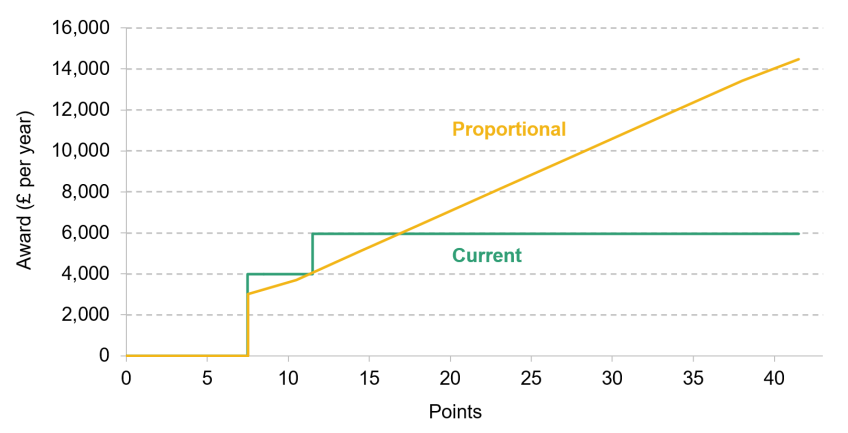
Note: Award levels under the proportional system have been set to be revenue-neutral given the distribution of PIP points among successful claimants as of January 2024 and assuming no behavioural response. The points distribution is available in bands, so we have rounded scores to the centre of each band. For those in the 41+ category, we have assigned 43 points.
Source: Authors’ analysis of Department for Work and Pensions Pathways to Work Evidence Pack 2024.
Importantly, we model the results of this reform assuming that nobody changes their behaviour, and hence that the distribution of PIP points is the same as the distribution among current claimants. This helps us illustrate the likely effects of the reform. However, in reality, it is likely that there would be some behavioural response to such a reform. The incentive to move from 8–11 to 12 points would be weakened as this would no longer lead to a sharp rise in support, while the incentive to increase points within the 8–11 or 12+ ranges would be strengthened. Claimants are likely to respond to this incentive and take action (such as providing more evidence for their applications or being more likely to challenge their award). Since the incentives push in both directions, the overall effect on spending is ambiguous.
Roughly a quarter of claimants would receive an increase in their daily living component due to the reform, of whom around 15% would gain more than £1,000 per year. Around 70%, meanwhile, would receive a lower daily living award, with 55% of current claimants losing more than £500 per year. Around a third of claimants would receive an increase in their mobility component of more than £1,000 per year, while nearly half would lose out, almost all of whom would lose more than £500 per year. The fact that there would be fewer (big) winners than (smaller) losers under this alternative reflects the fact that a minority of claimants have a very large number of points.
Figures 7.9 and 7.10 show the average amount different groups’ awards would change by if the existing system were replaced with a proportional system (again assuming no behavioural response), broken down by age and condition respectively. The biggest winners would be those whose main condition is a learning disability or a condition such as cerebral palsy, who tend to have very high PIP assessment scores. Claimants whose main condition is musculoskeletal would lose the most, since they do not tend to score very highly on the PIP assessment. The reform would also benefit younger claimants (on average), since a higher share of young claimants receive very high point scores.
Figure 7.9. Average PIP award under current system and proportional reform, by age
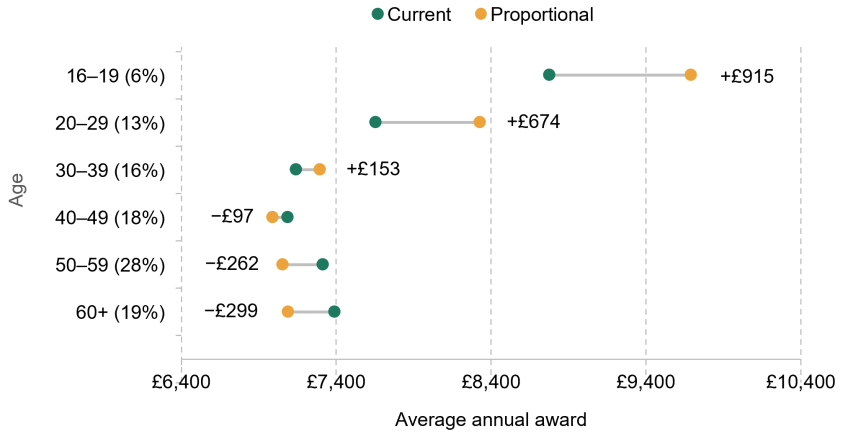
Note: %s on the vertical axis show the shares of overall claimants. The horizontal axis does not start at 0.
Source: Authors’ analysis of Department for Work and Pensions Pathways to Work Evidence Pack 2024.
Figure 7.10. Average PIP award under current system and proportional reform, by condition
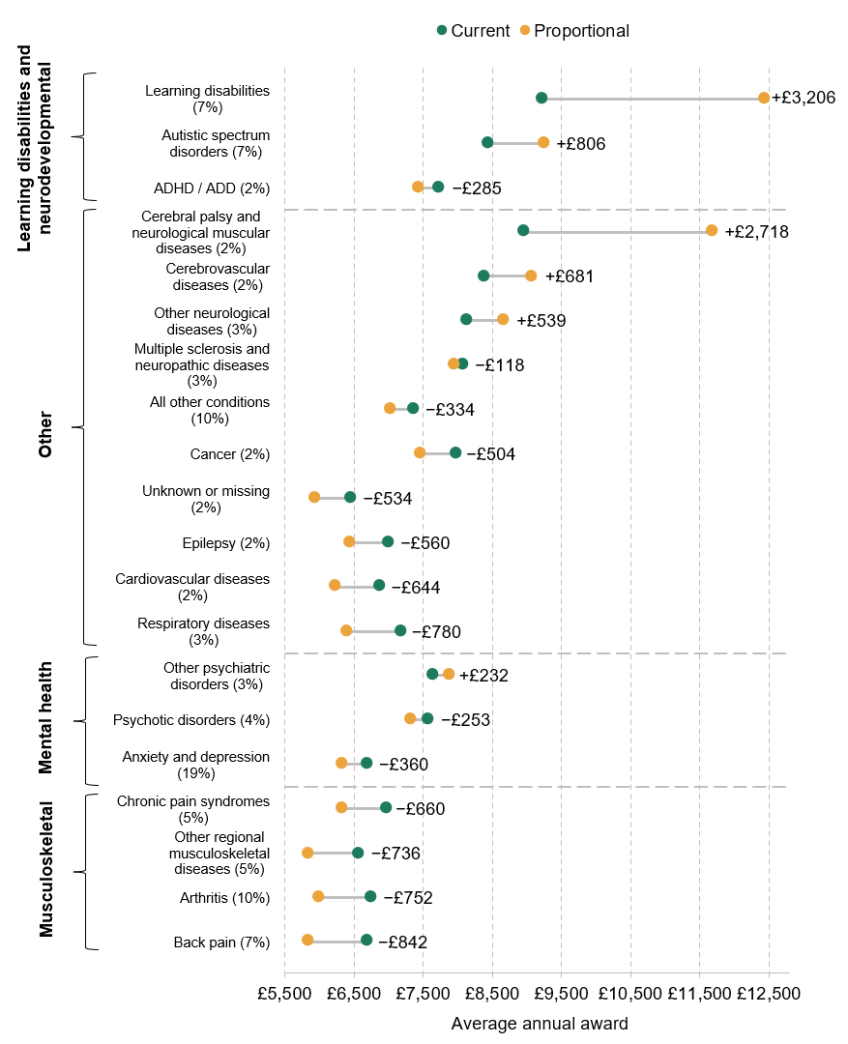
Note: Conditions shown are main conditions as recorded in the PIP assessment. As a result, they are averages which will partly reflect co-morbidities of different main conditions. %s on the vertical axis show the shares of overall claimants. The horizontal axis does not start at 0.
Source: Authors’ analysis of Department for Work and Pensions Pathways to Work Evidence Pack 2024.
The simple £-per-point system modelled here would make the most sense if the costs associated with disability rose linearly with levels of need assessed by the current assessment (e.g. if someone with twice as many points over 7 on the assessment also faced costs associated with their disability that were twice as high). In reality, it may be that costs increase less than proportionally with the number of points – for example, getting assistance at home could help with a range of limitations (cooking, cleaning, getting dressed), meaning that someone who has several of them may only have modestly higher costs than someone who has one. In addition, there are other elements of state support (such as social care) which may be more likely to be received by those with very high PIP scores, and may be more appropriate than cash for people with very substantial needs.
On the other hand, limitations could interact with each other, making the costs to those who suffer from many conditions higher than the sum of the costs of each condition on their own. Either way, given the large differences in the severity of disability among those with the same level of award under the current system, it would be worth considering whether there should be increased gradation between those with the very highest needs relative to those with more moderate needs. While we have shown a simple £-per-point system here for illustrative purposes, it is worth reiterating that the same kind of effect could be achieved by having more award levels. Furthermore, if it added more tiers, the government may want to alter the PIP assessment itself. The current PIP assessment was designed knowing that, over certain ranges, the specific number of points an individual scored would not affect their award level. If this relationship between points and award were strengthened, government may wish to alter the way points are allocated to people with different levels of need.
Requiring a medical diagnosis
There are some international examples of disability insurance programmes which require applicants to have specific medical diagnoses (such as the United States). At present, medical evidence can be used in the PIP assessment, but a specific diagnosis is not required. Applicants can provide additional medical evidence to support their claim and assessors can also request additional evidence from medical professionals such as the applicant’s GP. The government could choose to make a medical diagnosis a more formal part of the PIP assessment.
One option would be to scrap the functional assessment and only allocate PIP based on diagnoses. Most people with some medical diagnosis do not claim PIP, so the government would have to specify a small number of specific diagnoses if it wanted to avoid greatly increasing the PIP caseload. An advantage of this kind of approach is that in some cases it would offer a more objective criterion by which to determine PIP eligibility, since one can sometimes definitively say whether an individual has a particular condition. For other conditions, subjective symptoms are also important in diagnosis – for example, where and how much pain a patient experiences. These are no easier to observe or verify than a functional assessment’s attempt to measure individuals’ ability to perform specific activities. Moreover, even for objectively verifiable conditions, medical diagnoses may not map well onto additional costs from disability, since a single diagnosis can impair people to different degrees.
Another less radical option would be to make PIP entitlement dependent upon both passing the existing functional assessment and having a medical diagnosis. Adding this additional requirement to the PIP assessment would exclude some claimants altogether, enabling higher awards or a lower threshold in the functional assessment for remaining claimants for any given amount of spending.
Currently, 85% of working-age PIP claimants report having at least one diagnosis, and 69% report several.22 This is likely due to a combination of the fact that scoring enough points in the PIP assessment to receive an award is highly correlated with having a diagnosis, and that the current assessment does use medical evidence (and it may be quite important for the assessment). If the government required a diagnosis for entitlement to PIP, claimants may respond to this incentive by seeking a diagnosis (and, as discussed below, doctors are unlikely to have much incentive to reject such requests). As a result, requiring claimants to have any medical diagnosis in addition to the functional assessment is unlikely to result in a major shift in who receives PIP. The government could instead decide to restrict to only a subset of medical diagnoses, which could have a much larger effect on who receives PIP, but this would depend entirely on which diagnoses were chosen.
There are several risks associated with adding a medical diagnosis to the PIP eligibility criteria. Increasing the incentive to seek a medical diagnosis would likely raise demand for NHS services. In addition, it would raise the administrative burden for those applying for PIP, potentially reducing applications. One particular risk is that this requirement might disproportionately deter low-income people from applying. They may be less likely to seek a diagnosis through the private medical sector and so be more impacted by NHS waiting lists and delays and, even in the NHS, doctors can charge for providing some forms of evidence (albeit an amount that is very low when compared with a PIP award). In principle, the government could waive NHS charges for providing the relevant forms of evidence, and could increase spending on NHS services to reduce waits for diagnoses, although this would come at additional fiscal cost.
Given there is some subjectivity in medical diagnoses, the impact of the reform on diagnoses and PIP claims would also depend on doctors’ behaviour. Currently, doctors would have little incentive to reject requests from patients for diagnoses needed for PIP assessments, and so requiring a diagnosis may only have limited effects on PIP eligibility in practice. If instead doctors were incentivised to reject some requests, the relationship between doctors and patients could become more adversarial.
Treating mental and physical illness differently
Another potential reform is to restrict eligibility to PIP among people with mental health conditions. This idea has received some attention recently, with both the Conservative Party and Reform UK making proposals along these lines (BBC News, 2025 and 2026), following the large rise in disability benefit claims for mental health problems (as shown in Figure 7.3).
There are two main potential justifications for treating mental health conditions differently. First, policymakers may be concerned that mental health conditions, and their impact on claimants’ lives, are particularly hard to verify and hence more open to fraudulent or exaggerated claims – motivating a different assessment process, or restricting eligibility only to those who have particularly serious mental health issues. Consistent with this, a survey of GPs in Norway who assess disability insurance claimants found that they considered mental health conditions to be among the least verifiable (Overland et al., 2008). A second potential justification is that mental health conditions may be easier to treat and recover from or more variable – motivating more regular reassessment, or in-kind treatment instead of cash benefits.23
Of course, a condition affecting mental rather than physical health is at best a proxy for its verifiability and treatability. Many physical health conditions are also difficult to verify; in fact, that same Norwegian survey found that the two least verifiable conditions were physical (joint/muscle pain and back pain).24 Likewise, some mental health conditions are lifelong. So, if the government does want to distinguish between conditions on these grounds, it may make more sense to do so on the basis of verifiability and treatability specifically, rather than simply by whether a condition is mental or physical.
If the government did want to limit PIP eligibility for mental health conditions, it would need to move away from the existing assessment framework. As discussed earlier, at present the PIP assessment does not seek to assess the cause of any functional disability: it only asks whether an applicant is able to do a given activity. Indeed, given that people often have multiple health problems, it is not conceptually clear how a functional assessment could distinguish between causes in this way: if someone is unable to carry out a given daily living activity (e.g. if they need prompting to be able to ‘take nutrition’), it is not obvious that an assessor could attribute this objectively to one specific condition rather than another.
Rather than trying to determine whether a given functional limitation is caused by one condition or another, we consider two potential reforms, both of which would make it more difficult for people with mental health conditions to qualify for PIP.
The first, more straightforward approach would be to only allow people to take the PIP assessment if they have a physical condition (or possibly a severe mental health condition), perhaps requiring a medical diagnosis as evidence. Having met this requirement, people could still be assessed for PIP based on their functional limitations, whether these were caused by mental or physical health conditions.
Administrative data show that 45% of existing PIP claimants have, when assessed, a mental health condition or a learning or neurodevelopmental condition listed as their main disabling condition. However, requiring applicants to have a physical condition would certainly not exclude nearly that many people. This is because many PIP claimants report having both mental and physical health conditions. Figure 7.11 shows the share of PIP claimants and non-claimants who reported in a survey that they had different combinations of physical and mental health diagnoses. PIP claimants are more likely to have either mental health or physical health diagnoses than PIP non-claimants, but they are particularly likely to have both. Indeed, of PIP claimants with a mental, learning and neurodevelopmental health diagnosis, about two-thirds also have a physical health diagnosis (and so would remain eligible for PIP under this reform). And, once again, requiring claimants to have a physical health diagnosis would likely increase the number of people seeking such a diagnosis, further reducing the number of people who would lose eligibility.
Figure 7.11. Share reporting mental and physical health diagnoses
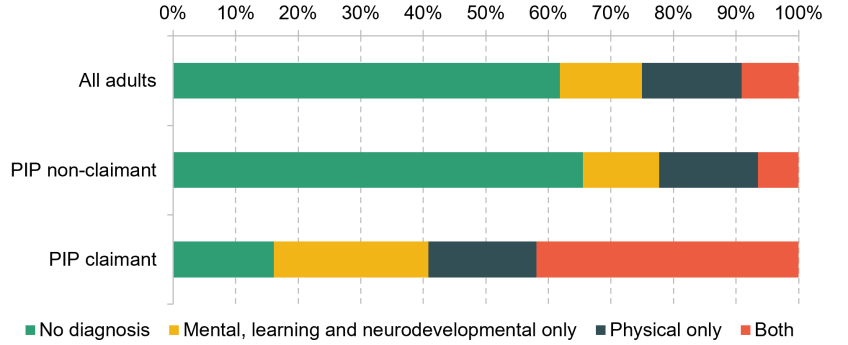
Note: Understanding Society does not ask about every condition (though it does have a miscellaneous ‘other condition’ category). As a result, some conditions may be missed from this breakdown. See Appendix 7A for details of which conditions we have categorised as mental, learning and neurodevelopmental, and which as physical.
Source: Authors’ analysis of Understanding Society, 2023–24.
A second approach that could reduce the number of people receiving PIP for mental health reasons would be to change the points given to different assessment questions. Figure 7.12 shows the average points scored by PIP recipients by whether their main disabling condition is anxiety and depression, or another condition (mental, learning and neurodevelopmental, or otherwise).25 Claimants whose main condition is anxiety and depression are particularly likely to score highly on the part of the assessment that determines difficulties with ‘engaging with others face-to-face’. Reducing the points available for this question (or excluding it entirely) would reduce the share of people who would qualify due to these particular difficulties. This would change the relative generosity of the system towards people with different types of difficulties – and effectively towards people with different types of conditions – while retaining the functional assessment structure.
Figure 7.12. Daily living score by question for different main conditions
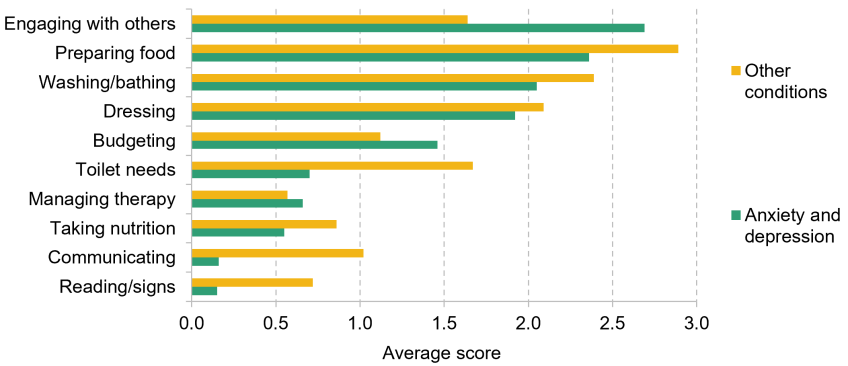
Source: Department for Work and Pensions Pathways to Work Evidence Pack, table 2.28.
Age-dependent disability benefits
Another option is to change the design of the disability benefit system specifically for a certain age group. It is already the case that substantially different systems operate for children under 16, people aged 16–66, and pensioners. Age variation among working-age people in benefit entitlements is not unprecedented – the standard allowance for universal credit is lower for those aged under 25, and the same is true of maximum support for privately rented housing for single people aged under 35, for example. Here we focus on options that treat younger disability benefit claimants differently from other claimants.
There are several reasons why, in principle, the government may want a different disability benefit system for people of different ages.
First, the government may believe that the costs of disability, or the well-being impact of being disabled, are different for people of different ages, even for a given level of functional disability. For example, an inability to travel may have a different impact on people of different ages.
Second, younger people may change their behaviour more in response to receiving PIP or the changes they make may be more important. In general, we would expect increasing the benefits someone receives to reduce their likelihood of working, albeit modestly. These effects might be bigger for younger people, since they may have less income from other sources (such as partners) than older people, such that PIP represents a larger fraction of their total income. In addition, the government may be more worried about the knock-on consequences of employment effects for young people than for older claimants. For example, there could be ‘scarring’ effects to being out of work, meaning that any negative employment effects may be particularly damaging for the future earnings of young people, who have their entire working life ahead of them. However, on both counts, since claimants can receive PIP both in and out of work, any negative employment effects are likely to be small. Such an argument would be stronger for the universal credit health element as – unlike PIP – that does generally require claimants to be out of work.
Finally, conditions (or the difficulties they cause) may be more likely to change over time for certain age groups than for others. There is some evidence that younger claimants are more likely to see changes in their condition. 26% of reassessments for claimants aged under 30 end in the claimant losing access to PIP, compared with 17% for claimants aged 30 and over.26 On average, younger people are already more likely to be reassessed; however, this is likely due to their conditions (not age itself). It is plausible that even for the same condition (and the same assessed functional disability), younger claimants could have a higher chance of recovery than older ones. Therefore, the government could go further and have explicitly different policies on the frequency and nature of reviews by age.
Figure 7.13 shows total PIP spending by age, to illustrate the potential savings from restricting PIP to certain ages. As an extreme example, the government could simply exclude anyone under 30 from the benefit. This would reduce the caseload by 689,000 people (20% of the total working-age PIP caseload) and reduce spending by £5.5 billion.
Figure 7.13. Total spending on PIP by single year of age
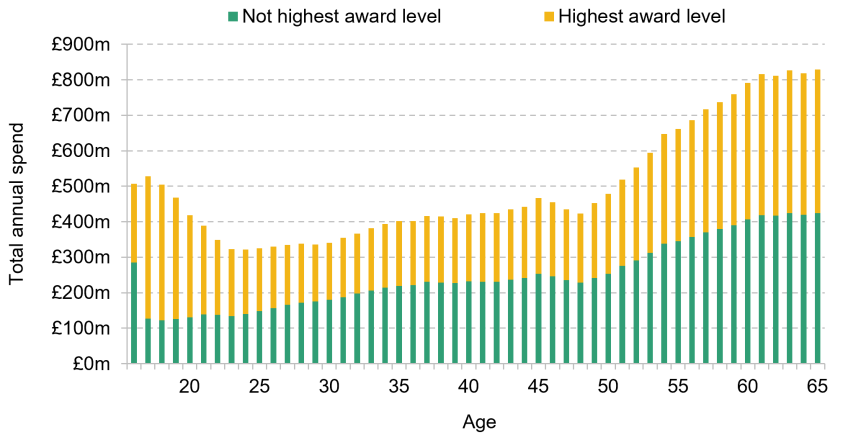
Note: Estimates are not adjusted for the age distribution of the population, so differences in cost are driven by different probabilities of receiving awards by age, different average award size by age and different numbers of people at each age. Estimates are for November 2025.
Source: Department for Work and Pensions Stat-Xplore.
However, young people are disproportionately likely to have the most severe disabilities. On Figure 7.13, we also split spending by age into that which goes on claimants who receive the highest possible PIP award (the enhanced component of both the mobility and the daily living element) and that which goes on all other claimants. Approximately half of under-30s qualify for the highest possible PIP award relative to only 34% of claimants over 30. If policymakers wanted to remove PIP from most claimants under 30 but protect those with the most severe disabilities (modelled as continuing to provide awards for young people who currently get the highest possible award), the impact on the caseload would halve to 327,000 (10% of the working-age caseload), and the impact on spending would fall to £2.2 billion, before accounting for any behavioural responses. Any savings from these sorts of reforms could, for example, be used to increase PIP awards for older claimants or to provide alternative support for under-30s.
Issuing vouchers instead of cash
Another avenue for reform would be to link benefits to actual disability-related spending, rather than allow claimants to spend PIP on anything. There are various ways this could be attempted. For example, one option is to pay disability benefits on the basis of receipts for items within an approved catalogue, which is the approach taken in New Zealand27 and is similar to the structure of the UK’s disabled students’ allowance, a benefit for disabled students in higher education to pay for additional costs related to their course. An option considered by the previous Conservative government was to provide some disability-related support in the form of vouchers that can only be redeemed for certain disability-related products, instead of cash. The underlying economics of these options are quite similar. Here we focus on a voucher-based approach.
There are a number of possible advantages of a voucher-based approach. First, if the key rationale for PIP is to cover disability-related costs, a voucher or receipts-based system would more closely link spending to specific costs judged by the government to be disability-related. Second, the government might want disabled people to spend money on certain types of disability-related items, perhaps because it takes the view that they are particularly effective at helping people manage their conditions or improve their well-being, even if that is not how people would choose to spend the money themselves. Vouchers achieve this. This argument is particularly strong if the key objective for government is to improve claimant well-being rather than to cover disability-related costs. Third, restricting claimants to spending their benefits in this way may also reduce the incentive for people with low disability-related costs to apply. Of course, if the PIP assessment worked perfectly, they would be rejected anyway. But as discussed in Section 7.2, there is imprecision in the assessment.
Such an approach would also have disadvantages. First, and perhaps most fundamentally, a key advantage of cash is that it allows disabled people to decide how to spend their money, and they may know best what spending would be most valuable to them. If vouchers are redeemable for purchases that a disabled person would have made anyway, they will have no effect on the goods and services the person ends up consuming compared with providing a cash benefit of the same value. If vouchers are only redeemable for purchases that a disabled person would not have made anyway, they would change spending to something that is less appealing from the claimant’s perspective.
Second, the government would have to determine what products claimants are allowed to spend the vouchers on. As discussed in Section 7.4, distinguishing between disability-related and non-disability-related spending is often not straightforward: while a wheelchair clearly falls in the former category, things such as taxis and cleaners may be a necessity for one claimant and a luxury for another. If vouchers were restricted to only certain items which were clearly disability-related (such as wheelchairs), recipients would not be able to use them to cover other genuine disability-related costs (such as taxis). Were vouchers issued only to certain providers, there could be an increase in the price of goods for which they were redeemable. On the other hand, if vouchers could be redeemed on a wide range of goods and services, they would be little different from cash.
Third, using vouchers may attract stigma that cash payments do not. The US food stamp programme is a useful comparator here. Food stamps are distributed to low-income households, can only be used on certain items, and require using a recognisable form of pre-paid card. In a survey of food stamp recipients, 56% reported behaviour or experiences consistent with stigma, such as hiding their use of food stamps (Hatton et al., 2024). This argument does not so clearly apply to a receipts-based, rather than a voucher-based, system.
Finally, a reform of this kind would add to administrative costs, since the government would need to build and maintain a list of allowable products. If it used a voucher-based system, it would also have to monitor the use of the vouchers and arrange for suppliers of the relevant products to accept the vouchers. This would impose an administrative burden on private sector firms too, relative to providing cash.
Providing services instead of cash
An option related to issuing vouchers is for the government to provide disability-related services (such as therapy) in-kind directly to PIP claimants, replacing some or all of the cash provided by PIP. While the Timms Review’s ‘emerging recommendations’ include cash remaining the ‘foundation of the award’, they also suggest that some awards could include services and other non-cash support too (Department for Work and Pensions, 2026d). Economically, this kind of reform is similar to vouchers in that the government chooses what types of support can be funded by PIP (or its replacement). This means it has the same main advantages and disadvantages of moving to a voucher-based system.
One potential advantage of public provision of services over issuing vouchers is that, because of its scale, the government might be able to provide certain types of support at lower cost than the private market. For instance, local authorities tend to get a cheaper price for social care services than private payers because they buy care services in bulk and so have more bargaining power (Jarrett, 2018). A disadvantage of public provision relative to vouchers is that – if disabled people were unable to choose an alternative provider – there would be less competitive pressure on the provider to supply a high-quality service.
The government could also take advantage of potential cost savings from public provision while still giving claimants choices over how to spend their award, by keeping PIP as a cash benefit but giving claimants the option of purchasing services at an attractive price (which would be less than the market rate for them).28 Any move to integrate provision of services within PIP should make sure that it is joined up with other forms of support already available through the NHS and the social care system.
Means-testing PIP
Finally, we consider the option of imposing a means test for PIP. This was recently proposed by Reform UK, though the Timms Review has indicated it will recommend keeping PIP non-means-tested. Means-testing PIP would mean that claimants with significant income themselves, a high-income partner or significant savings would lose eligibility to PIP. By reducing eligibility, a means test would reduce costs. The government could choose either to reduce the amount it spends on PIP, or to increase average awards among those unaffected by the means test.
Section 7.4 sets out the case for and against targeting PIP at those on low incomes in principle. Here we ask how such a means test could be implemented in practice, and what other effects this might have.
The simplest way the government could means-test PIP would be to integrate it into universal credit (UC), the main means-tested benefit in the UK.29 There would be two key advantages to implementing a means test through UC. First, it would be simple for claimants as they would only have to apply for UC rather than UC and a separate means-tested version of PIP. Second, UC is designed to ensure that no claimant has very weak work incentives (Ray-Chaudhuri and Waters, 2024).
At present, 67% of working-age PIP claimants receive universal credit,30 reflecting the fact that, even though PIP is not currently means-tested, most PIP claimants are on low incomes. Consequently, at least this share of PIP claimants would continue to receive their full PIP award under means-testing. If there was no change in behaviour among the other 33%, such a reform would save at most £8.2 billion per year (which equates to 33% of current PIP spending31).
However, in reality, some share of PIP claimants who are not currently receiving UC would still receive at least some of their PIP award and the reform would save less. First, the integration of PIP into UC might encourage some PIP claimants who are eligible for UC but who do not receive it to apply (which would increase their income, compared with the status quo). Second, the structure of UC means that adding PIP to UC would mean some families who currently have earnings too high to qualify for UC would gain eligibility.32 There would likely still be a large saving from incorporating PIP into UC, although it would be less than £8.2 billion per year as a result of these two effects.
Any means-tested benefit involves a trade-off between the degree of targeting at low-income households and discouraging people from earning. Means-testing PIP is no different and would weaken work incentives for some PIP claimants. UC is withdrawn at a rate of 55 pence for every £1 earned after tax (above, for some claimants, a small ‘work allowance’). This is known as the UC ‘taper’. For existing UC claimants, adding PIP to UC would increase the level of earnings at which UC is tapered to zero. This means that, for some claimants, it would reduce their incentive to take on additional hours of work (as there would be a wider range of hours over which they would be subject to the UC taper). In addition, anyone who applies for UC because of the reform (as discussed above) would face much weaker work incentives after applying, since they would now be on the taper. Those who are ineligible for UC because their income is too high, and so lose their PIP, would also have a greater incentive to reduce their hours after the reform in order to obtain UC and hence PIP.33 Means-testing PIP would therefore improve targeting towards those who are worse off but would weaken work incentives.
Finally, any proposal to means-test PIP should consider how it interacts with existing means-tested support. There is already a health element of universal credit, which provides an additional £2,607 a year for those assessed to have limited capability for work or work-related activity due to their condition. Adding PIP to UC would mean two arms of health-related means-tested support, with two separate tests. If the government does want to means-test PIP, there may be a case for integrating the two elements of support and using the same assessment to assess eligibility for both. Both the Starmer government and the previous Conservative government have proposed linking eligibility for the UC health element to the PIP assessment. Ray-Chaudhuri and Waters (2024) provide a detailed discussion of the advantages and disadvantages of these reforms.
7.6 Conclusion
Personal independence payment was introduced 13 years ago. Since then, there have been big changes in the prevalence and nature of reported disability, as well as to the economy and to the rest of the benefit system. We can see the effects of these trends in the growing and changing caseload of PIP claimants. As spending and claimant numbers for PIP grow, making sure the system is well designed becomes increasingly important. This is a good time to review the system and decide whether reforms are needed.
When designing reforms to PIP, the government needs to decide what it is trying to achieve. What outcome arising from disability is the government attempting to address? Does it want to target resources towards those whose living standards are lower because they face the additional disability-related costs? If so, this would justify a benefit that provides financial support such as PIP. Alternatively, does it want to improve overall well-being? In which case, it is possible that it is more effective to subsidise particular goods and services, which could be achieved by providing vouchers or in-kind support. The government must also decide on the distributional outcomes it would like to achieve. Does it want to reduce inequalities caused by disability even if this means providing additional money to people on high incomes? If so, then this would justify the current non-means-tested structure of PIP. Alternatively, does it want to focus resources on those most likely to have poor outcomes? In that case, it should consider means-testing support, as those with disabilities and on low incomes are more likely to report not being able to afford essentials and more likely to report low life satisfaction.
Once the government has chosen the broad structure of the new disability benefit system, it then needs to think carefully about how best to design the benefit to reach that goal.
One dimension of potential reform is the assessment process itself. How a disability affects one’s life is a private experience and so it is difficult for an assessor to understand or measure it precisely. Issues with the current PIP assessment reinforce this point. One’s likelihood of being rejected from PIP differs somewhat depending upon which firm does the assessment, and there is some evidence to suggest that the assessment is sensitive to claimant behaviour. But this presents policymakers with a trade-off. Getting information is not costless – claimants often report that the current assessment is already an intrusive and unpleasant experience – and obtaining more information to improve accuracy would likely only make these experiences worse. Irrespective of whether the assessment process can be improved, it does seem that as things stand PIP targets a high-need group: its claimants are more likely to struggle with multiple day-to-day activities, be materially deprived, and report low well-being compared even with other disabled people and certainly with the broader population.
When designing the system and assessment process, the government faces a trade-off: making the eligibility criteria or assessment process stricter will reduce the number of people who receive support that it would rather did not, but at the risk of withdrawing support from people who it does want to help. The more narrowly support is targeted, the fewer people in the first category, but also the more in the second. One way of achieving such a narrowing would be to target support towards those with the most severe disabilities, whose conditions and their effects are easier to verify. More prosaically, there is also a case for targeting extra support towards those with the more severe disabilities as they are likely the most in need of it. A number of the options we consider would target more resources towards those with more severe or easier-to-verify needs – for example, by increasing the amount of support those with the greatest needs (as determined by the current system) receive relative to other claimants or by introducing vouchers that can be redeemed only for disability-related costs. However, the government should be cautious of trying to target those with the greatest need through blanket policies which, for example, treat all people with mental health conditions or all young people differently, as there are people with high needs in each of these groups.
There are no easy options for reform: all the options we discuss entail difficult trade-offs and will involve winners and losers. However, if PIP is not effectively achieving the rationales the government has for it, as the Timms Review has stated, this will only become an increasing problem if, as the official forecasts expect, the number of claimants continues to rise.
Appendix 7A
Figure 7A.1. Percentage of group in material deprivation for working-age PIP claimants and for other working-age people with and without disabilities, by decile of household income excluding income from PIP
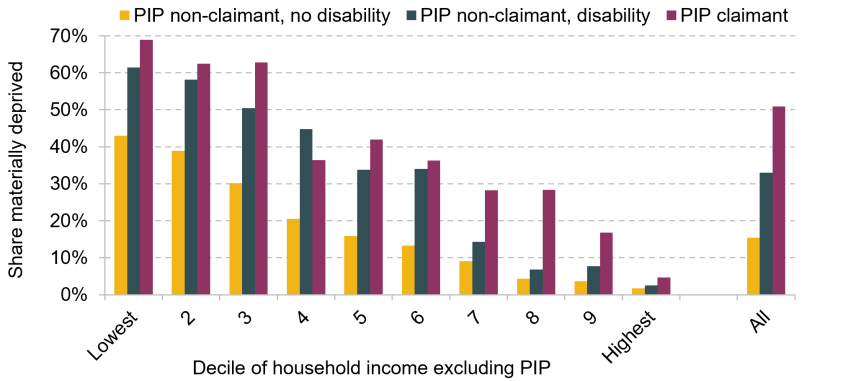
Note: Household income is equivalised and is after housing costs. Disability is self-reported. Someone is classified as materially deprived if they report they are unable to afford five or more essentials. The full list of material deprivation questions is provided below.
Source: Family Resources Survey, 2024–25.
Figure 7A.2. Percentage of group reporting low life satisfaction for working-age PIP claimants and for other working-age people with and without disabilities, by household income excluding income from PIP
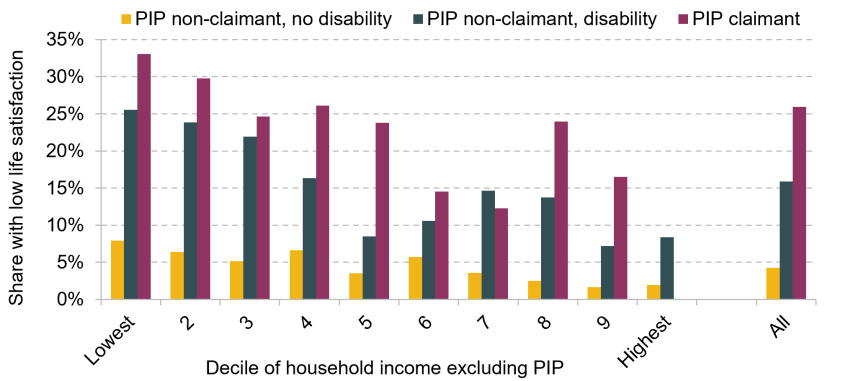
Note: Household income is equivalised and is after housing costs. Disability is self-reported. Low life satisfaction is defined as answering the question ‘Overall, how satisfied are you with your life nowadays?’ with a 4 or below on a 10-point scale.
Source: Family Resources Survey, 2024–25.
Figure 7A.3. Daily living score by question for anxiety and depression, autism spectrum disorders and other conditions
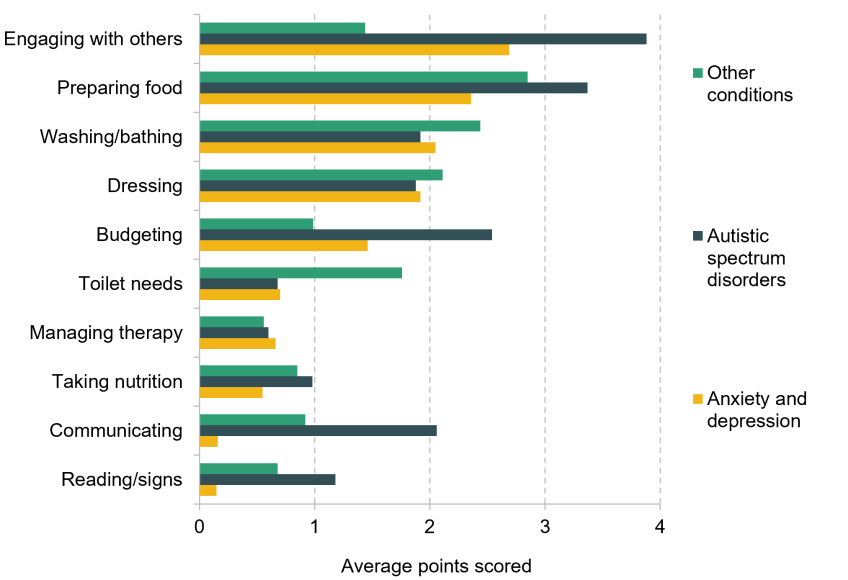
Source: Department for Work and Pensions Pathways to Work Evidence Pack, table 2.28.
Categories of condition used in Figure 7.11
Mental, learning and neurodevelopmental conditions used in Figure 7.11
Depression, Psychosis or schizophrenia, Bipolar disorder, Eating disorder, Post-traumatic stress disorder (PTSD), Phobia, Panic attacks, Attention deficit hyperactivity disorder / attention deficit disorder (ADHD/ADD), Post-natal depression, Personality disorder, Obsessive–compulsive disorder (OCD), Seasonal affective disorder, Alcohol or drug dependence, Any other anxiety disorder, Any other emotional, nervous, psychiatric problem or condition, Generalised anxiety disorder, Learning disability.
Physical conditions used in Figure 7.11
Asthma, Congestive heart failure, Coronary heart disease, Angina, Heart attack or myocardial infarction, Stroke, Emphysema, Hypothyroidism or an under-active thyroid, Chronic bronchitis, Liver condition, Epilepsy, High blood pressure, Multiple sclerosis, Chronic obstructive pulmonary disease (COPD), Osteoarthritis, Rheumatoid arthritis, Other arthritis, Bowel or colorectal cancer, Lung cancer, Breast cancer, Prostate cancer, Liver cancer, Skin cancer or melanoma, Other cancer, Type 1 diabetes, Type 2 diabetes, Gestational diabetes, Other diabetes, Dementia (including Alzheimer’s), Nervous breakdown, Cystic fibrosis, Blood or bone marrow cancer (e.g. leukaemia), Chronic kidney disease, Parkinson’s disease, Motor neurone disease, Cerebral palsy, Other brain or nerve condition, Spleen problems, Sickle cell disease, Very overweight.
Working-age material deprivation items
The Family Resources Survey asks the following questions of working-age people. Any individual who answers that they (or their household) cannot afford at least five of them is labelled as ‘materially deprived’.
Asked once per family – one response applies to all working-age adults in that family
- Able to pay bills without cutting back on essentials
- Able to put money aside for unexpected expenses
- Cover cost of repair or to replace appliances
- Home in good state of decoration or repair
- Home adequately warm in cold weather
- Home damp free
- Reliable access to internet at home
- Access to computer or tablet
- Adequate access to reliable transport
- Heating, electrics and plumbing in good working order
- Home contents insurance
Asked separately of each working-age adult in the family
- Three meals a day
- Fresh fruit or vegetables every day
- Annual break away from home
- Without regular money worries
- Regular payments to workplace or private pension
- Appropriate clothes for work or job interview
- Regular dental appointments
- Go out socially at least monthly
- See friends and family at least monthly
- Small amount of money for oneself
References
Adam, S., Michael, J., Phillips, D. and Wernham, T., 2026. The Scottish Government’s record on tax and benefit policy. IFS report, https://ifs.org.uk/publications/scottish-governments-record-tax-and-benefit-policy-0.
Banks, L. M., Morris, Z., Rotenberg, S., Mont, D., Pinilla-Roncancio, M., Carraro, L., Cote, A., Nasiir, M., Hanass-Hancock, J., McGarity, S., Smith, P. and Mitra, S., 2026. Estimating the magnitude and scope of disability-related direct costs: a systematised review. European Journal of Health Economics, 27, 969–85, https://doi.org/10.1007/s10198-025-01851-x.
Barry, J., Blake, M., Bridges, L., Candy, D., Carragher, E., Duxbury, K., Fowler, H., Lambert, C. and Morris, L., 2018. Personal Independence Payment claimant research: final report. Department for Work and Pensions Research Report 963, https://assets.publishing.service.gov.uk/media/5b924998ed915d4d716e0403/personal-independence-payment-claimant-research-final-report.pdf.
BBC News, 2025. Reform proposes to cut Pip payments to people with anxiety. BBC News article, https://www.bbc.co.uk/news/articles/cze6r2zk5d3o.
BBC News, 2026. Tories pledge to tighten household benefit cap rules. BBC News article, https://www.bbc.co.uk/news/articles/cm2pm41z1nxo.
Cribb, J., Karjalainen, H., Latimer, E., Ray-Chaudhuri, S. and Waters, T., 2025. Do disability benefit claims rise when other benefits are cut? IFS report, https://ifs.org.uk/publications/do-disability-benefit-claims-rise-when-other-benefits-are-cut.
Cribb, J., Wernham, T. and Xu, X., 2023. Housing costs and income inequality in the UK. Country Studies: Inequalities in Europe and North America – a parallel study to the IFS Deaton Review, https://ifs.org.uk/publications/housing-costs-and-income-inequality-uk.
Cuijpers, P., Berking, M., Andersson, G., Quigley, L., Kleiboer, A. and Dobson, K. S., 2013. A meta-analysis of cognitive behavioural therapy for adult depression, alone and in comparison with other treatments. Canadian Journal of Psychiatry, 58(7), 376–85, https://doi.org/10.1177/070674371305800702.
Department for Work and Pensions, 2025. Pathways to Work: reforming benefits and support to get Britain working Green Paper. https://www.gov.uk/government/consultations/pathways-to-work-reforming-benefits-and-support-to-get-britain-working-green-paper/pathways-to-work-reforming-benefits-and-support-to-get-britain-working-green-paper.
Department for Work and Pensions, 2026a. The Timms Review of Personal Independence Payment: interim report. Department for Work and Pensions report, https://www.gov.uk/government/publications/timms-review-of-personal-independence-payment-interim-report.
Department for Work and Pensions, 2026b. Apply for PIP Digital Self-Serve: impact evaluation findings. Department for Work and Pensions ad hoc research report 124, https://www.gov.uk/government/publications/apply-for-pip-digital-self-serve-process-and-impact-evaluation-findings/apply-for-pip-digital-self-serve-impact-evaluation-findings.
Department for Work and Pensions, 2026c. Benefit expenditure and caseload tables 2026. DWP research and analysis, https://www.gov.uk/government/publications/benefit-expenditure-and-caseload-tables-2026.
Department for Work and Pensions, 2026d. The Timms Review: co-chair update, September 2026. https://www.gov.uk/government/publications/the-timms-review-co-chair-update-september-2026/the-timms-review-co-chair-update-september-2026.
Deshpande, M. and Li, Y., 2019. Who is screened out? Application costs and the targeting of disability programs. American Economic Journal: Economic Policy, 11(4), 213–48, https://doi.org/10.1257/pol.20180076.
French, E. and Song, J., 2014. The effect of disability insurance receipt on labor supply. American Economic Journal: Economic Policy, 6(2), 291–337, https://doi.org/10.1257/pol.6.2.291.
Hatton, C. R., Bresnahan, C., Tucker, A. C., Johnson, J., John, S. and Wolfson, J. A., 2024. Food for thought: the intersection between SNAP stigma, food insecurity, and gender. Social Science & Medicine, 361, 117367, https://doi.org/10.1016/j.socscimed.2024.117367.
Jarrett, T., 2018. Social care: care home market – structure, issues, and cross-subsidisation (England). House of Commons Library research briefing, https://commonslibrary.parliament.uk/research-briefings/cbp-8003/.
Judge, L. and Murphy, L., 2025. Delivering dignity? Early lessons from the introduction of adult disability payment in Scotland. Resolution Foundation report, https://www.resolutionfoundation.org/publications/delivering-dignity/.
Latimer, E., Pflanz, F. and Waters, T., 2024. Health-related benefit claims post-pandemic: UK trends and global context. IFS report, https://ifs.org.uk/publications/health-related-benefit-claims-post-pandemic-uk-trends-and-global-context.
Latimer, E., Ray-Chaudhuri, S. and Waters, T., 2025. The role of changing health in rising health-related benefit claims. IFS report, https://ifs.org.uk/publications/role-changing-health-rising-health-related-benefit-claims.
Latimer, E., Sibieta, L. and Snape, D., 2025. Support for children with disabilities and special educational needs. IFS Green Budget chapter, https://ifs.org.uk/publications/support-children-disabilities-and-special-educational-needs.
Maestas, N., Mullen, K. J. and Strand, A., 2013. Does disability insurance receipt discourage work? Using examiner assignment to estimate causal effects of SSDI receipt. American Economic Review, 103(5), 1797–829, https://doi.org/10.1257/aer.103.5.1797.
Miller, S., Rhodes, E., Bartik, A. W., Broockman, D. E., Krause, P. K. and Vivalt, E., 2024. Does income affect health? Evidence from a randomized controlled trial of a guaranteed income. NBER Working Paper 32711, https://www.nber.org/papers/w32711.
National Audit Office, 2023. Transforming health assessments for disability benefits. National Audit Office report, https://www.nao.org.uk/wp-content/uploads/2023/06/transforming-health-assessments-for-disability-benefits.pdf.
Office for Budget Responsibility, 2019. Welfare trends report – January 2019. Office for Budget Responsibility report, https://obr.uk/wtr/welfare-trends-report-january-2019/.
Oparina, E., Krekel, C. and Srisuma, S., 2024. Talking therapy: impacts of a nationwide mental health service in England. CEP Discussion Paper 1982, https://researchonline.lse.ac.uk/id/eprint/126829/1/dp1982.pdf.
Overland, R., Overland, S., Johansen, K. N. and Mykletun, A., 2008. Verifiability of diagnostic categories and work ability in the context of disability pension award: a survey on ‘gatekeeping’ among general practitioners in Norway. BMC Public Health, 8, 137, https://doi.org/10.1186/1471-2458-8-137.
Ray-Chaudhuri, S. and Waters, T., 2024. Recent trends in and the outlook for health-related benefits. IFS report, https://ifs.org.uk/publications/recent-trends-and-outlook-health-related-benefits.
Scope, 2025. The extra cost of cuts: Disability Price Tag 2025. Scope report, https://assets-eu-01.kc-usercontent.com/73ea709e-f9f8-0168-3842-ebd7ad1e23ac/f5557ec8-877d-4eb1-9af6-d6adaaf505cb/Disability%20Price%20Tag%20Report%20FINAL%20v2.2.docx.
Thomson, R. M., Igelström, E., Purba, A. K., Shimonovich, M., Thomson, H., McCartney, G., Reeves, A., Leyland, A., Pearce, A. and Katikireddi, S. V., 2022. How do income changes impact on mental health and wellbeing for working-age adults? A systematic review and meta-analysis. Lancet Public Health, 7(6), e515–28, https://doi.org/10.1016/S2468-2667(22)00058-5.
Zaidi, A. and Burchardt, T., 2005. Comparing incomes when needs differ: equivalization for the extra costs of disability in the UK. Review of Income and Wealth, 51(1), 89–114, https://doi.org/10.1111/j.1475-4991.2005.00146.x.
Data
Department for Work and Pensions, NatCen Social Research. (2021). Family Resources Survey. [data series]. 4th Release. UK Data Service. SN: 200017, DOI: http://doi.org/10.5255/UKDA-Series-200017
University of Essex, Institute for Social and Economic Research. (2026). Understanding Society: Waves 1-15, 2009-2024 and Harmonised BHPS: Waves 1-18, 1991-2009. [data collection]. 21st Edition. UK Data Service. SN: 6614, DOI: http://doi.org/10.5255/UKDA-SN-6614-22
Acknowledgements
This chapter has been produced as part of the IFS Green Budget 2026. The 2026 edition of the IFS Green Budget is funded by the Nuffield Foundation, Barclays and the Economic and Social Research Council (ESRC) through the Centre for Microeconomic Analysis of Public Policy (CPP). IFS is an independent Research Institute. As with all pieces of work, IFS has full editorial control over its analysis and conclusions. In addition to providing funding, Barclays authors will write chapters for the 2026 Green Budget, covering topics (the macroeconomic outlook and bond markets) where their expertise complements that of IFS.
Endnotes
Authors

Eduin Latimer
Eduin is a Senior Research Economist in the Income, Work and Welfare sector. His research focuses on benefits policy and the low-paid labour market.

Matthew Oulton
Matthew is a Research Economist in the Income, Work, and Welfare sector. His research focuses on the UK tax and benefit system.

Tom Waters
Tom is an Associate Director at the IFS and Head of the Income, Work and Welfare sector.
More from IFS
Understand this issue


Policy analysis


Academic research


