
Downloads

Download chapter as a PDF
PDF | 1.54 MB
The government’s performance against its fiscal rules, and hence many decisions taken by the Chancellor at the Budget, hinge on the Office for Budget Responsibility (OBR)’s five-year (‘medium-term’) forecast for the public finances. An important component of this forecast is migration, which is a key driver of changes in the size and composition of the UK population. But migration is hard to measure, and even harder to forecast. Migration will also have different impacts on government revenues and spending depending on its composition: between immigrants and emigrants, and between immigrants arriving on different visa routes. In this chapter, we outline the challenges the OBR faces in accurately reflecting the impacts of migration in its medium-term public finance forecast and suggest ways to improve the current approach.
Key findings
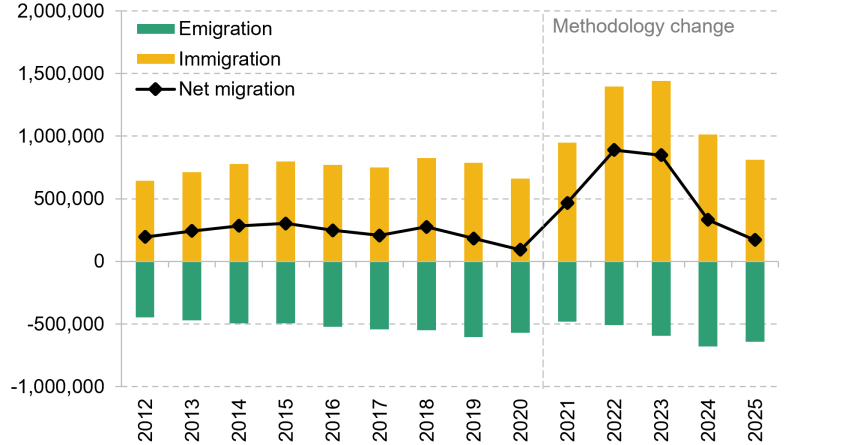
- Immigration into the UK was relatively stable in the 2010s and is estimated to have averaged 750,000 per year between 2012 and 2019. Emigration out of the UK was rising and is estimated to have averaged around 500,000 per year. Net migration (i.e. the difference between immigration and emigration) therefore averaged around 250,000 per year across the 2010s. Immigration rose sharply in the 2020s, with an estimated peak of 1.4 million per year in 2022 and 2023. Emigration also rose, but by less, so net migration exceeded 800,000 in 2022 and 2023. Since 2023, net migration has fallen sharply, driven by a slowdown in immigration and higher emigration of recent immigrants. The latest estimates suggest net migration in 2025 was around 171,000.
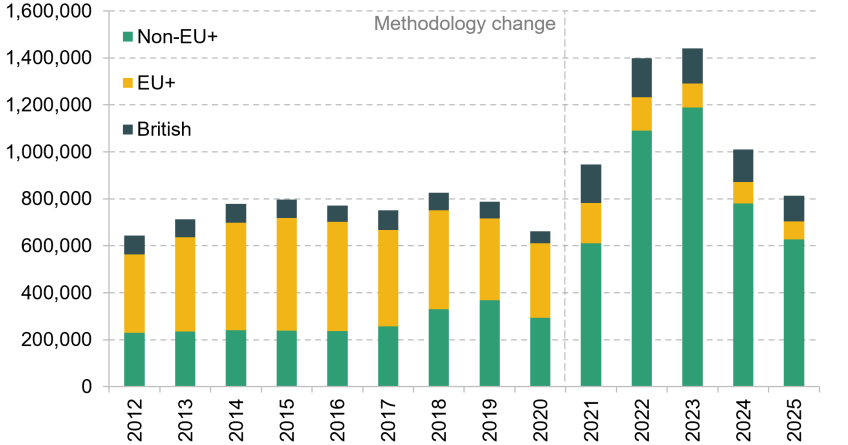
- The composition of migration has changed substantially over time. In 2025, around three-quarters of new immigrants were from non-EU countries, compared with around a third between 2012 and 2020. Relative to 2019, the composition of non-EU migrants has also changed. A much greater share of non-EU immigrants in 2025 were students and their dependants (47% in 2025 versus 33% in 2019) or on asylum or humanitarian routes (20% versus 13%). A much smaller share were on a family route (mostly spouses of existing residents, 7% versus 21%) or workers and their dependants (23% versus 27%).
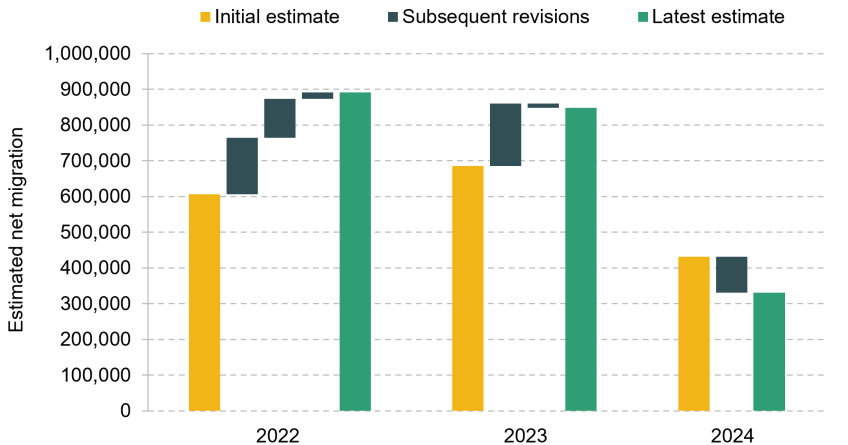
- Forecasting the future level of net migration is very hard: between 2015 and 2025, net migration turned out on average 170,000 a year higher than the Office for National Statistics (ONS) had projected five years earlier. Even estimating the current level of net migration is challenging, and past estimates are frequently subject to large revisions: estimates of net migration in 2022 have been revised up by nearly 300,000, while estimates for 2024 have been revised down by 100,000.
- Policymakers should not make decisions about migration policy based primarily on the impacts it will have on the OBR’s fiscal forecast. The fiscal forecast – by construction – only captures impacts over five years. As the OBR has documented, the longer-term fiscal impacts of migration could well be different, as migrants who remain in the UK gain more access to the benefits system over time, and use different public services as they age, for instance. Migration also has broader societal impacts which are outside the scope of the OBR’s forecast. Just as for other areas of policy, these wider impacts should also be considered when policy is made.
- Migration policy can have very large impacts on the economy and the public finances. For example, the Home Office projected that three big policy changes since the pandemic – the visa route for Hong Kongers in 2020, restrictions on international students switching routes and bringing dependants in 2023 and restrictions on Skilled Worker visas in 2025 – would each change migration by at least an average of 40,000 per year over five years. We estimate that these policies could have had larger impacts on the size of the economy than any of the high-profile ‘supply-side’ policies announced since 2023, including planning reform, tax changes and childcare subsidies. For this reason, migration is an important component of the OBR’s economic and fiscal forecasts.
- The OBR’s medium-term migration forecast is closely linked to long-run ONS migration projections. These ONS projections are not intended to account for all policy announcements and are released much less frequently than OBR forecasts; by construction, they do not respond to recent policy changes. While the OBR can, in principle, deviate from the ONS projections, in practice it almost never has in the later years of its forecast. There is a strong case that, considering the period since late 2020 as a whole, the OBR migration forecasts did not fully account for policy changes. This in turn has likely reduced the accuracy of fiscal forecasts in recent years.
- The OBR has recently separated its short-term migration forecast from the ONS projections, allowing it to explicitly account for trends in visa numbers and stay rates of recent emigrants. We recommend that the OBR builds on these improvements and fully detaches its medium-term forecast from the ONS projections, with a view to better capturing policy going forward. There would be a case for the OBR to also more explicitly distinguish between policy-driven and other changes to its net migration forecast, and how these feed through to the fiscal forecast. This would aid transparency and external scrutiny of policy choices.
- When considering the impacts of net migration on the public finances, the OBR is required to take government spending plans as given and therefore has to assume there are no related changes in public service spending in its medium-term forecast. Higher net migration could increase the pressure on public services; similarly, lower migration could free up resources. However, government departments are set cash budgets which the OBR is required to take as given: it is up to the government whether it changes spending or allows performance to change in response to changes in migration. The OBR was granted new powers in 2024 to adjust its spending forecasts where the government may be forced to spend more or less than it previously thought, and has previously used these to account for pressures on asylum spending. Were future migration to increase, the OBR should use these powers to forecast migration-related overspends where they seem likely.
- The impact of higher net migration on borrowing over a five-year period will depend heavily on how tax revenues change and how government spending on public services responds. As an illustration of the potential scale: in a scenario published in March 2024, the OBR estimated that an increase in net migration of 200,000 per year for five years could reduce borrowing by about £20 billion per year by the end of the forecast horizon. If the government chose to increase spending in order to keep public service quality unchanged, borrowing could instead fall by about £13 billion per year by the end of the forecast horizon. Similarly, a reduction in net migration would likely worsen the fiscal forecast, even if a government responded by reducing planned spending on public services. For any specific change in net migration, the precise composition of migrants would determine the fiscal impacts.
- The ONS has recently reduced its long-run projection for net migration by 110,000 per year. If the OBR continues to tether its net migration projection to the ONS’s long-run projection, this could result in a reduction in its own migration forecast at the Budget. Depending precisely on how the OBR adjusts each year of its forecast in response, this could lead to an increase in forecast borrowing of around £1–5 billion in 2031–32 (taking existing spending plans as given). Such a change in the forecast should not normally drive fiscal policy changes, but can matter when Chancellors choose to leave minimal headroom against their fiscal rules.
- Different types of migrants can have very different effects on the public finances. For some migrants, employment is a visa requirement, such that they are much more likely to be employed than people born in the UK, while other groups have lower employment rates or are prevented from working. This affects the taxes they are likely to pay. Some immigrants have immediate access to the benefits system, while many others do not. Not all changes in composition will be material, but some changes could make a meaningful difference to the fiscal forecast. In the past, the OBR has sometimes adjusted its forecast to capture changes in the characteristics of migrants beyond their age. There are ways that the OBR could more systematically adjust for differences across different migration routes in its forecast, which could improve transparency.
5.1 Introduction
Migration has wide-ranging effects on the UK economy and society. Migration changes the size and composition of the UK population, and can therefore impact both the overall size of the economy and its per-person size, with potential impacts on both labour markets and productivity (Dustmann, Frattini and Preston, 2013; Ottaviano, Peri and Wright, 2018). Patterns of migration feed through to fiscal impacts, including the impact on tax revenues and public spending (Dustmann and Frattini, 2014; Vargas-Silva, Sumption and Brindle, 2026). There is also a whole suite of non-economic impacts of migration policy, including on the well-being of migrants, humanitarian goals and social cohesion (e.g. Letki, 2008; Bell, Fasani and Machin, 2013). All these impacts can differ substantially across different parts of the UK, across different time horizons and for different groups of migrants.
Migration is not the only factor to affect the size and make-up of the UK population, but it typically changes much more from year to year than either fertility or mortality (Billari, 2022). It is also much more responsive to policy, with the government having more control over the number and mix of arrivals to the UK than it does over numbers of births or deaths.
In this chapter, we focus on just one aspect that policymakers may consider when making decisions about migration policy: the impact of migration on the outlook for the UK’s public finances. We focus in particular on the Office for Budget Responsibility (OBR)’s medium-term public finance forecast which considers tax revenues, public spending, borrowing and debt over a five-year horizon. This forecast is very important for fiscal policy decisions, as the UK’s current fiscal rules are forward looking and whether they are being met is based on these OBR forecasts. As with other policy areas, this forecast should not be the only – or indeed even the primary – driver of migration policy: the wider economic and social impacts of net migration, as well as the longer-term fiscal impacts, should be the core part of the policymaking process (Johnson, 2023; Emmerson, Ridpath and Stockton, 2025).
Nevertheless, the link between migration and the OBR’s forecast is very consequential, for two main reasons. First, substantial changes to migration – whether driven by policy or other factors – can have large effects on the path of tax revenues, public spending and overall borrowing. The forecast of these impacts feeds through to the margin by which the fiscal rules are being met, and thereby can have a significant impact on tax and spending choices across government. For example, at the 2026 Spring Forecast, the OBR accounted for the Office for National Statistics (ONS)’s upward revision to estimates of recent British emigration by 50,000 per year, which in turn led it to raise its forecast of future British emigration and consequently lower its forecast of net migration (Office for Budget Responsibility, 2026). We estimate that this reduction in projected net migration reduced the OBR’s forecast of tax revenues in 2030 by around £5 billion (Ridpath, 2026). At the Autumn Budget, the Chancellor is likely to face a further downgrade to the OBR’s net migration forecast, after the ONS lowered its long-run net migration projection from 340,000 to 230,000 per year (Office for National Statistics, 2026c). It is important for broader fiscal policy decisions that the OBR’s forecast adequately captures the effects of these changes in migration. This is especially relevant when the government leaves little room against its fiscal rules, so that even small changes in the OBR’s fiscal forecast can force the government to make tax and spending changes to continue meeting the rules.
Second, the impact of policy reforms on the public finances, and more narrowly on compliance with the fiscal rules, can be – for right or wrong – a key factor in the government’s decision-making process. Given this, it is important that the forecast captures the expected effects of policy reforms, including any to migration policy, accurately. If it does not, this could lead to policymakers making decisions on migration policy based on the impacts that possible reforms might have on the forecast rather than based on their actual expected public finance impacts.
In this chapter, we argue that the way migration policy feeds into the OBR forecast is unclear and broadly inconsistent with how other areas of policy are treated. There is a strong case that the impacts of past policy changes have not been fully captured in recent fiscal forecasts and that, without a change of methodology, the impact of future policy would not be fully or transparently reflected. This matters both for the accuracy of the fiscal forecast and for how policymakers and broader audiences understand the impact of migration policy on the economic and fiscal outlook. We therefore recommend that the OBR moves to more explicitly accounting for policy when producing its migration forecast.
There are other issues that warrant discussion too: while the OBR’s forecast automatically accounts for differences in the age of migrants, it has used ad hoc adjustments for other characteristics. There is a case that the forecast should account for the differences between different types of migrants in a more systematic way. Additionally, the OBR’s forecast could overstate the benefits of immigration because it is required to mostly assume that there are no related changes to public service budgets. That is not the fault of the forecast – there are good reasons that, under the current fiscal framework, the OBR mostly takes the government’s public service spending plans as given – but it is one of several reasons that the forecast should not be used as the only way to make or judge migration policy.
Our focus in this chapter is on the impacts of migration over a five-year horizon, rather than any longer-run impacts. This is a key time frame given the current fiscal framework, and it is also a meaningful time period for considering migration in its own right: many immigrants, often a majority, leave the UK within five years of arriving (Home Office, 2024, 2025a and 2026a).1 But the longer-run effects of migration for the group who stay in the UK (or remain out of the UK) for longer are also important, and should also be considered by policymakers. Box 5.1 examines why the medium- and long-run impacts of migration may differ, and some of the existing evidence on the public finance impacts of migration.
The rest of this chapter is organised as follows. Section 5.2 presents some basic facts about migration to, and from, the UK. Section 5.3 discusses the challenges of measuring and forecasting levels of net migration. Sections 5.4 and 5.5 examine the challenges in forecasting the impacts of migration on government revenues and on government spending, respectively. Section 5.6 concludes.
Box 5.1 The long-run impacts of migration on the public finances
In this chapter, we focus on the impacts of migration over a five-year period, the length of the OBR forecast horizon. Many immigrants leave within five years and so will have minimal longer-run impact on the public finances. For example, of the migrants who were granted a visa or claimed asylum in 2019, 57% had no entitlement to still be in the UK five years later (Home Office, 2025a).a Similarly, some emigrants may return to the UK within five years of leaving, and so their decision to emigrate will also have minimal longer-run impact on the public finances.
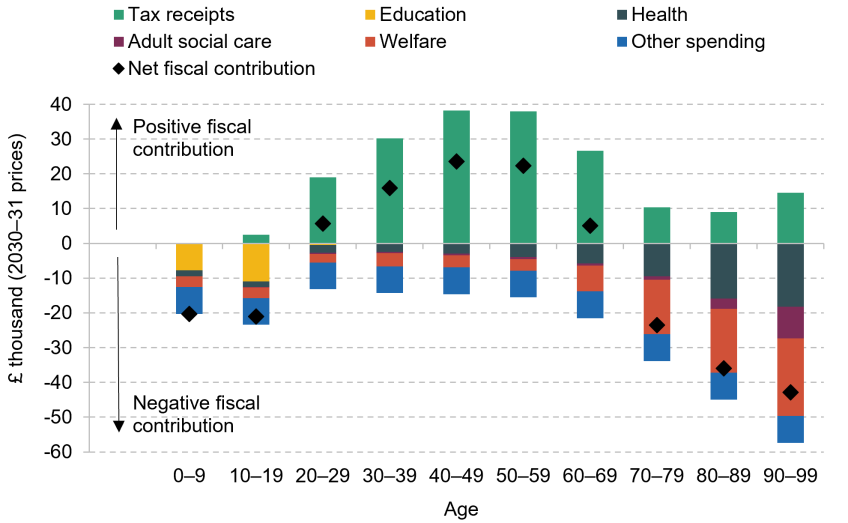
Nonetheless, many immigrants will remain in the UK for longer than five years and many emigrants will leave the UK for longer than five years. In general, the impacts on the public finances in the longer run are likely to differ from the short-run impacts. For example, most immigrants gain access to more parts of the benefit system when they receive Indefinite Leave to Remain (discussed more in Section 5.5) and no longer have to pay visa fees. As immigrants and emigrants age, there will also be changes to tax revenues coming from them and spending on areas such as health, social care and the state pension – Figure 5.1 shows how tax receipts and public spending differ for the average UK resident by age. Long-term immigrants may also have children in the UK and may have different fertility rates from the existing population, which will feed into longer-run demographic changes in the UK. These differences between the short-run and long-run impacts of migration on the public finances are something the OBR has also discussed, including in recent Fiscal Risks and Sustainability reports (e.g. Office for Budget Responsibility, 2024b).
Figure 5.1. Age profile for public spending and tax receipts for an average UK resident
Note: See the introduction and annex C of the OBR’s 2026 Fiscal Risks and Sustainability report for more details on how these are constructed.
Source: Office for Budget Responsibility, 2026b.
When estimating the long-run fiscal impacts of migration, there is much more uncertainty than over the five-year horizon. This uncertainty stems from the behaviour of immigrants, including how long they stay in the UK, as well as the general equilibrium effects that migrants will have on the wider economy, labour markets and productivity. The long-run impacts of migration are also very dependent on how costs and benefits in different years are valued. The government typically discounts future costs and benefits, meaning that it places less weight on impacts occurring further in the future than on those occurring sooner. This can be justified in several ways: society may place greater value on more immediate impacts – for instance, if it expects future generations to be better off – while reductions in government borrowing today are more valuable than future reductions in borrowing as there is less accrued interest, so that immediate savings are worth more than the same cash amount received in the future.
The Migration Advisory Committee (MAC) has estimated the long-run fiscal effects of some groups of immigrants, specifically Skilled Worker visa holders and their dependants (Migration Advisory Committee, 2025). To do this, it has estimated a net present value of the sum of all the future annual fiscal contributions (or costs), discounted using a 3% real discount rate. This is similar to the approach taken by the Treasury.
For those on Skilled Worker visas, the MAC estimates a mean net present value of £689,000. This is even higher (£931,000) for skilled workers who do not leave the UK. It estimates that health and care workers have much smaller impacts, but they are still on average positive, with an average net present value of £54,000. It estimates that adult dependants of those on worker visas have lower fiscal benefits in the long run – dependants of skilled workers have very small positive effects (£3,000) and dependants of health and care workers have a negative fiscal impact (–£67,000).
It is worth noting that the mean UK resident has a net negative fiscal contribution, though this can be explained by much of the negative fiscal impact coming during childhood: when the MAC adjusts the fiscal impact of UK residents to start from the same distribution of ages as observed across immigrants on arrival, the mean UK resident has a positive fiscal contribution.
a Among those who were granted a visa or claimed asylum in 2020, the latest year for which we have data but also likely an exceptional year for migration, 45% had no entitlement to still be in the UK five years later (Home Office, 2026b).
5.2 Recent trends in migration
In this section, we present some basic facts about international migration to and from the UK. We describe historical trends in immigration and emigration, the main immigration routes, and the age profile of immigrants and emigrants.
Figure 5.2 shows the Office for National Statistics (ONS) estimates of international immigration, emigration and net migration (the difference between the two) since 2012. In the chart, and throughout the chapter, we use the ONS’s definition of long-term migration, defined as the number of people moving to the UK for at least 12 months (immigrants) or leaving the UK for at least 12 months (emigrants).2 It is important to note that these figures are estimates. As we discuss in more detail in Box 5.2, all forms of migration are difficult to measure directly, and some – such as the migration of British nationals – particularly so. This means that the ONS must rely on estimates of different migration flows, and these are often subsequently revised.
Figure 5.2. Immigration, emigration and net migration
Note: Figures are rounded to the nearest thousand. The chart reflects estimates for each year ending December (i.e. between January and December). Migration is dated by the migration event, i.e. the date of arriving in or leaving the UK, but estimates include only long-term migrants who move to the UK or leave the UK for at least 12 months. Includes ONS revisions to its own estimates between 2012 and 2021 to improve consistency with new approach introduced in 2021 (discussed in Box 5.2). A significant methodological break remains for British nationals around 2021 as estimates before and after this point are produced using different methods.
Source: Office for National Statistics, 2026b.
Net migration was generally stable through the 2010s, ranging between 200,000 and 300,000 a year. This reflected annual immigration of between 600,000 and 800,000 people, partly offset by emigration of around 500,000 people. After a sharp dip during the COVID-19 pandemic, immigration rose sharply from 2021 onwards, reaching historically high levels in 2022 and 2023 at 1.4 million per year. As a result, net migration rose to around 500,000 in 2021 and almost 900,000 per year in 2022 and 2023. Since then, immigration has fallen steeply from its peak, while emigration has remained relatively high, bringing net migration below its pre-pandemic level in 2025.
Box 5.2. Challenges measuring net migration
There are several difficulties in estimating recent levels of net migration. The first is in estimating immigration. This stems from the fact that the definition of long-term migrant only counts those who live in the UK for at least a year. While most movement into the UK can be measured through visa and border data, it is harder to measure how many of those arrivals went on to leave within a year.
The lack of detailed reporting of reasons for departure from the UK is an even bigger challenge for estimating emigration. Neither departure data nor visa expiration data perfectly capture levels of emigration. Those who leave the country are not required to report that they are leaving permanently, and departure data do not in themselves reveal whether someone is leaving for a short trip or leaving permanently. Visa expiry data do not capture permanent emigration, as individuals may have left before their visa expired or may overstay their visa.
This poses a substantial challenge for the ONS, and in recent years it has changed its method for measuring emigration. Until 2020, it used the International Passenger Survey (IPS), which asked travellers at points of exit from the UK more details about their reasons for travel. However, due to issues with the survey, the ONS has now moved to the use of administrative data, including tax and benefit data from HM Revenue and Customs (HMRC) and the Department for Work and Pensions (DWP) and data on international students from the Department for Education (DfE).
The move to administrative data should improve measurement by providing much broader coverage than the IPS, but it does not eliminate uncertainty, as moves lasting at least 12 months take time to become apparent in the data, and not everyone ceasing to appear in administrative data will have emigrated. Following this methodological change in 2021, the ONS revised past estimates back to 2012 to improve consistency with the new approach. The historical series was harmonised with the new methodology mainly for non-British migration; for British nationals, revisions were also made, but estimates before and after 2021 remain based on different methods.
Given these challenges, revisions to the net migration estimates are common. Figure 5.3 shows how estimates have been revised over time. These mismeasurements can be very large: the initial net migration estimate for 2022 (produced in 2022) was 610,000, while the most recent estimate (produced in 2025) is 890,000, almost 50% higher. Estimates of net migration for 2024 have been revised down from 430,000 to 330,000 in just a year. Against this backdrop, estimates of the public finance impacts of recent migration are inherently uncertain. Forecasting future migration is also more challenging when estimates about the recent past are uncertain.
Figure 5.3. Revisions to net migration estimates
Note: Latest estimate is as of 2025 in all cases. Estimates by date of arriving in or leaving the UK for each year ending December (i.e. between January and December).
Source: Office for National Statistics, 2026d.
Indeed, the ONS estimates are not the only estimates of UK net migration. Aristotelous, Smith and Bijak (2023) estimate that net migration to the UK in the 2010s may have been much higher than the ONS has estimated. In 2019, for example, their median estimate is net migration of 430,000 (with a 25th percentile estimate of 350,000 and a 75th percentile estimate of 530,000), compared with the ONS’s estimate of 183,000.
Figure 5.4 shows estimates of immigration broken down by nationality, grouping countries into European countries that had free movement pre-Brexit (EU+) and all other countries (non-EU+).3 Recent fluctuations in immigration have been driven mainly by non-EU+ nationals. Immigration from EU+ countries has declined steadily since the vote to leave the European Union in 2016 and now accounts for a much smaller share of total immigration than in the past. British nationals returning to the UK now slightly outnumber European nationals moving to the UK.
Figure 5.4. Immigration to the UK by nationality
Note: Figures are rounded to the nearest thousand. The chart uses estimates for each year ending December (i.e. between January and December). Immigration is dated by the migration event, i.e. the date of arriving in the UK, but estimates include only long-term migrants who remain in the UK for at least 12 months. Includes ONS revisions to its own estimates between 2012 and 2021 to improve consistency with new approach introduced in 2021 (discussed in Box 5.2). A significant methodological break remains for British nationals around 2021 as estimates before and after this point are produced using different methods.
Source: Office for National Statistics, 2026d.
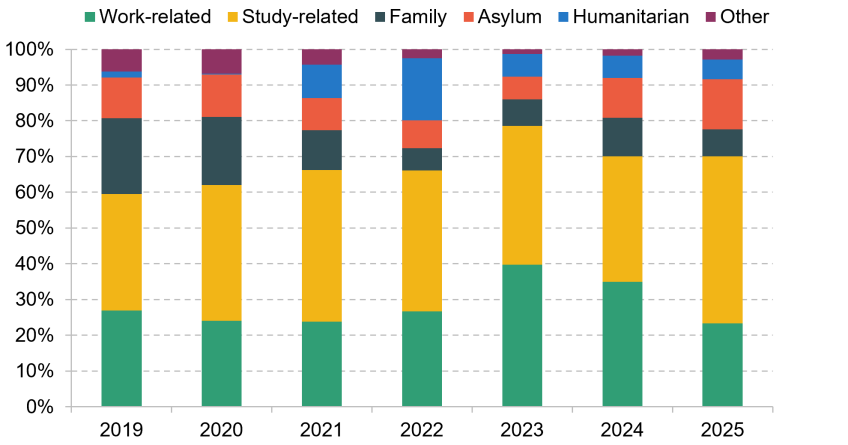
Immigration to the UK can be for different reasons, which we refer to as migration routes. These include work, study, family reasons, asylum and other humanitarian reasons. Most non-European immigrants come to the UK on visas tied to a particular purpose for being in the UK, which means it is possible to break down their immigration by route, as shown by Figure 5.5.4
Figure 5.5. Non-EU+ immigration to the UK by route
Note: The chart uses estimates for each year ending December (i.e. between January and December).
Source: Office for National Statistics, 2026d.
Work and study are the most common routes into the UK for non-EU+ nationals, and constituted 70% of new immigrants in 2025.5 The share of immigrants arriving for family reasons, who mostly join either a British citizen or a settled migrant, has fallen since 2019 and 2020. Humanitarian migration became a more significant share of total immigration from 2021, following the opening of the Hong Kong BNO route in 2021 and the Ukraine schemes in 2022. Asylum seekers, including those arriving on small boats, have, in recent years, accounted for between 5% and 15% of total non-EU+ immigration inflows.6
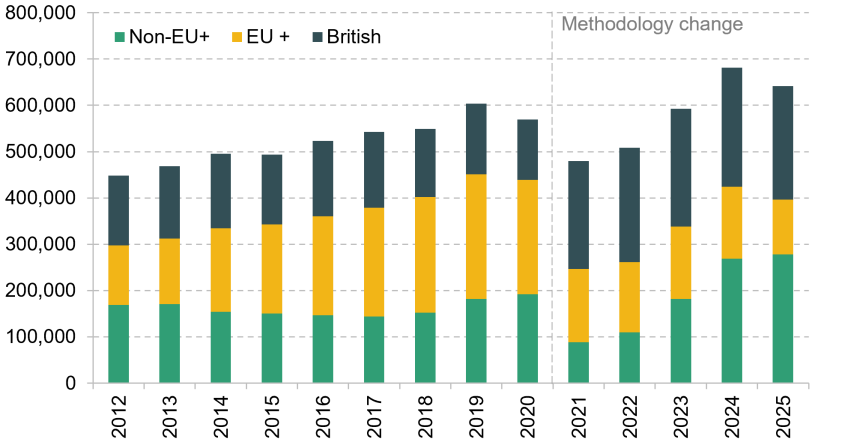
Figure 5.6 shows estimates of emigration by nationality. Emigration is more evenly split between non-EU+, EU+ and British nationals than immigration. Trends in emigration among non-British nationals depend strongly on earlier immigration patterns, as many immigrants leave the UK within a few years of arrival (see Box 5.1). Accordingly, the surge in non-EU+ immigration from 2021 is now being reflected in higher emigration of non-EU+ nationals from 2023 onwards, the majority of whom are those who initially moved to the UK to study. Conversely, lower inflows of EU+ nationals are now translating into fewer EU+ nationals leaving the UK. Emigration among British nationals is now estimated to be higher than in the past, largely because of a methodological change in the production of these estimates from 2021 onwards (discussed in Box 5.2).7
Figure 5.6. Emigration from the UK by nationality
Note: Figures are rounded to the nearest thousand. The chart uses estimates for each year ending December (i.e. between January and December). Includes ONS revisions to its own estimates between 2012 and 2021 to improve consistency with new approach introduced in 2021 (discussed in Box 5.2). A significant methodological break remains for British nationals around 2021 as estimates before and after this point are produced using different methods.
Source: Office for National Statistics, 2026d.
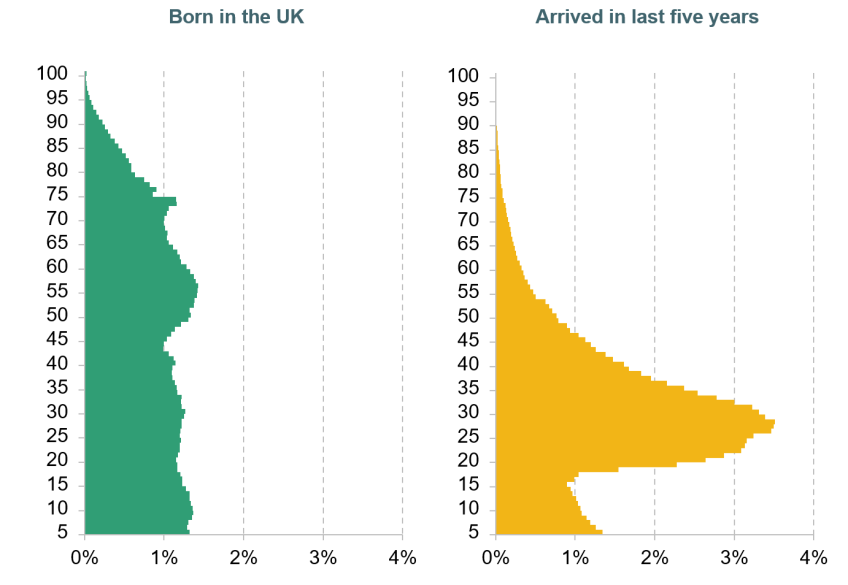
An important distinguishing feature of migrants, both those moving to and those moving from the UK, is their age. Both immigrants and emigrants tend to be younger than long-term UK residents. We can use the latest Census to examine the full age profile of immigrants. Foreign-born individuals who arrived in the UK recently are overwhelmingly of working age, with a particularly strong concentration between ages 16 and 40, as well as a visible peak among very young children (Figure 5.7).8 This is a very different profile from that of the UK-born population.9 For emigrants, we cannot observe age with the same level of detail as in the Census, but ONS estimates suggest that most migrants leaving the UK for at least 12 months are aged between 16 and 64, among both British and non-British nationals (Office for National Statistics, 2026b). The age distribution of migrants is important as it has consequences for their fiscal impact. As shown by Figure 5.1, on average, working-age adults pay more in taxes than they receive in public services or benefits, whereas the reverse is true for children and older adults. We discuss these impacts in more detail in Sections 5.4 and 5.5.
Figure 5.7. Age distribution of recent immigrants and UK-born population
Note: We trim both distributions at 5 years old to avoid a mechanical drop in density among immigrants who arrived within the last five years.
Source: Authors’ analysis of 2021 Census.
5.3 Forecasting net migration
The Office for Budget Responsibility (OBR) needs to forecast the level of net migration; this is an important input into the overall economy and fiscal forecasts. Future migration patterns are difficult to predict because they depend on factors such as how many people in the UK and in other countries want to migrate, the relative attractiveness of the UK compared with other destination countries, and UK government policy.
The OBR’s net migration forecast is closely linked to the ONS population projections. In this section, we first examine the ONS approach to projecting net migration. We then describe the OBR’s current approach to forecasting migration and discuss its shortcomings, particularly in accounting for the impacts of policy announcements.
ONS migration projections
Every two years, the ONS produces projections for the population over the next 50 years, which include a long-run projection of migration. These are the UK’s principal population projections, used across government and beyond. The ONS migration projection is made up of two components: a long-run annual level of net migration, which is usually assumed to be constant from around the sixth year of the projection onwards, and a short-run path that connects the latest out-turn data with this long-run level.10 We focus here on the long-run projection, as it is most relevant for the OBR’s approach.
The ONS combines two approaches to get a single principal projection for long-run net migration. It consults a panel of experts, who provide their view on the expected level of net migration in the long run. It also calculates an average of past levels of migration. The ONS provides limited details as to how either of these approaches is operationalised, or as to how these different estimates are combined. In its latest population projections, produced in April 2026, it assumed that net migration would be 230,000 per year in the long run. This was the average level of net migration between 2013 and 2025, excluding the peak years from 2022 to 2024. Its expert panel had provided a mean central estimate of 186,000 in 2030 and 244,000 in 2050 (Office for National Statistics, 2026e).
Forecasting migration is challenging as future levels of migration are dependent on the future behaviour of possible immigrants and emigrants, which can be very hard to predict (Czaika, Bijak and Prike, 2021). Given this inherent uncertainty, out-turn net migration has often differed from the ONS projections.
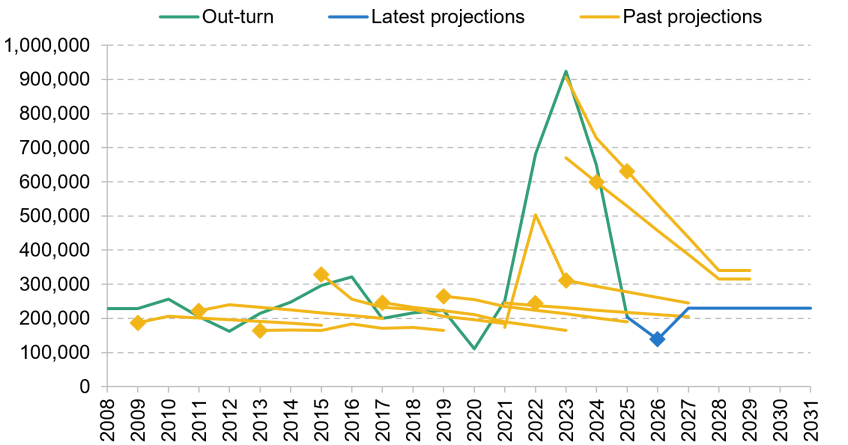
Figure 5.8 compares successive ONS population projections with the out-turn since 2009. Throughout the 2010s, in which net migration stayed relatively flat, the ONS tended to underestimate net migration by projecting a fall in migration in its principal projections. This may have reflected the fact that net migration in the 2010s was above levels seen in previous decades, so any projection based on historical averages would have projected some fall back to earlier levels.11 The substantial spike in net migration from 2022 to 2024 was not anticipated by the ONS, which meant that pre-spike projections heavily underestimated net migration in this period. However, since then, projections have expected the spike to last for longer than it has, leading to an overestimate of net migration in recent years.
Figure 5.8. Performance of ONS net migration projections
Note: ‘Latest projections’ are 2024-based from the latest available provisional out-turn. The diamond markers show the year each forecast was published. Both out-turns and projections are mid-year estimates (July to June).
Source: Office for National Statistics, 2025a and 2026c.
Revisions to out-turn measures of net migration can also create errors in migration forecasts. As discussed in Box 5.2, recent net migration out-turns are frequently subject to large revisions. Since the most recent out-turns serve as a baseline from which expected trends in net migration stem, this can also impact the accuracy of the forecast going forward.
OBR migration forecasts
The OBR forecasts migration for the next five years to feed into its medium-term public finance forecast. The OBR has always closely linked its forecast to the ONS projections. In every fiscal forecast between 2015 and 2019, the OBR simply used the latest ONS principal projection for its own forecast.
In more recent years, the final year(s) of the OBR’s net migration forecast has continued to be tethered to the ONS projection. Specifically, to make its medium-run forecast, the OBR starts with the ONS projection and then considers – including by consulting external experts – whether to deviate from it. In some Economic and Fiscal Outlook reports, the OBR has discussed how different factors could affect the forecast relative to ONS projections (discussed in more detail in the next subsection). However, this process has almost never led the OBR to judge that its forecast should deviate from the ONS projections in the later years of the forecast. In all but one of the last eight fiscal forecasts, the OBR’s net migration forecast five years out has been identical to the ONS’s long-run projection; this has often also been true for the third and fourth years. The exception, at the March 2026 Spring Forecast, reflected that the ONS had adjusted its method for estimating the emigration of British nationals but had not yet produced updated long-run population projections incorporating this change. The OBR scaled down its estimates for net migration by 50,000, seemingly pre-empting the change that would come the following month in the April 2026 set of ONS population projections.
For the intermediate period between the most recent out-turn and the fifth year of the forecast, the OBR has sometimes deviated from the ONS projections in recent years. It has started using a more sophisticated approach to forecasting short-term net migration, known as the stay-rate method (Office for Budget Responsibility, 2024a, box 2.3), which is a very welcome development. This method involves a forecast for short-term immigration trends based on recent visa flows, and a more detailed forecast for the emigration of previous immigrants using past immigration flows and probabilities of leaving the UK (Hall, Manning and Sumption, 2023). The OBR has recently published more detail on this approach (Office for Budget Responsibility, 2026c).
Figure 5.9 shows the ONS population projections that were published in January 2025, the latest projections available for the three most recent OBR forecasts, which are also shown. There are now substantial deviations from the ONS projections in the early years of the OBR forecast, up to a difference in net migration of about 450,000 in 2025. However, the fifth year of the OBR’s forecast has remained anchored to the ONS long-run projection, with the only deviation coming in March 2026 in anticipation of changes in ONS measurement practice (discussed above). It is unclear exactly how the OBR aligns its short-term and medium-term approaches: it is possible that the short-term forecast is adjusted to reach the ONS projection along a reasonable path. For example, Figure 5.9 shows the forecast trending towards the ONS long-run projection gradually over the last three or four years of the forecast.
Figure 5.9. Net migration forecasts in recent years from the Office for National Statistics and the Office for Budget Responsibility
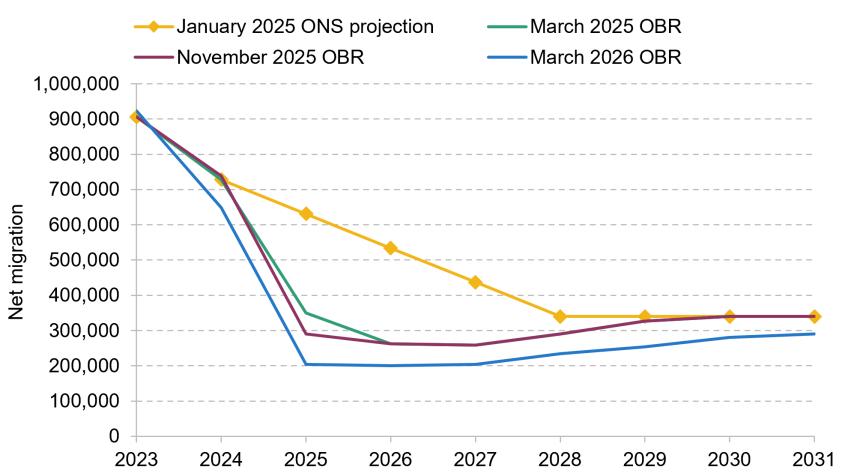
Note: Mid-year estimates (July to June). OBR estimates for 2023 and 2024 are revised estimates of the out-turn rather than projections.
Source: 2022-based population projections (Office for National Statistics, 2025c); Economic and Fiscal Outlook, March and November 2025 and March 2026 (Office for Budget Responsibility, 2025b, 2025c and 2026a).
In its most recent projections, released in April 2026, the ONS downgraded its long-term net migration assumption from 340,000 to 230,000. If the OBR continues its practice of aligning the fifth year of the forecast with the ONS projection, this will bring down its net migration forecast in that year (2031) by a further 60,000, in addition to the 50,000 reduction already made in the OBR’s March 2026 forecast. It will then face a choice about whether to reduce its forecast for net migration in all earlier years (perhaps by a similar 60,000) or only to change its forecast for later years.
The close alignment with the ONS forecast poses several challenges. The first is that the ONS projections are normally only produced every two years, while the OBR is required to produce a migration forecast twice a year. This means that the ONS’s projections can be relatively out of date by the last time the OBR uses them: in practice, the OBR has tended to use the exact same ONS projection for several fiscal forecasts in a row. The second problem is that the ONS projection is designed to be a long-run estimate of the average level of migration (typically over a 45-year period), rather than a specific estimate for the year that happens to be the fifth (or earlier) year of the OBR forecast horizon.
The third problem is that the ONS projections may capture some of the impacts of government policy, but to an unknowable degree and in a very different way from how the OBR is required to account for policy. The ONS has explicitly stated that its projections ‘do not directly account for recent and future policy or economic changes’ (Office for National Statistics, 2025b). In practice, the ONS projection may capture some impacts of recent policy to the extent that they are reflected in recent out-turn data or in the predictions of the expert panel. The projection may also capture some impacts of new policy to the extent that policy was anticipated by the expert panel. But, importantly, predictions will also include judgements about the effectiveness of policy and potential future changes in policy, including those long beyond the five-year forecast horizon, whereas the OBR mandate requires that it only account for current stated government policy. Even where policy is captured (to an unknown extent) by the predictions of the expert panel, these predictions will not necessarily change the central ONS projection (which is sometimes based on an average of past data) and, if they do change the projection, this will only feed through into OBR forecasts when the ONS updates its projections.
We now discuss in more detail how the OBR adjusts the ONS projections for policy.
The OBR’s approach to accounting for migration policy
According to the Charter for Budget Responsibility (HM Treasury, 2026), the OBR has an obligation to take the government’s planned policy as given, and make forecasts based on ‘all government decisions and all other circumstances that may have a material impact on the fiscal outlook’. In general, the OBR produces ‘pre-measures’ forecasts that capture the outlook as it would have been without the expected impact of any policy announcements made since the last fiscal event. In other areas, such as benefit spending or tax policies, the OBR forecasts the expected additional savings or costs from new policies that either are announced at the fiscal event or have been announced in the period since the last fiscal event, and includes those in its ‘post-measures’ forecast. It is this post-measures forecast that the fiscal rules are assessed against.
The OBR very rarely takes this approach for migration policy. The OBR has only produced a post-measures migration forecast once since its inception in 2010, which came when it incorporated the expected impacts of the UK’s departure from the EU on net migration as a post-measures impact in March 2020. At the time, it estimated that the new points-based immigration system would reduce net migration by 61,000 in the fifth year of the forecast, reducing real GDP by 0.3% (Office for Budget Responsibility, 2020). In the 2010s, the OBR sometimes adjusted its pre-measures forecast in response to the government’s broad policy agenda, including by adopting a variant of the ONS’s migration projections with a lower net migration assumption when the government had expressed a stated agenda to reduce levels of net migration.
However, since late 2020, it is not clear to what extent the OBR has accounted for migration policy in its net migration forecast, despite there having been several large migration policy changes in that time. From late 2020 to early 2022, the government introduced reforms to Hong Kong BNO visas, graduate route visas, the Health and Social Care Worker visa, and humanitarian visas for Ukrainians impacted by the war between Russia and Ukraine; most of these policies were assessed by the Home Office as being expected to significantly increase immigration. A range of policies intended to reduce immigration, including restrictions on dependants of those on student visas, and changes to skilled worker and graduate routes, were introduced in the following years.
Throughout this period of major policy change, the OBR’s short-term migration forecast has sometimes been adjusted to account for policy changes, though it is unclear how often this has happened, and the OBR has not historically specified the magnitude of any policy changes it has accounted for.12 In contrast, the OBR continued to anchor its five-year forecast to the ONS’s long-run migration projection. As discussed in the previous subsection, while the ONS’s population projection may capture some impacts of policy, the nature of the projections is that they do not, and cannot, fully account for policy announcements since the last fiscal event – most often there is no new projection and, even when there is, the ONS methodology will not account for policy in the way that the OBR would typically do for other areas.
For each fiscal forecast, the OBR may consider whether to deviate from the latest ONS population projection, because of policy or other changes to migration. In some Economic and Fiscal Outlooks (EFOs), it has discussed how policy changes have affected its judgement over the net migration forecast; it did this in the November 2025 EFO in relation to Immigration White Paper measures, including restrictions to Skilled Worker visas and the closing of the care visa route. However, each time the OBR has considered the impact of a policy, it has judged that the effect on net migration has been balanced out or superseded by a different development in the opposite direction. As such, it has judged that the ONS’s long-run projections continue to be the appropriate basis for the five-year forecast.
To see why this might be surprising, consider the example of changes to the student route, announced in May 2023, which restricted the ability of international students to switch between visa routes and to bring dependants to the UK. There was no subsequent update to the ONS’s long-run projections in 2023 and the OBR did not forecast any change in net migration for 2026, 2027 or 2028 between its March 2023 forecast (before the announcement) and its November 2023 forecast (after the announcement). This was despite the Home Office impact assessment, published in July 2023, forecasting that the policy would reduce net migration by an average of 100,000 in 2024–25 and 2025–26 and an average of 28,000 per year between 2026–27 and 2028–29, the latter more than 10% of the OBR’s forecast level (Home Office, 2023). At the time, the OBR argued that the impact of immigration policy had been considered, but offset by recent changes in out-turn data (and its forecast for net migration in 2024 and 2025 increased between the March and November 2023 forecasts to account for the changes in out-turn data).
More broadly, and as shown in Figure 5.8 earlier, the ONS projections (and therefore the OBR five-year forecast) did not anticipate the spike in net migration from 2022 to 2024, nor the subsequent sharp reduction in net migration. But these changes were preceded by large policy changes and accompanied by Home Office impact assessments predicting effects on the direction of the out-turn change in migration.
Forecasting is difficult and it is necessarily the role of the OBR to make judgement calls. It is not possible to formally assess, ex post and from outside the OBR, whether each individual judgement to keep the five-year forecast exactly in line with the ONS projection was right. This was clearly a period when there was a large degree of uncertainty in both the levels of net migration and the migration policy environment. Nonetheless, given the series of large policy changes across the period since late 2020, we would have expected the later years of the OBR’s forecast to have deviated from the ONS projections at some point in the past five years. We conclude that there is a strong case that, across this period as a whole, the OBR migration forecasts did not fully account for policy changes.
The OBR could have instead used a method that always and explicitly adjusted its net migration forecast for the impacts of policies when they were announced, rather than treating the much-slower-moving ONS projections as a default that might be moved away from in extreme circumstances. If it had done this, it seems very plausible that the forecast might have captured more of the increase and subsequent decrease in net migration since 2020.
A better migration forecast in turn might have substantially changed the OBR’s forecast for tax revenues and overall borrowing. For example, each of the OBR’s forecasts for net migration in the EFOs from November 2023 to March 2025 overestimated levels of net migration in 2025 by over 100,000. These differences are not just significant for the accuracy of the migration forecast itself: all of these figures are large enough to have a substantial impact on the OBR’s growth, tax revenues and borrowing forecasts. In practice, it is difficult to estimate exactly how much a more accurate migration forecast could have affected the OBR’s fiscal forecasts over this period, precisely because it is not possible to establish how much the ONS’s migration forecast accounts for migration policy in the way the OBR would account for it. But, as we show shortly, the effect of migration policy since 2020 was large enough that even not accounting for part of it could have made a meaningful difference.
Accounting for policy does not just matter for the accuracy of the forecast. Regardless of whether the OBR has always made the best migration forecast it could, there would also be considerable value in the OBR more explicitly documenting how migration policy has changed its forecast. The OBR’s role in scoring the impact of policies provides useful information for policymakers, and provides an indication for a broader audience of how the government’s decisions have both affected its performance against the fiscal rules and affected the fiscal forecast more generally.
A natural way to think about migration policy is as a supply-side policy that affects the productive potential of the economy, primarily through changing the size and composition of the labour force. This then has downstream impacts on tax revenue and public spending for the fiscal forecast (discussed in Sections 5.4 and 5.5). Since March 2023, the OBR has taken a more transparent approach to including the supply-side impacts of policies on its economic forecast. This has included scoring the economic effects of free childcare, tax changes, public investments, and residential planning reforms. Following a review of how it scores these policies, a new criterion for the OBR to incorporate the estimated supply-side effects of a policy is its significance test, which requires that the policy must be expected to change potential output by at least 0.1% by the fifth year of the forecast (Office for Budget Responsibility, 2025a).
Box 5.3 shows that, in recent years, there have been several migration policy reforms that we would expect to have passed this significance test. Indeed, we would expect them to have had larger supply-side impacts than any other supply-side policy the OBR has scored in recent years. It is therefore very notable that no migration policy change has been scored as a supply-side policy change since late 2020.
Box 5.3 Supply-side effects of migration policy: illustrative examples
The Home Office publishes impact assessments laying out the expected effects of recent migration policies on net migration levels over five years. To get a sense of the potential magnitude of the associated supply-side impacts of those policies, we use a scenario published by the OBR in March 2024. This scenario involved net migration increasing by 200,000 per year (i.e. a cumulative 1 million increase over the five-year forecast horizon). The OBR estimated that this could increase GDP in the fifth year of the forecast by 1.5%.a We scale this figure to get an estimate of the supply-side impact of three different recent migration policies. These estimates, alongside the supply-side effect of the largest policy changes scored by the OBR in recent years, are shown in Figure 5.10.
Figure 5.10. Possible supply-side impacts of migration and non-migration policies
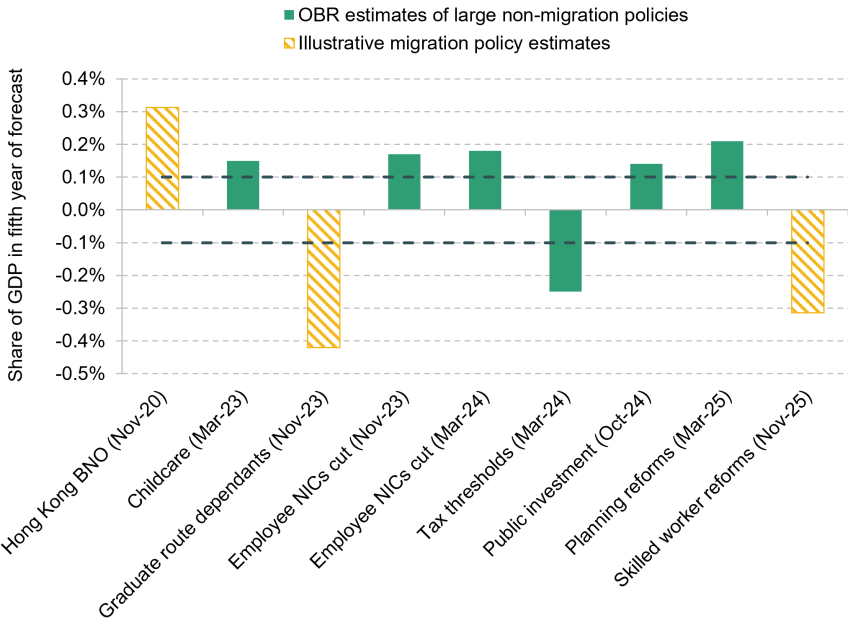
Note: The impact assessment for the Hong Kong BNO change only included estimates for immigration rather than net migration. Building on available survey evidence (https://www.gov.uk/government/publications/survey-of-hong-kong-british-national-overseas-visa-holders-2021/hong-kong-bno-survey-results-accessible-version#table-10---bno-visa-holders-intended-length-of-stay-in-the-uk and https://migrationobservatory.ox.ac.uk/resources/briefings/hong-kong-bnos-living-in-the-uk/), we assume that 90% stay over the five-year horizon. The dashed line shows the 0.1% of GDP significance threshold. This was not in place until late 2025, and the OBR scored many policies that were under the threshold before this.
Source: Office for Budget Responsibility (2025a) and authors’ calculations using various Home Office impact assessments and Office for Budget Responsibility (2024a).
The chart shows that recent migration policies could have had large supply-side effects, well above the OBR’s new significance threshold. Moreover, all three of the policies we consider here could have had supply-side effects larger than the impact of every other supply-side policy the OBR has scored in recent years. It is important to note that these figures are rough estimates and are unlikely to capture the true effect of any of these migration policies on potential output. As we discuss in Section 5.4, the impacts of migration policy changes will vary substantially depending on the people who are induced to immigrate (or not immigrate), which is not accounted for here. But this analysis still illustrates the potential magnitude of migration policy changes for the OBR’s economic forecast.
Importantly, we are not arguing that the OBR’s economic forecast was always incorrect by the magnitudes shown in Figure 5.10. As we have discussed throughout this section, it is possible that some anticipated impacts of policy announcements have in practice fed into the OBR’s migration forecast and therefore into the GDP forecast. But it is far from clear that policy announcements have always been fully accounted for. The magnitude of these supply-side effects is large enough that even missing part of the effect could have a meaningful impact on the economic and fiscal forecast.
a The exact impacts depend on the assumptions made: this estimated impact assumed there was no change in average UK productivity per hour worked from this change in migration. But the OBR also considered two other scenarios: if the UK’s capital stock remained constant, this would reduce productivity per hour, and the increase in GDP would only be 1.0%; if migrants instead had a much higher participation rate than the adult UK population, the increase would be 2.2%. In both of these two alternative scenarios, the policies we consider here would still have met the threshold for scoring supply-side policies.
Options for improvements to forecasting net migration
Measuring and forecasting net migration is very difficult: ONS projections and OBR forecasts have often been proven wrong. This is an inherent challenge, without an easy solution (Bijak, 2010). The OBR already does well to emphasise the inherent uncertainty in net migration forecasts, and scenarios that consider alternative paths, such as those included in the March 2024 EFO, are very welcome. As we have argued previously, uncertainty over the economic forecast, including from migration, is an important reason why the government should not design policy to meet its fiscal rules by a very small margin (Emmerson, Ridpath and Stockton, 2025).
The bigger concern with the OBR’s net migration forecast is how it responds to changes in policy: under the current approach, it is unclear to what extent policy has been accounted for in the fiscal forecast. This is in large part because the OBR’s forecast is anchored to the ONS’s projections, which may capture some of the impact of policy announcements, but to an unknowable extent.
The OBR has improved its forecasting methodology for net migration in the short term, and this is a welcome development. There would be value in the OBR going further and fully detaching its forecast from that of the ONS. This would allow the OBR to incorporate the impact of new policy into its migration forecast, and thus its forecast for growth and borrowing. To do this, the OBR could simply extend its existing short-term forecast, which includes relatively detailed analysis of stay rates of recent immigrants, to estimate levels of emigration and to incorporate several more years. The short-term forecast already accounts for different migration routes, so it would be relatively straightforward to account for route-specific policies.13 Alternatively, the OBR could lean more heavily on forecasts of future migration flows from departments such as the Home Office and scrutinise and adjust these, analogously to how it bases much of its forecast for welfare spending on forecasts from the Department for Work and Pensions. Another alternative would be to ask the ONS and its expert panel to produce a net migration forecast that explicitly does not take into account policy developments announced since the last fiscal event or any expectations of future policy.
Ideally, any method should result in a pre-measures baseline and a post-measures forecast that added the expected impact of policy announcements since the previous fiscal event. This would provide two benefits. First, it could help to improve the accuracy of the forecast going forward, given the potential importance of policy in driving changes in net migration. Second, it would ensure that the forecast clearly distinguished the role of policy changes from the role of other factors. This would give policymakers better information when designing policy changes in future, and would ensure that the impact of the government’s decisions on the economic and fiscal forecast could be better understood by broader audiences.
In other areas in which the OBR forecasts and estimates the impact of government policies, it usually bases its assessments on estimates produced by government departments, which it scrutinises and adjusts, rather than starting from scratch (Office for Budget Responsibility, 2023a). This might be harder with migration policy because it is not typically produced as part of the fiscal event cycle. But this is not insurmountable: the OBR has already incorporated other policy changes not made on this cycle, such as changes to planning regulations. In the case of migration, the Home Office already produces impact assessments of the effects of different policies on levels of net migration, so the OBR would be able to take a similar approach to generate a post-measures forecast. This would likely require the OBR to build a more established working relationship with the Home Office, as it has with the Department for Work and Pensions.
5.4 Forecasting the impact of net migration on revenues
Net migration can affect revenues from many taxes by changing the size and composition of the tax base, including through impacts on employment, earnings and taxable income. In this section, we examine how these effects are reflected in the OBR’s medium-term forecast. We argue that it does not always adequately capture important differences between new net migrants and the rest of the UK population, nor between different types of migrants. This is particularly important because revenues are the main channel through which migration affects borrowing and debt in the OBR’s forecast, with much of public spending assumed to remain unchanged, as discussed in Section 5.5.
The OBR’s current approach
The main route by which migration affects overall government revenues is through changes in tax revenues (a smaller impact runs through revenues from visa fees, discussed in Box 5.5 later).
The scenarios from the OBR’s March 2024 Economic and Fiscal Outlook report that we discussed in Section 5.3 illustrate how large the impact of migration on revenues can be: 200,000 higher net migration per year over five years can raise tax revenues by £17.5 billion in the final year of the forecast (in 2028–29 prices).14 Using these estimates, if the OBR continues to anchor its year-5 net migration forecast to the ONS’s long-term projection, the recent downgrade to the ONS long-run migration assumption could reduce forecast tax revenues by £1–5 billion in 2031–32, depending on how the OBR adjusts its net migration forecast over years 1 to 4 of the forecast.15
In general, including in the OBR’s illustrative scenario, the OBR models migrants as affecting tax revenues similarly to the average UK resident. For its labour market forecast, which feeds into revenue forecasts for income tax and National Insurance, the OBR assumes that migrants pay the same amount of tax as the average UK resident of the same age and sex (Rawlings, 2025).
The OBR has made additional adjustments in some of its forecasts. In March 2025, it accounted for new migrants’ slightly lower participation rates at any given age than the existing UK population (Rawlings, 2025). In March 2026, following ONS revisions that raised estimates of British emigration, the OBR adjusted its forecast to reflect that these additional emigrants were disproportionately young, had relatively high employment rates and earned less than the average UK adult (Office for Budget Responsibility, 2026a). More broadly, when discussing the potential impacts of migration on the public finances, the OBR has highlighted the importance of the composition and characteristics of migrants beyond age (e.g. Office for Budget Responsibility, 2024a).
However, there has not been a consistent and systematic adjustment to revenue estimates for the composition of new migrants. In the rest of this section, we discuss the importance of differences between different types of migrants, before setting out the case for the OBR changing the approach it takes for its labour market and tax forecasts.
Employment and earnings of different migrant groups
Migrants often differ from the UK-born population, even after accounting for age and sex, and may have different employment rates and earnings from otherwise comparable UK-born individuals. Part of the difference between immigrants and people born in the UK relates directly to the route they are on. Notably, employment is built into the work route through job-offer and salary requirements. By contrast, international students are limited to 20 hours of work a week during term time, while asylum seekers are generally not permitted to work while their claims are being considered.
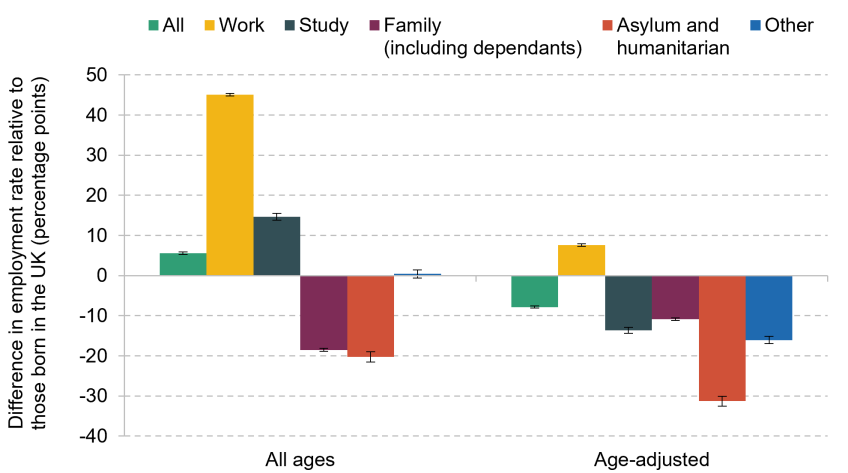
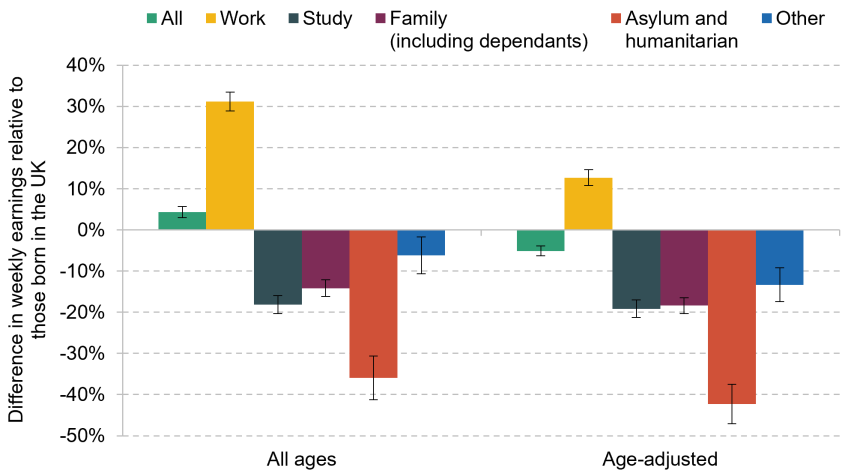
In Figure 5.11, we illustrate the magnitude of differences in employment rates and earnings, which would translate into first-order effects on tax revenues. The chart shows estimates of differences in labour market outcomes for recent non-UK-born immigrants, split by their self-reported reason for coming to the UK, compared with those born in the UK. This analysis uses data from the Labour Force Survey (LFS). These are the best data available to us for measuring heterogeneity by reason for coming to the UK, but have a number of important limitations, particularly since the COVID-19 pandemic. These are discussed in more detail in Box 5.4.
Figure 5.11. Labour market outcomes for recent non-UK-born immigrants relative to people born in the UK, 2021–25
Panel A. Employment rates (including self-employment)
Panel B. Weekly earnings conditional on working as an employee
Note: We define recent immigrants as those not born in the UK who arrived within five years of responding to the Labour Force Survey. Figures are averages for respondents over 2021–25. The groups of migrants (work, study, family, asylum/humanitarian, other) are based on self-reported reasons for initially coming to the UK rather than visa routes. We obtained the age-adjusted differences by regressing employment on routes, controlling for age-by-sex of the respondent fixed effects. Error bars show standard errors for the differences between means. See Box 5.4 for discussion of the challenges with the Labour Force Survey.
Source: Authors’ analysis of the Labour Force Survey.
Box 5.4. Caveats on using the Labour Force Survey
The Labour Force Survey (LFS) is the main UK household survey for measuring labour market outcomes, and is one of the few data sources that allows us to distinguish individuals by country of birth, time since arrival and reason for coming to the UK. This makes it useful for examining differences in employment, earnings and other characteristics across migrant groups. However, it is a survey rather than an administrative data source, and two caveats are particularly important for our purposes.
First, the quality of the LFS has been affected in recent years by lower response rates and changes in survey collection. These concerns became more acute during and after the COVID-19 pandemic, and were particularly prominent in 2023, when the ONS highlighted these issues. It may be that immigrants are particularly affected by these challenges, or that for other reasons the LFS is less representative for immigrants (e.g. if more immigrants – whether students or asylum seekers – live in communal accommodation). Analysis by the ONS suggests that non-UK-born residents are slightly under-represented in the LFS relative to the Census, but the gaps are not large (Office for National Statistics, 2026a). Second, the LFS does not directly observe immigration route or visa status in the same way as administrative Home Office data do. We use reported reason for coming to the UK as a proxy for route, but this is not identical to visa category and may be measured with error.
These caveats mean that the LFS is not the most appropriate source to produce precise fiscal estimates by route: new administrative data that link Home Office visa data to HMRC tax records is much better suited to this (Home Office, 2025b). The value of the LFS in this chapter is instead to illustrate the broad scale of heterogeneity in labour market outcomes across migrant groups. In the limited cases where it is possible to compare our LFS results with results from administrative data, though, we do find similar patterns by route.
Panel A of Figure 5.11 shows differences in employment rates (including self-employment) while Panel B shows differences in weekly earnings for those who are employees. Recent immigrants to the UK are more likely to be employed than the UK-born population, but this in large part reflects that migrants are more likely to be of working age (Figure 5.7). Once we adjust for differences in age and gender, recent immigrants are slightly less likely to be employed. Conditional on being employed, recent immigrants have slightly higher earnings than the UK-born population, while the relationship flips when we adjust for age and gender.16
But there are large differences by route: migrants who came to the UK for work are much more likely to be employed and have higher weekly average earnings than the UK-born population, while dependants and those seeking asylum or on other routes are all less likely to be employed and have lower average earnings than those born in the UK, even compared with those of the same age and sex.17 Students are more likely to work than the average UK-born individual, but this is mostly because they are young: once we account for age, they are substantially less likely to be employed.
In this analysis, we have focused on the mean differences between groups of recent immigrants and the UK-born population. But there are also likely to be large differences within some groups of migrants. For example, Advani et al. (2025) have estimated that immigrants are over-represented at the top of the income distribution, though their analysis includes both recent and non-recent immigrants. They estimate that around 25% of those in the top 1% of incomes were immigrants in 2018, as were 40% of those in the top 0.01%. Any policy that attracted significantly more of these very-high-income migrants would therefore be likely to have an outsized positive effect on the public finances per person.18
Box 5.5 Immigration-related fees
The government also raises immigration-related revenues, from visa application fees, the immigration health surcharge (fees paid by migrants to use the NHS) and charges paid by employers sponsoring workers. Although these revenues are much smaller than general tax revenues, immigration-related fees are an important area of migration policy.
In 2025–26, the Home Office raised £6.9 billion from visa and passport fees, the immigration health surcharge and sponsor-related charges. This exceeded the £2.0 billion cost of processing visa and passport applications, leading to net revenue of £4.9 billion.a Because such fees are explicitly route-specific, this is one of the clearest cases where the revenue effect of migration depends directly on immigration route.
The OBR produces forecasts for visa fee income, the health surcharge and the immigration skills charge.b Unlike changes in the levels of net migration, the OBR has recently scored government policies that affect these revenues using the government’s costings. For example, in the 2025 Autumn Budget it accounted for the increase in the immigration skills charge (raising around £800 million over five years), and at the 2023 Autumn Statement it accounted for changes in visa fees and the health surcharge (raising around £6.5 billion over five years).
a Source: Home Office Supplementary Estimates 2025–26 Tables A and B, available at https://committees.parliament.uk/committee/83/home-affairs-committee/publications/10/estimate-memoranda/.
b The OBR treats visa fees as government revenue. This is different from HM Treasury, which treats visa fees as part of departmental spending plans, and so will give the Home Office a lower budget than it expects to spend, with the gap covered by the forecast visa fees. This means that changes in visa fees could affect government public spending decisions in ways that are reported differently by HM Treasury and the OBR.
Given the large differences in (age-adjusted) employment and earnings of migrants by visa route, an OBR forecast that captures migration mainly through population size and age–sex structure may miss important compositional effects. Age is important, because migrants are more likely than the resident population to be of working age. But route composition is also relevant to consider for income tax revenues. A shift from migrants on work-related routes to student or humanitarian routes, for example, could therefore reduce expected income tax receipts even if overall net migration were unchanged. Conversely, a shift towards migrants on work-related routes could raise receipts by more than implied by a forecast based mainly on age and sex.
An example illustrates the potential magnitude of such effects. Consider a scenario where changes in policy or applicant behaviour increased the share of non-British immigrants coming to the UK specifically to work by 10 percentage points and reduced the share coming to study by 10 percentage points in a year. Given current levels of immigration, our LFS estimates suggest that this change could increase total employment by around 20,000, despite there being no changes in the aggregate level of net migration. For comparison, the OBR has previously scored policy changes that it judges to have smaller impacts on labour supply, such as reforms to the Work Capability Assessments (increasing employment by 10,000), expansion of talking therapies (also 10,000) and the Restart work support scheme (5,000) (Office for Budget Responsibility, 2023b). It is worth noting, though, that this hypothetical change in immigrant composition would now be under the 0.1% of GDP threshold for scoring supply-side policies (discussed in Section 5.3). This change in immigration composition would likely increase average and total earnings of new immigrants substantially, increasing income tax revenues.
Options for improving the OBR’s forecasting approach
The OBR could continue to make ad hoc adjustments for forecast revenue effects when there are material changes in the composition of migration. As the example above shows, some changes in composition may not be large enough for it to be worth the OBR making an adjustment every time. But this is not without risks: that an important compositional change is missed; that it is more work to consider and make ad hoc adjustments each time; or that it increases the scope for government to lobby (or not lobby) about changes to composition.
An alternative approach would be to build a more systematic adjustment into the forecasting process. The simplest of these would come from more explicitly distinguishing between immigration and emigration. Given the large differences between immigrants depending on their reasons for moving to the UK, there is a clear case for also distinguishing between different visa routes in the forecast. One simple implementation of this might entail a split between those immigrating for work, for study, as family or dependants, for asylum or for other reasons.
This would require producing forecasts of migration levels by broad route. This could build on the existing work the OBR has done producing a stay-rate model for short-term migration flows, as this already requires distinguishing between different routes. The OBR could then account for differences by route in employment and other factors in its economy and revenue forecasts. New data linkages between visa information and HMRC tax records would enable past differences in employment rates and earnings to be more precisely estimated and then incorporated into the forecast than can be done in the Labour Force Survey (Home Office, 2025b). Moreover, other parts of government have already tried to account for differences in migrants’ effects on tax revenues and the public finances, particularly in Home Office impact assessments, which the OBR could build on.
5.5 Forecasting the impact of net migration on spending
Net migration has significant implications for public spending. Higher net migration means a higher population, which we would expect to increase demand on public services. Many immigrants also work for public services, and there are also some areas of spending that are specifically linked to immigration, such as asylum services. Net migration may also affect benefit spending (including the state pension),19 as some immigrants are eligible to receive benefits in the short run and most emigrants are eligible before their departure. In this section, we examine how the OBR accounts for the impacts of migration on public spending.
Public services
Changes in net migration will likely impact the delivery of public services. On the demand side, many immigrants will use services such as education and the NHS. Many emigrants would have used these services before they left the UK, and cease doing so after they leave the country. Demand for other activities of the public sector, such as the work of the civil service, may be less responsive to the size of the population and therefore changes in migration. On the supply side, many immigrants work for public services and many emigrants would have previously worked for public services. This could affect the cost of providing public services. For example, international recruitment to health and social care may help the government to fill vacancies without having to increase wages by as much. As with tax revenues, there are likely to be large differences between different types of migrants: differences in the age and health of migrants will matter, while some immigration routes have an outsized impact on specific sectors, such as international students or those on health and social care visas.
The government sets fixed cash budgets both for total government departmental spending and for specific government departments – i.e. budgets that do not vary with the inflation rate or with the number of people using services. Departmental budgets cover spending on public services such as health, education and defence, as well as specific areas of spending linked to immigration, particularly asylum services. These budgets are typically set for several years in advance at Spending Reviews and will take into account factors such as population forecasts. There is also a cross-government Reserve, intended for use if unexpected spending pressures arise.
Because departmental budgets are fixed in advance, the impacts of changes in net migration (relative to expectations of net migration when budgets were originally set) depend on how policymakers respond.20 For example, higher net migration could increase the pressure on public services, and the default (with unchanged departmental budgets) is that service quality will be allowed to fall. Alternatively, the government may decide to increase budgets to hold service quality constant.21
Given that the government has set out departmental budgets, and that the OBR is required to produce forecasts based on stated government policy, the OBR has historically always taken the size of these budgets as given. That means changes in net migration, or any other changes in the size and mix of the population, will typically have no direct effect on the OBR’s forecasts for spending on public services. In other words, the OBR is required to make an assumption about how the government will respond to changes in net migration: it will allow service quality to change rather than budgets to change. This is also true for other factors, such as changes in inflation that would change the real-terms generosity of spending plans relative to what was originally planned. This is something the OBR has itself frequently discussed the consequences of in Economic and Fiscal Outlook reports.
There are very good reasons for the OBR to take departmental budgets as fixed, and we do not propose that it deviates from this assumption in general. However, it is notable that the government itself sometimes makes a different assumption: in Home Office impact assessments of migration changes, changes in public service spending are often included in the estimated net present social value, even for years already covered by Spending Review plans.22
If the government did decide to increase public service spending in response to higher net migration, this would mean the OBR’s forecast overstates how much higher net migration might be expected to reduce borrowing in the medium term. The OBR highlighted this in the March 2024 scenario that we discussed in Section 5.3. It estimated that an increase in net migration of 200,000 per year (so a 1 million increase in total population over five years) would increase day-to-day public service spending by around £6 billion in the fifth year of the forecast if the government instead maintained the age-adjusted per-person generosity of public service budgets (in 2028–29 terms) rather than holding them fixed. That is equivalent to £6,000 of additional departmental spending per new immigrant per year. This would reduce the estimated fiscal benefits of higher net migration, though they would still be positive in this scenario, as this is only a third of the £18 billion positive impact on tax revenues discussed in Section 5.4. It is worth noting though that this scenario only captures the direct effect of higher migration on demand for public services, assuming that immigrants put the same spending pressure on public services as British-born people of the same age, and does not take into account any of the potential effects of immigrants working for public services.
Since 2024, the OBR has had more power to scrutinise the feasibility of departmental spending plans (HM Treasury, 2024). The OBR has historically forecast that the government will slightly underspend relative to its spending plans, but it can now say whether it expects the government to need to deviate from the spending plans it has set out – for example, because the government has in recent years persistently overspent its budgets in a given area. The OBR can therefore now adjust the assumption in its fiscal forecast for how much actual spending may be above or below stated plans. In November 2025, the OBR substantially reduced the amount it expected the government to underspend on plans between 2026–27 and 2028–29 (Office for Budget Responsibility, 2025c). One of the reasons it listed for this change in expected spending was a risk that spending on asylum accommodation may not fall as fast as the government had planned, given recent data on rising numbers of small-boat arrivals and asylum seekers.
If there were a large increase in migration or expectations for future migration relative to the level assumed when spending plans were set, such as that we saw after the 2021 Spending Review, it would not be unreasonable for the OBR to use these new powers to forecast that the government could overspend by more, or underspend by less, than total allocated levels of departmental spending. This is similar to how the OBR has in the past considered the pressures from large changes in inflation relative to when spending plans were made.
We have previously recommended that the government should state clearly the assumptions it uses when setting multi-year spending plans (Boileau, Warner and Zaranko, 2024). This could include the demographic assumptions that spending plans are based on, which could help the OBR decide whether an adjustment is needed. Alternatively, the government could be more explicit about how it plans to change public service spending in response to changes in migration policy, which the OBR could then account for.
Benefit spending
Most new immigrants will initially have no access to the benefits system. Most of them only have temporary permission to live in the UK – i.e. those on a time-limited visa, rather than those with Indefinite Leave to Remain – and most people with this status have no recourse to public funds (NRPF). This means that they are ineligible to claim most benefits, including universal credit, disability benefits, housing benefit and child benefit (Home Office, 2025d). It typically requires at least five years in the UK to be eligible for Indefinite Leave to Remain, and so for most new immigrants there will be no impact on benefit spending over the OBR’s medium-term forecast horizon. This is an area where the longer-term impacts of migration could be very different as and when immigrants gain Indefinite Leave to Remain.
However, that does not mean there will be no impact of migration on benefit spending over a five-year horizon. Some groups of immigrants do gain access to the benefits system earlier, either immediately on arrival or after a shorter time. This includes those who have been granted asylum and those who already have EU settled status, as well as Irish and British nationals moving to the UK. Those with EU settled status and Irish and British nationals together made up around 20% of all immigrants in 2025. Asylum seekers made up another 6%, though a large share of these will not go on to be granted asylum and so will not gain access to the benefits system. Together, a non-negligible share of immigrants are therefore still eligible for benefits immediately or shortly after arriving in the UK.23
A much higher proportion of emigrants are likely to have had access to the benefits system than the proportion of immigrants who arrive. This is because all British emigrants (around 40% of total emigration in recent years), as well as many non-British emigrants who had been granted Indefinite Leave to Remain or had EU settled status, would not have been affected by NRPF when they left. This means an increase in net migration coming from higher immigration might be expected to increase benefit receipt by less than the same increase if it came from lower emigration.
Even among immigrants and emigrants who can potentially access the benefits system, we would expect different groups to have different likelihoods of actually claiming benefits compared with British nationals. For example, as Figure 5.11 shows, those who moved to the UK for work are more likely to be employed than natives, while those who moved with family are much less likely to be employed, which might spill over to higher benefit claims among dependants. Similarly, emigrants may vary a lot in their propensity to claim benefits, though data on emigrants is not good enough to easily estimate this.
Spending on benefits is planned differently from public service spending: total spending depends on how many people are eligible and apply for benefits rather than on fixed budgets. The OBR therefore produces forecasts for total benefit spending, building on forecasts by the Department for Work and Pensions. These are based on factors from the OBR’s economy forecast, including population, earnings and unemployment (Office for Budget Responsibility, 2026a). Given the complex link between migration and welfare spending over the medium term, the extent to which net migration will feed through into the OBR’s forecast of welfare spending depends heavily on the OBR’s treatment of different groups that make up the change in net migration.24 The extent to which the OBR currently adjusts its forecast of benefit spending depending on the make-up of a change to net migration is unclear.
The OBR says that it accounts for NRPF in its benefit spending forecasts to some degree, and that it adjusts its forecast of who will have NRPF according to forecast levels of net migration and for the number of past immigrants who will gain eligibility for benefits in future.
However, given that a reasonable share of immigrants (and an even larger share of emigrants) do have recourse to public funds, there may be value in the OBR differentiating between different components of net migration and their different impacts on benefit spending. As with heterogeneity by tax revenues, this could build on forecasts of net migration across routes that already exist across government departments. Using this split would enable the OBR to capture more readily the effects of net migration on benefit spending, though as with tax revenues, such changes may only be material in some cases.
5.6 Conclusion
Recent changes in levels of net migration, and large changes in immigration policy, have highlighted the importance of migration for the public finances, the economy and society more broadly. In this chapter, we have focused on how the OBR accounts for migration and migration policy in its medium-term fiscal forecast. Despite this focus, it should be emphasised that, as in other areas of policy, the effect of any policy change on the government’s performance against the fiscal rules should not be the main lens through which a policy is viewed. Even when focusing more narrowly on fiscal impacts, there are things the OBR forecast will not, and should not be expected to, capture. This includes not just the long-run fiscal impacts, but some of the impacts on public spending, where the impact of migration may be to increase strain on public services rather than to increase spending.
However, as it stands, there is a strong case that the effects of changes to migration policy are not fully and transparently captured in the OBR’s forecast. This is problematic for two separate reasons.
First, it could damage accuracy of the fiscal forecast: recent years have seen net migration tick sharply upwards and then sharply downwards again, with much of that shift resulting from policy changes. The ability to capture this is particularly important when governments decide to operate with just a fine margin against their fiscal rules, meaning that even small changes to the OBR’s forecast can influence wider tax and spending decisions.
Second, there is value – for both public and policymaker understanding – in clearly distinguishing the impacts of policy decisions from the impacts of other changes to migration, as is done in other areas of policy. We therefore recommend that the OBR continues the improvements it has made in recent years and moves to producing its net migration forecast entirely separately from the ONS long-run population projections. It should ideally then make pre- and post-measures forecasts that explicitly account for policy announcements since the last fiscal event. Migration policy is one of the most important levers the government has to influence the supply side of the economy, and it is important that the OBR fully accounts for this, as it does for other levers.
The OBR’s forecast also tends to treat different types of migrants as having very similar impacts on the public finances. This may not always make a material difference to the forecast, but there is a case to be more systematic in the approach. We recommend that the OBR considers producing forecasts for migration by broad route, and then makes some broad adjustments for these different groups in its fiscal forecasts – such as accounting for differences in employment rates and access to the benefits system. This would ensure that changes in policy or other factors that dramatically change the composition of migration would be automatically reflected in the forecast. Whether the OBR should make such changes depends in part on the administrative costs of doing so, though much of the required data and modelling already exist elsewhere in government. While we only focused on migration in this chapter, there may well be other aspects of the OBR’s forecast that should be a higher priority for improvements first.
Regardless of whether these recommendations are taken up, migration will continue to be an important part of the fiscal forecast. The ONS has recently downgraded its estimate of long-run net migration from 340,000 to 230,000 per year. If the OBR continues to anchor its net migration forecast to the ONS projection, this could result in a 60,000 per year reduction in net migration in its forecast at the Autumn Budget (following the 50,000 per year downgrade at the Spring Forecast). Under the OBR’s current approach, the Chancellor could be facing an increase in forecast borrowing of £1–5 billion in the fifth year of the forecast from this change, with the total effect depending on whether and how the OBR adjusts its forecast in the earlier years. This could make a big difference for the Chancellor’s margin against the fiscal rules, and play a role in shaping the government’s fiscal strategy.
References
Advani, A., Koenig, F., Pessina, L. and Summers, A., 2025. Immigration and the top 1 percent. Review of Economics and Statistics, 107(4), 1123–35, https://direct.mit.edu/rest/article-abstract/107/4/1123/119493/Immigration-and-the-Top-1-Percent?redirectedFrom=fulltext
Aristotelous, G., Smith, P. W. F. and Bijak, J., 2023. QuantMig Migration Estimates Explorer. https://www.quantmig.eu/data_and_estimates/estimates_explorer/
Bell, B., Fasani, F. and Machin, S., 2013. Crime and immigration: evidence from large immigrant waves. Review of Economics and Statistics, 95(4), 1278–90, https://direct.mit.edu/rest/article/95/4/1278/58317/Crime-and-Immigration-Evidence-from-Large
Bijak, J., 2010. Forecasting International Migration in Europe: A Bayesian View. Springer. https://books.google.co.uk/books?hl=it&lr=&id=XGiApQtIt2QC&oi=fnd&pg=PR7&dq=bijak+2010+migration&ots=08BMSrLTJ4&sig=t-LEoeXGuVRcw5aG1XcmeeTN5XA&redir_esc=y#v=onepage&q&f=false
Billari, F. C., 2022. Demography: fast and slow. Population and Development Review, 48(1), 9–30, https://onlinelibrary.wiley.com/doi/10.1111/padr.12464
Boileau, B., Warner, M. and Zaranko, B., 2024. Options for the 2024 Spending Review and beyond. IFS report, https://ifs.org.uk/publications/options-2024-spending-review-and-beyond
Czaika, M., Bijak, J. and Prike, T., 2021. Migration decision-making and its key dimensions. QuantMig, https://www.quantmig.eu/res/files/QuantMig_D1.3_v1.2.pdf
Dustmann, C. and Frattini, T., 2014. The fiscal effects of immigration to the UK. Economic Journal, 124(580), F593–643, https://academic.oup.com/ej/article-abstract/124/580/F593/5076967?redirectedFrom=fulltext
Dustmann, C., Frattini, T. and Preston, I. P., 2013. The effect of immigration along the distribution of wages. Review of Economic Studies, 80(1), 145–73, https://academic.oup.com/restud/article-abstract/80/1/145/1596869?redirectedFrom=fulltext
Emmerson, C., Ridpath, N. and Stockton, I., 2025. Risks and challenges for the public finances. IFS report, https://ifs.org.uk/publications/risks-and-challenges-public-finances
Hall, T., Manning, A. and Sumption, M., 2023. Projecting UK net migration. Centre for Economic Performance, Occasional Paper 60, https://cep.lse.ac.uk/_NEW/publications/abstract.asp?index=10474
HM Treasury, 2024. Government response to the OBR review of the March 2024 forecast for departmental expenditure limits (DEL). CP 1187, https://assets.publishing.service.gov.uk/media/672215794da1c0d41942a95d/OBR_review_response_WEB.pdf
HM Treasury, 2026. Charter for Budget Responsibility Autumn 2025. https://assets.publishing.service.gov.uk/media/699c2194d2b9c6ec5b6fbb7d/260220_-_Updated_Charter_-_February_2026.pdf.
Home Office, 2020. Hong Kong British National (Overseas) visa: impact assessment. HO0381, https://www.legislation.gov.uk/ukia/2020/70/pdfs/ukia_20200070_en.pdf
Home Office, 2023. 2023 changes to the student route and consequential changes to work routes: impact assessment. HO IA 0451, https://assets.publishing.service.gov.uk/media/66f13f3376558d051527abbc/Annex+F+20230713+Student+Route+2023+Changes+-+Impact+Assessment.pdf
Home Office, 2024. Migrant journey: 2023 report. https://www.gov.uk/government/statistics/migrant-journey-2023-report/migrant-journey-2023-report
Home Office, 2025a. Migrant journey: 2024 report. https://www.gov.uk/government/statistics/migrant-journey-2024-report/migrant-journey-2024-report
Home Office, 2025b. Sponsored Work and Family visa earnings, employment and income tax. https://www.gov.uk/government/publications/sponsored-work-and-family-visa-earnings-employment-and-income-tax/sponsored-work-and-family-visa-earnings-employment-and-income-tax
Home Office, 2025c. Spring 2025 Immigration Rules impact assessment (Skilled Worker and Care Worker) – July 2025. HO IA 1017, https://assets.publishing.service.gov.uk/media/6937e67eb612700b2cb73679/Spring_2025_Immigration_Rules_Impact_Assessment__Skilled_Worker_and_Care_Worker___003_.pdf
Home Office, 2025d. Public funds: migrant access to public funds, including social housing and homelessness assistance, and social care. https://assets.publishing.service.gov.uk/media/67e29cb074e40de685195b28/Public+funds.pdf
Home Office, 2026a. Supplementary Estimates memorandum for the Home Office (2025–26). https://committees.parliament.uk/publications/51588/documents/285971/default/
Home Office, 2026b. Migrant journey: 2025 report. https://www.gov.uk/government/statistics/migrant-journey-2025-report/migrant-journey-2025-report
Home Office, 2026c. How many small boat arrivals have claimed asylum or been referred to the National Referral Mechanism? https://www.gov.uk/government/statistics/immigration-system-statistics-year-ending-march-2026/how-many-small-boat-arrivals-have-claimed-asylum-or-been-referred-to-the-national-referral-mechanism
Johnson, P., 2023. Opening remarks. Spring Budget 2023: IFS analysis. Institute for Fiscal Studies, https://ifs.org.uk/sites/default/files/2023-03/Opening-remarks-new.pdf
Letki, N., 2008. Does diversity erode social cohesion? Social capital and race in British neighbourhoods. Political Studies, 56(1), 99–126, https://journals.sagepub.com/doi/10.1111/j.1467-9248.2007.00692.x
Migration Advisory Committee, 2025. The fiscal impact of immigration: static and dynamic estimates for the UK. https://assets.publishing.service.gov.uk/media/6938108633c7ace9c4a41e42/The_Fiscal_Impact_of_Immigration_Final__1_.pdf
Office for Budget Responsibility, 2020. Economic and fiscal outlook – March 2020. https://obr.uk/efo/economic-and-fiscal-outlook-march-2020/
Office for Budget Responsibility, 2023a. Memorandum of understanding between the Office for Budget Responsibility, HM Treasury, the Department for Work & Pensions, and HM Revenue & Customs: November 2023 update. https://obr.uk/docs/dlm_uploads/MoU_2023_update_WebVersion.pdf
Office for Budget Responsibility, 2023b. Economic and fiscal outlook – November 2023. https://obr.uk/efo/economic-and-fiscal-outlook-november-2023/
Office for Budget Responsibility, 2024a. Economic and fiscal outlook – March 2024. https://obr.uk/efo/economic-and-fiscal-outlook-march-2024/
Office for Budget Responsibility, 2024b. Fiscal risks and sustainability – September 2024. https://obr.uk/frs/fiscal-risks-and-sustainability-september-2024/
Office for Budget Responsibility, 2025a. Accounting for the supply-side effects of policy. Briefing Paper 10, https://obr.uk/docs/dlm_uploads/Briefing_paper_No.10_Accounting_for_the_supply-side_effects_of_policy.pdf
Office for Budget Responsibility, 2025b. Economic and fiscal outlook – March 2025. https://obr.uk/efo/economic-and-fiscal-outlook-march-2025/
Office for Budget Responsibility, 2025c. Economic and fiscal outlook – November 2025. https://obr.uk/efo/economic-and-fiscal-outlook-november-2025/
Office for Budget Responsibility, 2026a. Economic and fiscal outlook – March 2026. https://obr.uk/efo/economic-and-fiscal-outlook-march-2026/
Office for Budget Responsibility, 2026b. Fiscal risks and sustainability – July 2026. https://obr.uk/frs/fiscal-risks-and-sustainability-july-2026/
Office for Budget Responsibility, 2026c. Forecasting net migration. https://articles.obr.uk/forecasting-net-migration/index.html
Office for National Statistics, 2025a. Comparing national population projections to estimates report. https://www.ons.gov.uk/peoplepopulationandcommunity/populationandmigration/populationprojections/methodologies/comparingnationalpopulationprojectionstoestimatesreport
Office for National Statistics, 2025b. Office for National Statistics follow-up correspondence to the Lords Economic Affairs Committees inquiry on Preparing for an Ageing Society. https://uksa.statisticsauthority.gov.uk/submission/office-for-national-statistics-follow-up-correspondence-to-the-lords-economic-affairs-committees-inquiry-preparing-for-an-ageing-society/
Office for National Statistics, 2025c. National population projections: 2022-based. https://www.ons.gov.uk/peoplepopulationandcommunity/populationandmigration/populationprojections/bulletins/nationalpopulationprojections/2022based
Office for National Statistics, 2026a. Labour Force Survey quality update: April 2026. https://www.ons.gov.uk/employmentandlabourmarket/peopleinwork/employmentandemployeetypes/articles/labourforcesurveyqualityupdate/april2026
Office for National Statistics, 2026b. Long-term international migration, provisional: year ending December 2025. https://www.ons.gov.uk/peoplepopulationandcommunity/populationandmigration/internationalmigration/bulletins/longterminternationalmigrationprovisional/yearendingdecember2025
Office for National Statistics, 2026c. National population projections: 2024-based. https://www.ons.gov.uk/peoplepopulationandcommunity/populationandmigration/populationprojections/bulletins/nationalpopulationprojections/2024based
Office for National Statistics, 2026d. Long-term international immigration, emigration and net migration flows, provisional. https://www.ons.gov.uk/peoplepopulationandcommunity/populationandmigration/internationalmigration/datasets/longterminternationalimmigrationemigrationandnetmigrationflowsprovisional
Office for National Statistics, 2026e. National population projections, migration assumptions: 2024-based. https://www.ons.gov.uk/peoplepopulationandcommunity/populationandmigration/populationprojections/methodologies/nationalpopulationprojectionsmigrationassumptions2024based
Ottaviano, G. I. P., Peri, G. and Wright, G. C., 2018. Immigration, trade and productivity in services: evidence from U.K. firms. Journal of International Economics, 112, 88–108, https://www.sciencedirect.com/science/article/abs/pii/S0022199618300254?via%3Dihub
Rawlings, J., 2025. Forecasting participation trends: the cohort model. Office for Budget Responsibility, https://articles.obr.uk/forecasting-participation-trends-the-cohort-model/
Ridpath, N., 2026. The Spring Forecast in perspective: part 1. IFS, https://ifs.org.uk/sites/default/files/2026-03/The%20Spring%20Forecast%20in%20perspective%20%5Bslides%20for%20web%20-%20updated%5D.pdf
Shaw, C., 2007. Fifty years of United Kingdom national population projections: how accurate have they been? Population Trends, 128, 8–23, https://pubmed.ncbi.nlm.nih.gov/17691537/
Vargas-Silva, C., Sumption, M. and Brindle, B., 2026. The labour market effects of immigration. Migration Observatory, https://migrationobservatory.ox.ac.uk/resources/briefings/the-labour-market-effects-of-immigration/
Data
Office for National Statistics. (2024). Labour Force Survey. [data series]. 11th Release. UK Data Service. SN: 2000026, DOI: https://datacatalogue.ukdataservice.ac.uk/series/series/2000026#doi
Acknowledgements
This chapter has benefited greatly from comments and discussions with IFS colleagues Bee Boileau, Jonathan Cribb, Eduin Latimer, Helen Miller, Kate Ogden, Matthew Oulton, Isabel Stockton, Tom Waters and Ben Zaranko, as well as Jakub Bijak at the University of Oxford and civil servants at the Office for Budget Responsibility and across government. All errors and recommendations are those of the authors alone.
The 2026 edition of the IFS Green Budget is funded by the Nuffield Foundation, Barclays and the Economic and Social Research Council (ESRC) through the Centre for Microeconomic Analysis of Public Policy (CPP). IFS is an independent Research Institute. As with all pieces of work, IFS has full editorial control over its analysis and conclusions. In addition to providing funding, Barclays authors will write chapters for the 2026 Green Budget, covering topics (the macroeconomic outlook and bond markets) where their expertise complements that of IFS.
Endnotes
Authors

Nick Ridpath
Nick joined the IFS in 2023 and works in the Education and Skills sector, focusing on the long-run impacts of education policy.

Luca Rizzotti
Luca joined IFS in 2025 as a Research Economist and works in the Justice sector. He received his PhD in economics from Brown University in May 2025.

Max Warner
Max joined the IFS in 2020. His work covers health and social care, public spending and public sector productivity.
More from IFS
Understand this issue


Policy analysis


Academic research


