
Downloads
Download the report here
PDF | 533.59 KB
Executive summary
The recent surge in inflation, driven by spectacular increases in energy prices, has driven sharp falls in household living standards, huge government intervention to try to mitigate it, and serious policy headaches. As such it continues to be the backdrop behind many of the most pressing issues that will face Chancellor Hunt when he delivers his first Budget on 15 March. This short report analyses the latest outlook for inflation, how this varies across households and is impacted by the government’s interventions on consumer energy prices, and the resulting effects on real earnings and benefit levels.
Key findings
- High inflation has hit lower-income households hardest, mostly because of the sharp increases in gas and electricity prices. As a share of total spending, the lowest-income households are almost three times as exposed to energy costs as the highest-income households.
- The Energy Price Guarantee (EPG) is planned to rise from £2,500 to £3,000 per year for a typical household in April. In addition, the last instalment of the £400 reduction from energy bills is set to be paid in March.
- On the other hand, the most recent forecasts suggest that consumer energy prices are set to fall below the EPG level from this summer. If this happens then the impact of raising the EPG level on energy bills will last only a few months – months in which the seasonal drop in energy use will considerably soften the budgetary impact for households. Nevertheless, taking financial years as a whole, in 2023–24 energy bills net of publicly funded discounts are on average expected to be about £380, or 20%, higher than in 2022–23; and about £1,083, or 88%, higher than in 2021–22.
- Another key cost increase for some households, not incorporated in headline inflation measures, will be rises in mortgage rates. This will mostly affect better-off households: around one-half of the highest-income fifth, and one-third of the middle-income fifth, have a mortgage. Across all households with a mortgage, we estimate that an increase in mortgage rates from 2% (the typical 2021–22 rate) to 5.8% (in line with Bank Rate increases since 2021–22) would on average reduce incomes after mortgage payments by 7.5%. This rises to 10% for those aged under 45, who tend to have larger outstanding mortgages. Due to the prevalence of fixed-rate mortgages, this is a cost shock that will be rolled out gradually, but around 1.4 million households will come to the end of a fixed-rate deal during 2023. For those that do, the resulting impact on disposable incomes can, as the numbers above attest, be of a similar magnitude to the impact of inflation in all other (non-housing) items over the past year.
- The cost of living crisis shows up starkly in real earnings levels. Perhaps surprisingly, real mean earnings had actually grown by 6–7% between December 2019 (just before the pandemic) and March 2022 – something of a pickup from the paltry 2–3% of the preceding 27 months. But the sharp increase in inflation after Russia’s invasion of Ukraine caused real earnings to plummet. Taking the three years since the beginning of the pandemic as a whole (December 2019 to December 2022), average real earnings have grown by just 1–2%. That lack of significant real earnings growth is seen across the earnings distribution.
- Looking ahead, the Bank of England forecasts that average real earnings will fall in the coming financial year. The freezing of tax thresholds will further push down take-home pay. Median net-of-tax earnings are expected to be 2.5% lower in April 2023 than in April 2022, and 1.7% lower than in April 2019, before the pandemic.
- Comparing the coming year (2023–24) with this one (2022–23), it is likely that we will see some pay compression, as the National Living Wage is set to rise slightly in real terms. Combined with the fact that benefits will likely be slightly higher in real terms in 2023–24 than in 2022–23 – after rising by 10% in April – this means that households on low wages will, on average, not see the substantial further falls in real incomes during 2023–24 that many higher-income households are likely to see.
- However, for benefit recipients the bigger picture is that the April 2023 annual uprating of benefits will merely take them back to around the real level they were at a year earlier. It will not address the shortfall that opened up between September 2021 and April 2022 due to the deficient (lagged) way in which benefits are uprated. That ground will only be regained some time after inflation returns to the level it was at before Autumn 2021. Compared with their pre-pandemic (2019Q2) levels, real benefit rates were 7.6% lower in 2022Q2, and will be 6.2% lower in 2023Q2 and still 2.0% lower in 2024Q2. Astonishingly, it is not until April 2025 that benefit rates are set to recover the ground they lost over the autumn and winter of 2021 due to lags in uprating them with inflation.
- The fact that benefits, despite being price-indexed, have not kept pace with inflation during this crisis is the backdrop behind the additional cost of living payments made available to benefit recipients during 2023–24 to try to plug the gap. Overall, these payments actually result in the government spending around £2 billion more on recipients of means-tested or disability benefits in 2023–24 than it would have needed to simply raise ordinary benefits in line with current inflation.
- Childless families with no one in paid work and on universal credit and entitled to no other additions (e.g. health-related additions) tend to do especially well out of the crude, flat-rate arrangement. Because their ‘ordinary’ benefit entitlement is relatively low, those entitlements will only have had around £200 of their value eroded by inflation since 2019–20, yet they will receive the full £900 in cost of living payments in 2023–24. On the other hand, almost half of all families with three or more children on means-tested benefits would have been better off if the government had not introduced cost of living payments, but had instead just ensured that normal benefits kept pace with inflation. Having someone in receipt of a disability benefit, or having someone in paid work, are also characteristics that make benefit-receiving households less likely to have been adequately compensated for the lack of timely uprating by the flat-rate cost of living payments.
- These crudely targeted cost of living payments also create ‘cliff edges’ in the system. Receipt of each of the three £300 instalments of the payment will be contingent on having been a universal credit recipient in a specific prior month. We estimate that, as a result, in each of the three relevant months there will be around 825,000 people who earn slightly more than is consistent with universal credit eligibility and who, as a result of missing out on the cost of living payment, end up with less income than other similar people who earn less. Equivalently, they could increase their own income were their earnings to be slightly lower.
1. The cost of living crisis
The last two years have been marked by a period of rapidly rising inflation. As shown in Figure 1, the Bank of England forecasts that the rate of CPI inflation has now peaked, and the rate of price increase will fall over the next year until it is below the target rate of 2% by the second quarter of 2024. The peak was six months later and nearly 4 percentage points higher than the Bank of England forecast in February 2022, before Russia’s invasion of Ukraine.
Figure 1. CPI inflation over time
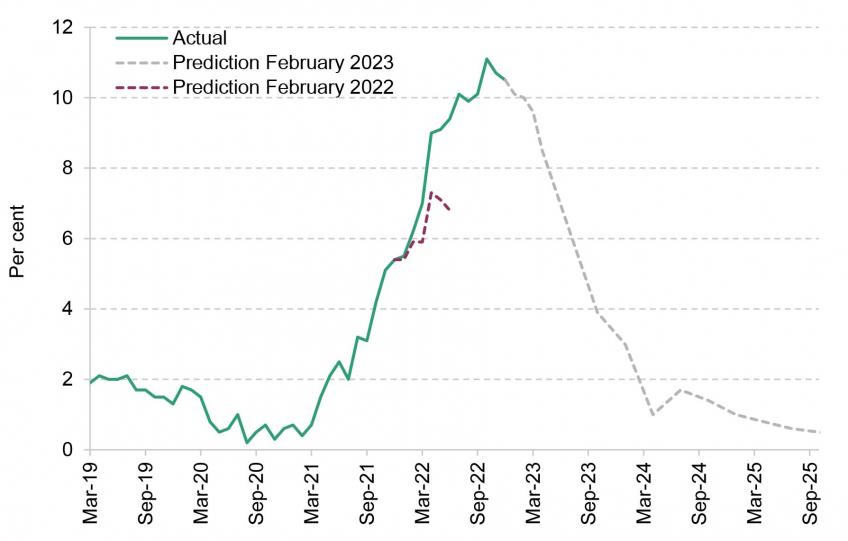
Source: ONS (actual); Bank of England February 2022 and 2023 Monetary Policy Reports (predictions).
A major contributor to the inflation surge in the past two years has been the sharp increase in gas and electricity prices. In January 2023 the annual rate of inflation was 129% for gas and 67% for electricity. Another contributor has been increases in the price of food and non-alcoholic drinks: prices of these goods increased on average by 17% between January 2022 and January 2023.
High energy and food inflation disproportionately affect low-income households. Figure 2 shows the share of expenditure that goes on energy, food and non-alcoholic drinks for the lowest- and highest-income tenth of households. The lowest-income tenth are more than twice as exposed as the highest-income tenth to inflation in these items, in that they account for 32% and 15% of their respective total budgets.
Figure 2. Share of spending on energy, food and non-alcoholic drinks, by household income
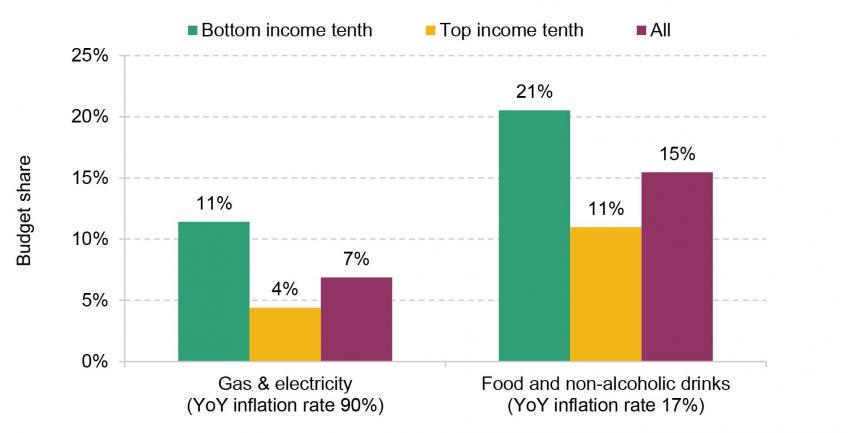
Note: Year-on-year (YoY) inflation figures refer to inflation between January 2022 and January 2023. Gas and electricity category also includes other fuels used for heating. Income deciles based on equivalised net household income.
Source: Authors’ calculations using Living Costs and Food Survey (LCFS) 2019 and consumer prices data from the Office for National Statistics (ONS).
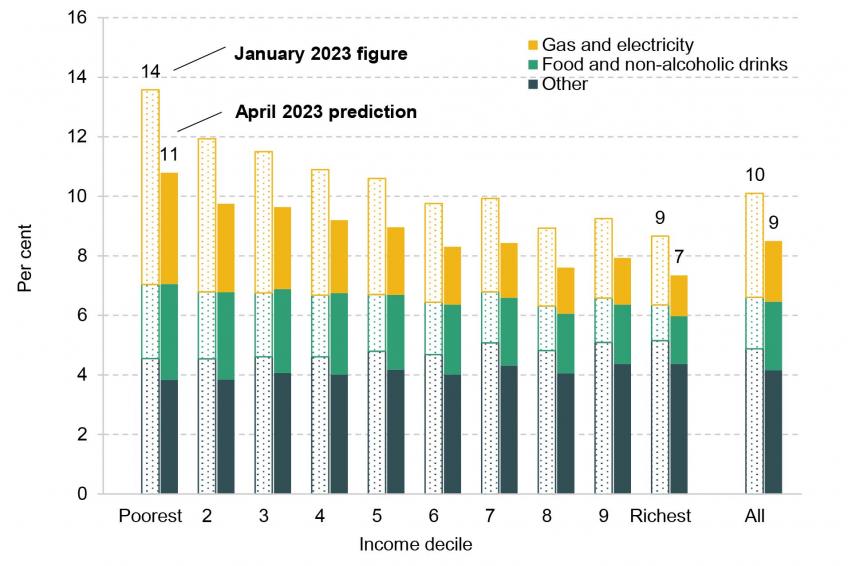
Figure 3 shows the resulting differential rates of inflation between households. While the overall rate of inflation in the year to January 2023 was 10.1%, the rate faced by the lowest-income tenth was on average 14%, compared with 9% among the highest-income tenth. Differential exposure to the energy price rises explains essentially all of this difference.
Figure 3. Inflation by income decile, January 2023
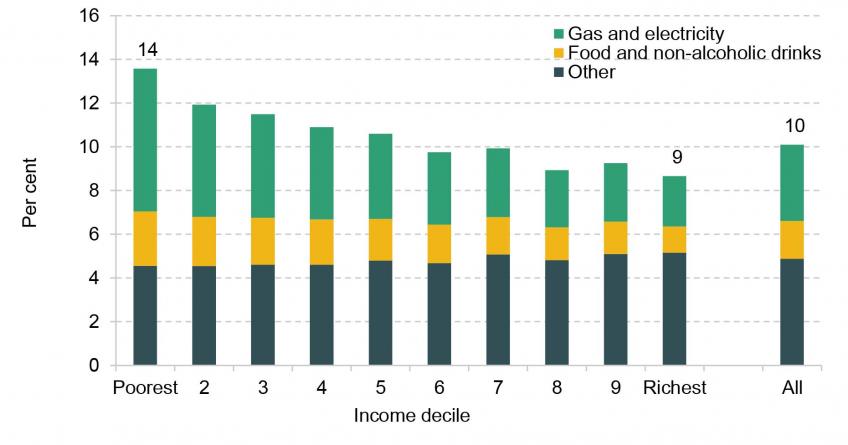
Note: Income deciles based on equivalised net household income. The inflation rate calculated using LCFS budget shares gives a higher weight to several items that saw rapid price increases, including gas, vehicle fuel and second-hand cars. This implies an inflation rate 2.4 percentage points higher than the official CPI. We subtract this difference from the inflation rates reported here.
Source: Authors’ calculations using Living Costs and Food Survey 2019 and consumer prices data from the Office for National Statistics.
Figure 4 shows the same analysis using inflation predictions for April 2023. The Bank of England expects overall inflation to fall from its current rate of 10.1% to a still-very-high 8.5% in the second quarter of 2023. With an increase in the household energy price cap in April (see more on this below), annual inflation rates for gas and electricity will still be running at 65% and 40%, so we expect the differences in rates of inflation between income groups to remain substantial, at about 3½ percentage points, in April 2023. This gap is also reinforced by the fact that there are items such as passenger transport and motor fuel for which prices are now rising relatively slowly, or even falling, and spending on these items tends to represent a bigger share of the budgets of richer households. In summary, we do not expect the differences in rates of inflation between different income groups to dissipate in the short term. This will likely happen only once inflation in the energy prices facing consumers slows down considerably. We discuss the outlook in that regard in the next subsection.
Figure 4. Inflation by income decile, January 2023 and prediction for April 2023
Note: Income deciles based on equivalised net household income. The inflation rate calculated using LCFS budget shares gives a higher weight to several items that saw rapid price increases, including gas, vehicle fuel and second-hand cars. This implies an inflation rate 2.4 percentage points higher in January 2023 and 1.2 percentage points higher in April 2023 than the official CPI. We subtract these differences from the inflation rates reported here.
Source: Authors’ calculations using Living Costs and Food Survey 2019 and consumer prices data from the Office for National Statistics.
Energy prices
The dramatic changes in energy prices have led to huge government support to mitigate the impacts on households. The Energy Price Guarantee (EPG) currently limits the unit prices (as well as standing charges) of gas and electricity at levels below the tariff caps set by Ofgem. For the period from October 2022 to March 2023 the EPG was set at a level that implies an annual energy bill of £2,500 for a typical consumer. In the Autumn Statement in November 2022, it was announced that the EPG level would increase by 20%, so that the cost for a typical consumer would rise to £3,000, in April 2023.
At the time of the Autumn Statement, wholesale energy future prices implied that the Ofgem tariff caps would have been above the EPG level of £3,000 through the financial year 2023–24 – implying that the annual average bill for a consumer would be the EPG level of £3,000. However, prices of gas and electricity are now expected to fall faster than was expected in the autumn. Although from April consumers’ bills will indeed be determined by the new, higher EPG, this will last only a few months, according to the latest predictions from Cornwall Insight. By July, the Ofgem tariff cap is now expected to fall below the EPG level, meaning that consumers will once again have their prices effectively set by Ofgem rather than central government. But energy prices remain very volatile so we should not be surprised if the prices end up considerably lower or higher than what market prices currently imply.
Figure 5 plots, in each quarter, both the Ofgem tariff cap and the EPG. The price actually facing consumers is the lower of the two, which is picked out by the blue line (which also incorporates the £200 per quarter Energy Bills Discount in 2022Q4 and 2023Q1). This confirms that the price of energy to consumers is set to rise for a final time in April (2023Q2), peaking at 135% above (i.e. 235% of) its Winter 2021–22 level, before falling back to close to its current level – still 69% above (i.e. 169% of) its Winter 2021–22 level – from July (2023Q3). That temporary price increase in April is evidently not driven by the Ofgem tariff cap, which will be falling in line with recent falls in wholesale prices, but by the fact that the EPG will rise. One can see from the graph that, were the increase in the EPG to be delayed by three months, consumers would – under current forecasts – face a relatively stable price of energy for the rest of 2023. The cost of the delay to the government would be roughly £2.7 billion, meaning the total cost of the EPG for financial year 2023–24 would be £4.6 billion rather than £1.9 billion as currently predicted – but still far off the £12.8 billion cost forecast at the time of the Autumn Statement.
Figure 5. Level of tariff cap and EPG for a typical consumer, over time
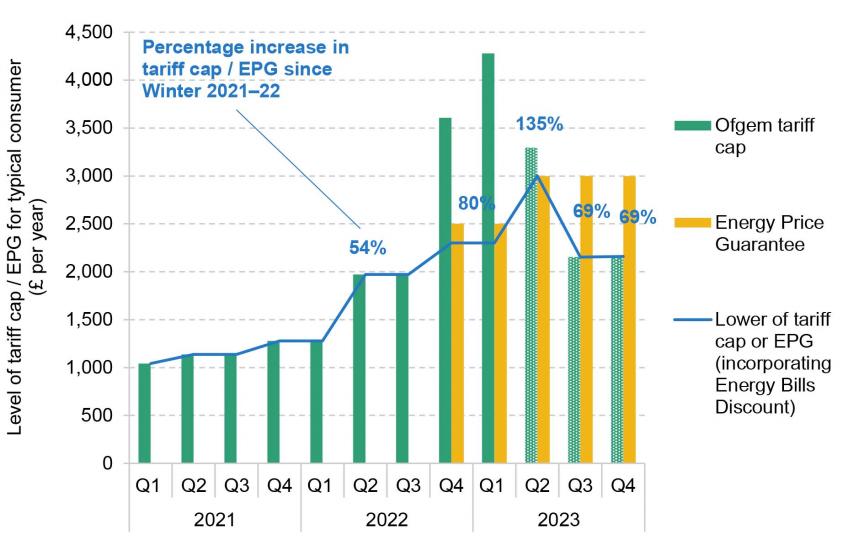
Source: Authors’ calculations using tariff cap data from Ofgem and tariff cap predictions from Cornwall Insight (shaded bars, forecast published 20 February 2023).
Of course, the importance of energy spending for households’ budgets depends not only on its price but on how much energy they are using. Because this varies seasonally, when focusing on short-term fluctuations in energy prices (as Figure 5 did) it is important also to put this into the context of varying usage. Figure 6 uses the same prices underlying Figure 5, but rescales each quarter’s figure so that it reflects average consumption of gas and electricity at that time of year – hence giving an estimate of the energy spending by a typical household in that quarter (rather than an estimate of what annual spending would be if that quarter’s price applied for the entire year). This affects the picture a lot – unsurprisingly, given that about 75% of annual domestic gas consumption and 57% of annual domestic electricity consumption tends to take place between October and March. These short-term dynamics largely matter for those on pre-payment meters (approximately 7.4 million households, disproportionately on low incomes), whose energy payments actually track usage and prices in real time, rather than those paying by direct debit.
Figure 6. Quarterly and annual energy bills for a typical consumer, over time
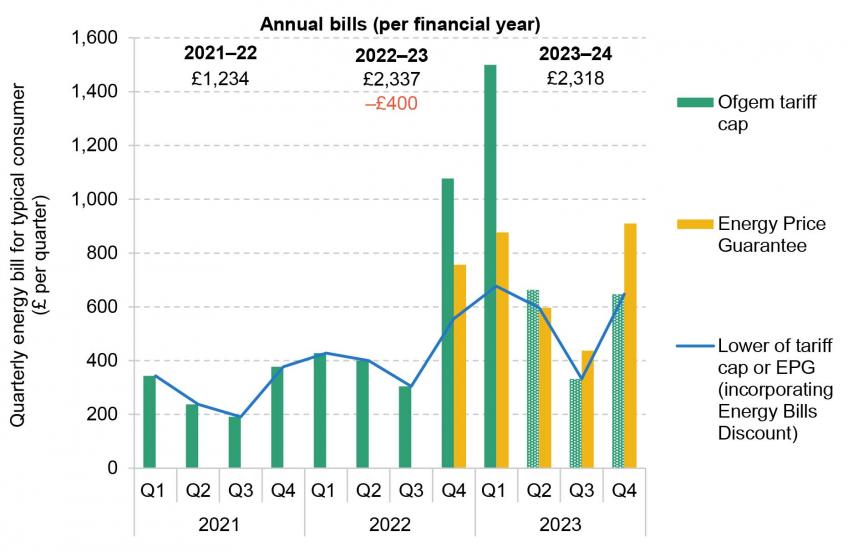
Note: Annual bills figure for 2023–24 assumes that 2024Q1 cap remains at the same level as 2023Q4 cap. The blue line takes into account the £400 Energy Bills Discount in 2022Q4 and 2023Q1 (£200 per quarter).
Source: Authors’ calculations using quarterly domestic energy trends data from Department for Business, Energy & Industrial Strategy (BEIS), tariff cap data from Ofgem and tariff cap predictions from Cornwall Insight (shaded bars, forecast published 20 February 2023).
Figure 6 shows that, broadly speaking, the financial pressures placed by energy bills on households are currently at around their likely peak, before substantial respite over the summer. But it also shows that the start of next winter (2023Q4) will be about as challenging once again as the current situation (even ignoring the fact that Winter 2022–23 has so far been unusually mild, and next winter may not be) – because the Ofgem price cap then is set to be at about the level of the EPG now.
Note that there would still be a very short-term (too short-term to be visible on the quarterly series) increase in energy spending between March and April 2023, just before and just after the EPG goes up, which also coincides with the end of the monthly instalments of the £400 energy discount.
Putting this all together, in 2022–23 average bills were £703 or 57% higher than in 2021–22 (after accounting for the fact that in 2022–23 most households are receiving a £400 discount on energy bills). On current forecasts, bills in 2023–24 will be higher still, at £1,083 or 88% above the level of average bills in 2021–22. This means that the increase in average bills between 2022–23 and 2023–24 is predicted to be 20% or £380.
Mortgage rates
Another important change in outgoings, not reflected in the standard consumer price inflation measures discussed above, comes from the increases in interest rates that we have seen as inflation has risen.
The Bank of England Bank Rate was just 0.25% at the beginning of 2022 but is now 4%, after the latest increase on 2 February. Recent market expectations are that it is likely to rise by another 0.5 percentage points (ppts) before peaking later this year (though this expectation may come down in light of the fact that the January 2023 inflation figure, released on 15 February, was a little lower than expected).
The ultimate impact of this for household finances is large. Across all households with a mortgage, we estimate that an increase in mortgage rates from 2% (the typical 2021–22 rate) to 5.8% (in line with the Bank Rate increases since 2021–22) would on average reduce incomes after mortgage payments by 7.5%, or 10.0% for those who have a mortgage and are aged under 45 (and tend to have larger outstanding mortgages). Were mortgage rates to increase by a further 0.5ppts, those figures would rise to 8.5% and 11.5% respectively. In other words, for households with a mortgage, if mortgage rates move in lockstep with increases in Bank Rate then interest rate rises will ultimately eat into disposable incomes by an amount similar to the inflation we have seen over the past year in all non-housing items (see above). Note that we are deducting from income both mortgage interest and capital repayments to obtain these disposable income figures, since they are both relevant in determining the short-term financial pressures and constraints facing households (in the longer term they do of course have very different implications for household finances).
For context, mortgage rates of 5.8% would be similar to the average mortgage rates faced in 2007–08. The main concern would be that, while in 2007–08 those sorts of mortgage rates were if anything low by historical standards, in the present day they are higher than many mortgagors are likely to have expected when they took on their financial commitment.
Households with higher incomes are more likely to have mortgages (54% of people in the richest quintile, compared with 19% in the poorest). Hence, as Figure 7 shows, when averaged across all households increases in mortgage rates will tend to hit the top of the income distribution more, even as a fraction of income. When comparing a world with 2021–22 mortgage rates and a world in which mortgage rates move in lockstep with the Bank Rate increase we have seen since then, the fraction of the top 40% of the income distribution whose mortgage payments equate to more than a quarter of their net income more than doubles.
Figure 7. Percentage of people living in households where mortgage repayments are more than a quarter of net income
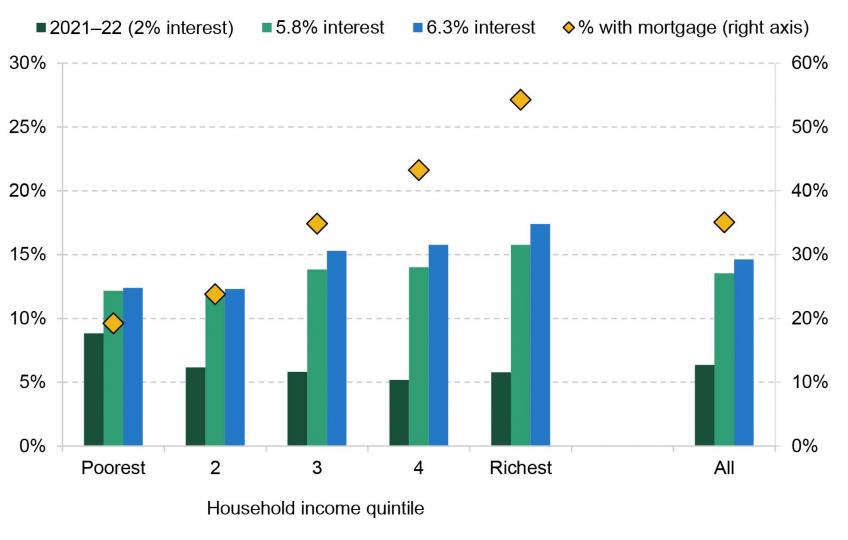
Source: Authors’ calculations using the Family Resources Survey, 2007–08 and 2019–20.
These impacts would not all materialise quickly, as the majority of mortgagors have fixed-rate deals. But about 1.4 million mortgages will come to the end of their fixed term in 2023, and more than two-thirds of those will be floating off rates of under 2% – meaning substantial increases. For example, if a household had taken out a two-year fixed deal two years ago, with a 25-year 75% LTV mortgage of around £170,000 (a typically-sized mortgage for a couple in their 30s), they would likely have a mortgage rate of about 1.5%. If their mortgage rate increased by 3.7ppts, in line with the increases in Bank Rate since their original fix, then their monthly payments would increase by £340, from £680 to £1,020. For a typical mortgagor couple in their 30s, that would translate into a fall in disposable income (less mortgage payments) of around 11%.
Having focused on inflation trends we now examine the consequences for real incomes, taking first earnings and then benefits.
2. Impacts on earnings and benefits
Earnings
Growth in average nominal earnings has been high since the pandemic, fuelled by a tight labour market. Between December 2019 and March 2022, mean earnings grew by around 14% according to both the ONS’s average weekly earnings (AWE) survey – the official source of real-time earnings statistics – and HMRC’s administrative PAYE data. Adjusted for inflation, this translates into growth of 6–7%, much stronger than real pay growth of 2–3% in the preceding 27-month period (Figure 8).
Figure 8. Average real earnings, January 2017 to November 2022 (indexed to December 2019)
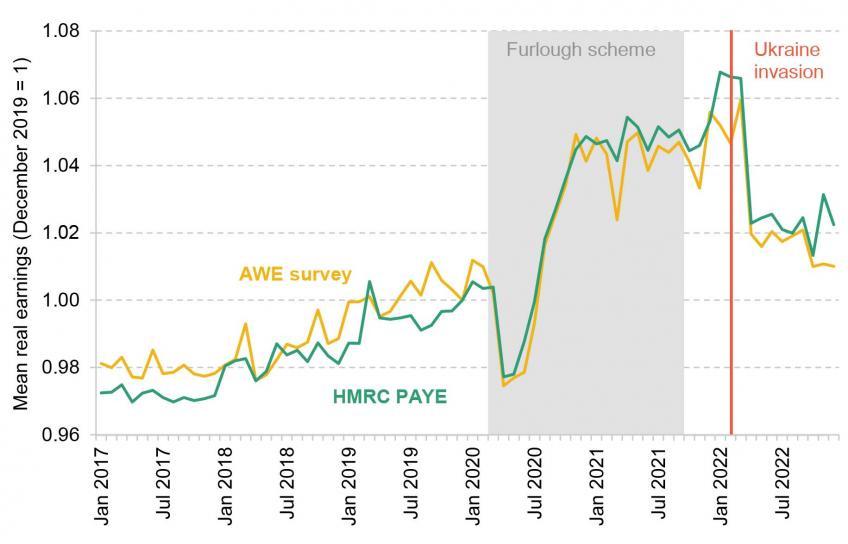
Note: Seasonally adjusted. Deflated by CPIH.
Source: ONS AWE survey; HMRC PAYE.
However, the war in Ukraine led to a sharp rise in inflation, causing earnings to plummet in real terms between March and April 2022. Since then real earnings have stagnated. Taken together, in the three years since the pandemic began (December 2019 to December 2022) average real earnings grew by 2% based on PAYE data and 1% based on AWE data. This compares with a similarly paltry 2–3% real earnings growth over the previous three-year period (from December 2016 to December 2019).
Figure 9 shows how changes in real earnings have differed across the pay distribution, based on PAYE data. In the three years since the pandemic, earnings have fallen by 1% in real terms at the bottom (the 10th percentile) and grown modestly by 1–2% further up the distribution. Note that we deflate earnings by the same inflation rate throughout the distribution. If we consider the higher rates of inflation faced by low-income households, discussed above, low earners – who are more likely to live in low-income households – are likely to have fared even worse than Figure 9 implies.
Figure 9. Change in real earnings by earnings percentile
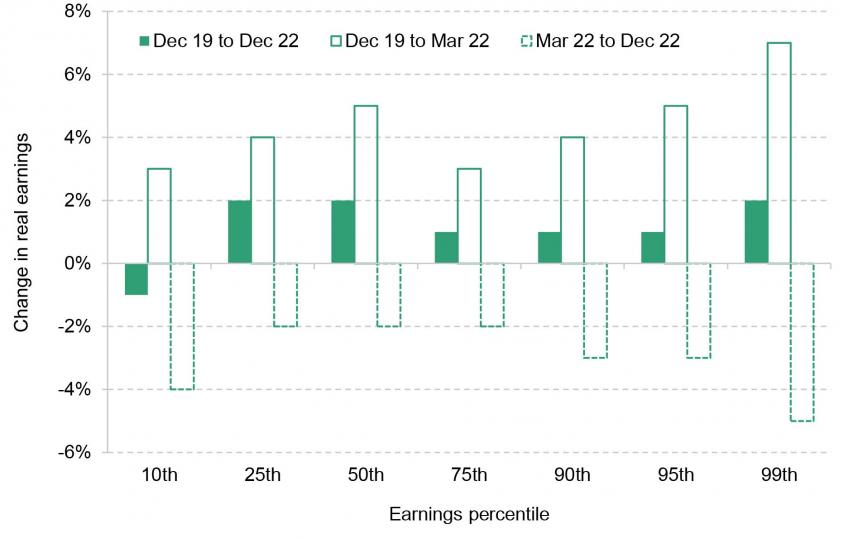
Note: Seasonally adjusted, three-month moving average. Deflated by CPIH.
Source: HMRC PAYE.
This is in stark contrast to patterns of growth in the three years preceding the pandemic, when earnings grew fastest for low earners. Between December 2016 and December 2019, real earnings growth was 6% at the bottom tenth of the distribution and 2% at the top tenth.
This overall pattern of earnings growth over the last three years is a product of two distinct periods. Between December 2019 and March 2022, real earnings growth was strong across the distribution and especially at the very top. This is shown by the solid green lines in Figure 9, which shows that earnings at the top 1% grew by 7% over this period. Since March 2022, earnings grew faster in cash terms in the middle of the distribution than at the very bottom and very top. This has led to smaller falls in real earnings for middle earners, as shown by the dotted green lines in Figure 9.
Looking ahead, the Bank of England forecasts that earnings will grow by 4% in cash terms in the coming financial year, which amounts to a 4% fall in real terms. The freezing of tax thresholds will mean a net direct tax rise for most workers, which will further push down net earnings in 2023–24. Median net-of-tax earnings are expected to be 2.5% lower in April 2023 than in April 2022, and 1.7% lower than in April 2019, before the pandemic. Figure 10 plots the expected change in real net incomes for a few example households.
Figure 10. Change in real net income for example households, April 2022 to April 2023
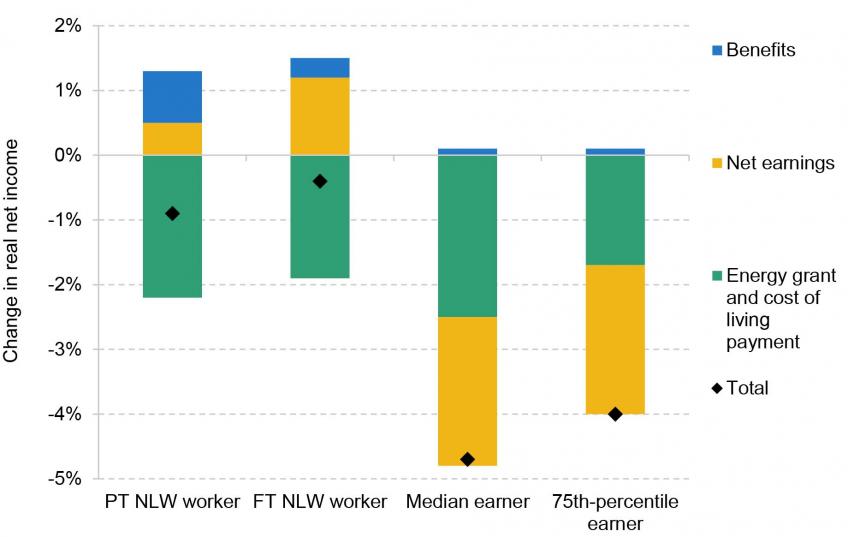
Note: Examples are single-earner households with one child and in council tax bands A–D (who hence qualified for the £150 cost of living payment in 2022–23). Assumes energy grants and cost of living payments are spread evenly throughout the year. For the National Living Wage (NLW) workers, who qualify for universal credit, we additionally assume that they own their homes outright. Ignores council tax and free school meals. Median earnings based on April 2022 PAYE data; 75th-percentile earnings based on March–May 2022 PAYE data; uprated to April 2023 based on Bank of England (BoE) average earnings forecast for 2023. Full-time (FT) is 35 hours a week; part-time (PT) is 16 hours a week. Inflation based on BoE 2023Q2 forecast. Assumes the same inflation rate across all households.
Source: Authors’ calculations using HMRC PAYE and BoE February 2023 Monetary Policy Report.
The near-universal energy grants and discounts will also be removed in 2023–24. Taken together, this means that a single-parent family with one child where the adult is on median earnings can expect their real income to fall by 4.7% in April 2023, compared with April 2022, and an otherwise-similar family with a 75th-percentile earner can expect their income to fall by 4.0%. Here we are considering incomes before deducting any housing costs, but it is worth bearing in mind that, as shown in the previous section, if such a household also happened to be rolling off a fixed-rate mortgage deal over the coming year then it could easily see a further large hit to its net income.
The incomes of workers on the minimum wage can be expected to hold up better on average, especially if they are on means-tested benefits. The National Living Wage will rise from £9.50 in 2022–23 to £10.42 in 2023–24, which represents a 1% increase in real terms. Further, because benefits are uprated by lagged inflation and inflation is forecast to fall a little this year, benefit receipts will increase a little in real terms year-on-year (though note that they will not increase nearly enough to catch up with their real value from before the spike in inflation in Autumn 2021 – an issue we explain further in the next subsection). Offsetting these increases is the fact that the cost of living payments to households on means-tested benefits are lower in 2023–24 than in 2022–23.
Combining these effects, Figure 10 shows that a single parent with one child, where the worker is full-time on the minimum wage, can expect a 0.4% fall in their real net income in April 2023 compared with April 2022. A similar parent who works part-time can expect a larger fall, of 0.9%, reflecting the fact that earnings represent a smaller share of their income, and energy grants and cost of living payments a larger share.
Figure 11 shows the change in real net household incomes for these example households between April 2019 (before the pandemic) and April 2023. A single-adult family with one child on median earnings can expect their real net income to be 1.8% lower in April 2023 than before the pandemic, and a single-parent family with earnings at the 75th percentile can expect to be 2.8% worse off. These differences are smaller than when comparing April 2023 with April 2022, which reflects the fact that middle and upper-middle earnings grew between April 2019 and April 2022, even when adjusted for high levels of inflation.
Figure 11. Change in real net income for example households, April 2019 to April 2023
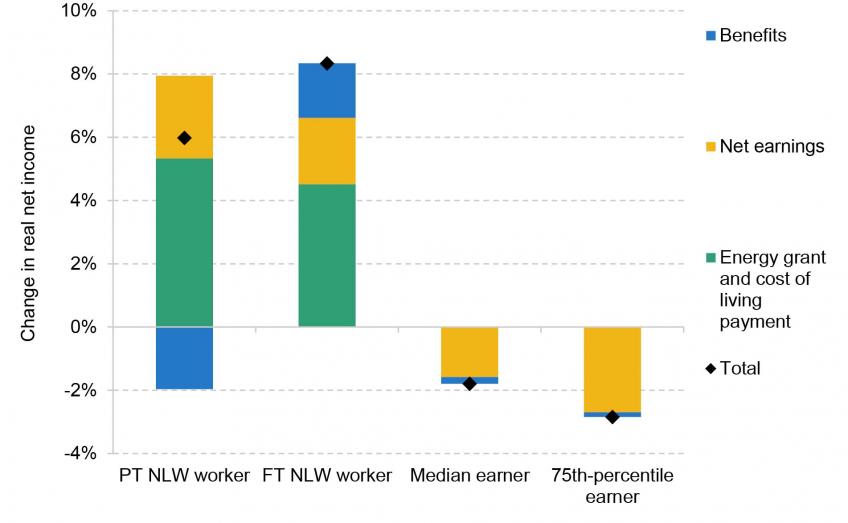
Note: Examples are single-earner households with one child. Assumes energy grants and cost of living payments are spread evenly throughout the year. For the National Living Wage (NLW) workers, who qualify for universal credit, we additionally assume that they own their homes outright. Ignores council tax and free school meals. Median (75th percentile) earnings based on April (March–May) 2019 PAYE data; earnings in April 2023 based on 2022 data for corresponding months uprated with Bank of England (BoE) average earnings forecast for 2023. Full-time (FT) is 35 hours a week; part-time (PT) is 16 hours a week. Inflation based on 2019Q2 to 2022Q2 CPIH out-turn and BoE 2023Q2 forecast. Assumes the same inflation rate across all households.
Source: Authors’ calculations using HMRC PAYE, ONS CPIH and BoE February 2023 Monetary Policy Report.
Single-parent families with one child where the adult is on the minimum wage can expect to have higher real net incomes in April 2023 than in April 2019. In April 2023, the National Living Wage will be 5% higher in real terms than it was in April 2019. For a parent who works part-time, the real value of their benefits will be lower than before the pandemic, as benefit upratings lag inflation (discussed in more detail below). However, the fall in real benefits is more than compensated for by the cost of living payment for this particular family type (as discussed below, this is not the case for all families). Putting this together, families with a single parent working part-time on the minimum wage and one child can expect their real net income to be 6.0% higher in April 2023 than before the pandemic.
A similar parent who works full-time can expect their real net income to be 8.3% higher. This is because of changes to universal credit in the October 2021 Budget, which increased entitlements to in-work households. For a single parent who works full-time on the minimum wage, this more than offsets the negative effect of lagged uprating, resulting in a rise in real benefit incomes between April 2019 and April 2023.
Benefits and cost of living payments
Income from the state is typically price-indexed, or better. One might therefore have thought that those who get income from the state would be much more comprehensively protected from the spike in inflation than other groups. Indeed, that could have been so. But in fact this description would oversimplify reality considerably – not only because lower-income groups have tended to see higher inflation than average, but also because of the deficient way in which benefits uprating actually operates.
Benefits are increased once per year – in April – and they are increased using a lagged measure of inflation – from the previous September. This means that if inflation rises just after September (as happened very starkly in the autumn of 2021), the real value of benefits cannot catch up for a minimum of 18 months. In fact, the real value of benefits will only catch up a few months after inflation has fallen back to its original level. In principle, that could take years. Indeed that is what we expect during the current inflation episode, as explained below.
Figure 12 illustrates the roller coaster that the real value of benefits has been on. It plots average benefit entitlements for out-of-work claimants of working age, excluding housing elements, and tracks their real value on a quarterly basis. There was very little change over the year from 2019Q2, because inflation was low. During the pandemic, a temporary £20 per week uplift was introduced, and then withdrawn in Autumn 2021. One can then see the real value of benefits declining further in the months that follow, as inflation increased suddenly. The annual uprating in 2022Q2, marked by the yellow dot, did very little to redress this, since it was based on the September 2021 inflation figure, which preceded the large rise in inflation. There were then continued large real declines throughout 2022–23, reflecting the inflation rate of around 10% over that period. Notice that, in April 2023, the annual uprating of benefits will merely take them back to around the level they were at a year earlier – the shortfall that opened up between September 2021 and April 2022 will still remain unplugged. That ground will only be regained after inflation returns to the level it was at before Autumn 2021 – meaning that, astonishingly, under current inflation forecasts this will not happen until 2025. In the meantime, compared with their pre-pandemic (2019Q2) level, real benefit values were 7.6% lower in 2022Q2, and will be 6.2% lower in 2023Q2 and still 2.0% lower in 2024Q2.
Figure 12. Average real benefit entitlement, excluding housing element, for out-of-work claimants of working age
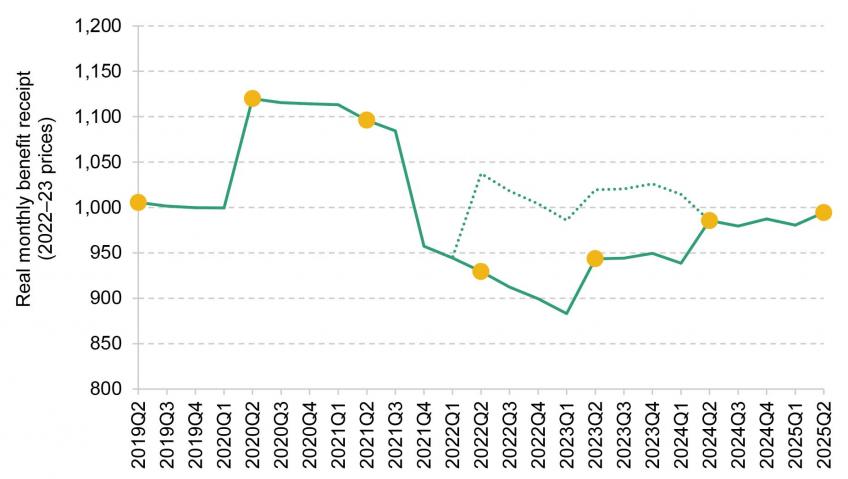
Note: The dotted line includes the impact of the energy grants and cost of living payments that were paid out during 2022–23 and are set to be paid out in 2023–24. Yellow dots mark April, which is the usual time at which annual benefits uprating occurs.
Source: Authors’ calculations using TAXBEN, based on Family Resources Survey 2019–20, and inflation from OBR Economic and Fiscal Outlook (up to 2022Q3), ONS (2022Q4) and BoE February 2023 Monetary Policy Report (2023Q1 onwards).
Figure 12 also adds on, using a dotted line, the impact of the energy grants and cost of living payments that were paid out during 2022–23 and are set to be paid out in 2023–24. For the coming year these comprise £900 for all recipients of universal credit, split into three payments, as well as £150 for those in receipt of disability benefits and £300 for pensioners (none of these payments are mutually exclusive). As the graph shows, if we spread out their value evenly across the financial year in which they are paid, then on average these payments slightly more than ‘compensate’ out-of-work benefit recipients for the lack of up-to-date inflation uprating of benefits.
That said, while those payments clearly make a significant financial difference, the context for their existence is that ordinary benefits are not currently rising in line with inflation as they are in principle supposed to. This matters because there are at least two respects in which near-flat-rate payments are not an ideal substitute for conducting inflation-uprating of benefits properly (i.e. without large lags). First, the amounts do not vary according to circumstances in the way that benefits do – meaning a large degree of arbitrariness in who does better and worse out of this arrangement (relative to uprating benefits in a timely way), and leaving many who are out of pocket alongside many who are in some sense ‘over’-compensated. Second, being a universal credit recipient – however little you are entitled to – now gets you an additional £900. This creates large inequities between those who just qualify and those who just miss out, and means that some families could in principle be better off if they earned less. We illustrate both of these points below.
Comparison of cost of living payments with up-to-date inflation uprating of benefits
We begin by examining how households fare under current policy – using a lagged measure of inflation and providing grants – versus not having any grants and simply uprating benefits in line with an up-to-date measure of inflation (e.g. uprating benefits each month using the latest inflation figure, which is perfectly possible under universal credit). Figure 13 shows the distribution of effects this would have on households.
Figure 13. Distribution of gains from cost of living payments compared with uprating benefits in ‘real time’, for working-age means-tested benefit recipients in 2023–24
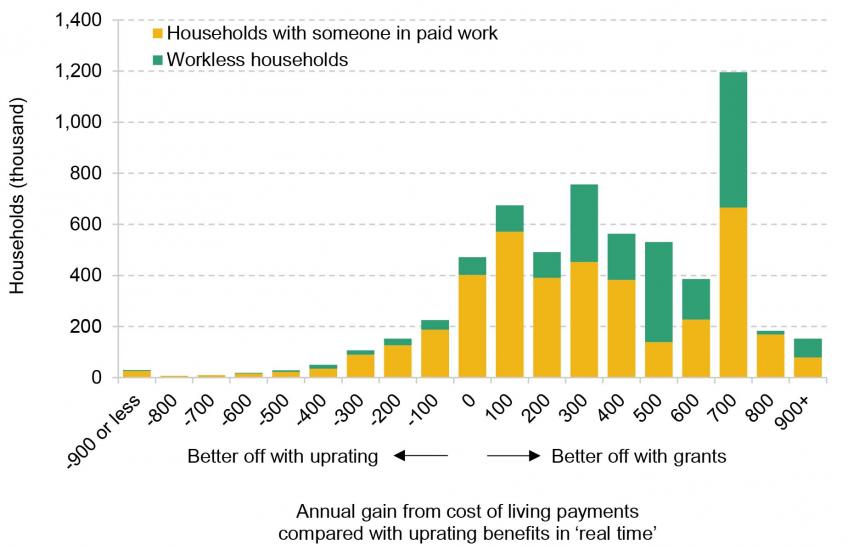
Note: Households categorised by annual gain, with £100-wide bins. The label refers to the bin midpoint. For example, the bin labelled ‘0’ refers to households that gain or lose no more than £50 per year.
Source: Authors’ calculations using TAXBEN, based on Family Resources Survey 2019–20, and inflation from ONS (up to 2022Q4) and BoE February 2023 Monetary Policy Report (2023Q1 onwards).
The majority of benefit recipients will actually get more income from the flat-rate grant arrangement. This comes at an additional cost to government of £2 billion in 2023–24 (including the payments made to those on means-tested benefits or disability benefits, relative to the extra benefit income they would have had under real-time inflation uprating). The average gain to working-age means-tested benefit recipients is £340, compared with having no grants but real-time inflation uprating. A key reason for this is that inflation forecasts have fallen since the nominal amounts for the cost of living grants were set in November. From the exchequer’s point of view, this is an additional limitation of not addressing the problem simply through uprating benefits in a timely way – it has plugged the gap with an ad hoc measure and it could not know, in advance, the level at which to set this support in order to achieve its objectives.
But the sizes of the gains vary widely, and around 10% of means-tested benefit recipients – around 630,000 households – are not compensated for the lack of timely uprating by the cost of living payments (in that they would have been at least £50 per year better off with no grants and timely benefits uprating instead). Smaller families without anyone in paid work are the most likely to gain from the flat-rate approach. Those with someone in work have lost out not only from the lack of timely uprating of benefit rates, but also from the lack of timely uprating of the so-called ‘work allowances’ – the amounts that can be earned before universal credit is tapered away – and hence the flat-rate cost of living grants are more likely to fall short of full compensation.
Leaving aside the differences between those families with and without someone in work, the impact of using the flat-rate grant approach instead of uprating benefits in a timely manner is generally to systematically favour groups who qualify only for ‘basic’ elements in benefits (e.g. those who are childless, and hence do not get additions for children). This is because flat-rate payments equate to a larger fraction of their benefit entitlements. This actually explains the large ‘spike’ of gains at around £700 per year on Figure 13. Most of those families are childless families entitled to no other additions, who lose ‘only’ about £200 per year from the lack of uprating of their basic elements, while receiving £900 in cost of living payments.
On the other hand, families who have additionally missed out on up-to-date uprating of, for example, their child elements, receive no additional cost of living payments in light of that. They therefore tend to do less well out of the planned arrangement. To add to the arbitrariness, one exception to this general rule is families who receive so much in benefits that they are at, or close to, the overall benefits cap. They actually do far better out of the cost of living payments than they would have done under usual benefit uprating, because the cost of living payments are out of scope of the cap and – until this coming April – the benefits cap has never been increased in cash terms since its introduction.
As Figure 14 shows, we see means-tested benefit recipients without children almost £600 per year better off, on average, than they would have been with up-to-date inflation uprating of their benefits and no cost of living payments. And as Figure 15 shows, just 3% of them would have been better off with inflation uprating of benefits. In contrast, for those with at least three children the two approaches turn out to be virtually the same on average. But this means that about 40% of families with at least three children are not compensated for the lack of proper inflation uprating by the cost of living payments. It is worth remembering that families with three or more children have already been hit especially hard by benefit cuts in recent years – in particular the so-called ‘two-child limit’ on means-tested support, and the overall benefits cap. In fact, many families with three or more children do at least as well under the cost of living payments as under up-to-date inflation uprating only because the two-child limit or benefits cap already in place would have limited the gains to them of inflation uprating.
Figure 14. Average gain from cost of living payments minus the loss from not uprating benefits in ‘real time’, for working-age means-tested benefit recipients in 2023–24
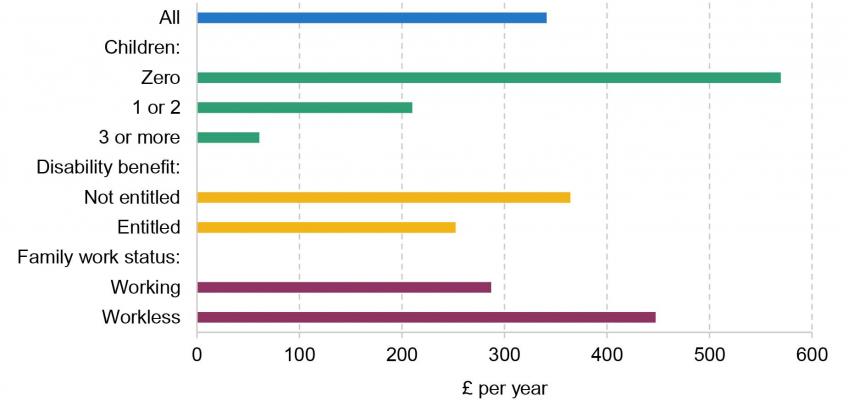
Source: Authors’ calculations using TAXBEN, based on Family Resources Survey 2019–20, and inflation from ONS (up to 2022Q4) and BoE February 2023 Monetary Policy Report (2023Q1 onwards).
Figure 15. Share of working-age households on means-tested benefits for whom cost of living payments do not compensate for lack of timely benefit uprating in 2023–24
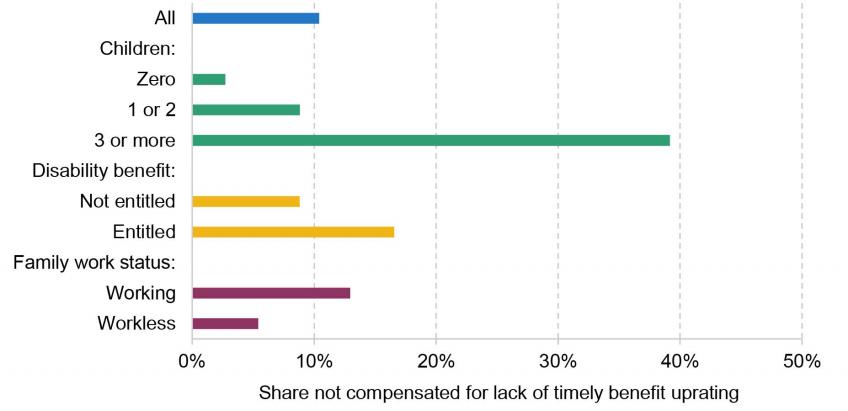
Note: ‘Not compensated’ defined as household net income more than £50 per year lower under grants compared with ‘real-time’ uprating.
Source: Authors’ calculations using TAXBEN, based on Family Resources Survey 2019–20, and inflation from ONS (up to 2022Q4) and BoE February 2023 Monetary Policy Report (2023Q1 onwards).
Compared with other households, those in receipt of a disability benefit are more likely to be worse off under the cost of living payments than they would have been under up-to-date uprating of benefits (17% compared with 9%). A key reason for this is that the extra £150 cost of living payment that these households will get in Summer 2023 is significantly less than the average annual increment in their disability benefits that they would have got if they had been uprated in line with inflation. For example, the average extra amount of personal independence payment (PIP) that PIP recipients would be getting in 2023–24, if PIP had the same real value as in 2019–20, is £281 (not to mention that these households are relatively likely to also receive other additional support that has lost real value too – in particular work-related incapacity elements).
Attempting to summarise this pattern of effects reveals just how arbitrary they are. A benefit recipient is likely to do best out of the government’s flat-rate approach to dealing with the cost of living crisis if they live in a family where nobody is in paid work and where benefit receipt is relatively low – in particular if they have no children, and are healthy – or, in a relatively small number of cases, where benefit receipt is so high that the cost of living payments are advantageous due to not being within scope of the benefits cap. Many people in these groups are getting significantly more money than would have been spent on simply increasing benefits in line with up-to-date inflation measures. On the other hand, those most likely to find themselves not compensated for our deficient way of uprating benefits are families with three or more children and families with someone in paid work – especially if they contain a disabled member.
Another bizarre feature of using an out-of-date inflation measure to uprate benefits and then compensating benefit recipients with flat-rate payments is that it means some of them could be better off if they had a pay cut (or could be worse off after a pay rise). This is because the government has created a so-called ‘cliff edge’ in the system: those with earnings just low enough to qualify for a small amount of universal credit get the full cost of living payment, while those with earnings very slightly higher – who are not entitled to any universal credit – get no cost of living payment.
Presuming that the payments in 2023–24 work in a similar way to those in 2022–23, receipt of each instalment of the payment will be contingent on having been a universal credit recipient in a specific prior month. There are to be three instalments of £299–301. We estimate that, as a result, in each of the three relevant months there will be around 825,000 people in a position whereby, in principle, they could increase their total income by reducing the amount they earn, thereby claiming the cost of living payment along with universal credit. Equivalently, there will be about 825,000 people with a lower monthly family income than otherwise-identical families who earn less than them.
Of course many people cannot decide to vary their earnings as and when they want to – especially if this is to be done only temporarily in specific months. But even if we were to assume that households must earn the same amount every month for the whole year, there would still be almost 200,000 individuals who could be better off in 2023–24 if they reduced their annual earnings enough to qualify for universal credit and gain the £900 of cost of living payments. Because ordinary benefits are tapered away gradually, rather than all in one go when income exceeds a certain threshold, simply uprating benefits in line with up-to-date inflation measures would have avoided these additional cliff edges in the system.
A final consequence of these cliff edges is that they can create an unfairness whereby people with volatile earnings miss out entirely simply because their earnings happen to be high in the ‘wrong’ month(s).
Data citations
Department for Work and Pensions, National Centre for Social Research, Office for National Statistics. Social and Vital Statistics Division. (2009). Family Resources Survey, 2007-2008. [data collection]. Retrieved from https://discover.ukdataservice.ac.uk/series/?sn=200017
Department for Work and Pensions, National Centre for Social Research, Office for National Statistics. Social and Vital Statistics Division. (2021). Family Resources Survey, 2019-2020. [data collection]. Retrieved from https://discover.ukdataservice.ac.uk/series/?sn=200017
Office for National Statistics, Department for Environment, Food and Rural Affairs. (2022). Living Costs and Food Survey, 2019-2020. [data collection]. 2nd Edition. UK Data Service. SN: 8803, DOI: 10.5255/UKDA-SN-8803-2
Authors

Jonathan Cribb
Jonathan is an Associate Director and Head of Retirement, Savings and Ageing sector, focusing on pensions, savings and later-life economic activity.

Robert Joyce
Robert is a Deputy Director. His work focuses on primarily on the labour market, income and wealth inequality, and the design of the welfare system.

Heidi Karjalainen
Heidi is a Senior Research Economist in the Retirement, Saving & Ageing sector. Her current research is on pensions and saving for retirement.

Sam Ray-Chaudhuri
Sam joined the IFS in 2022 and works as a research economist in the Income, Work and Welfare sector.

Tom Waters
Tom is an Associate Director at the IFS and Head of the Income, Work and Welfare sector.

Tom Wernham
Tom is a Research Economist in the Income, Work and Welfare sector, having joined the IFS in 2020.

Xiaowei Xu
Xiaowei joined the IFS in 2018 and works in the Income, Work and Welfare sector.
More from IFS
Understand this issue


Policy analysis


Academic research

