Downloads
Download here
PDF | 242.71 KB
IFS Election 2017 analysis is being produced with funding from the Nuffield Foundation as part of its work to ensure public debate in the run-up to the general election is informed by independent and rigorous evidence. For more information, go to http://www.nuffieldfoundation.org.
Executive Summary
This briefing note provides background information on the police service in England and Wales. It details recent changes in police numbers and in police funding, and examines some indicators of police performance in the light of these changes. Finally, it considers briefly the Labour Party’s proposal to increase the number of police officers.
Key findings
- The number of full-time equivalent police officers in England and Wales fell by 14%, or almost 20,000 officers, between 2009 and 2016. This has undone the workforce expansion of the 2000s – there are now fewer police officers in England and Wales than there were in the late 1990s.
- The Labour Party have pledged that, if elected, they would increase the number of police officers by 10,000 by 2021–22, which they have costed at £300 million. This could return officer employment to around the level it was in 2012.
- Between 2009 and 2016 employment of non-officer staff has fallen faster than employment of officers – by 23%. As a result, total employment in the police service has fallen by 17.4%, and officers’ share of police employment has risen.
- Spending on the police fell by 14% in real-terms between 2010–11 and 2014–15. Central government grants for the police fell by more (20%) but some forces were able partially to offset the cut by raising more money through council tax.
- At the autumn 2015 Spending Review the Government planned further cuts to central government grants for the police up to 2019–20. It was planned that if police forces each chose to increase the council tax precept by the maximum permitted then their budgets would remain constant in cash-terms between 2015–16 and 2019–20.
- Current estimates of police force revenues in 2016–17 show that the government has done as they promised so far: Police budgets remained broadly flat in cash terms between 2015–16 and 2016–17. However, this does mean that in real-terms revenues have continued to fall.
- Despite these cuts, both police recorded crime and crime reported in the Crime Survey of England and Wales have continued to fall until recently. In addition, clear-up rates by police forces have marginally increased through the period, although at a slower rate than during the period before cuts began.
The number of police officers in England and Wales fell by 14% between 2009 and 2016
Following a period of steadily rising police numbers the size of the police workforce in England and Wales has fallen steadily over recent years. In 2003, there were 132,500 police officers. This increased to a peak of 143,800 in 2009. By March 2016, numbers fell back to 124,100: 13.7% (or almost 20,000 officers) below the 2009 peak. The police officer workforce is now a smaller than it was in the 1990s, before the workforce expansion of the 2000s.
Figure 1. Number of police officers in England and Wales (full-time equivalent) 1996 – 2016
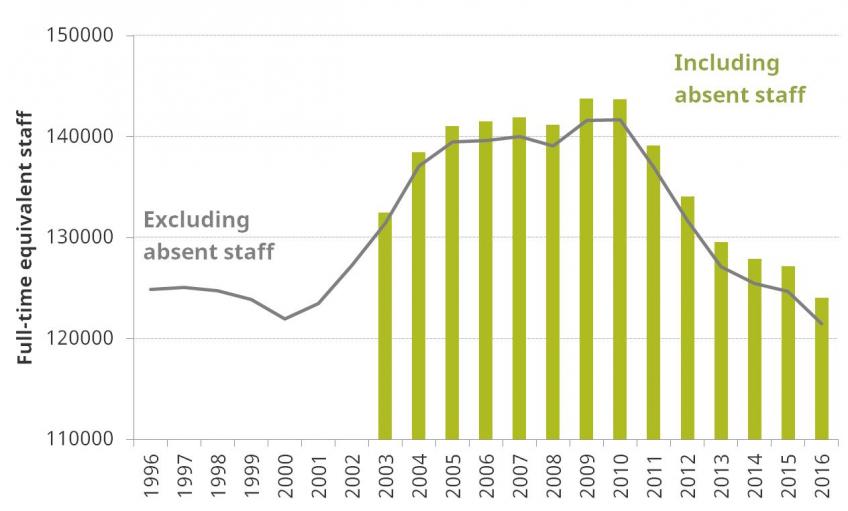
Source: Home Office, Police workforce England and Wales statistics, March 2016. Tables H3 and S1.
Notes: Consistent series for police workforce numbers which go back before 2003 are only available on a slightly different definition than the main definition of workforce used for Home Office police workforce statistics. The longer-run series excludes police workers on career breaks or maternity/paternity leave. The series beginning in 2003 includes these workers.
There is significant variation across English and Welsh police forces in the change in police officer numbers between 2009 and 2016. One in five police forces reduced their number of police officers by more than 22%, a further one-in-five made cuts of less than 9%. In one authority, Surrey, the number of police officers rose by 3.5%[1].
Cuts to the size of the police officer workforce have been larger on average in those areas which originally had more officers per local resident. Nonetheless, the number of police officers per capita still varies significantly around the country.
For the majority of police forces, the number of officers per 100,000 local residents is between 150 and 200[2]. The highest ratios are found in urban areas, including the Metropolitan Police (368), Merseyside (244) and West Midlands (236) – it’s interesting to note that Merseyside has the second highest ratio of police officers to local population in the country despite reducing officer employment by 21% since 2009. The lowest ratios are found in more rural parts of the country such as Wiltshire (137) and Hampshire (140).
The variation in both current staffing levels, and the changes over time reflect a combination of differences (across places and time) in local need, the availability of funding from central government (historically allocated on the basis of factors like socio-economic conditions and population density), willingness to raise the council tax precept, and organisational decisions (such as the mix of staff a force wishes to employ).
The number of non-officer police staff fell faster than the number of police officers
Police forces also employ non-officer staff in a variety of functions, often overlapping with those of police officers. The numbers of staff employed have changed over time roughly in line with police officer numbers. However, between 2009 and 2016 there has been a greater reduction in the number of non-officer staff than officers – 23% across England and Wales compared to 14% for officers. [3] As a result, total employment in the police service has fallen by 17.4%, and officers’ share of police employment has risen from 59% in 2009 to 62% in 2016.[4] Since increasing numbers of police staff were in part hired in order to release police officers from back office duties, this may mean that the proportion of police officer time allocated to frontline duties has been falling.
The cost-per-employee may have risen faster than earnings
Police officers are generally more expensive than other members of the police service – for example the median gross annual pay in 2016 of a police officer (sergeant and below) was £39,569 whereas the median gross annual pay of a Police Community Support Officer (PCSO) was £26,329.[5] As police officers now make up a larger proportion of employment in the police service, the average cost per person employed in the service is likely to have risen faster than earnings over the last few years.
Police spending fell by 14% in real-terms between 2010–11 and 2014–15
The police in England and Wales are funded through a mixture of central government grants, administered by the Home Office and the Department for Communities and Local Government (DCLG), and the ‘police precept’ a supplement levied on council tax bills by local authorities which has grown in importance over the last 20 years.
Crawford et al (2015)[6] looked in detail at police spending over the period 2000–01 to 2014–15. They found that police spending rose in the first decade of the century, as grants and council tax bills increased, but fell sharply between 2010–11 and 2014–15, largely as a consequence of reductions in public spending that took place under the Coalition Government.
Table 1 shows the ‘boom and bust’ in police spending between 2000-01 and 2014-15, taken from Crawford et al (2015). Between 2010-11 and 2014-15, central government grants for the police fell in real terms by 20%, or an average of 5.4% each year.
Total spending on the police fell by 14%, or 3.7% per year. This is less than the fall in grants because police forces were able to offset the fall in part by a rise in the police precept. However, while the fall in government grants was fairly even across police forces in this period, the offsetting rise in precept was very uneven across forces as described in Figure 2. Therefore, despite the almost uniform fall in grant across police forces, the net effect on police spending across police forces was uneven.
Police budgets have remained broadly flat in cash-terms since 2015–16
In the autumn 2015 Spending Review, the Conservative Government planned to make annual cuts to central government grants for the police for the duration of the spending review period (2015–16 to 2019–20).
However, the government promised that the magnitude of the planned reductions was such that if police forces increased the local police precept rate each year by the maximum permitted (2% for most authorities) then spending on the police would remain constant in cash-terms over the period.
Current estimates of police force revenues in 2016–17 show that so far this has been the case: total financing provision for the police in England and Wales (including the main police grants and council tax revenues) remained broadly flat in cash terms between 2015–16 and 2016–17. However, this does mean that in real-terms revenues have continued to fall.
Table 1. Changes in police spending 2000-01 to 2014–15 (real terms in 2014–15 prices)
|
| Police Spending (£000) | Average annual percentage change | |||||
|
| 2000-01 | 2005-06 | 2010-11 | 2014-15 | 2000-01 to 2005-06 | 2005-06 to 2010-11 | 2010–11 to 2014–15 |
Total (£ million) | Spending | 10,409 | 12,710 | 13,617 | 11,702 | 4.1% | 1.4% | –3.7% |
Grant | 8,673 | 9,648 | 10,182 | 8,168 | 2.2% | 1.1% | –5.4% | |
Precept | 1,736 | 3,062 | 3,435 | 3,534 | 12.0% | 2.3% | 0.7% | |
Per person (£) | Spending | 196 | 238 | 249 | 205 | 3.9% | 0.9% | –4.6% |
Grant | 164 | 181 | 186 | 143 | 2.0% | 0.6% | –6.3% | |
Precept | 33 | 57 | 63 | 62 | 11.9% | 1.8% | –0.3% | |
Proportion of spending | Grant | 83% | 76% | 75% | 70% |
|
|
|
Precept | 17% | 24% | 25% | 30% |
|
|
| |
Total (£ million) Excluding Counter-Terrorism Grant | Spending | 10,409 | 12,583 | 13,147 | 11,138 | 3.9% | 0.9% | –4.1% |
Grant | 8,673 | 9,521 | 9,711 | 7,604 | 1.9% | 0.4% | –5.9% | |
Source: Crawford, R., Disney, R. and Innes, D. (2015) Funding the English and Welsh Police Service: from Boom to Bust? Briefing Note No. 179, Institute for Fiscal Studies, London. https://www.ifs.org.uk/publications/8049
Figure 2. Percentage change in real-terms revenues and spending 2010–11 to 2014–15 (2014–15 prices)
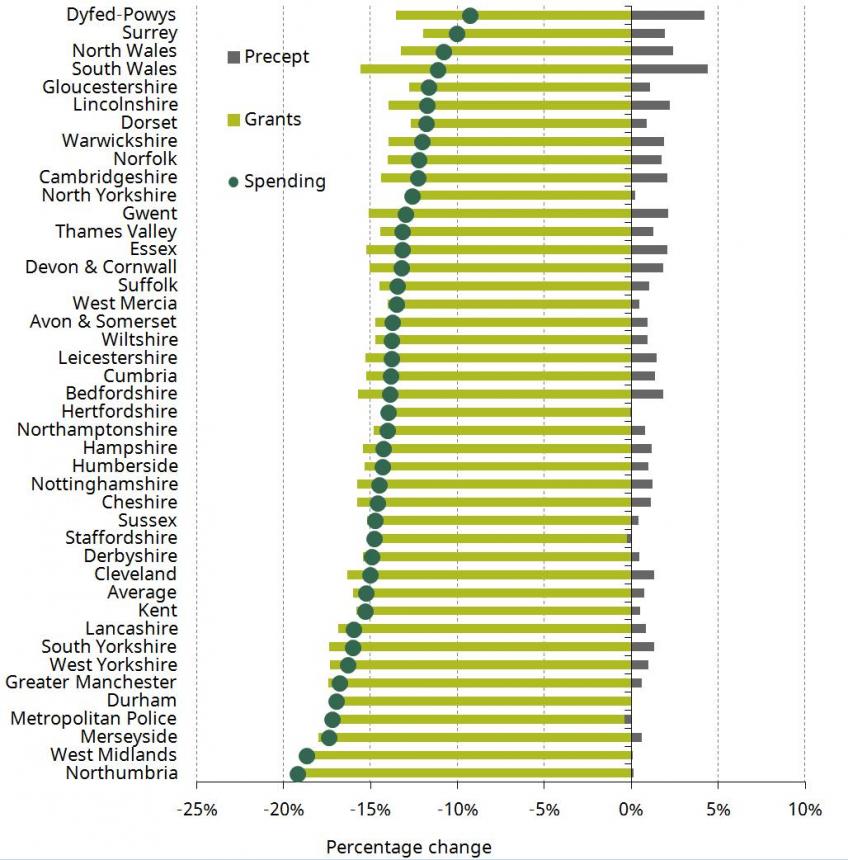
Source: Crawford, R., Disney, R. and Innes, D. (2015) Funding the English and Welsh Police Service: from Boom to Bust? Briefing Note No. 179, Institute for Fiscal Studies, London. https://www.ifs.org.uk/publications/8049
Despite cuts, both police recorded crime and self-reported crime have continued to fall until recently
How has police performance fared given this rise and fall in police workforce and funding?
There are well-known difficulties in utilising standard measures such as crime rates to measure police performance since the incidence of reported crime will in part depend on the public’s perception of the probability that the police service has the resources to deal with the problem. However, this can be supplemented with data from the Crime Survey for England and Wales (CSEW) which concerns crimes reported by respondents to interviewers, whether or not the incidents were reported to the police.
Figure 3 shows that, until the very end of the period when there was a change in recording practice, there has been a downward trend both in recorded crime and in crime reported to the CSEW. Falls in crime reported to the CSEW have been particularly large. This should not necessarily be taken to suggest that actual crime has been falling over the period, given the changing nature of crime – away from ‘traditional’ crimes such as car theft, robbery and burglary towards greater ‘white collar crime’, internet crime, sex crime and so on.
Figure 3 also describes average clear-up rates of recorded crime across police forces in England and Wales for the same period. There is some evidence that clear-up rates increased in the early part of the period, when police spending was increasing, but no evidence of a decline once the trend in funding was reversed. This may reflect greater efficiency in resource allocation by police forces in general, but alternatively it could be that clear-up rates would have continued to rise in the absence of spending cuts.
Figure 3. Patterns of crime in England and Wales 2002 to 2016
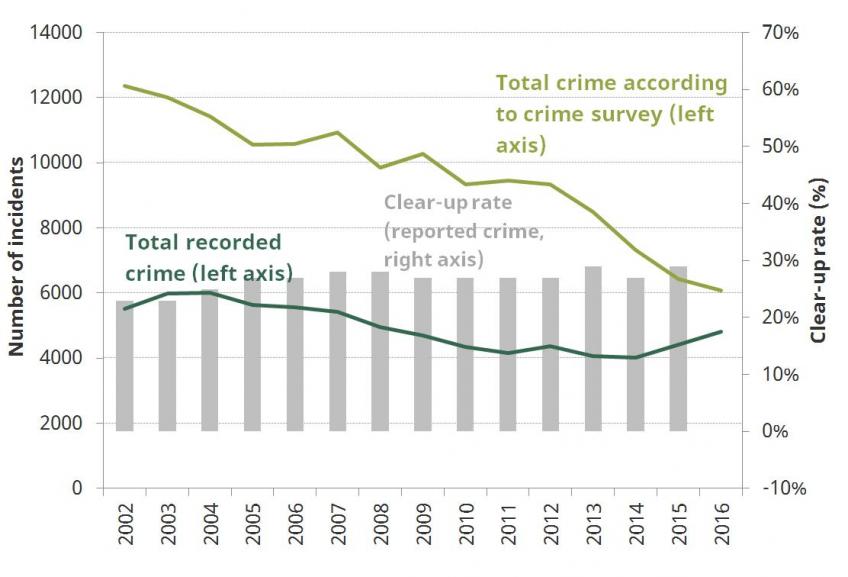
Source: Incident data from ONS Crime in England and Wales: Bulletin Tables, April 2017. Clear-up rates from CIPFA police statistics.
Another measure of police performance is the PEEL (Police Effectiveness, Efficiency, Legitimacy) metric developed by HM Inspectorate of Constabulary.[7] This metric gives individual police forces in England and Wales scores based on the judgement of HMIC Inspectors of the performance of individual police forces, with 4 possible grades ranging from ‘outstanding’ to ‘inadequate’ for each of these 3 criteria. Full PEEL assessments have been carried out for 2015 and 2016.
It is possible to examine the correlation of these PEEL scores across police forces with changes in central government funding since 2010, when the ‘bust’ in police spending began. On the basis of this raw correlation (shown in figure 4), we find no clear relationship between the magnitude of police funding cuts (in the form of central grant allocations) across police forces since 2009-10 and their average PEEL score (where higher is better) in the last two years. However the PEEL assessments are relatively new and it remains to be seen how well these measures capture ‘true’ police efficiency and effectiveness.
Figure 4. Correlation between budget cuts 2009-10 to 2016-17 and police force PEEL scores averaged across 2015 and 2016, for England and Wales
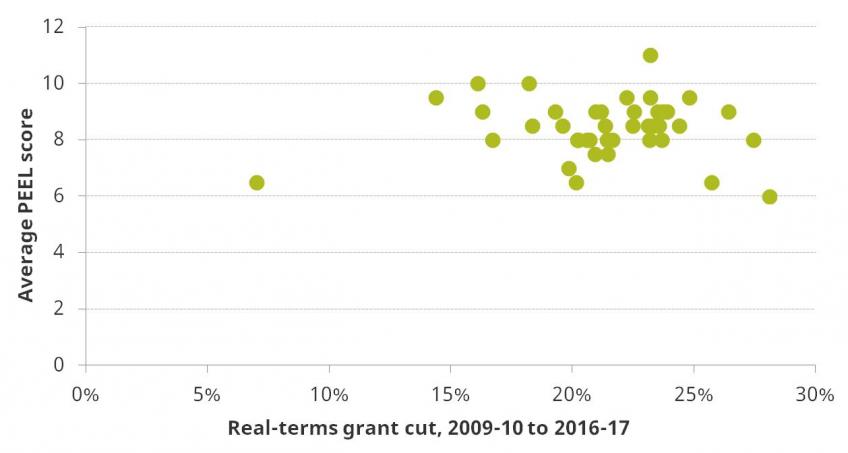
Note: Budget is defined as total grants (general and specific) from central government to police force authorities. Excludes precept revenues, draw down from reserves and other revenues. Average PEEL scores used are an aggregate measure which give equal weight to the 3 criteria used in PEEL assessment, and are an average of scores received in 2015-16 and 2016-17.A higher score indicates better performance. Graph does not include the Metropolitan police or City of London police force.
Source: HMIC website for PEEL scores. DCLG local government revenue expenditure and financing statistics for police force budgets in England. Statswales for equivalent figures for Welsh police forces.
Labour’s £300 million for 10,000 extra police
In early May, the Labour Party announced that, if elected, they would hire an additional 10,000 police officers by 2021–22. If the number of police officers in 2020 were 10,000 higher than in 2016, there would be around 134,000 (full-time equivalent) officers in England and Wales. As can be seen from Figure 1, this would be around same number of officers as in 2012. This would still be around 7% fewer officers than the peak in 2009, but above the level of employment in the 1990s.
The full cost of the proposed increase in numbers by 2021-22 was given as £298.8 million, based on 2016-17 police pay scales. However, although the proposal is accompanied by costings based on existing police scales, it abstracts from any hiring and training costs, and assumes that police officers will receive no pay increase other than through incremental scale increases during the period. The actual cost of this policy might therefore be very slightly higher.
No details are given as to how these extra police are to be allocated across police forces, other than that this will mean 10,000 extra ‘bobbies on the beat’. However, it should be noted that many foot patrols are carried out by PCSOs, and indeed many police forces regard patrolling, as opposed to incident-related activity, as an inferior way of dealing with crime and non-crime activities, the second of which take up an increasing proportion of police time. Using PCSOs, or financing a greater number of backroom staff in police forces, might be a cheaper and more effective form of intervention that would increase the time spent by police officers on ‘core’ police activities. Furthermore, a proposal of this kind could be framed to give greater local discretion by police forces to choose whether they wish to increase their workforce and by what method.
Notes
[1] Calculated from House of Commons Library (2016), Table A1
[2] All numbers in this paragraph taken from House of Commons Library (2016), Table 1.
[3] See table H3 of Home Office Police workforce England and Wales statistics, 31 March 2016. Note that non-officer staff is defined here as the difference between total police employment and total officer staff, so includes some officer staff on secondment.
[4] See previous footnote.
[5] Source: Median gross annual pay (all jobs, full and part-time) for SOC codes 3312 and 3315 taken from the Annual Survey of Hours and Earnings, 2016. The gap in weekly and hourly pay is also large, see: https://www.ons.gov.uk/employmentandlabourmarket/peopleinwork/earningsandworkinghours/datasets/occupation4digitsoc2010ashetable14
[6] Crawford, R., Disney, R. and Innes, D. (2015) Funding the English and Welsh Police Service: from Boom to Bust? Briefing Note No. 179, Institute for Fiscal Studies, London. https://www.ifs.org.uk/publications/8049
[7] Also paying homage to the founder of modern police forces: Sir Robert Peel.
Authors

Richard Disney
Richard is an IFS Research Associate, a Part-time Professor of Economics at the University of Sussex and a Visiting Professor of Economics at UCL.

Polly Simpson
More from IFS
Understand this issue


Policy analysis


Academic research


