
Downloads
R162-Education-spending-in-England-2019.pdf
PDF | 1.28 MB
Education spending is the second-largest element of public service spending in the UK behind health, representing about £91 billion in 2018–19 in today’s prices or about 4.2% of national income. The level of UK education spending has risen significantly in real terms over time, growing particularly fast from the late 1990s through to the late 2000s, before falling in real terms from 2010 onwards. Whilst important, such overall trends in total education spending tell us little about what has happened to the different areas of education spending.
Our second annual report on education spending in England provides measures of spending per student in the early years, schools, further education and higher education back to the early 1990s. These series of day-to-day spending per pupil allow us to understand how policy decisions have affected the resources available to students in different stages of education over the long run. We also analyse the effects of the 2019 Spending Round and the longer-term spending options for policymakers.
Spending per pupil or student per year at different stages of education: actual and plans (2019–20 prices)
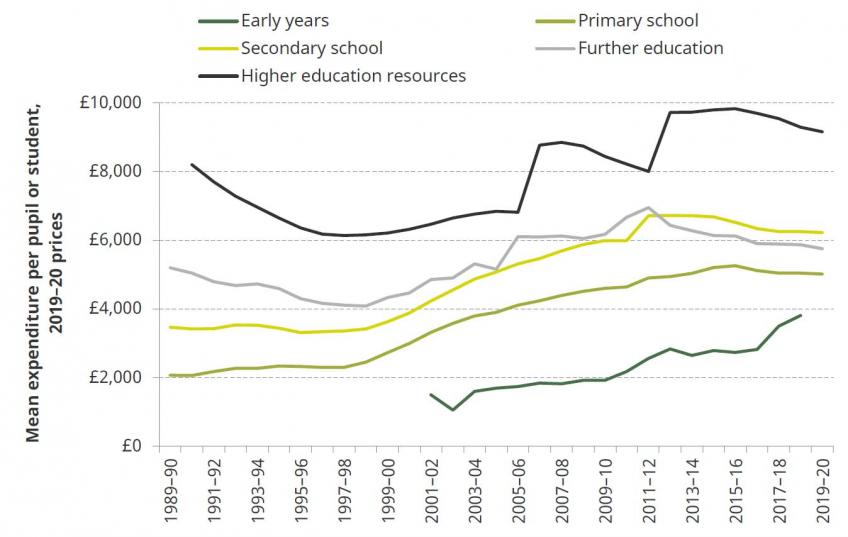
Source: Early years figures are spending per child for 3- and 4-year-olds. Further education figures are for ages 16–18. Higher education figures are the cohort-based numbers shown in Figure 5.1, divided by 3 – an approximate course length. See Appendices A–D for a full list of sources and methods.
Key findings
Early years
- Government spending on funded childcare places for 3- and 4-year-olds stood at£3.3 billion in 2018–19, equivalent to £3,650 per 3- or 4-year-old child (in today’s prices). This is an increase of about £250 million on the previous year, which is entirely explained by the extra money used to deliver the first full year of the extended entitlement to 30 hours a week of childcare for children in working families.
- After a 7% increase in 2017–18, spending per hour on the 3- and 4-year-old entitlement was effectively frozen in cash terms last year, leading to a 2% cut in real terms. This leaves spending per hour about 20% higher than it was in 2004–05.
- The free entitlement is only part of the landscape of government-supported childcare, but it has become increasingly important. In 2009–10, spending on childcare support through the benefit system was slightly higher than spending on the free entitlement; in 2017–18, free entitlement spending stood at £3.6 billion, compared with £900 million in support through the benefit system. Spending on tax relief for childcare almost doubled, to £860 million, in the same period.
- There has been a strong shift away from support targeted at low-income families and towards programmes for working families. In 2007–08, 45% of government spending on the early years and childcare support was targeted explicitly at low-income families. Ten years later – despite the introduction of a new funded childcare offer for disadvantaged children – the share of spending had slipped to 27%.
- Spending on children’s services is increasingly directed at safeguarding and responding to crises, at the expense of universal programmes such as Sure Start and youth services. Since the peak of children’s services spending in 2010–11, spending on Sure Start and services for young people has fallen by over 60%. Meanwhile, spending on children looked after rose by 19% between 2010–11 and 2017–18 and spending on children’s social care has risen 9%.
Schools
- Total school spending per pupil in England has fallen by 8% in real terms between 2009–10 and 2019–20. The bulk of these funding cuts were driven by a 57% reduction in spending per pupil on services provided by local authorities and a more than 20% cut in sixth-form funding per pupil.
- This follows on from average growth in primary and secondary school spending per pupil of around 5% per year during the 2000s. Combining trends since 2000, we calculate that school spending per pupil is likely to be about 40% higher in real terms in 2019–20 than in 2000–01.
- These funding cuts have been partly delivered through higher class sizes. Whilst primary school teacher numbers have risen by 11% since 2010, pupil numbers have grown by 17%. This has led to a small rise in average class sizes from 26 to 27 pupils. In secondary schools, teacher numbers have fallen by 20,000 or by just under 10%between 2010 and 2018. With no net change in pupil numbers, average class sizes have risen from 20 to 22 pupils.
- Teaching assistant (TA) numbers continue to rise in primary schools. The number of TAs in primary schools has risen by around 50,000 or 40% since 2010, having more than doubled from 50,000 to 125,000 between 2000 and 2010. This may reflect changing head teacher views on the best mix of staff in primary school. It may also reflect the fact that TAs tend to be cheaper to employ than teachers. In contrast, TA numbers in secondary schools have fallen by about 13% since 2011.
- The government has allocated an extra £4.3 billion to the schools budget in England for 2022–23. This represents 7.4% expected real-terms growth in spending per pupil between 2019–20 and 2022–23 and is sufficient to almost completely reverse the cuts of 8% seen since 2009–10. If delivered, this will leave school spending per pupil in England about the same level in 2022–23 as it was in 2009–10. No real-terms growth in spending per pupil over 13 years represents a large squeeze by historical standards.
- School spending per pupil is highest in Scotland, lowest in Northern Ireland. Total school spending per pupil was about £6,600 in Scotland in 2018–19. This is £600 higher than spending per pupil in England (£6,000), with spending per pupil in Wales £200 lower at £5,800. Spending per pupil was lowest in Northern Ireland, at £5,500 per pupil.
- Cuts have been largest in England and Northern Ireland, with spending per pupil falling by 8% in England since 2009–10 and by 11% since 2011–12 in Northern Ireland. Cuts have been smaller in Scotland (2%) and Wales (6%). This differential picture is mostly driven by the fact that England and Northern Ireland have seen large rises in pupil numbers, whilst Scotland and Wales have not.
Further education and skills
- Further education colleges and sixth forms have faced the largest cuts in recent years. Between 2010–11 and 2018–19, spending per student fell by 12% in real terms in 16–18 colleges and by 23% in school sixth forms. Following on from larger cuts during the 1990s and lower growth than most other stages of education during the 2000s, further education spending per 16- to 18-year-old is due to be only about 13% greater in 2018–19 than it was about 30 years earlier in 1989–90.
- Funding is lowest in school sixth forms and sixth-form colleges. In the 2018–19 academic year, we calculate that spending per student was £4,800 in sixth-form colleges, £4,900 in school sixth forms and £5,900 per young person in further education colleges. These differences mainly result from a funding system that provides more to vocational and complex courses, as well as to pupils from deprived backgrounds.
- The government has allocated an extra £300 million for further education colleges and sixth forms for 2020–21 (in 2019–20 prices). This will lead to a real-terms increase in spending per pupil of over 4% in 2020–21, but will still leave spending per student over 7% below its level in 2010–11 in colleges and over 20% below in sixth forms.
- Fully reversing cuts since 2010–11 would cost a further £1.1 billion over and above existing plans by 2022–23 (£730 million for school sixth forms and £320 million for 16–18 colleges). This increases to about £1.4 billion to ensure that spending on T levels is additional to an unchanged level of spending per student.
- Total spending on adult education (excluding apprenticeships) has fallen by nearly two-thirds since 2003–04. This combines cuts of 32% up to 2009–10 and 47% between 2009–10 and 2018–19. These cuts have mainly been driven by falls in learner numbers, which have fallen from 4.4 million in 2004–05 to 1.5 million in 2017–18. The recent Augar review of post-18 education has recommended reversing a range of the cuts to adult education.
- Spending on adult education and training is increasingly focused on apprenticeships. Of the £5.3 billion spent on adult education and apprenticeships in 2003–04, about 21% was spent on apprenticeships or work-based learning. By 2018–19, this fraction rose to 54%. Specific spending on apprenticeships rose by 36% in real terms between 2009–10 and 2018–19. Despite this, the government still seems likely to miss its target for 3 million new apprenticeship starts between 2015 and 2020 by a wide margin. However, an increasing share of individuals on apprenticeships are now on A-level-equivalent courses or higher (over 60% to date in 2018–19 as compared with around 40% in 2011–12) which generally offer higher economic returns.
Higher education
- Universities currently receive £27,500 per full-time undergraduate student to fund the cost of teaching for the full course of their studies (usually three years). This has fallen by 5% since 2012, but is about 50% higher than at its low point during the mid 1990s.
- While per-student funding is similar today to its early 1990s levels, total resources for teaching undergraduate students have doubled in real terms over that period. This was driven by a near-doubling in student numbers. The nature of that funding has changed significantly, with it now coming primarily through tuition fees rather than through teaching grants.
- The overall cost of the current system is about £17 billion per cohort entering higher education. More than half of the cost is expected to be paid for through graduate contributions (£9.0 billion), particularly from higher-earning graduates. The long-run cost to government is expected to be about £8.0 billion, about £7.4 billion through unrepaid student loans and £700 million in up-front grants.
- The Augar Review proposed cutting fees to £7,500, reintroducing maintenance grants and changing the terms of repayment. This would give policymakers greater control of spending on different subjects, which they have little control over at present due to funding being dominated by tuition fees and to a lack of controls on student numbers.
- The proposals would reduce repayments amongst higher earners and increase repayments amongst mainly middle earners. But there is no good reason to say the current distribution of repayments and incentives is the ‘correct’ one.
- Labour’s policies of abolishing fees altogether and bringing back maintenance grants would come at a cost to the public finances of just over £6 billion per cohort of full-time students over the long run. This policy would give the government even more control over the distribution of spending on certain subjects or institutions, but would benefit the highest-earning graduates substantially. The policy is significantly cheaper now as a result of the 2017 increase in the repayment threshold on student loans from £21,000 to £25,000.
- Considering part-time students adds approximately another £1 billion to the cost of Labour’s proposals at current student numbers. However, the cost of this policy could increase rapidly if the large decline in part-time student numbers since 2010 were reversed.
Authors

Luke Sibieta
Luke is a Research Fellow at the IFS and his general research interests include education policy, political economy and poverty and inequality.

Jack Britton
Jack's main interests lie in human capital accumulation and discrete choice dynamic modelling.

Christine Farquharson
Christine's research examines inequalities in children's education and health, especially in the early education and childcare sector.
More from IFS
Understand this issue


Policy analysis


Academic research


