With inflation currently around 10%, most teachers are likely to experience real-terms salary cuts this year. This follows on from real-terms cuts dating back to 2010. This and other factors are prompting teachers to consider industrial action. In this comment, we describe the expected changes to teacher pay in England this year and the changes since 2010, what we know about the state of the teacher labour market and the current position on school funding.
Changes to teacher pay
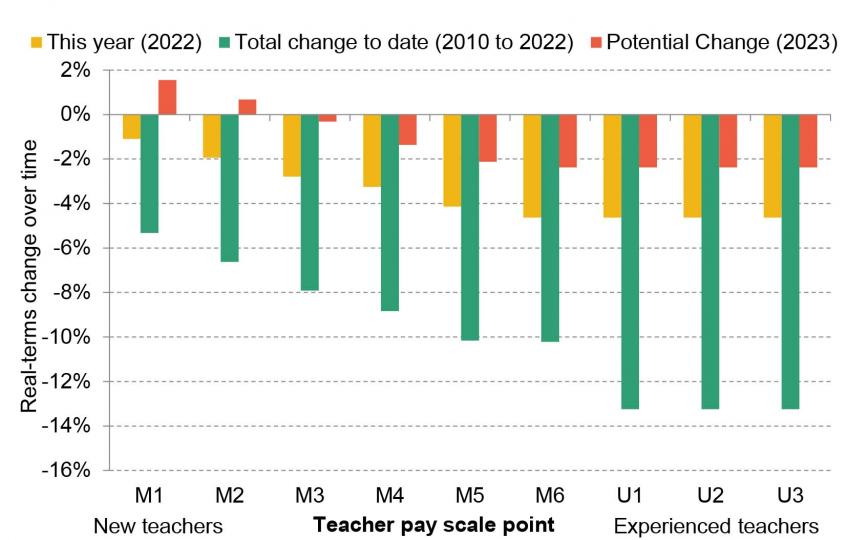
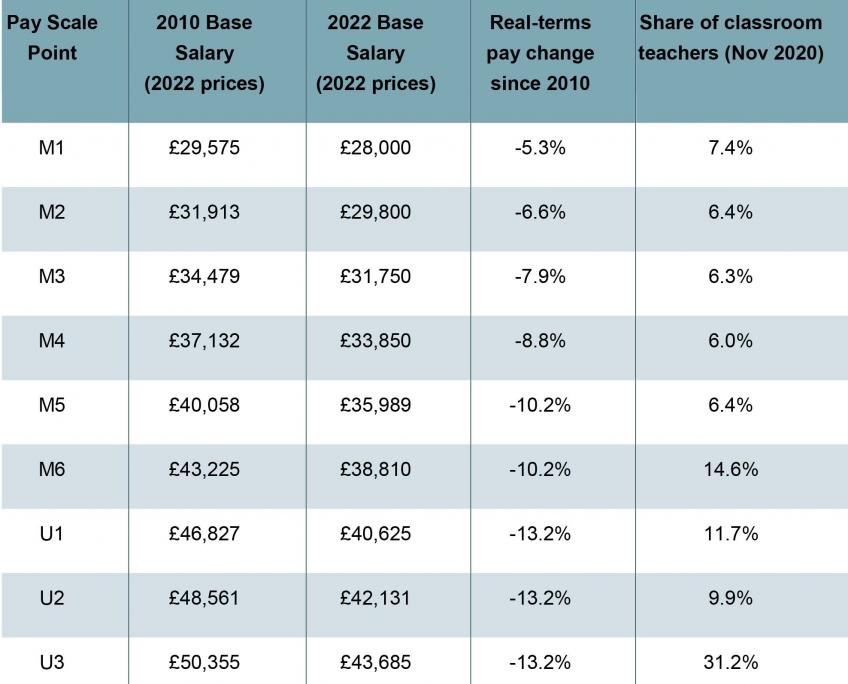
In July 2022, the government accepted the recommendations from the School Teachers' Review Body (STRB) for most teachers to receive salary increases of 5% from September 2022. New and inexperienced teachers received higher increases of up to 9%, on the way to delivering a government commitment of starting salaries of £30,000 for teachers in England by 2024. These changes represent some of the biggest cash-terms increases in teacher salaries for over 15 years. However, with CPI inflation currently expected to be about 10% in 2022–23, these increases will still represent real-terms salary cuts. As shown in Figure 1, salaries for teachers on most pay grades are expected to fall by 5% in real-terms in 2022–23. Even with larger increases, new and inexperienced teachers are likely to see real-terms salary cuts of 1-3% in 2022–23.
These cuts come on top of a long period of real-terms reductions in teacher salaries dating back to 2010. As shown in Figure 1, salaries for more experienced and senior teachers have fallen by 13% in real-terms since 2010. Teachers in the middle of the salary scale have experienced cuts of 9-10% since 2010. Starting salaries have fallen by 5% in real-terms. This smaller real-terms cut to starting salaries mostly reflects faster increases for new teachers in recent years as part of a deliberate effort to increase starting salaries to £30,000.
For 2022–23, the 5% increase in salaries for most teachers will be slightly below the OBR’s forecast of 5.4% for growth in average earnings. New and inexperienced teachers will be seeing pay growth in excess of this. However, the real-terms cuts in teacher pay levels since 2010 compare unfavourably with changes in average earnings, which are likely to have risen by about 2% in real-terms between 2010–11 and 2022–23 (based on whole-economy average weekly earnings).
To help interpret these changes, Table 1 shows the level of teacher salaries outside of the London area in 2010 and 2022 (both in 2022–23 prices), the changes since 2010 and the share of classroom teachers at each pay point. Teachers in the London area receive extra pay to account for a higher cost of living and some teachers receive (mostly small) payments to reflect extra responsibilities. Classroom teachers tend to move through the main pay scale relatively quickly, with over 50% of classroom teachers on the upper pay scale (U1–3 on Figure 1). This excludes school leaders, who are paid on different pay scales, but their salary scales have followed an extremely similar course to the upper pay scale. As a result, the changes in the upper pay scale are those that will apply to the majority of teachers.
Looking to 2023–24, the STRB recommended increases of 3% for most teachers for September 2023, with larger increases for new and inexperienced teachers. Based on current inflation forecasts of 5–6% for 2023–24, this would represent a further real-terms pay cut of 2–3% for most teachers and close to a real-terms pay freeze for new and inexperienced teachers.
Despite asking for these recommendations, the government chose not to make any decisions in summer 2022 on teacher pay for 2023. Instead, it decided to re-run the process and respond to new recommendations in summer 2023 that reflect the fast-changing state of the economy, inflation and the labour market.
Figure 1 Real-terms changes over time in teacher salary points since 2010: actual and forecast inflation
Note and source: Years refer to financial years starting each April. Teacher pay scales taken from School Teachers Pay and Conditions Document 2010 (https://www.gov.uk/government/publications/school-teachers-pay-and-conditions) and proposed scales from STRB report: 2022 (https://www.gov.uk/government/publications/school-teachers-review-body-32nd-report-2022). Real-terms value calculated based on average value of CPIH index (https://www.ons.gov.uk/datasets/cpih01/editions/time-series/versions/11) in the relevant financial year (e.g. 2014–15 for September 2014). Forecasts for 2022–23 and 2023–24 from OBR EFO November 2022 (CPI only), https://obr.uk/efo/economic-and-fiscal-outlook-november-2022/
Table 1. Pay scales for classroom teachers in England outside of London
Source: See Figure 1 for teacher pay levels. Share of classroom teachers on each pay scale taken from DfE evidence to the STRB for 2022 (https://www.gov.uk/government/publications/evidence-to-the-strb-2022-pay-award-for-school-staff).
State of the teacher labour market
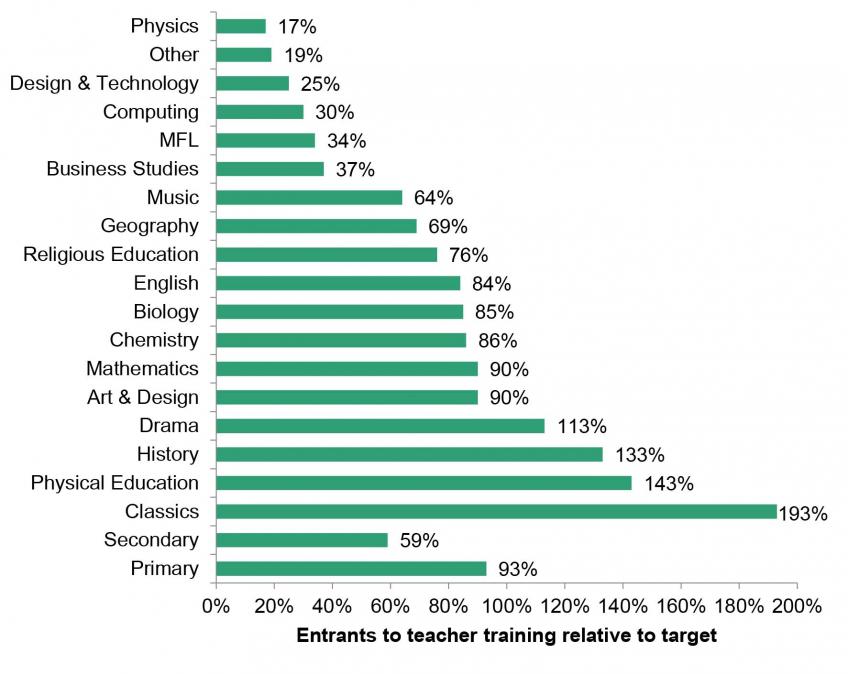
When it comes to teacher recruitment, the latest data paints a depressing picture. New entrants to postgraduate initial teacher training for primary schools were just below target (93%), but new secondary school trainees were a long way behind target (59%). The picture was even worse for some specific subjects, with 34% of the target achieved for modern foreign languages, 30% for computing, 25% for design and technology and a deeply worrying 17% for physics. This problem is compounded by the fact that many maths and science subjects have seen persistent recruitment and retention problems over a long period of time. This partly reflects the fact that graduates in maths and science subjects can generally command relatively high salaries in the private sector. Even more recent data shows that total applications for the next academic year (2023–24) appear just as bad as 2022–23.
When it comes to teacher retention, official statistics show that about 8% of teachers left their jobs in state-funded schools in England in the year to November 2021. Whilst this is down on the exit rate of 9-10% seen between 2015 and 2019, the lower rate of teachers leaving their job in 2021 might still reflect the difficult economic situation during the pandemic. Unfortunately, more recent official data won’t become available until summer 2023. However, various surveys of schools and head teachers suggest the recruitment and retention problems facing schools have got worse this year. We also know that schools in more deprived areas face more significant problems in recruiting and retaining teachers.
Figure 2. New entrants to postgraduate initial teacher training routes in 2022–23, by subject area and relative to target
Note and source: Department for Education, Initial teacher training: trainee number census 2022 to 2023, “MFL” refers to Modern Foreign Languages.
School funding
The funding picture has become more positive for schools. As shown in Figure 3, total school spending per pupil in England fell by 9% between 2010 and 2019. Since then, it has started to increase again. Furthermore, the government allocated an extra £2.3 billion per year to the schools budget in England in the 2022 Autumn Statement. Based on current forecasts, this will allow school spending per pupil in England to return to 2010 levels by 2024.
Importantly, this remains true even after we account for the specific increases in costs faced by schools. In cash-terms, school spending per pupil is due to increase by about 8% per year in both 2022–23 and 2023–24. This is above our estimates of the likely increases in the specific costs faced by schools, which we estimate will increase by about 6% in 2022–23 and about 4% in 2023–24. These estimates include the effect of the 5% increase in teacher pay in September 2022, the STRB recommendation for 3% increases in September 2023, the 8-9% increase in support staff pay in 2022–23, as well as rises in non-staff costs such as rising energy and food prices.
Figure 3. Total school spending per pupil (actual spending up to 2022–23, projected to 2024–25), 2009–10 = 100

Notes and sources: Drayton et al (2022), Annual Report on Education Spending in England: 2022


