
In most of our analysis of education spending, we focus on spending in England to ensure comparability. In this observation, we expand our analysis to show the level and changes to school spending per pupil across the four nations of the UK. This illustrates that school spending per pupil is highest in Scotland and lowest in Northern Ireland, and that recent trends have been heavily shaped by (often delayed) decisions on teacher pay and pensions. There have also been sustained increases in school spending in Scotland.
Level of school spending per pupil across nations
Differences in data sources and funding systems can make it difficult to compare school spending across nations. In our analysis, we have sought to define a common measure based on total day-to-day school spending on children aged 3–19 by schools, local authorities and funding agencies. This includes nursery and early years spending as well as school sixth-form funding to ensure comparability, given that some nations include this funding as part of school allocations. Whilst we have sought to make these measures as comparable as possible, there are always potential limitations from comparing data from different sources and, in the case of Northern Ireland, we must also use different sources over time. Figures for all nations relate to either plans or provisional out-turns for 2020–21 and 2021–22 and are thus subject to change.
One important source of inconsistency relates to additional COVID spending. In England, Wales and Northern Ireland, the analysis is based on figures that exclude extra funding or spending related to the pandemic, such as catch-up or COVID safety measures. For Scotland, figures do include COVID-related spending that is counted as net revenue expenditure. We highlight and evaluate the impact of this inconsistency as part of the analysis.
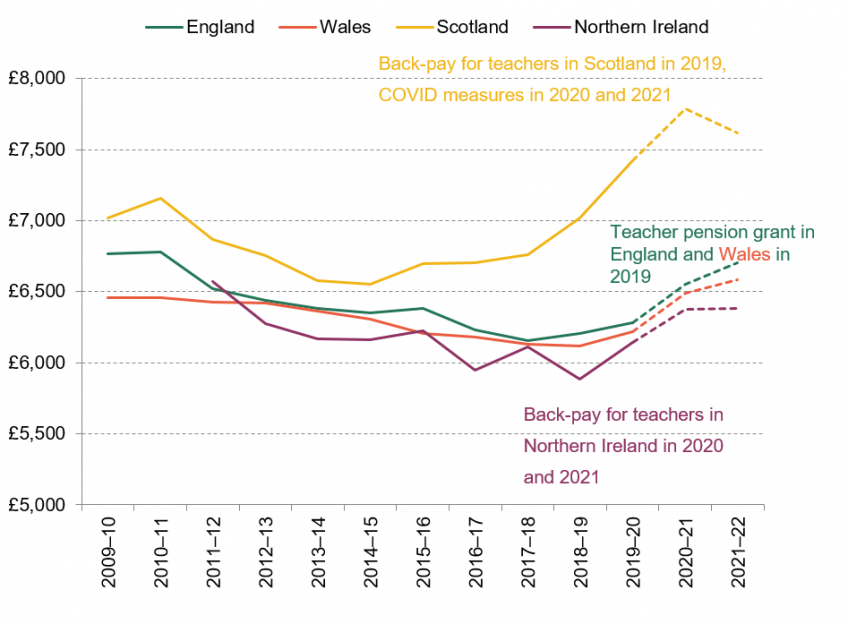
Figure 1 compares the level of spending per pupil over time across the four UK nations, with planned spending levels indicated by the dashed lines and specific data sources given at the end of this Observation. Across the period, school spending per pupil is consistently highest in Scotland and generally lower in Northern Ireland. In 2021–22, spending per pupil is expected to total £7,600 per pupil in Scotland (including COVID-related spending) and £6,400 in Northern Ireland. In between, spending per pupil is expected to total about £6,700 in England and £6,600 in Wales.
Similar trends and levels in England and Wales
The overall trends in England and Wales are very similar over time, as are the levels of spending per pupil from 2011–12 onwards. Between 2009–10 and 2018–19, spending per pupil fell by 8% in real terms in England and by 5% in real terms in Wales. Since then, total school spending per pupil has risen by about 8% in real terms in both countries to reach just below 2009–10 levels in England and just above 2009–10 levels in Wales. In both cases, this partly reflects extra funding to compensate schools for higher employer contributions to the Teachers’ Pension Scheme. This was allocated from September 2019 onwards and is worth just under £170 per pupil in England and adds an extra 2.5% to school spending per pupil. However, the rest of the growth reflects underlying growth in core school spending per pupil.
In our previous analysis focusing on England, we exclude this grant for employer contributions to the pension scheme to prevent an artificial jump in 2019 (Sibieta, 2021). We include it here to ensure consistency with figures for other nations of the UK.
Whilst trends in spending per pupil have been similar for England and Wales, it is important to note that trends in total spending and pupil numbers have been very different. In England, the 1% real-terms fall in spending per pupil between 2009–10 and 2021–22 will be delivered as a result of growth in total spending (12%) not quite keeping pace with rising pupil numbers (13%). In Wales, pupil numbers have barely increased (about 0.5%) and a more than 2% rise in total spending has led to a 2% rise in spending per pupil.
Figure 1. School spending per pupil across England, Wales, Scotland and Northern Ireland (2020–21 prices), actual and planned spending
Significant growth and higher level of spending in Scotland
Between 2009–10 and 2014–15, spending per pupil fell by 7% in real terms in Scotland. These cuts then began to be unwound, with spending per pupil growing by 7% in real terms between 2014–15 and 2018–19. Some of this growth in spending can be explained by greater use of specific grants from central government, such as the Pupil Equity Fund, which, like the Pupil Premium in England, provides extra funding to schools with more disadvantaged pupils. Total specific grants grew from just under £50 million in 2014–15 (less than 1% of total school spending) to reach over £300 million in 2018–19 and £500 million in 2019–20 (nearly 10% of total school spending). Figures for specific grants in 2020–21 and 2021–22 are not available, so we assume they remain constant in cash terms for the purposes of this analysis.
In 2019–20, there was a large single increase of 6% in real terms or an extra £400 per pupil. This increase largely reflects the Scottish Government’s decision to increase teacher pay scales by 7% from April 2019 (with a further increase of 3% backdated to April 2018). This led to an unusually high level of spending per pupil in 2019–20.
In 2020–21 and 2021–22, spending per pupil in Scotland will have been further boosted by COVID-related spending, reaching £7,800 per pupil in 2020–21 and £7,600 per pupil in 2021–22. According to Audit Scotland, the Scottish Government had allocated over £200 million extra funding for COVID mitigation measures for education and recovery spending in schools up to January 2021. A large part of this will have been focused on 2020–21, which may explain the apparent drop in 2021–22.
School spending across Scotland will also have been potentially boosted as a result of extra funding through the Barnett formula to reflect the grant to schools in England for the cost of higher employer contributions to the Teachers’ Pension Scheme.
Whilst spending in Scotland will have been boosted by COVID-related measures, there is every reason to believe that core or underlying school spending in Scotland is still high relative to previous years and to the other nations of the UK. If we assume that spending in 2021–22 was boosted by £100 million of COVID-related measures (half of the £200 million total COVID-related spending and almost certainly an overestimate), then underlying spending per pupil would only be £125 lower and still over 6% higher in real terms than in 2009–10 (as opposed to 8% higher in the raw figures). This would also leave spending per pupil in Scotland over £800 higher than in other nations of the UK (as opposed to over £900 higher based on the raw figures).
Back-pay for teachers in Northern Ireland
In Northern Ireland, we can only track a broadly consistent measure of spending per pupil back to 2011–12, though even this uses different data sources over time (see sources at the end of this Observation for further details). This shows a 10% real-terms fall in allocated spending per pupil up to 2018–19. However, spending per pupil was partly depressed from 2017 onwards as a result of a long-running dispute on teacher pay and conditions. The annual teacher pay awards for September 2017 and September 2018 were not agreed until April 2020 and only paid to schools and teachers as back-pay from 2020–21 onwards. The awards for 2019 and 2020 were then agreed in March 2021, with back-pay funding included for 2021–22. This delay in agreeing teacher pay levels will have led spending per pupil to be depressed in 2017–19 and increased for 2020 and 2021. However, the spending levels presented in Figure 1 will reflect the teacher salaries that were actually paid in those years and which would have been advertised to would-be teachers. In this sense, the figures are still an important measure of the resources available to schools in those years.
This back-pay and other funding increases then led to a 9% real-terms increase in spending per pupil between 2018–19 and 2021–22. Despite these increases, planned spending per pupil is due to be about £6,400 per pupil in Northern Ireland in 2021–22, about 3% lower than in 2011–12.
It is important to note that this reflects the planned budget for 2021–22, which could be added to during the year. Indeed, actual spending levels ended up about £30 million and £70 million higher than planned in 2018–19 and 2019–20, respectively.
Summary
In summary, school spending per pupil fell across all four nations of the UK from about 2010 onwards. This decline extended to 2018 for England, Wales and Northern Ireland, but only up to 2014 in Scotland. More recently, we have seen increases in school spending per pupil across all four nations. In Scotland and Northern Ireland, this partly reflects backdated increases in teacher pay.
In Scotland, there have been wider increases in school spending. Whilst figures for 2021–22 include (potentially temporary) COVID-related spending, underlying school spending per pupil in Scotland is still likely to be over 6% higher in real terms than in 2009–10 and over £900 higher than in the other three nations of the UK. This represents a significantly higher level of school spending as compared with the other three nations.
In England, Wales and Northern Ireland, school spending per pupil in 2021–22 is expected to be just above or just below where it was in 2009–10. This is a remarkable squeeze on school resources over more than a decade.
In response to the pandemic, all four nations have implemented education recovery or catch-up programmes amounting to about £200–£400 per pupil in total. However, these fall short of the scale of the package reportedly recommended by the Education Recovery Commissioner and are much lower than the ambitious packages announced in other high-income countries such as the US (£1,800 per pupil) and Netherlands (£2,100 per pupil). Squeezes in core school spending per pupil over the last decade in England, Wales and Northern Ireland will make it that much harder for schools to address the major challenges and inequalities they face in the wake of the pandemic.
Source to Figure 1
Figures for England taken from figures 1.1 and 1.2 in Sibieta (2021), plus planned funding through the teachers’ pension employer contribution grant as detailed in the 2019 Spending Round (https://www.gov.uk/government/publications/spending-round-2019-document/spending-round-2019). Total school spending for Wales taken from StatsWales, ‘Education revenue expenditure’ (https://statswales.gov.wales/Catalogue/Local-Government/Finance/Revenue/Education), with 2020–21 and 2021–22 nowcasted based on Welsh Government, ‘Local authority budgeted expenditure on schools’ (https://gov.wales/local-authority-budgeted-expenditure-schools-april-2020-march-2021, https://gov.wales/local-authority-budgeted-expenditure-schools-april-2021-march-2022). Number of full-time-equivalent pupils in state-funded schools taken from Welsh Government, ‘Schools’ census results’, 2010, 2012, 2017 (https://gov.wales/schools-census-results-january-2017) and 2020 (https://gov.wales/schools-census-results-january-2020). Pupil numbers for January 2021 and 2022 are projected based on Stats Wales, ‘Pupil projections’ (https://statswales.gov.wales/Catalogue/Education-and-Skills/Schools-and-Teachers/Schools-Census/Pupil-Projections).
Total school spending for Scotland is based on net revenue spending on schools plus all education-related specific grants from central government (specific grant figures relate to schools in 2009–10 and 2010–11, but also include the relatively small number of non-schools education specific grants from 2011–12 onwards). These figures were kindly supplied by the Scottish Government on a consistent basis from the underlying data for the ‘Scottish Local Government Financial Statistics’ 2009–10 to 2019–20 (https://www.gov.scot/collections/local-government-finance-statistics/). Figures for revenue education spending for 2020–21 and 2021–22 taken from ‘Local government provisional outturn and budget estimates’ (https://www2.gov.scot/Topics/Statistics/Browse/Local-Government-Finance/POBEStats). We assume a constant cash-terms level of specific grants from 2019–20 onwards. Full-time-equivalent pupil numbers calculated as the sum of pupils in state-funded schools and early education centres (https://www.gov.scot/publications/summary-statistics-schools-scotland-2020/), with September 2021 pupil numbers forecast based on ONS population forecasts for children aged 0–15 (https://www.nomisweb.co.uk/datasets/ppsyoa).
Total spending for Northern Ireland defined as the General Schools Budget for 2011–12 to 2016–17 as detailed in the Salisbury Review (https://www.education-ni.gov.uk/publications/independent-review-common-funding-scheme-1) and Northern Ireland Audit Office, The Financial Health of Schools (https://www.niauditoffice.gov.uk/publications/financial-health-schools-0), the Aggregated Schools Budget plus the Education Authority Block Grant and Education Authority Earmarked Budgets as detailed in the Department for Education Annual Report and Accounts for years ending March 2018, 2019 and 2020, Department of Education, ‘DE budget 2020–21’ (https://www.education-ni.gov.uk/publications/de-budget-2020-21) and ‘DE budget 2021–22’ (https://www.education-ni.gov.uk/publications/de-budget-2021-22). Northern Ireland pupil numbers relate to full-time-equivalent pupils at all schools, excluding independent schools and pre-school Sure Start centres (https://www.education-ni.gov.uk/publications/school-enrolments-northern-ireland-summary-data).
HM Treasury GDP deflators, September 2021 (https://www.gov.uk/government/statistics/gdp-deflators-at-market-prices-and-money-gdp-september-2021-quarterly-national-accounts), assuming a constant rate of inflation between 2019–20 and 2022–23.
Authors

Luke Sibieta
Luke is a Research Fellow at the IFS and his general research interests include education policy, political economy and poverty and inequality.
More from IFS
Understand this issue


Policy analysis


Academic research


