
Downloads
Download report here
PDF | 591.93 KB
Executive summary
School effectiveness measures can play a vital role in informing parental decision-making, promoting high teaching standards, identifying best practices and addressing educational inequality. One challenge with measuring schools’ effectiveness is accounting for what can be large differences in their pupil intakes: for example, simply comparing the average test scores in different schools is unlikely to provide a fair assessment of how well they foster pupils’ attainment.
To get around this challenge, for most of the past two decades England has used ‘value added models’ as one measure of secondary school effectiveness. Instead of comparing pupils’ raw test scores at the end of secondary school, these models adjust the scores for previous levels of attainment and often other pupil characteristics, to measure the amount of progress that pupils in different schools make. In England, the value added measure that is currently used is known as ‘Progress 8’. Its most notable feature is that it only adjusts for previous levels of attainment, measured through National Curriculum tests at the end of Key Stage 2 (commonly known as Year 6 SATs scores).
Using value added models to measure school effectiveness can be controversial: critics claim that they might fail to adjust properly for differences in student characteristics. In our new research, we evaluate how well value added models such as Progress 8 perform in practice, by exploiting randomness in the school admissions process and comparing how well value added models predict outcomes of students who are affected by that randomness.
We find that:
- Adjusting secondary school test score outputs for prior test scores of their students is crucial. Our research confirms the common view that raw measures of school performance, such as average GCSE scores, do not accurately capture the true effectiveness of a school. This is because they fail to account for the fact that more academically capable students are more likely to attend certain schools.
- Progress 8 is a reliable measure of school effectiveness. Contrary to some beliefs, we do not find sufficient evidence to reject the claim that Progress 8, the value added measure used in England, gives a good indication of the true impact schools have on pupil attainment.
- The case for replacing Progress 8 with something else is weak. It has been argued that the UK government should move to more complex value added measures that adjust not only for SATs results, but also for student characteristics such as eligibility for free school meals, gender and ethnicity. However, we do not find much evidence that these additional adjustments would improve estimates of school effectiveness over and above Progress 8. Although such measures do not perform worse, they would come at a cost in terms of transparency, making it harder for schools to work out for themselves how well they are performing and to benchmark against others.
One reason measures of school effectiveness such as these might matter is that they may shape parents’ decisions on where to send their children. In the second part of our research, we examine how parents value school effectiveness in deciding which secondary schools to apply to.
We find that:
- Parents do not consistently apply to their most effective local school. We observe large gaps in the value added of parents’ first-choice schools and the most effective school in the local area. This suggests factors beyond school effectiveness, such as distance or peer composition, influence their decision-making process.
- This is especially true for parents from poorer backgrounds. The first-choice school of parents from the top fifth of the socio-economic status (SES) distribution (excluding those who did not apply for a state secondary school) is at approximately the 67th percentile of the distribution when ranking schools on value added. If parents were to choose the most effective school within 3 kilometres of their home, this would increase to the 91st percentile. Meanwhile, the first-choice school of parents from the bottom fifth of the SES distribution is only at the 45th percentile. If they were to select the most effective school within 3 kilometres of their home, they would also apply on average to schools in the 91st percentile.
- This suggests there is potential for gaps in access to good schools and for gaps in achievement to be narrowed if application patterns were to change. SES gaps in the effectiveness of first-choice schools could plausibly be removed entirely, and this could result in a reduction in the gap in access to effective schools. This suggests that influencing parents’ application patterns could be an effective area to target for policymakers intending to narrow gaps in GCSE attainment.
1. Introduction
Measuring school effectiveness is hugely important for guiding parental decision-making, fostering high teaching standards, identifying best practice and improving educational equality. The limitations of using average test scores as a measure of school effectiveness are widely acknowledged among experts, as variation in student characteristics across different schools can lead to misleading interpretations. For instance, a school situated in an affluent area with highly engaged parents may achieve impressive GCSE results, masking potential shortcomings in teaching quality.
To address this concern, ‘value added’ measures of school effectiveness have been employed in varying degrees in England since the early 2000s. These measures aim to capture true school effectiveness by adjusting school test score outcomes for prior student achievement and potentially additional demographic factors.
The measure currently used by the UK government for English secondary schools is Progress 8. This is a controversial measure as it only adjusts for Year 6 SATs scores, obtained in the last year of primary school. This has the advantage of keeping the measure simple, while not imposing limits on achievement based on background, ethnicity or gender1 . However, adjusting for prior attainment alone may not generate reliable estimates of true school effectiveness.
In this report, we provide new empirical evidence on this issue. We evaluate the reliability of Progress 8 as a measure of genuine school effectiveness, comparing it with alternative effectiveness measures that have previously been, or could easily be, implemented in the UK. Gaining clarity on this issue is of significant policy importance in England, given the high visibility and influence of Progress 8.
We start by explaining how school effectiveness is measured and how the validity of such measures can be assessed, before explaining how we assess validity within the English context. Our findings from this exercise suggest we are able to accurately measure school effectiveness.
In Section 5, we draw upon this result to consider the broader issue of whether parents prioritise school effectiveness when applying to secondary schools.
2. Value added measures
A simple way to measure school effectiveness is to take the average scores from tests sat at the end of school (we refer to this later as the ‘raw scores’ method, using GCSE scores as our end-of-school test). However, a key problem with this method is that it does not account at all for differences in the composition of students admitted by each school. This would be problematic if, for example, a school admits a high proportion of high-ability students who are likely to do well in their end-of-school test scores regardless of the quality of the school.
Value added measures try to account for this issue by adjusting school test score outcomes for the prior attainment of the pupils. A simple value added measure for a school in a given year is constructed as follows:
For each pupil, calculate a prediction of their test score at the end of school (e.g. their GCSE score), based on their test score prior to entering the school (e.g. their Year 6 SATs score).
For each pupil taking end-of-school tests, subtract their predicted score from their actual score in the test.
Take the average of this across all pupils in a given year group at the school.
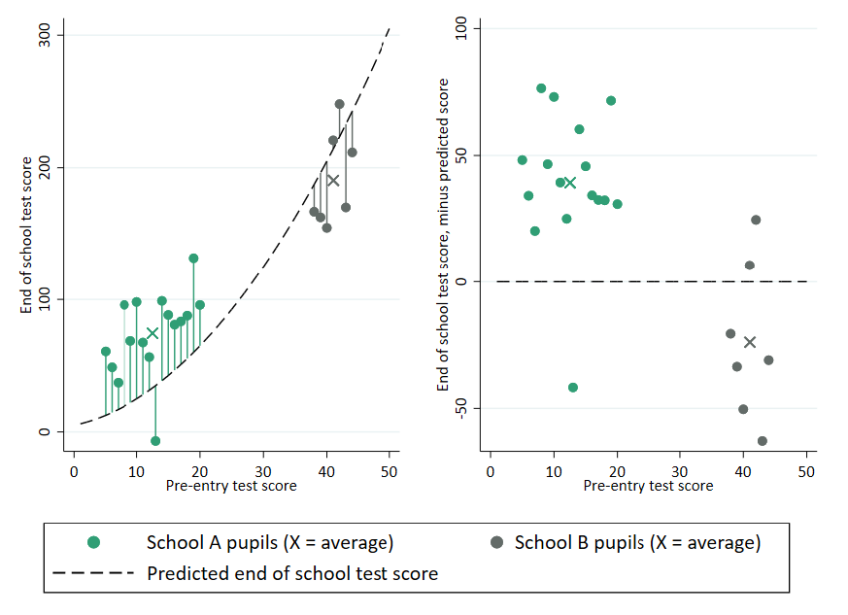
This concept is illustrated visually in Figure 1. Each dot in the chart is an individual pupil. The green dots are pupils in School A and the grey dots are pupils in School B. The left-hand chart shows each pupil’s end-of-school test scores plotted against their pre-entry test score, with the school average given by the crosses.2
If we were comparing the two schools on end-of-school test score outcomes alone, School B would look considerably better than School A. However, we can see from the plot that School A admits students with much lower pre-entry test scores. Such pupils have lower predicted end-of-school test scores (shown by the black curve in the left-hand chart), and thus relative to their predicted scores, pupils in School A actually perform better than pupils in School B. This is shown more clearly in the right-hand plot of Figure 1, which presents the end-of-school test score minus the predicted score – here it can be seen that almost all of the pupils in School A performed better than their predicted score, while almost all of the pupils in School B performed worse than their predicted score.
Figure 1. Illustrative plot highlighting the construction of value added measures
Value added models vary in terms of how they calculate predicted test scores. Progress 8, which since 2016 has been the most prominent value added model used in the evaluation of English secondary schools, divides all secondary pupils in the country into 34 groups based on their Year 6 SATs scores. The ‘predicted score’ is then the average score amongst everyone in the same group.3 This approach is often referred to as a ‘non-parametric’ approach.
An alternative way to predict test scores is to allow the predicted score to change more smoothly with past test scores, like the black curve does in Figure 1. Later we will also assess an approach like this, referring to it as the ‘lagged scores’ approach4 .
Finally, it is possible to combine value added measures with additional pupil demographics. These ‘contextualised value added’ (or CVA)5 approaches make different predictions for pupils with different demographic characteristics, to allow for the fact that pupils from different groups might make different amounts of progress even if they start out at the same level (e.g. if boys mature later than girls, schools with more boys might struggle relative to schools with more girls). If we were to show this visually, the black line in Figure 1 would follow a different curve for each combination of background characteristics (and, to continue with the previous example, it might be lower for boys than it is for girls, on average).
Despite its widespread use, Progress 8 has faced criticism, primarily due to its failure to adjust for student characteristics beyond their SATs scores. However, the question remains as to whether this omission significantly impacts the reliability of school effectiveness estimates. Later, we will compare the performance of Progress 8 and alternative measures of school effectiveness, including the raw scores approach, the lagged scores approach and the contextualised value added approach.6 However, before doing that we need to describe our approach to evaluating the measures.
3. Methods for evaluating school effectiveness
Comparing measured effectiveness with actual results
If measures for school effectiveness are accurate, then they should tell us by how much schools change children’s test scores. If School A is 10% more effective than School B, then on average the same child should score 10% higher in their tests if they attend School A than they would have done if they had attended School B.
With a large enough group of children on the margin between Schools A and B, this intuition gives us a method to test the validity of measures of school effectiveness, by comparing the actual difference in test scores against the differences that are predicted by the effectiveness measure.
To measure this, researchers take the ratio between the actual difference in test scores and what would have been predicted. The further apart these numbers are, the smaller the ratio and the less reliable the measure of school effectiveness.
Formally, these tests are grounded in a single parameter represented by 𝛽 in the following equation, commonly referred to as the ‘forecast coefficient’:
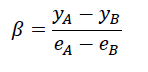
Here, 𝑦𝐴−𝑦𝐵 is the difference in observed test scores between children allocated to School A and children allocated to School B, and 𝑒𝐴−𝑒𝐵 is the difference in estimated effectiveness between School A and School B (e.g. the difference in Progress 8 scores between the two schools).
Quasi-random variation in school attended
For these tests of measured school effectiveness to make sense, we need to ensure that they compare pupils at School A and School B with very similar characteristics (on average). The ‘gold standard’ way to ensure this would be to randomly assign pupils to schools: this experimental design would equalise pupil intakes and allow researchers to precisely measure a school’s effectiveness.
However, fully randomly allocating pupils to schools is often not practical in the real world. Researchers therefore look for policy features that work to allocate pupils to schools quasi-randomly, or at least in a known way that is independent of the pupil’s own characteristics. In the United States, oversubscribed schools often run lotteries to determine admission, randomly allocating some pupils into the oversubscribed ‘focal’ school, while assigning others to their fallback school.7
This approach was not practical for our study,8 but there is another aspect of the English system that generates some randomness in school attendance which we were able to exploit. Specifically, in cases where secondary schools are oversubscribed, the distance between a student’s home address and the school is often used as a final tiebreaker to determine admissions. Because the precise cut-offs change from one year to the next with demand for schools, it is difficult for parents to precisely game the system by locating just on one side or the other of the eventual cut-off.
We leverage this source of variation by collecting data from secondary school admissions brochures published by local authorities between 2007 and 2012, using a combination of web searches and Freedom of Information requests. These data include information on which schools employed distance as a tiebreaker and the specific distances used. We then match this information with individual-level administrative data for all secondary pupils in England. Our analysis focuses on approximately 100 schools where we observe sharp drops in attendance precisely at the reported distance cut-offs found in the brochures.9
Robustness of cut offs and absence of manipulation: supporting evidence
We make the case that it is unlikely that these cut-offs can be manipulated by parents through three main arguments.
First, we present a logical argument demonstrating the difficulty in predicting the precise location of the cut-offs. School admissions are determined by a central algorithm that allocates children to schools based on parents’ applications. This algorithm considers various factors, including special educational needs status, presence of siblings in the school, and sometimes distance when the number of children allocated to a school exceeds available spots. The specific distance used depends on the number and distribution of applications in a given year, making it impossible for parents to predict the exact cut-off in advance. Consequently, parents cannot purposefully choose to reside just inside the cut-off to ensure admission.
Figure 2. Cut-off distances over time
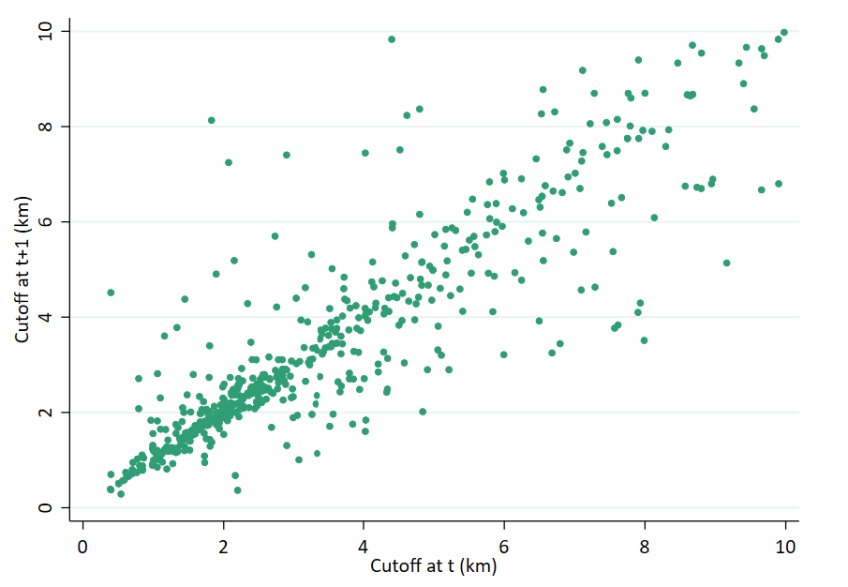
Second, in support of the previous argument, we illustrate the fluctuation of these cut-offs over time. Figure 2 presents this by plotting the relationship between cut-off distances in one year (labelled ‘t’), with the next year (labelled ‘t+1’) for schools with multiple reported cut-offs in our dataset. Out of the 1,072 data points available for comparison, only 26 observations (2%) are the same in both years. Furthermore, when examining longer intervals, we find that only 18 cut-offs remain the same at t and t+2, nine are the same at t and t+3, and none persist at longer intervals.
Third, we analyse student characteristics on both sides of the cut-offs to assess the presence of observable differences. We employ regression discontinuity models to examine potential discontinuities in characteristics such as prior test scores, eligibility for free school meals, and ethnicity at the reported cut-offs. Our analysis yields no significant results, suggesting the absence of selection based on observable characteristics between residing just inside or just outside the distance cut-off.
Which schools were selected?
The subset of schools exhibiting significant attendance discontinuities is not representative of all schools in the country. These schools, primarily located in densely populated areas such as London and Birmingham, tend to have a higher proportion of ethnic minority students and students with English as an additional language. On average, they also demonstrate better student outcomes and higher average effectiveness scores. These differences do not invalidate our approach, but they do raise questions about the ‘external validity’ of our findings (i.e. whether the findings apply for all schools, rather than just those in our study). However, it is not obvious why our approach would yield valid estimates for some types of schools but not others, so we are cautiously optimistic about this.
4. Our estimates of validity
We utilise this quasi-experimental variation to assess the bias in five measures of school effectiveness. These are:
(a) Raw scores: average student scores based on their best eight GCSE results, including English and maths, where best eight scores are converted into a single GCSE points score for each pupil.
(b) Demographics: the average of student scores minus their predicted scores, where predictions vary based on student demographic characteristics.10
(c) Progress 8: the average of student scores minus their predicted scores, where predicted scores are calculated non-parametrically as the average scores of people with similar end-of-Year-6 SATs scores.11
(d) Lagged scores: the average of student scores minus their predicted scores, where predicted scores are calculated parametrically via a regression model, based only on Year 6 SATs scores.12
(e) Contextualised value added (CVA): the average of student scores minus their predicted scores, where predicted scores are calculated parametrically via a regression model, based on Year 6 SATs scores and student demographic characteristics.
Figure 3 presents our estimates of the forecast coefficient for each of these measures, comparing each of them with the benchmark value of 1 (which would mean that the school effectiveness measure is perfectly accurate). In each case, the vertical bars capture the range of certainty for the estimate. Crucially, we use this to determine whether an estimate is statistically significantly different from 1.
Our findings strongly indicate that measures of school effectiveness that do not adjust for prior attainment (measures (a) and (b) in the above list) are biased, with a forecast coefficient of around 0.5.
Figure 3. Forecast coefficient tests for different effectiveness measures
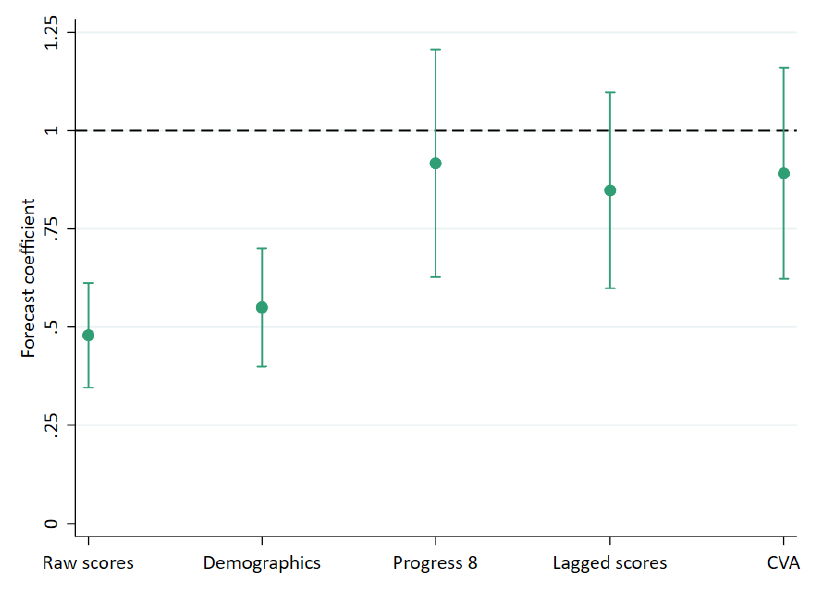
Note: A measure is considered to be biased if it is significantly different from 1.
Source: Office for National Statistics.
Measures that control for prior attainment perform far better. Both the Progress 8 and lagged scores measures have forecast coefficients of around 0.9 (and not statistically significantly different from 1). This result suggests that the government’s headline Progress 8 measure is a reliable estimator of true school effectiveness. It is no less effective than the more complicated CVA measure shown last in Figure 3. This weakens the case for including additional student demographic controls in the headline measure used by the government.
5. Are parents overlooking value added when choosing schools?
Now that we have established reliable measures of school effectiveness, we can explore the broader question of parental prioritisation of school effectiveness when choosing schools for their children.13 To investigate this, we draw upon 2014 secondary school applications data. Parents apply to secondary school in January of the year of entry and can put down between three and six choices. The data we have include applications for every student in the country who chose to apply to a state secondary school in England. We can see the schools applied to and their preference ordering. We can also link these application records to National Pupil Database records, which include information on the actual school attended, socio-economic background and the school outcomes, enabling us to calculate effectiveness.14
We conduct an exercise to look at how socio-economic inequalities in access to more effective schools reflect differences in where families apply. We document large inequalities in the first-choice schools that families from different backgrounds apply to and show how these would change if parents’ application behaviour was different. Importantly, this does not tell us about the effectiveness of schools that children actually attend. For example, in the extreme scenario where every family applied to the most effective school in the country, that school’s distance-based tiebreakers would kick in, and only a very small minority of children would be able to actually attend the school. But this exercise sheds light on the extent to which socio-economic inequalities show up in the first stage of the school assignment process.
Figure 4 provides a visual summary of our findings, with the precise numbers behind the figure and additional information given in Table 1. The first set of bars in Figure 4 show the average effectiveness of the school selected as the first choice by parents from high (top fifth) and low (bottom fifth) socio-economic status (SES) backgrounds. It reveals a significant gap in the average effectiveness of the first-preference school. The average effectiveness of schools applied to by high-SES parents is 0.55 standard deviations above the mean, which equates to an average percentile rank of 67% (see Table 1). Meanwhile, low-SES parents put down schools that are 0.11 standard deviations below average, equating to a percentile rank of just 45%. The gap between high- and low-SES parents in first-preference schools is therefore 0.66 standard deviations, or 23 percentiles.
Figure 4. Potential achievement gains from ranking schools on effectiveness
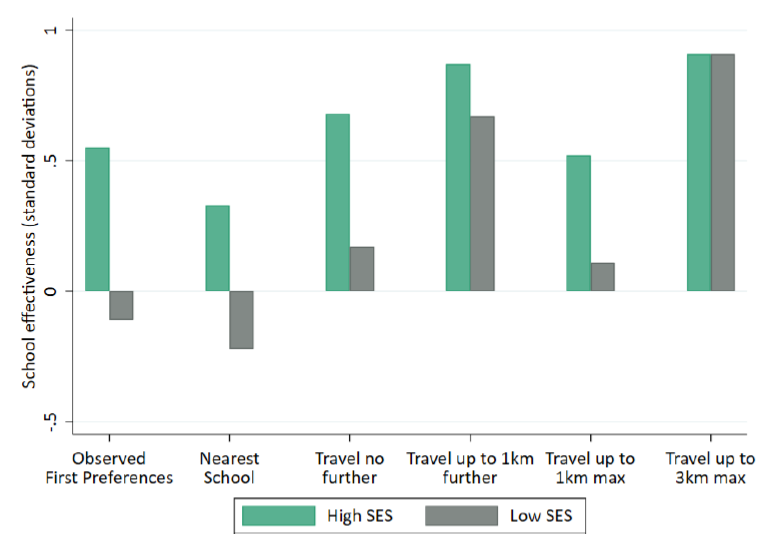
Table 1. Potential achievement gains from ranking schools on effectiveness
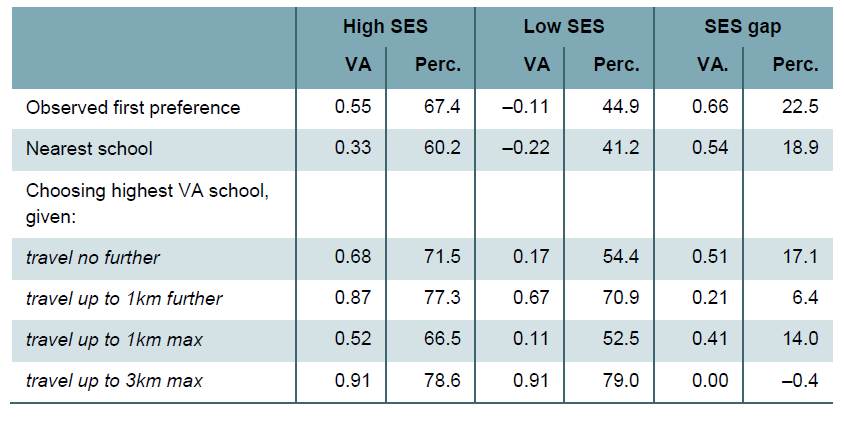
Note: VA is our measure of school effectiveness, standardised to have mean 0 and standard deviation 1 (at the school level). We use CVA as our measure of effectiveness, although we get very similar results with the alternative VA measures. ‘Perc.’ is the corresponding percentile rank of the schools.
Source: Office for National Statistics.
The second pair of bars in Figure 4 and the second row in Table 1 indicate how these numbers would change if everyone simply attended their nearest secondary school (as might happen in a system with no school choice). In this scenario, there would still be a large gap in the effectiveness of schools attended by higher- and lower-SES children of 0.54 standard deviations, or 19 percentiles. This reflects the existing relationship between school quality and housing: higher-SES parents can choose to live near more effective schools, while lower-SES parents tend to live near less effective schools.
However, the overall effectiveness of first-choice schools would drop, as parents would not be able to ‘trade up’ to apply to a more effective but further-away school. And in fact, these drops would be slightly larger amongst more advantaged children, resulting in an overall narrowing of the effectiveness gap from 0.66 (23 percentiles) in the baseline case.
The final four sets of estimates present alternative scenarios in which parents select their most effective local school, with varying definitions of what constitutes ‘local’.
In the first scenario (‘Travel no further’), we restrict the selection to schools that are not further away than the school the child actually attended. This improves the average quality of first-choice schools for both high- and low-SES parents. On average, high-SES parents would be applying to schools that are 0.68 standard deviations above average (roughly the 72nd percentile), compared with 0.55 standard deviations (67th percentile) in the baseline, while low-SES parents would be applying to schools that are 0.17 standard deviations above average (54th percentile), compared with 0.11 standard deviations below average (45th percentile) in the baseline. These are noteworthy differences.
In the next scenario, we allow parents to choose the most effective school up to 1 kilometre further away than the school their child actually attended. Under this condition, the gap in first-choice school effectiveness drops to just 0.21 standard deviations (6.4 percentiles), and both high- and low-SES parents select considerably above-average schools as their first choice.
In the final two scenarios, parents are allowed to apply to the most effective school within a 1km or 3km radius of their homes, respectively. These scenarios also result in significant reductions in SES gaps, with a gap of 0.41 standard deviations (14 percentiles) in the 1km case and no gap in the 3km case.15 The latter case highlights the fact that although lower-SES parents tend to apply to considerably less effective schools on average, there are substantially more effective schools available within plausible travel distances.
These results come with some important caveats. First, lower-SES parents may be strategically (or pragmatically) not applying to certain schools due to limited available slots on their application form, knowing that their chances of securing admission to the most effective school in the area are very low (or perhaps even zero in some extreme cases). Second, it is plausible that lower-SES parents have better information on how effective a school would be for their child, and this is why they do not prioritise schools that perform well on average. Nevertheless, the findings from this analysis are indicative of there being opportunities to narrow socio-economic gaps in attainment by influencing application behaviour so that it prioritises the most effective local schools. The challenge for policymakers lies in devising strategies to influence these behaviours effectively or in addressing issues with the admissions process directly. We discuss this further in the concluding remarks in the next section.
6. Concluding Remarks
Through an innovative approach which leverages variation in school attendance created by school admissions procedures in England, this research assesses the validity of various school effectiveness measures. The findings emphasise the significance of adjusting for prior attainment to generate reliable estimates of effectiveness, highlighting the crucial role of Year 6 SATs in enabling a fair comparison of secondary schools in England.
We demonstrate that controlling for prior attainment alone is sufficient to produce accurate estimates, and we find no compelling evidence to suggest that the government’s current effectiveness measure, Progress 8, is unreliable. Given its relative simplicity, Progress 8 is a usable measure for teachers and schools, leading us to conclude that there is a limited case for reform based on our data.
It is important to acknowledge that our results do not imply that improving academic attainment is the sole purpose of schools. Good schools should contribute to the holistic development of children in various ways, many of which may not be reflected in test scores. Nonetheless, our results indicate that the impact of schools on test scores can be captured by these relatively straightforward models.
Our secondary set of results focuses on parental application patterns and the disparities in applications to effective schools between high- and low-SES parents. We observe significant gaps in the effectiveness of the schools chosen as first choice by parents, with high-SES parents opting for considerably more effective schools. However, we also demonstrate that if parents were to prioritise the most effective school in their local area, these gaps would diminish.
Although there are some important caveats to these secondary findings, we believe the results encourage deeper understanding of the underlying drivers of the application gaps that we observe. One possibility is that parents may lack awareness of school effectiveness16 , which would encourage the use of targeted information campaigns, such as in Ainsworth et al. (2023). Another possibility is that parents are behaving strategically when making their applications, suggesting that reforms to the application system may be necessary to encourage more ambitious application behaviour or that school admission rules should be changed to increase chances of admission for certain types of students to the most effective schools. Lastly, it could be that parents are aware of effectiveness but still choose not to select the most effective school, due to their strong preferences for close proximity (Burgess et al., 2015) or other preferences that are more challenging for policy to influence. Understanding the underlying reasons behind these dynamics is crucial for informing effective policy interventions.
Endnotes
Authors

Jack Britton
Jack's main interests lie in human capital accumulation and discrete choice dynamic modelling.

Damon Clark
Damon is an Assistant Professor in the Department of Economics at the University of California and a Research Fellow at the IFS.

Ines Lee
Ines is a Research Fellow at IFS and an Assistant Professor in Economics at the University of York.
More from IFS
Understand this issue


Policy analysis


Academic research


