
Downloads
Download the report as a PDF
PDF | 2.98 MB
Executive summary
In recent years, there has been a large increase in health-related benefit claims in England, the underlying causes of which are still not well understood. The concurrent increase in NHS waiting lists and waiting times has been suggested as one possible contributing factor. In this report, we present – to our knowledge – the most detailed analysis to date of the relationship between NHS waits and health-related benefit claims in England. We develop a methodology to estimate NHS waiting lists and waiting times for elective (pre-planned) hospital care at a narrower geographic level than previously possible. This allows us to compare local changes in NHS waiting lists and waiting times with local changes in the number of claims for disability and incapacity benefits by adults of working age.
Although the nature of our analysis means that we cannot conclusively and definitively rule out a relationship between the two, our findings strongly indicate that increases in NHS waiting times and waiting lists for pre-planned hospital treatment and some mental health treatment have not been a major factor behind the large increase in the number of working-age adults claiming health-related benefits.
Key findings
- Between November 2019 and May 2024, the number of working-age adults receiving health-related benefits in England increased by around 40%. Over the same period, the size of the NHS waiting list for pre-planned hospital care grew by 67% from 4.6 million to 7.6 million, and the mean ‘incomplete’ waiting time (the average amount of time those still on the list have been waiting) increased by 86% from 10 weeks to 19 weeks. It has been suggested that these two phenomena might be linked, and that deteriorating NHS performance has contributed to the recent increase in claims for health-related benefits.
- Our analysis shows that at the local level, there is no clear relationship between changes in NHS waits and changes in working-age health-related benefit claims. We examine the relationship between multiple measures of NHS waiting lists or waiting times (including for NHS talking therapies, as well as for pre-planned hospital care), and multiple measures of health-related benefit claims (including those for both disability and incapacity benefits, and for different health conditions). In the vast majority of cases we examine, we find no evidence of a meaningful relationship between the two: areas that experienced larger increases in NHS waits did not, on average, experience larger increases in the number of working-age adults receiving health-related benefits. This is especially true when we account for differences in population growth across areas.
- In a small number of cases, we do find evidence suggestive of a weak positive relationship. In particular, there is a slight positive relationship between the NHS elective waiting list and the number of disability benefit claims for mental health conditions, and between the waiting list for NHS trauma and orthopaedic care (e.g. joint replacements) and disability benefit claims for musculoskeletal conditions. The magnitude of any effect is small: in the case of mental-health-related disability benefit claims, our estimates suggest that NHS waits could perhaps explain 6–7% of the increase; in the case of musculoskeletal disability benefit claims, perhaps 7–8%. Further, these numbers must be interpreted with caution: the positive relationship disappears when we use alternative measures of the NHS elective waiting list and waiting times (those estimated for working-age adults only). And, importantly, there is good reason to suppose that they are an overestimate of the ‘true’ impact: we may simply be capturing the fact that areas in which people’s health deteriorated by more experienced simultaneous increases in the number of people joining the waiting list for NHS care and in claims for health-related benefits, without one having caused the other.
- The breadth and consistency of our results lend weight to the conclusion that NHS performance – at least as captured by measures of waits for pre-planned hospital care and some forms of mental health care – has not been a major factor behind the large increase in the number of working-age adults receiving health-related benefits. We do not examine and cannot rule out a role for deteriorating performance in other parts of the NHS, such as primary, community or emergency care.
- This analysis is subject to caveats. It nonetheless represents what we believe to be the most comprehensive analysis of this question in the UK to date, and the best that we think can be done with the data that are currently available. Our findings imply that reductions in waiting lists and waiting times, while welcome in their own right, would be unlikely to lead to a meaningful reduction in health-related benefit claims, and that further research is desperately needed to understand what factors are in fact driving increasing claimant numbers.
1. Introduction
The number of people receiving health-related benefits has increased substantially in recent years. These benefits can be split into disability benefits, which supplement incomes for those whose cost of living is deemed higher as a result of their disability, and incapacity benefits, which are paid to those with low means whose health is deemed to limit their ability to work. The number of working-age adults in England claiming disability benefits increased from 1.9 million in November 2019 to 2.7 million in May 2024, while the number of people claiming incapacity benefits increased from 2.0 million to 2.9 million. This trend appears to be something of a UK-specific phenomenon, with no sign of a similar increase in any obvious comparator countries (Latimer, Pflanz and Waters, 2024). Spending on these benefits has also surged, adding to the broader pressures on the public purse. The government has recently announced major reforms to benefits aimed at holding down the ‘spiralling health and disability benefits bill’ (Department for Work and Pensions, 2025a). Yet our understanding of what is driving these trends remains partial, at best.
Recent research at IFS has explored the extent to which a worsening of population health since the start of the pandemic may have contributed to rising health-related benefit claims (Latimer, Ray-Chaudhuri and Waters, 2025). This found that a range of evidence sources pointed to a deterioration in population mental health, likely contributing to rising mental-health-related benefit claims. However, for physical health, the available evidence is considerably less clear and more mixed. In this report, we examine whether worsening NHS performance, and specifically longer waiting times and waiting lists for elective and some forms of mental health treatment, could explain some of the increase.
This is relevant for understanding recent trends but also for policy: Wes Streeting, the Secretary of State for Health and Social Care, has expanded the focus of the DHSC to boosting economic growth, arguing that ‘by cutting waiting lists, we can get Britain back to health and back to work’, and has announced an initiative where ‘crack teams’ are sent to reduce waiting lists in areas with high levels of economic inactivity (a related, though distinct, challenge to the increase in health-related benefit claims) (Department of Health and Social Care, 2024 and 2025). A recent Green Paper (Department for Work and Pensions, 2025b) argued that ‘the declining health of the population has contributed to a rise in the number of people claiming incapacity and disability benefits. This has been further impacted by long NHS waiting lists. These have led to people going untreated for longer, reducing earlier interventions that could have helped them manage their health condition better, prevent longer-term sickness and support more timely reintegration back into work.’
To answer the question of whether longer waiting times and waiting lists could explain some of the increase in health-related benefit claims, we develop a new methodology to estimate NHS waiting times and waiting lists at a very local level in England. We then examine the relationship between local area changes in NHS waiting times and local area changes in health-related benefit claims by working-age adults in England. That is, we assess whether the areas that have seen bigger increases in hospital waiting times have also seen bigger increases in the number of people claiming health-related benefits. Due to the nature of this analysis, we cannot establish conclusively whether longer NHS waiting times have a causal impact on benefit claims. Nonetheless, we provide what is – to our knowledge – the most convincing evidence to date, at the most granular level possible with existing data in England.
We find no evidence consistent with longer NHS waits for pre-planned hospital treatment and some forms of mental health care having played a major role in increasing the number of health-related benefit claims. We perform a large number of analyses, and in the vast majority of cases find no evidence of a relationship between changes in NHS waits and changes in benefit claims. In a small number of cases, we do find some evidence suggestive of a weak positive relationship, but this relationship disappears when we use more recent measures of the NHS elective waiting list for working-age adults only, and it could in any case simply reflect the fact that areas in which people’s health deteriorated by more experienced simultaneous increases in demand for NHS care and in claims for health-related benefits. Taking all our results together, we conclude – with caveats – that the NHS waits we consider in this report have not been a significant driver of rising health-related benefit claims, and that the main explanations for rising claimant numbers almost certainly lie elsewhere.
Our analysis builds on a range of previous work. The Office for Budget Responsibility (OBR) has examined the various factors that could explain the rise in health-related inactivity (a trend potentially closely related to the rise in health-related benefit claims). Its 2023 Fiscal Risks and Sustainability Report (Office for Budget Responsibility, 2023) concluded that ‘the rising NHS waiting list itself looks unlikely to have been a significant causal driver of rising long-term sick inactivity in recent years’. This is for three reasons. First, the large majority of people on the NHS elective waiting list are either not of working age or are in paid work (only around one-eighth of those on the list are working-age adults inactive for health-related reasons). Second, the NHS waiting list has relatively fast turnover, unlike health-related inactivity. Third, the age groups and health conditions that have experienced the largest rises in health-related benefit claims are not the same as the age groups that have experienced the largest increases in waiting list size. As a result, the OBR concluded that ‘the contribution of bringing down the NHS waiting list to raising participation is likely to be relatively small’. However, it cautioned that while the NHS waiting list itself is unlikely to have played a significant role, it may be that wider disruption to NHS activity still has an impact.
More recent work by the Department for Work and Pensions (2025c) finds that many of those claiming health-related benefits are also waiting for NHS treatment. It estimates that 41% of health-related benefit claimants are on a waiting list for treatment for their health condition and that 50% of claimants who are out of work but do not rule out work permanently say their ability to work was in part dependent on receiving treatment. This could be interpreted as suggesting that waiting times play an important role. However, there are many other factors that claimants report as preventing them from finding paid work, with the average respondent agreeing with 6 of the 18 barriers presented to them in the survey. These other factors include that work would make their health condition worse (76% of claimants who do not rule out work permanently agreed), that it is difficult to travel to work with their health condition (also 76% of those claimants), that their health condition fluctuates too much (70%) and that they are worried that people will not employ them because of their health condition (69%). For these and other reasons, it does not necessarily follow that obtaining NHS treatment would on its own be sufficient for these respondents to then find work.
There is also international evidence on the effects of waiting for healthcare on labour market outcomes. Godøy et al. (2024) use administrative data on orthopaedic surgery in Norway and find that spending longer waiting for treatment is associated with an increase in health-related absences from work and receipt of disability benefits. In particular, an additional 10 days of waiting for treatment increases the probability that a patient has entered Norway’s permanent disability programme by 0.4 percentage points after five years. This is driven entirely by individuals who were already on sick leave at the time of referral for treatment. It is not possible to conduct a similar exercise in the UK due to data limitations.
Our work complements the existing UK policy evidence by examining whether changes in health-related benefit claims at a local level are correlated with changes in local NHS waiting lists and waiting times. This does not capture the overall effect of worsening NHS performance over this period, but will capture whether a relatively larger increase in waiting times is associated with a relatively larger increase in health-related benefit claims. We also build on the existing international evidence by focusing on waiting times for a broader set of physical – and mental – health treatments in the post-pandemic period.
The rest of this report is organised as follows. Section 2 discusses how health-related benefit claims have changed over time and by area, which Section 3 repeats for the NHS elective and mental health waiting times. Section 4 explores the relationship between increases in health-related benefit claims and the NHS elective waiting list and waiting times. Section 5 explores the relationship between increases in health-related benefit claims and NHS mental health waiting times. Section 6 concludes.
2. How have health-related benefit claims changed over time and by area?
In this report, we focus on health-related benefits claimed by working-age adults in England (defined here as those aged between 16 and 64), the group that has seen a particularly pronounced increase in claims and that has been the focus of recent policy reforms. These benefits can be split into two types. First are disability benefits, which are designed to support the higher living costs experienced by people with disabilities. The main working-age disability benefit is personal independence payment (PIP), which provides financial support to those with a long-term health condition that causes difficulty doing everyday tasks or travelling. PIP is not means tested, nor is it related to whether or not the claimant is in paid work, and the amount received is not taxable.1
The second type of health-related benefit is incapacity benefits. Incapacity benefits are designed to support the incomes of people of limited financial means whose disabilities limit their capacity to work. The main incapacity benefit for working-age adults is the health element of universal credit (UC), which tops up claimants’ UC awards.2 Unlike disability benefits, this is means tested. It is possible to claim both disability and incapacity benefits simultaneously. In May 2024, for example, around two-thirds of working-age adults in England claiming disability benefits were also claiming incapacity benefits and vice versa.
Figure 1 shows the substantial increase in the number of working-age adults receiving these health-related benefits in England since 2019 (our period of analysis).3 Between November 2019 and May 2024, there was a 41% increase in the number of working-age adults receiving disability benefits and a 40% increase in the number receiving incapacity benefits. This is equivalent to an additional 0.8 million disability benefit claims and 0.8 million additional incapacity benefit claims.4
Figure 1. Number of working-age adults receiving health-related benefits in England since 2019
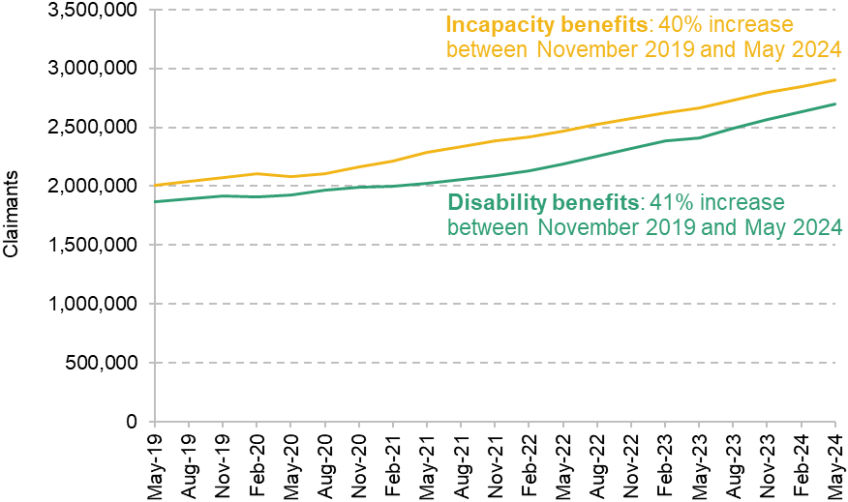
Note: Disability benefits refer to personal independence payment and disability living allowance. Incapacity benefits refer to the health component of universal credit, employment and support allowance, incapacity benefit, severe disablement allowance and income support on the basis of incapacity. Incapacity benefits include a small number of non-working-age adults.
Source: Authors’ calculations using DWP Stat-Xplore data (various).
While the national increase in claimants is large and important, in this report we focus on the differences in the extent to which claims have increased across different local areas. For our primary analysis, we focus on small local areas, called Middle-layer Super Output Areas (MSOAs). These are a statistical unit of geography which consist of around 5,000–15,000 people. There are close to 7,000 MSOAs in England.
Figure 2 shows the distribution of increases in health-related benefit claims between November 2019 and May 2024 across MSOAs. Almost all areas have experienced an increase in both disability and incapacity benefit claims, but there is a large degree of variation. Starting first with disability benefits, the median increase was 40%, while the 10th percentile was 24% and the 90th percentile was 61%. In other words, the 90th percentile MSOA had an increase more than double the increase of the 10th percentile MSOA. For incapacity benefits, the median increase was 40%, while the 10th percentile was 23% and the 90th percentile was 63% – almost three times higher than the 10th percentile increase. For more detail on the geography of recent increases in health-related benefit claims, see Latimer, Pflanz and Waters (2024).
Figure 2. Distribution of changes in health-related benefit claims in England by MSOA
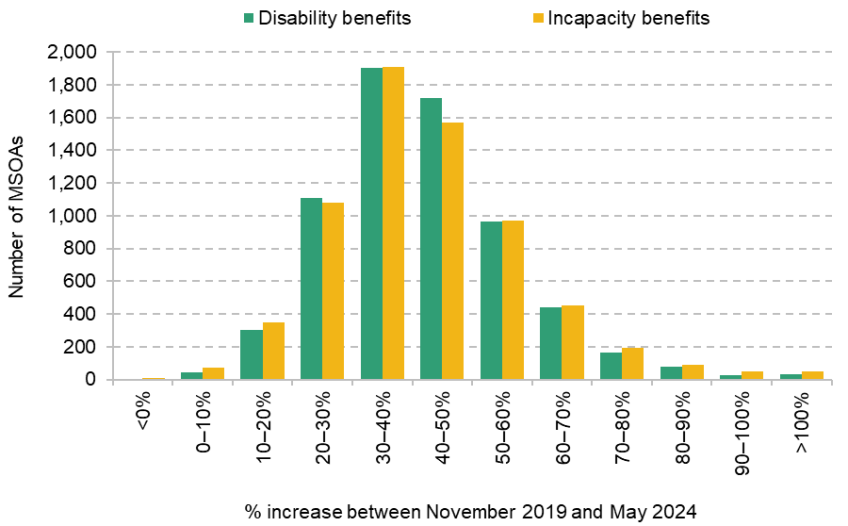
Note: See note to Figure 1 on the included benefits.
Source: Authors’ calculations using DWP Stat-Xplore data (various).
3. How have waiting times changed over time and by area?
We now examine changes in NHS waiting lists and waiting times over time and by area. We first consider changes in waits for elective (pre-planned) hospital activity. We then consider changes in waits for some types of mental health activity.
Elective (pre-planned) hospital care
The NHS elective waiting list covers pre-planned hospital activity – whether that is outpatient hospital appointments or inpatient hospital admissions for surgery.5 It does not include care that is delivered in emergencies (e.g. A&E arrivals or urgent hospital admissions) or care that is delivered in primary care or in the community (e.g. GP appointments or most types of mental health treatment). Patients are defined as starting to wait after they have been referred to the list, usually by their GP. Their waiting is defined as finished when their treatment has substantively started (e.g. they are admitted into hospital for surgery or start a course of outpatient treatment). This is referred to as a ‘referral to treatment’ or RTT waiting time.
National trends
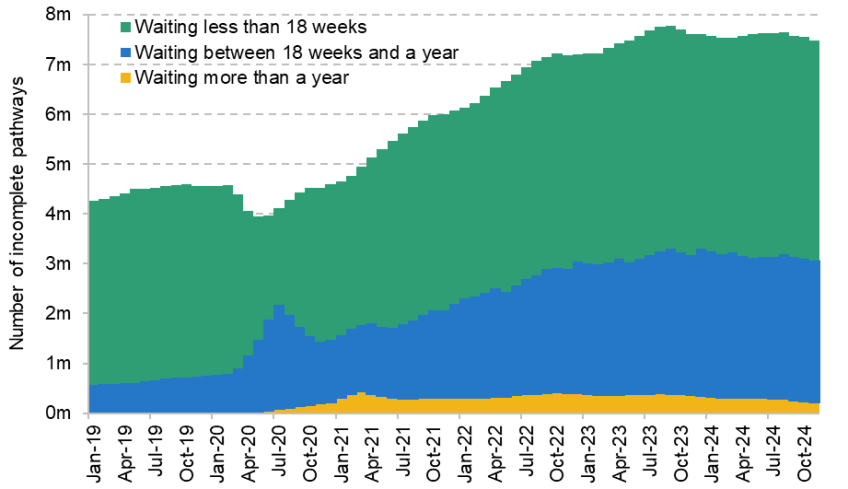
Figure 3 shows changes in the NHS elective waiting list and waiting times for the whole of England. Panel a shows the total size of the waiting list. This has risen from 4.6 million incomplete pathways in November 2019 to a maximum of 7.8 million in September 2023, before starting to fall gradually, reaching 7.6 million in May 2024 (the end of our analysis period).6 Patients can be on the waiting list for multiple treatments at once, and in May 2024 there were 6.4 million unique patients on the waiting list (down from 6.5 million in September 2023). Throughout, we focus on the number of incomplete pathways rather than the number of unique patients waiting.
Figure 3. National NHS elective waiting list and waiting times, over time
a) Waiting list
b) Mean waiting times
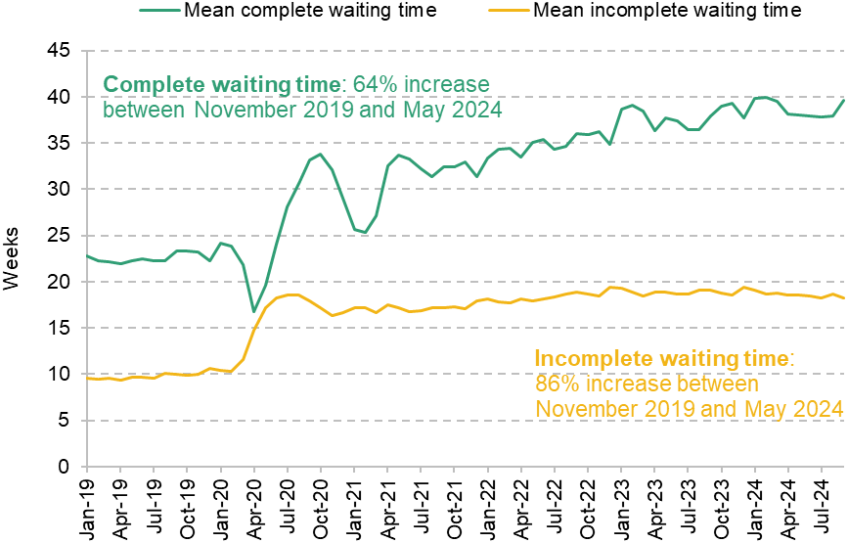
Source: Authors’ calculations using NHS England’s Consultant-led RTT Waiting Times data (various).
Panel b shows mean waiting times.7 There are two ways to measure NHS waiting times. Complete waiting times reflect the time between referral and treatment for patients treated in a given month. Incomplete waiting times reflect the time between referral and the current time for people who are still waiting for treatment at the end of the month. Although these sound like similar measures, both tell us something important – and different – about the times that patients must wait for treatment. Indeed, as the graph shows, the two measures are quite different.
Starting first with complete waiting times, the mean time to wait for treatment has risen from 23 weeks in November 2019 to 38 weeks in May 2024, an increase of 64%. Incomplete waiting times have risen from 10 weeks in November 2019 to 19 weeks in May 2024, an increase of 86%. Intuitively, mean incomplete waiting times are shorter than mean complete waiting times because those who are treated in a given month (those who count towards the mean complete waiting time) are disproportionately likely to have been taken from the front of the queue, having waited a long time for treatment.
Differences across local areas
We next consider how NHS waiting times for elective treatment have changed across different local areas. Unlike the health-related benefits discussed in Section 2, NHS waiting lists and times are not measured and published at the MSOA level. We therefore produce new estimates of MSOA-level waiting lists and waiting times, using methodology set out in Box 1 and Appendix B. This has the advantage of allowing us to consider differences between small areas, and is what allows us to go beyond previous analysis on this topic.
Box 1. How we estimate local area waiting times and waiting lists
To estimate MSOA waiting times, we start with waiting times for each hospital. We then use administrative hospital data to measure which hospitals the individuals living within each MSOA use. We estimate an MSOA waiting time by taking the average of the relevant hospitals used by the population of that MSOA, weighted by the average usage. For example, say 70% of patients in MSOA X use hospital A and 30% use hospital B. If hospital A has a mean waiting time of 10 weeks and hospital B has a mean waiting time of 20 weeks, we would calculate the mean waiting time for MSOA X as 70% of 10 weeks plus 30% of 20 weeks, i.e. 0.7×10 + 0.3×20 = 13 weeks.
To estimate MSOA waiting lists, we take a similar but inverse approach. We use administrative hospital data to measure where the patients treated by each hospital live (i.e. in which MSOA). We then allocate the hospital’s waiting list among each MSOA accordingly. By doing this for each hospital, we can calculate an estimate of the MSOA waiting list. Following the previous example, say 1% of hospital A’s patients live in MSOA X and 3% of hospital B’s patients live in MSOA X. If hospital A has a waiting list of 100,000 and hospital B has a waiting list of 50,000, we would calculate the estimated waiting list for MSOA X as 1% of 100,000 plus 3% of 50,000, i.e. 0.01×100,000 + 0.03×50,000 = 2,500.
This approach relies heavily on these weights capturing the true distribution of activity. While the weights are in practice relatively stable, we allow them to change over time to account for changes in the hospitals that populations in different areas use. Appendix B has more detail on our approach. Throughout, we use the 2011 MSOA boundaries.
One downside of this approach is that it may introduce a degree of measurement error, since it is an estimate of the waiting times and lists that individuals within the MSOA truly face. We therefore also consider waiting times and lists measured at a larger unit of geography, as discussed below.
Figure 4 shows the distribution of changes in estimated NHS waiting lists and waiting times between November 2019 and May 2024 across different MSOAs. There is a large degree of variation across areas. Starting with the estimated size of the waiting list, shown by green bars, the median MSOA saw an increase of 69%. The 10th percentile increase was 38% and the 90th percentile increase was 117% (meaning it more than doubled). Turning to the mean complete waiting time, shown by the yellow bars, the median increase was 67%, while the 10th percentile was 40% and the 90th percentile was 100%. For the mean incomplete waiting time, shown by the purple bars, the median increase was 84%, the 10th percentile was 54% and the 90th percentile was 124%. In other words, while elective waiting times have risen in almost all areas, there are large differences across areas in how much they have increased.
Figure 4. Distribution of changes in NHS elective waiting lists and times in England by MSOA
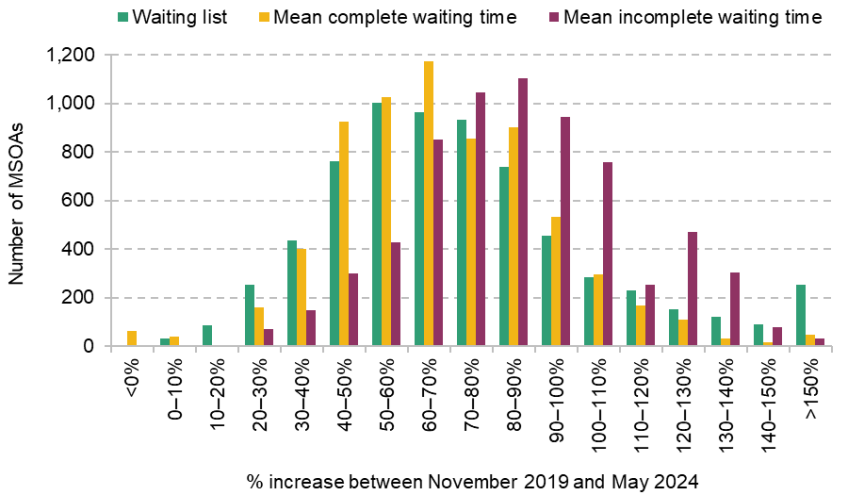
Source: Authors’ calculations using NHS England’s Consultant-led RTT Waiting Times data (various) and Hospital Episode Statistics.
In supplementary analysis, we also consider waiting times and waiting lists at the lowest level that the NHS directly measures and publishes data on – Sub Integrated Care Board Location (Sub ICB Location) level.8 The downside of this approach is that Sub ICB Locations are much larger areas – England has 106, compared with 6,791 MSOAs. Therefore, at this level, we may lose meaningful differences in waiting times and lists within areas, meaning that Sub ICB Location measures may be a poorer reflection of the actual waiting times that individuals face than our MSOA estimates. However, an advantage of this approach is that waiting times data are reported at the Sub ICB Location level directly, whereas our estimation approach for MSOA-level waiting lists likely introduces a degree of measurement error. We therefore consider it valuable to use both approaches.
Waiting times for working-age adults
Our focus is on the health-related benefits received by adults of working age.9 But a large fraction of the NHS hospital waiting list is made up of children and those aged above the state pension age (44% in May 2024 were under 16 or at least 65, with the remaining 56% of working age), and it is possible that the care used by working-age adults may differ from the care used by other groups, including in terms of its waiting times. The challenge is that routinely collected – and published – NHS waiting list data do not include the age of those waiting. However, since 2021, the NHS has started to collect more data on the people on the waiting list, including their age, and we use these to supplement our analysis and examine the relationship between health-related benefit claims and NHS waiting lists and times for working-age adults only. Importantly, these data are considered management information rather than as official statistics by NHS England, which means they are subject to less validation than the waiting times data we use elsewhere. The data also begin in 2021 and therefore do not capture any changes in the earlier pandemic period.
With those caveats in mind, Figure 5 shows the distribution of changes in estimated working-age elective waiting lists and waiting times by MSOA between November 2021 and May 2024. There is a large degree of variation in the changes across MSOAs. For the working-age waiting list, shown in the green bars, the 10th percentile increase was 11%, while the median MSOA experienced a 33% increase and the 90th percentile increase was 54%. For the working-age mean incomplete waiting time, the 10th percentile was a 14% reduction, the median was a 14% increase and the 90th percentile was a 39% increase. Some MSOAs experienced reductions in their waiting times between November 2021 and May 2024 because the NHS was already starting to recover from the worst of the pandemic over this period.
Figure 5. Distribution of changes in working-age NHS elective waiting lists and times in England by MSOA
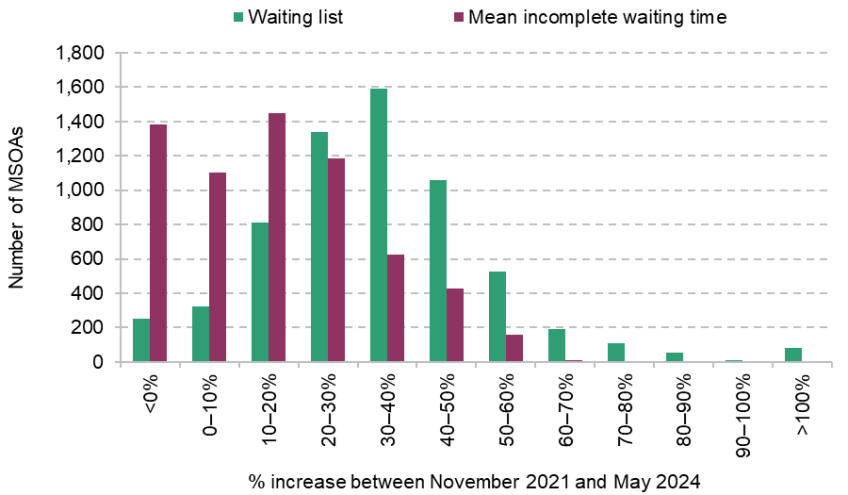
Note: Excludes MSOAs where the primary provider does not report valid data.
Source: Authors’ calculations using NHS England’s Waiting List Minimum Data Set and Hospital Episode Statistics.
Mental health waiting times
Part of the rise in health-related benefit claims in recent years has been driven by an increase in mental health conditions. The vast majority of those on the NHS elective waiting list are waiting for treatment for physical health conditions, and so changes in this waiting list may not be relevant to many patients who need mental health treatment. We therefore also consider measures of mental health waiting times in our analysis. This subsection sets out the measure we use and examines how it has changed over time.
Our analysis of mental health waiting times has three limitations relative to our analysis of elective waiting times. First, for mental health treatments, there are less data that are consistent over time. We focus on waiting times for NHS talking therapies, typically provided for anxiety and depression (previously known as Improving Access to Psychological Therapies). These are an important part of mental health treatment, but far from all NHS mental health care. Second, we have more limited measures of waiting times – here we focus on the median (complete) waiting time for treatment. Third, we do not have microdata to estimate local area mental health waiting times as we do for elective waiting times, and so we conduct our analysis here at the Sub ICB Location level rather than the MSOA level.
Figure 6 shows the distribution of changes to median complete waiting times for talking therapies across Sub ICB Locations between November 2019 and May 2024. Over this period, the median complete waiting time has fallen in some areas and it has increased substantially in many others – in around a quarter of Sub ICB Locations, the median wait has doubled. As with elective waiting times – and even more extremely – there are large differences in how talking therapy waiting times have evolved across areas.
Figure 6. Distribution of changes in NHS mental health waiting times in England by Sub ICB Location
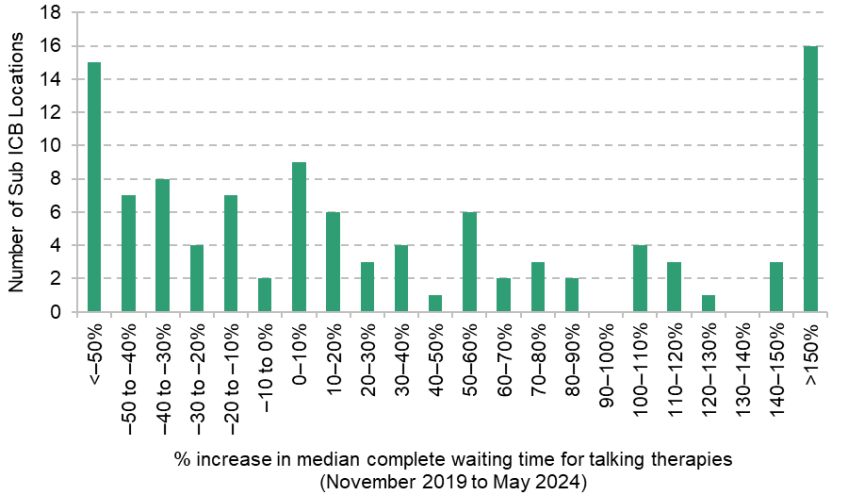
Source: Authors’ calculations using NHS England’s NHS Talking Therapies Monthly Statistics Including Employment Advisors (various) and NHS England’s Psychological Therapies, Reports on the use of IAPT services (various).
4. The relationship between health-related benefit claims and the NHS elective waiting list and waiting times
In this section, we examine how changes in NHS waiting lists and waiting times for elective (pre-planned) hospital activity, estimated at the local area level, correlate with changes in local health-related benefit claims. We start by considering total NHS elective activity and all working-age health-related benefit claimants. We then consider differences by types of health condition and age group.
For the majority of our analysis, we take the change in the size of the NHS waiting list or the change in the average NHS waiting time in an area, and compare this with the change in the number of working-age adults claiming health-related benefits in that area. In some cases, however, we also consider the change in the share of working-age adults claiming health-related benefits in an area, and relate this to local changes in NHS waiting lists and times. This takes into account differences in rates of population growth across areas.10
All elective activity
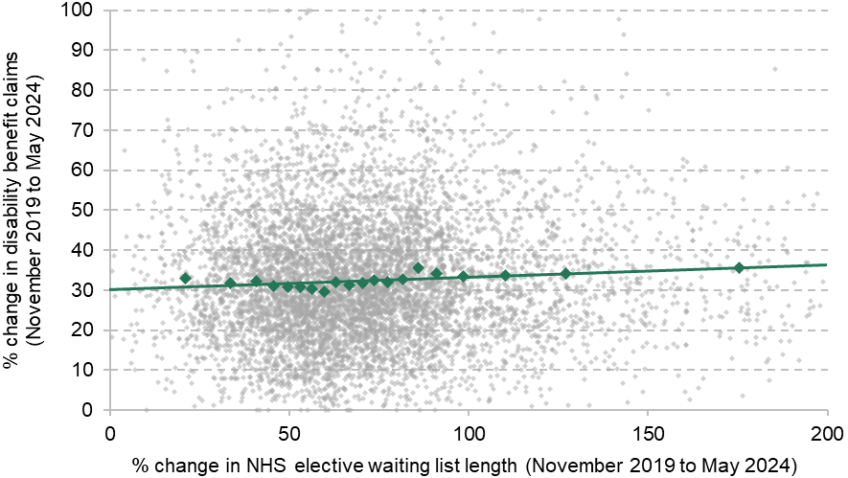
Figure 7 shows the relationship between changes in the size of the NHS waiting list and changes in health-related benefit claims at the MSOA level, over the period from November 2019 to May 2024. Panel a shows the relationship for disability benefit claims and Panel b shows the relationship for incapacity benefit claims. Each light grey marker denotes an MSOA, with a dark green line of best fit. The dark green markers show the average increase in health-related benefit claims for each vigintile (twentieth) of MSOAs, ordered by increase in waiting list length. In other words, the first green marker shows the average increase in benefit claims for the 5% of MSOAs with the smallest increase in waiting list.
Figure 7. Relationship between changes in the NHS waiting list and changes in health-related benefit claims at the MSOA level
a) Disability benefits
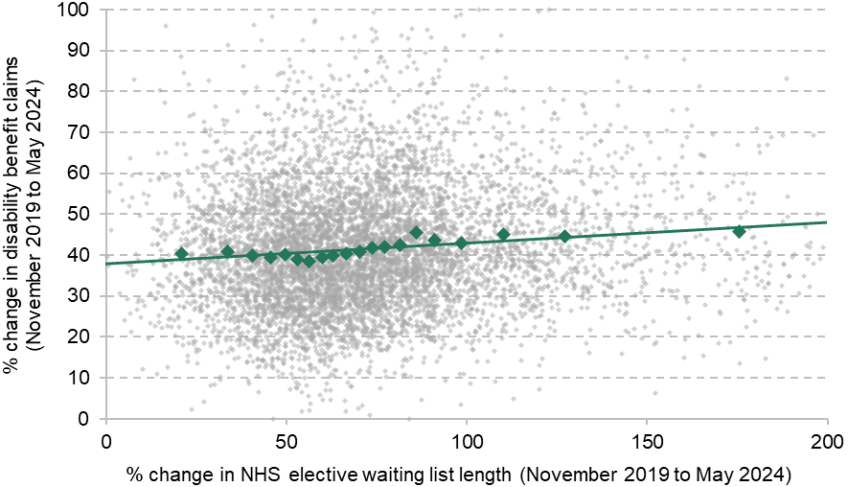
b) Incapacity benefits
Note: The is 0.0132 in Panel a and 0.00380 in Panel b (three significant figures throughout). For clarity of the graphs, changes in the waiting list of less than 0% or greater than 200% are excluded from the graphs, as are changes in benefit claims of less than 0% or greater than 100%. This affects less than 2% of MSOAs. Green markers show average change in benefit claims for each vigintile of waiting list change.
Source: Authors’ calculations using DWP Stat-Xplore (various), NHS England’s Consultant-led RTT Waiting Times data (various) and Hospital Episode Statistics.
The results in Figure 7 show a weak positive relationship between changes in local area waiting lists and increases in both disability and incapacity benefit claims. On average, areas that experienced larger increases in the number of people on the NHS waiting list experienced slightly larger increases in health-related benefit claims (with enormous variation between areas with similar increases in the size of the NHS waiting list).
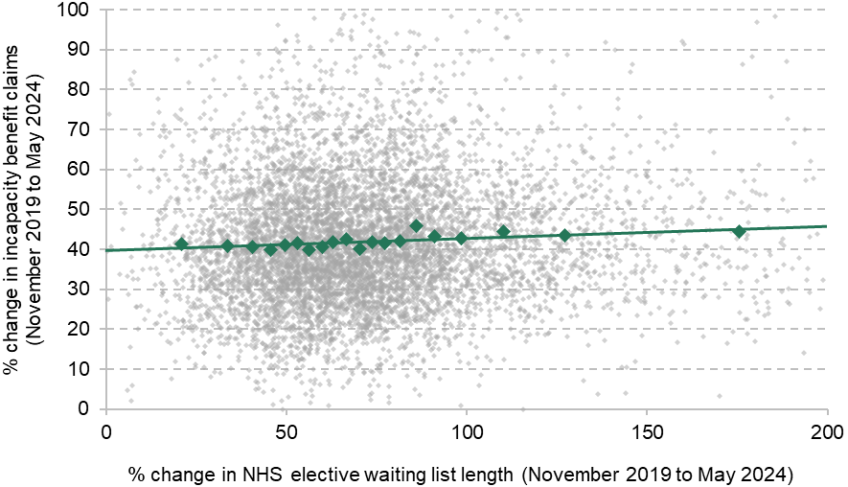
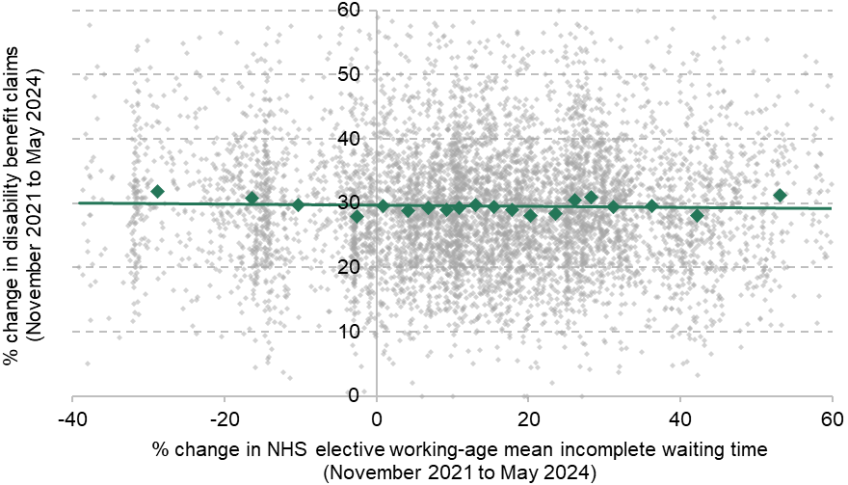
The size of the waiting list matters, but it is waiting times that ultimately matter most for individuals who need treatment (rather than the length of the queue). Figure 8 therefore repeats the analysis using the change in mean incomplete waiting times, also estimated at the MSOA level. Again, there is a slight positive relationship: areas with larger increases in average hospital waiting times experienced, on average, slightly larger increases in health-related benefit claims. This is statistically significant for disability benefits but not for incapacity benefits.11
Figure 8. Relationship between changes in NHS waiting times and changes in health-related benefit claims at the MSOA level
a) Disability benefits
b) Incapacity benefits
Note: The is 0.00441 in Panel a and 0.000550 in Panel b. For clarity of the graphs, changes in waiting times of less than 25% or greater than 150% are excluded from the graphs, as are changes in benefit claims of less than 0% or greater than 100%. This affects less than 2% of MSOAs. Green markers show average change in benefit claims for each vigintile of waiting time change.
Source: Authors’ calculations using DWP Stat-Xplore (various), NHS England’s Consultant-led RTT Waiting Times data (various) and Hospital Episode Statistics.
Although positive, these relationships are extremely weak. Variation across local areas in the increase in NHS waiting lists and waiting times can explain (in a purely statistical sense) at most 1% of the variation in local increases in disability benefit claims.12 At the national level, the central point estimates for the relationships imply that longer English NHS waiting lists and waiting times could perhaps explain between 3% and 9% of the increase in health-related benefit claims.13 This is very likely an overestimate, however. For one, if the working-age population in some areas was growing more quickly, we would expect this to lead to both more people joining the NHS waiting list and more people claiming benefits, without one having caused the other.
There are two ways we can account for the effect of differential population growth. One approach is to control for changes in local area population over the period. When we do this in Table A1, the small positive relationship between waiting list/times and health-related benefit claims (shown in Figures 7 and 8) shrinks in magnitude and – in general – ceases to be statistically significant.14 After controlling for differences in local population growth, our central point estimates suggest that longer NHS waiting lists and waiting times could explain between 0% and 6% of the national increase in health-related benefit claims.
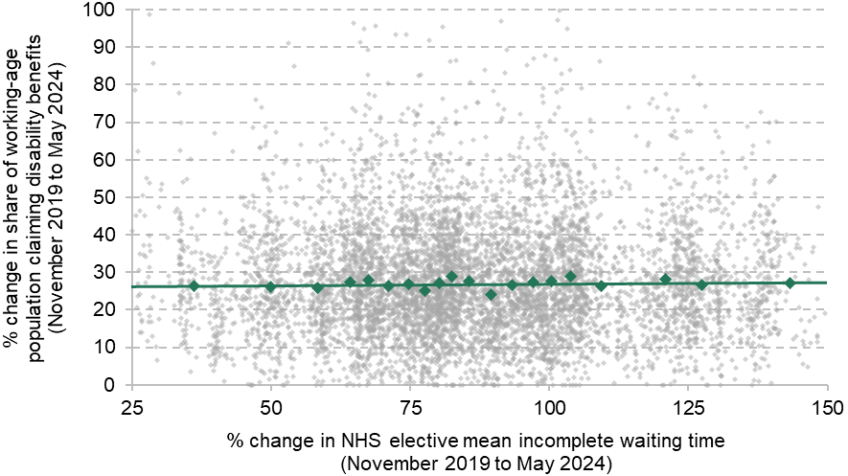
An alternative approach is to look at the change in the share of working-age adults claiming health-related benefits (rather than the number of working-age adults). Thisis shown in Figure 9, with the change in local waiting times on the horizontal axis. Accounting for population growth in this way substantially shrinks the magnitude of the estimated relationship, and it is no longer statistically significant (Table A3).
Figure 9. Relationship between changes in NHS waiting times and changes in the share of the working-age population claiming health-related benefits at the MSOA level
a) Disability benefits
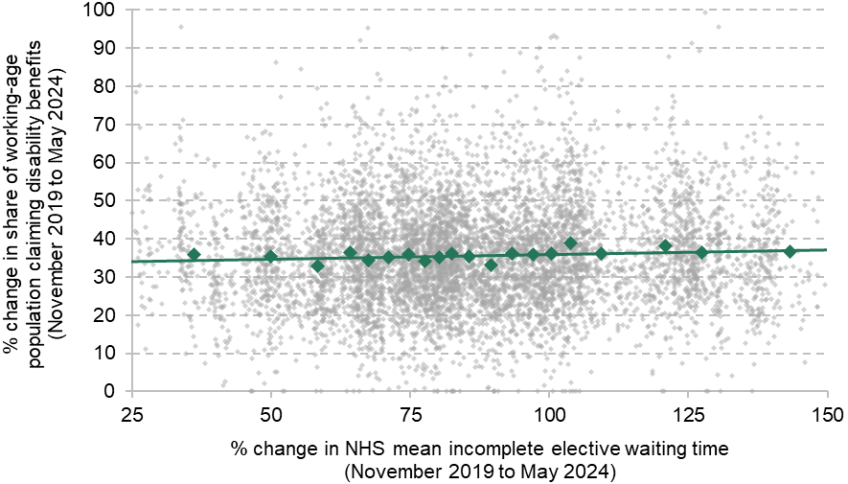
b) Incapacity benefits
Note: The is 0.00225 in Panel a and 0.0000125 in Panel b. For clarity of the graphs, changes in waiting times of less than 25% or greater than 150% are excluded from the graphs, as are changes in the share claiming of less than 0% or greater than 100%. This affects less than 2% of MSOAs. Green markers show average change in share claiming benefits for each vigintile of waiting time change.
Source: Authors’ calculations using DWP Stat-Xplore (various), NHS England’s Consultant-led RTT Waiting Times data (various) and Hospital Episode Statistics.
But differences in population growth are not the only reason to think that these results may overstate the (already very small) relationship between NHS waits and health-related benefit claims. The obvious omitted relationship from this analysis is that worsening population health, driven by factors other than worse NHS performance, would increase both demand for NHS services and health-related benefit claims. This would create a more positive relationship between the two (i.e. it would bias our estimate upwards) – yet we find no strong or clear relationship. Our analysis is not causal – it does not directly identify whether higher NHS waiting times or lists cause higher disability benefit claims. But given the direction in which we would expect unobserved variables to bias our estimates, our analysis does indicate that there is unlikely to be a strong positive causal effect.
In Appendix A, we repeat this analysis at the Sub ICB Location level (Figures A2 and A3), to confirm that our results are not driven by our small-area estimation of NHS waiting lists and times. The findings are entirely consistent with the MSOA analysis presented here, and if anything point even more strongly to a lack of a meaningful relationship between worsening NHS waiting times and lists and increases in health-related benefit claims. This holds when controlling for differences in population growth across Sub ICB Locations (Tables A11 and A13).
Differences by health conditions
We next consider differences in these relationships by the type of health condition that health-related benefit claims are for. To start with, we differentiate between benefit claims that are related to a physical health condition and those that are related to a mental health condition. Almost all of the NHS elective waiting list concerns treatment for physical health conditions, so we may expect a stronger relationship when we focus our analysis here. However, it may be that waiting for any form of NHS treatment also has effects on the mental health of those waiting.
Figure 10 shows the relationship between the increase in the local area NHS waiting list and the increase in disability benefit claims, separately for claims in respect of physical and mental health conditions. For simplicity and brevity, we focus just on the NHS elective waiting list (rather than waiting times, though the results are similar in all cases, as shown in Tables A2 and A8) and on disability benefits (rather than incapacity benefits, for which we do not have data on the health conditions of claimants).
Figure 10. Relationship between changes in the NHS waiting list and changes in disability benefit claims at the MSOA level
a) Disability benefits for physical health conditions
b) Disability benefits for mental health conditions
Note: The is 0.00383 in Panel a and 0.0120 in Panel b. For clarity of the graphs, changes in the waiting list of less than 0% or greater than 200% are excluded from the graphs, as are changes in physical-health-related benefit claims of less than 0% and greater than 100% and changes in mental-health-related benefit claims of less than 0% and greater than 160%. This affects less than 3% of MSOAs. Green markers show average change in benefit claims for each vigintile of waiting list change.
Source: Authors’ calculations using DWP Stat-Xplore (various), NHS England’s Consultant-led RTT Waiting Times data (various) and Hospital Episode Statistics.
The graphs show a slight positive relationship in both cases, a little stronger in the case of benefit claims for mental health conditions (despite the elective waiting list being primarily for physical ailments). The relationships remain weak, and should be interpreted with the same caveats as those in the previous subsection.
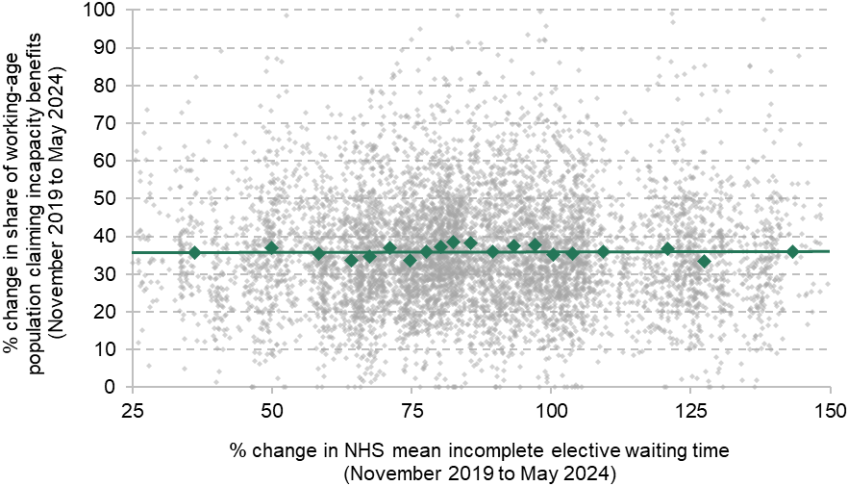
Table A2 shows that the relationship is considerably weaker after controlling for local area population changes (though remains statistically significant in the case of mental health conditions). Figure 11 shows the relationship between NHS waiting times and the share of the local working-age population claiming disability benefits for physical and mental health conditions (as an alternative means of controlling for population growth). This shows no significant relationship between NHS waiting times and benefit claims relating to physical health conditions, but a slight (and statistically significant) positive relationship remains for mental health conditions.
Figure 11. Relationship between changes in NHS waiting times and changes in share of working-age population claiming disability benefits at the MSOA level
a) Share of working-age population claiming disability benefits for physical health conditions
b) Share of working-age population claiming disability benefits for mental health conditions
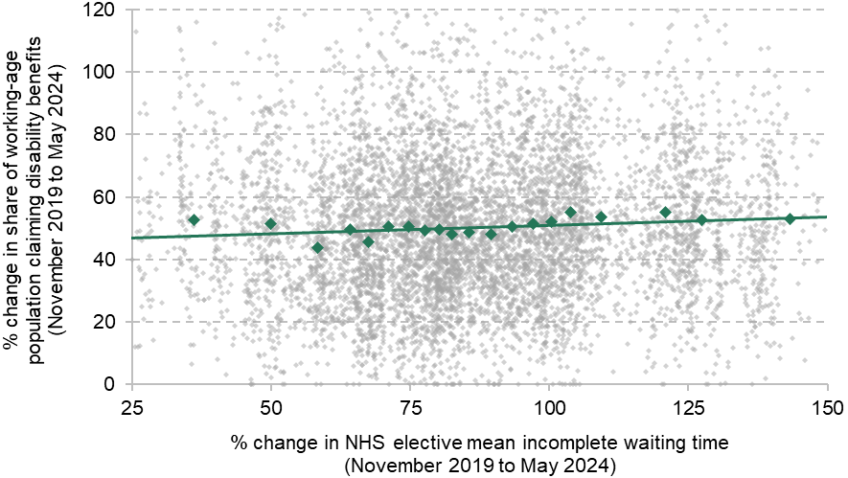
Note: The is 0.000181 in Panel a and 0.00287 in Panel b. For clarity of the graphs, changes in waiting times of less than 25% or greater than 150% are excluded from the graphs, as are changes in share claiming for physical health conditions of less than 0% or greater than 100% and changes in share claiming for mental health conditions of less than 0% or greater than 120%. This affects less than 4% of MSOAs. Green markers show average change in share claiming for each vigintile of waiting time change.
Source: Authors’ calculations using DWP Stat-Xplore (various), NHS England’s Consultant-led RTT Waiting Times data (various) and Hospital Episode Statistics.
Figure A4 repeats the analysis of Figure 10 at the Sub ICB Location level and finds no relationship, including for mental-health-related benefit claims. This is also the case if we control for population (Table A12) or use the share of the working-age population claiming health-related benefits (Table A13).15
Taken together, there is little evidence that increases in NHS waits are associated with changes in the number of physical-health-related disability benefit claims (physical health issues being what the vast majority of the NHS elective waiting list consists of). However, there is some evidence of a weak positive relationship for disability benefit claims in respect of mental-health-related conditions. Our central point estimates for the relationship in Figure 11 suggest that the rise in the NHS elective waiting list could perhaps explain around 6–7% of the rise in mental-health-related disability benefit claims, after accounting for population changes, though this could be an overestimate if reductions in population health at the local level push up both demand for hospital care and the prevalence of mental health issues.
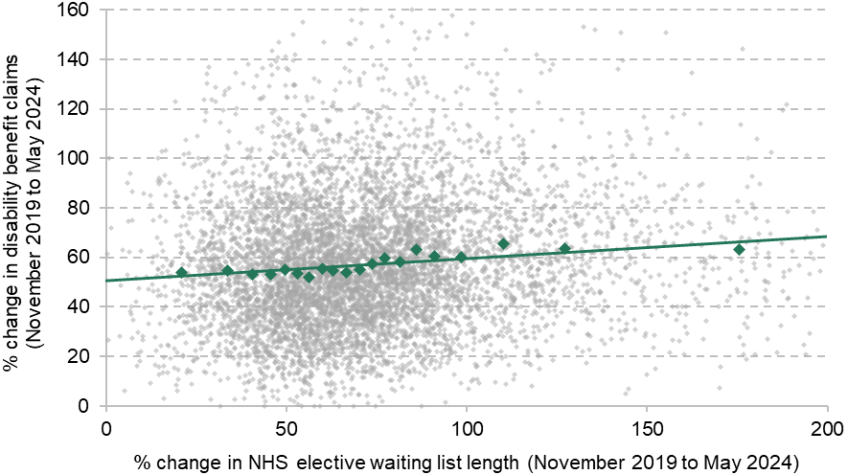
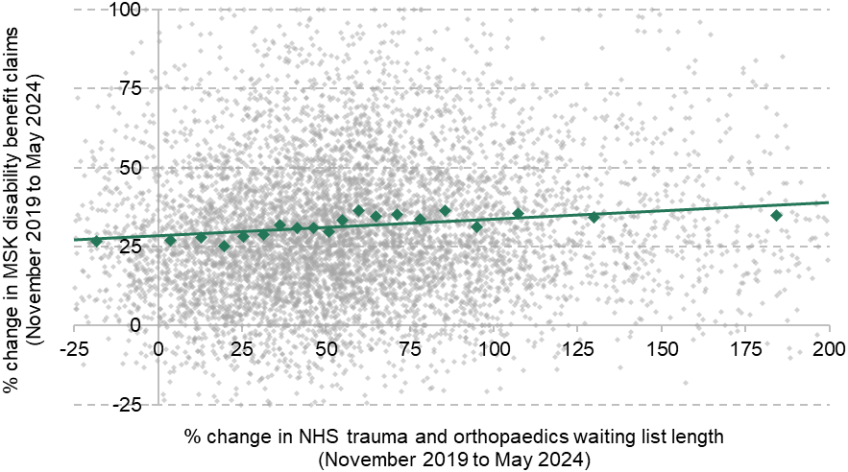
We can further break down the primary health conditions that individuals are claiming health-related benefits for. Here we focus on musculoskeletal (MSK) conditions. This is for three reasons. First, such conditions are one of the most common health conditions for disability benefit claims (reflecting 26% of the caseload in May 2024). Second, this sort of health condition is commonly treated by elective NHS hospital activity – so we would expect many of the people claiming MSK disability benefits to be on the trauma and orthopaedics (T&O) waiting list (e.g. waiting for a hip or knee replacement). Third, the international evidence discussed in the introduction (Godøy et al., 2024) finds significant effects of waiting longer for orthopaedic surgery in Norway on disability programme participation.
Panel a of Figure 12 therefore shows the relationship between the increase in MSK disability benefit claims and the estimated increase in NHS T&O waiting lists at the MSOA level. There is a weak positive relationship: areas with a higher waiting list have more benefit claims, on average. This result also holds at the Sub ICB Location level (Figure A5 and Table A14), where the positive relationship is in fact slightly stronger, and after controlling for population growth (Table A4). When we look at the relationship between waiting times for T&O care and the share of the working-age population claiming disability benefits for MSK conditions (Panel b of Figure 12 and Table A5), there is a weakly positive but statistically insignificant association (also true at the Sub ICB Location level – Table A15).
Figure 12. Relationship between changes in the NHS trauma and orthopaedics waits and changes in musculoskeletal disability benefit claims at the MSOA level
a) Total musculoskeletal disability benefit claims and waiting list length
b) Share of working-age population claiming musculoskeletal disability benefits and waiting time
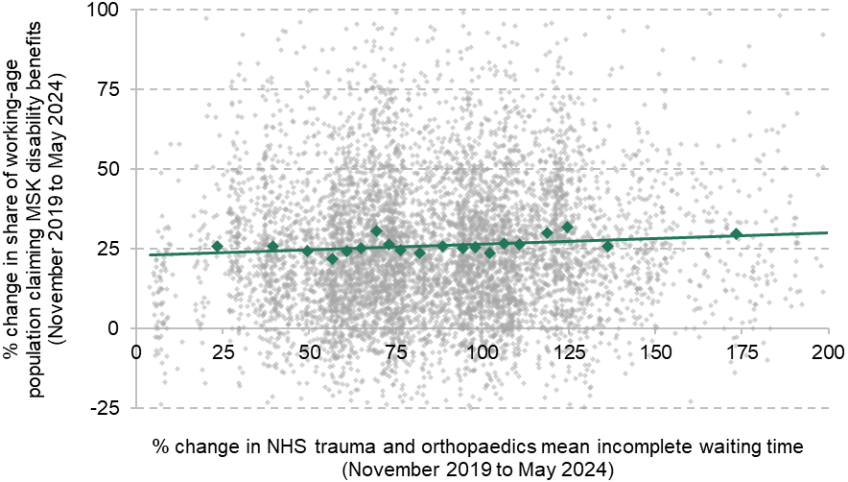
Note: The is 0.00793 in Panel a and 0.00259 in Panel b. For clarity of the graphs, changes in the waiting list of less than –25% or greater than 200% are excluded from the graph, as are changes in waiting times of less than 0% or greater than 200%, and benefit claims less than –25% or greater than 100%. This affects less than 5% of MSOAs. Green markers show average change in share claiming benefits for each vigintile of waiting list/time change.
Source: Authors’ calculations using DWP Stat-Xplore (various), NHS England’s Consultant-led RTT Waiting Times data (various) and Hospital Episode Statistics.
In sum, as with mental health disability benefit claims, there is therefore some evidence that NHS waiting lists may have contributed to an increase in MSK disability benefit claims, though there is less evidence of a relationship for waiting times. But as with the results for mental health disability benefit claims, the relationship is not a strong one; the size of any effect appears to be small (our central point estimates suggest that longer waiting lists for trauma and orthopaedics NHS care can only explain 7–8% of the increase in MSK claims); and our analysis is subject to the same caveats around causal interpretation as everything presented earlier in the report.
Working-age population
In this report, we focus on health-related benefit claims by working-age adults. However, the NHS estimates that only a little over half of those on the waiting list are of working age: 56% of those on the elective waiting list in May 2024 were aged 18–64, while 11% were under 18 and 33% were 65+ (NHS England, 2024). One reason that our analysis may have so far found little relationship between changes in NHS waiting lists and health-related benefit claims is that we have included non-working-age people waiting for NHS treatment. If the patterns of increases in waiting lists and waiting times are different for working-age and non-working-age patients, this could mask a true positive relationship.
In this subsection, we focus on NHS waiting times and waiting lists for working-age adults only. As discussed in Section 3, this comes with limitations. Only since 2021 has the NHS started to collect more data on the waiting list, including the age of people waiting. Importantly, these data are subject to less validation than the waiting times data used in the previous subsections, and the results in this subsection should therefore be interpreted with more caution. The data also begin in 2021 and therefore do not capture any changes in the earlier pandemic period.
With those caveats, we now repeat the analysis of the previous subsections but only use NHS waiting lists and waiting times for those of working age. We compare May 2024 with November 2021. Comparing with November 2021 means that the increases in benefit claims are smaller than in the previous subsections, and some areas have seen reductions in NHS waiting lists and NHS waiting times.
Figure 13 shows the relationship between estimated changes in the NHS working-age waiting list and changes in health-related benefit claims at the MSOA level. We find no evidence of a significant relationship between the two, for either disability benefits or incapacity benefits, and for incapacity benefits the relationship is – if anything – negative. Figure 14 repeats this analysis for the mean incomplete waiting time for working-age people, where there is also no meaningful relationship.16
Figure 13. Relationship between changes in the NHS working-age waiting list and changes in health-related benefit claims at the MSOA level
a) Disability benefits

b) Incapacity benefits
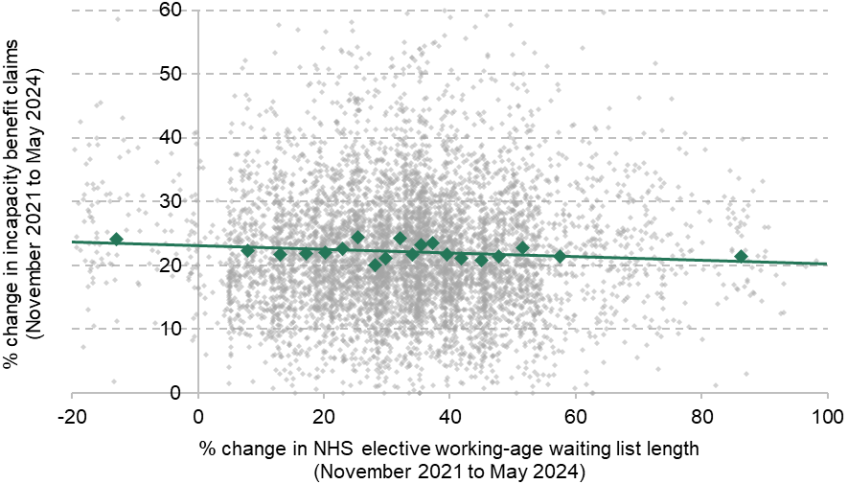
Note: The is 0.000107 in Panel a and 0.00344 in Panel b. For clarity of the graphs, changes in the waiting list of less than –20% or greater than 100% are excluded from the graphs, as are changes in benefit claims of less than 0% or greater than 60%. This affects less than 5% of MSOAs. Green markers show average change in benefit claims for each vigintile of waiting list change.
Source: Authors’ calculations using DWP Stat-Xplore (various), NHS England’s Waiting List Minimum Data Set and Hospital Episode Statistics.
Figure 14. Relationship between changes in NHS working-age waiting times and changes in health-related benefit claims at the MSOA level
a) Disability benefits
b) Incapacity benefits
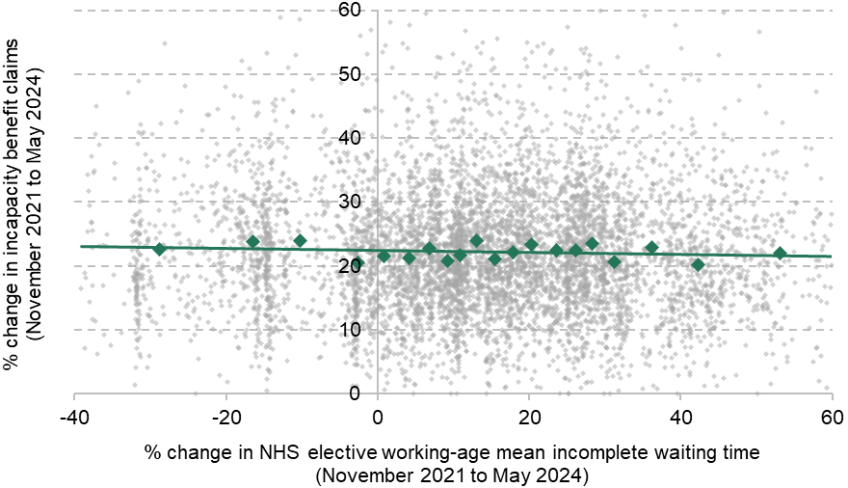
Note: The is 0.000229 in Panel a and 0.000822 in Panel b. For clarity of the graphs, changes in waiting times of less than –40% or greater than 60% are excluded from the graphs, as are changes in benefit claims of less than 0% or greater than 60%. This affects less than 3% of MSOAs. Green markers show average change in benefit claims for each vigintile of waiting list change.
Source: Authors’ calculations using DWP Stat-Xplore (various), NHS England’s Waiting List Minimum Data Set and Hospital Episode Statistics.
When we repeat this analysis controlling for local area population changes (Table A6), or consider the share of the local area working-age population claiming health-related benefits or waiting for NHS treatment (rather than the number; Table A8), we also find no evidence of a meaningful relationship. Table A7 shows that this holds for both physical- and mental-health-related disability benefit claims.
Finally, we examine changes in the NHS waits for trauma and orthopaedic care among working-age adults, and relate these to changes in disability benefit claims for musculoskeletal conditions. When we did this for the period between 2019 and 2024 with the full NHS waiting list (Figure 12), there was a slight positive relationship that persisted after controlling for population growth. When we use data for the working-age waiting list only (between 2021 and 2024), this positive relationship disappears (Tables A9 and A10).
Summing up
Taking stock, none of the analysis in this section points to a clear or meaningful relationship between increases in NHS elective waiting lists or times and increases in health-related benefit claims at the local area level. There is some suggestive evidence of a positive relationship, especially in the case of disability benefit claims for mental health conditions, but this does not hold when we use a measure of the NHS waiting list for working-age adults only, and nor does it hold at the Sub ICB Location level. We similarly find a positive relationship between the total waiting list for NHS trauma and orthopaedic care and musculoskeletal disability benefit claims, which persists after controlling for population growth and when we repeat the analysis at the Sub ICB Location level, but does not persist when we repeat the analysis using an estimate for the working-age trauma and orthopaedics waiting list. Where we do find evidence suggestive of a positive relationship, the magnitude of any effect is small: in the case of mental-health-related disability benefit claims, our central point estimates suggest that NHS waits could perhaps explain 6–7% of the increase; in the case of musculoskeletal claims, perhaps 7–8%. Yet these estimates – like all of our results – must be interpreted with caution, given that we may just be capturing the fact that a worsening of local population health would likely push up both demand for NHS care and health-related benefit claims.
All in all, we interpret our results as indicating that increases in waiting lists and waiting times for NHS elective care have not been a major factor behind the large increase in health-related benefit claims.
5. The relationship between health-related benefit claims and NHS talking therapy waiting times
In this section, we examine the relationship between mental health waiting times and health-related benefit claims. As discussed in Section 3, we focus on waiting times for NHS talking therapies, which are an important part of NHS mental health care, but far from the only part.17 In particular, we use the median wait before entering treatment. There are some Sub ICB Locations that have experienced very large increases in these waiting times: in the most extreme case, one Sub ICB Location’s median waiting time increased from 3 weeks in 2019 to 43 weeks in 2024. In our primary analysis, we exclude the four Sub ICB Locations with the largest growth rates (between 475% and 1333%). In Appendix A, we repeat our analysis including these four Sub ICB Locations (Figures A6 and A7) and the results are relatively similar.
Figure 15 shows the relationship between changes in NHS talking therapies waiting times and changes in health-related benefit claims at the Sub ICB Location level between November 2019 and May 2024. Panel a shows this for disability benefits and Panel b shows it for incapacity benefits. In both cases, we find no evidence of a relationship. In other words, areas that saw large increases and areas that saw large decreases in mental health waiting times had – on average – no differences in the changes to their health-related benefit claims. Table A16 shows that there is also no evidence of a relationship when we control for population changes.
Figure 15. Relationship between changes in NHS talking therapies waiting times and changes in health-related benefit claims at the Sub ICB Location level
a) Disability benefits
b) Incapacity benefits
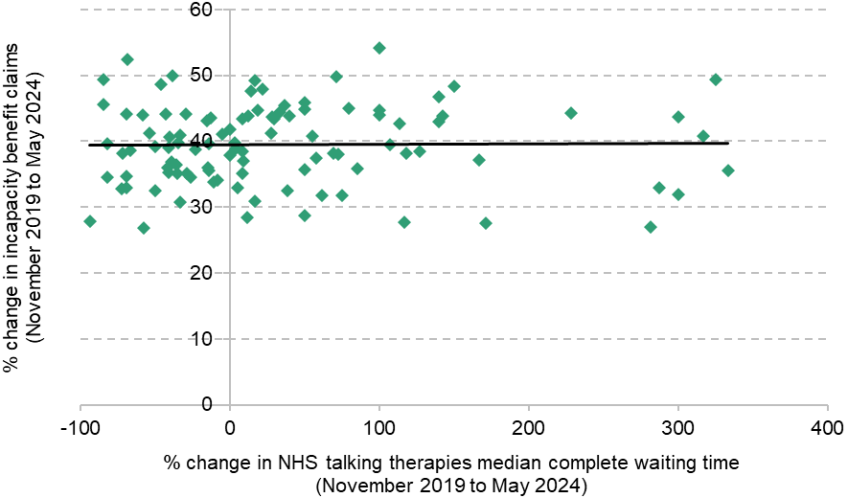
Note: The is 0.00356 in Panel a and 0.000166 in Panel b. Excludes four Sub ICB Locations with very large increases in waiting times.
Source: Authors’ calculations using DWP Stat-Xplore (various), NHS England’s NHS Talking Therapies Monthly Statistics Including Employment Advisors (various) and NHS England’s Psychological Therapies, Reports on the use of IAPT services (various).
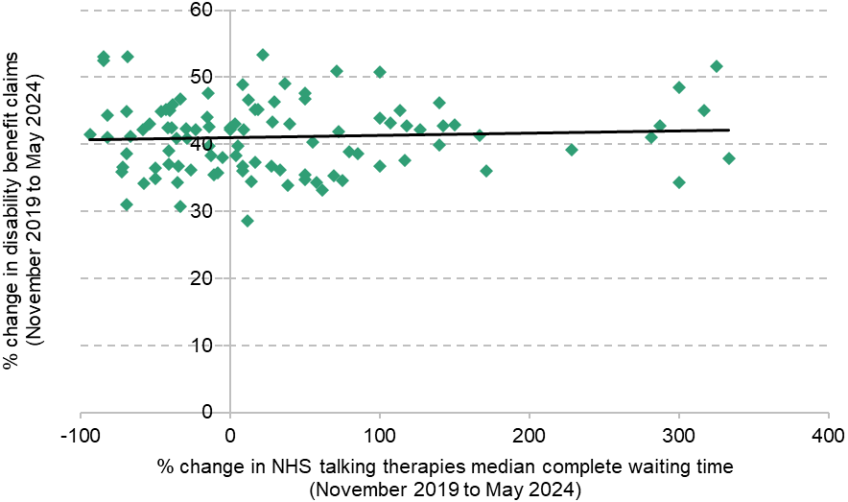
Figure 16 repeats this analysis separately for disability benefit claims for physical health conditions (Panel a) and mental health conditions (Panel b). As with total disability benefit claims, there is no clear relationship. There is a slight upwards relationship for mental-health-related disability benefits, but this is small and not statistically significant (Table A17).18 Indeed, the area with the single largest increase in mental-health-related disability benefit claims experienced a reduction in talking therapy waiting times over this period.
Figure 16. Relationship between changes in NHS talking therapies waiting times and changes in disability benefit claims at the Sub ICB Location level
a) Disability benefits for physical health conditions
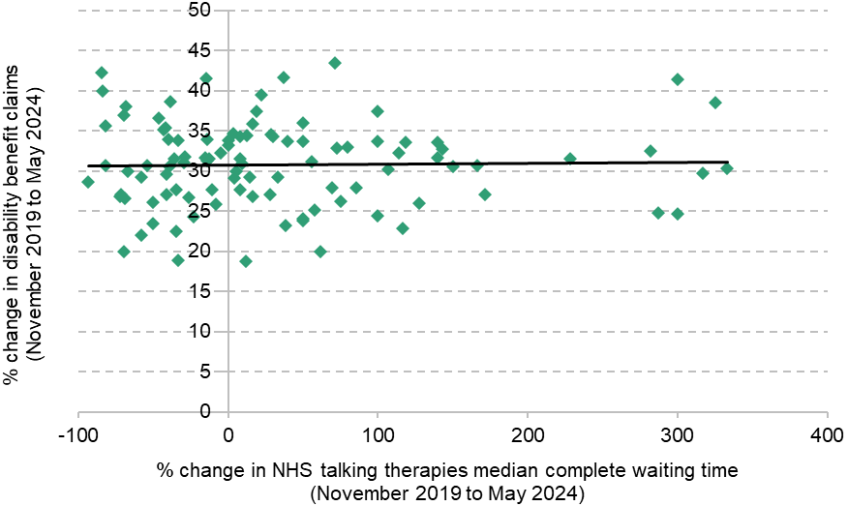
b) Disability benefits for mental health conditions
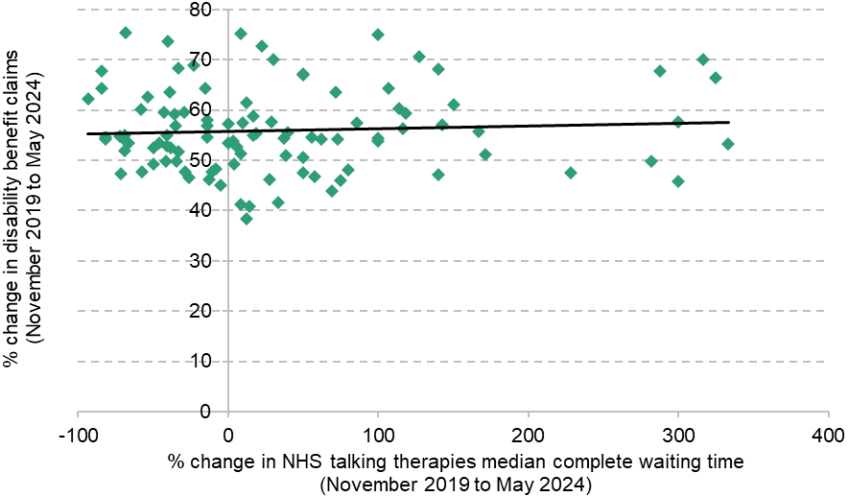
Note: The is 0.000458 in Panel a and 0.00390 in Panel b. Excludes four Sub ICB Locations with very large increases in waiting times.
Source: Authors’ calculations using DWP Stat-Xplore (various), NHS England’s NHS Talking Therapies Monthly Statistics Including Employment Advisors (various) and NHS England’s Psychological Therapies, Reports on the use of IAPT services (various).
Table A18 repeats all of this analysis using the share of the local working-age population claiming each type of health-related benefits, rather than the total number of claims. In each case, there is no meaningful or significant relationship, consistent with the analysis in Figures 15 and 16.
Taken together, the analysis in this section provides suggestive evidence that increases in mental health waiting times are unlikely to have meaningfully contributed to increases in health-related benefit claims. Compared with our analysis of the elective waiting list, less data are collected on mental health services and so we cannot consider as many variants, or repeat the analysis at the MSOA level. While complete waiting times are one important measure of access to mental health care, incomplete waiting times and the size of the waiting list also matter, and can behave quite differently from complete waiting times. It is therefore possible that using these alternative measures would give different results from the ones presented in this section, but we are unable to examine this. However, for the NHS elective waiting list (where we have all three measures), they all give similar results, which is somewhat reassuring.
6. Conclusions
There is certainly no clear and unambiguous relationship between local changes in NHS waits and local changes in health-related benefit claims. For the most part, our results indicate that there is no meaningful relationship at all, especially when we control for the rate of population growth in our analysis, for both pre-planned hospital care and NHS talking therapies. There is slightly stronger evidence of a positive relationship between the NHS elective waiting list and the number of disability benefit claims for mental health conditions, and of a positive relationship between the waiting list for NHS trauma and orthopaedic care and disability benefit claims for musculoskeletal conditions. But even here, the relationship vanishes when we repeat the analysis using an estimate of the NHS elective waiting list for working-age adults only. And our estimates may simply be capturing the fact that areas in which people’s health deteriorated by more experienced simultaneous increases in demand for NHS care and in claims for health-related benefits, without one having caused the other.
Taken together, we interpret our results as strongly indicating that longer NHS waits for pre-planned hospital care and some forms of mental health care have not been a major factor behind the large increase in the number of working-age adults claiming health-related benefits. We conclude that the explanation for rising claimant numbers almost certainly lies elsewhere.
This conclusion is subject to caveats. Our analysis is not causal. Moreover, we are limited by the available data. In an ideal world, we would link individual-level NHS records (including how long the individual waited, and for what) to the same individual’s benefit records and labour market data. Alas, such a data linkage does not yet exist in the UK, and we are limited to local area correlations. Our local area estimates of waiting lists and waiting times will inevitably contain some degree of measurement error, which could attenuate our results. The working-age waiting list data are available for a shorter period and subject to fewer official quality checks, and the data on NHS mental health care are far more limited (we can see only the median completed wait for NHS talking therapies, when it may be that longer incomplete waits – or longer waits for other mental health services – are in fact the problem). Finally, in this report, we have focused on waits for two important areas of NHS treatment: elective hospital care and talking therapies. But there are many other important NHS services – such as primary, community and emergency care – that we have not considered here, and we cannot rule out a role for restricted access to these kinds of care.
These are important caveats, but we nonetheless believe that the breadth and consistency of our results paint a compelling picture. This is especially true given that, if anything, one would expect unobserved variables (e.g. changes in local population health) to bias our results towards finding a positive relationship between NHS waits and benefit claims. In the vast majority of cases, we find no such relationship. In the rare cases where we do, the relationship is weak and is not robust to alternative measures of the NHS waiting list.
For the avoidance of doubt, we do not conclude from this analysis that longer waiting lists and waiting times for NHS care are unimportant. Rather, we conclude that they appear to be unimportant in explaining recent trends in health-related benefit claims. Waiting longer for care may still worsen the patient’s ultimate health outcomes, in at least some cases (Nikolova, Harrison and Sutton, 2016; Moscelli, Siciliani and Tonei, 2016; Reichert and Jacobs, 2018). And longer waits very likely have a deleterious effect on the patient’s well-being more generally – reason enough to think bringing down waiting times is important, even if doing so only leads to a small reduction in the subsequent number of health-related benefit claims.
Our analysis suggests that something other than longer NHS waits has been the driving factor behind the recent surge in claims for health-related benefits. This would chime with the fact that while the UK is far from alone in having experienced an increase in hospital waiting lists and waiting times post-pandemic (Australia, Canada and New Zealand have seen comparably large increases in median waiting times for routine operations, for example – see Reed and Georghiou (2024)), the sharp increase in benefit claims does not appear to have happened elsewhere (Latimer, Pflanz and Waters, 2024). It would also suggest that recent policy initiatives aimed at bringing down waiting lists in the areas of highest economic inactivity (Department of Health and Social Care, 2025) are unlikely to have much effect – on rates of disability benefit claims, at least.
The focus of research in this area going forward should be on building a greater understanding of how other factors – such as worsening population health, the impacts of falling real incomes during the recent energy price shock, or the design of the UK’s working-age benefit system – have contributed to recent trends.
Acknowledgements
We thank Shaun Ng for excellent research assistance at the beginning of this project. We gratefully acknowledge the support of the Joseph Rowntree Foundation (F-240302M) and the ESRC Centre for the Microeconomic Analysis of Public Policy (ES/T014334/1). We are also grateful to NHS England for providing additional data on the working-age waiting list from the Waiting List Minimum Data Set. This work uses data provided by patients and collected by the NHS as part of their care and support. Hospital Episode Statistics was accessed via the Centre for Health Economics & Policy Innovation (CHEPI) at Imperial College London, and data management was provided by the Big Data and Analytical Unit (BDAU) at the Institute of Global Health Innovation (IGHI).
Appendix A. Additional results
Download Appendix A as a PDF here.
Appendix B. Methodology
Download Appendix B as a PDF here.
References
Banks, J., Karjalainen, H. and Waters, T., 2024. Inequalities in disability. Oxford Open Economics, 3, Supplement 1, i529–48, https://doi.org/10.1093/ooec/odad091.
Department for Work and Pensions, 2025a. Biggest shake up to welfare system in a generation to get Britain working. https://www.gov.uk/government/news/biggest-shake-up-to-welfare-system-in-a-generation-to-get-britain-working.
Department for Work and Pensions, 2025b. Pathways to work: reforming benefits and support to get Britain working Green Paper. https://www.gov.uk/government/consultations/pathways-to-work-reforming-benefits-and-support-to-get-britain-working-green-paper/pathways-to-work-reforming-benefits-and-support-to-get-britain-working-green-paper.
Department for Work and Pensions, 2025c. Work aspirations and support needs of health and disability customers. https://assets.publishing.service.gov.uk/media/67a5d47ee221c86430283817/work-aspirations-and-support-needs-of-health-and-disability-customers.pdf.
Department of Health and Social Care, 2024. Secretary of State makes economic growth a priority. https://www.gov.uk/government/news/secretary-of-state-makes-economic-growth-a-priority.
Department of Health and Social Care, 2025. Crack teams get patients off waiting lists at twice the speed. https://www.gov.uk/government/news/crack-teams-get-patients-off-waiting-lists-at-twice-the-speed.
Godøy, A., Haaland, V. F., Huitfeldt, I. and Votruba, M., 2024. Hospital queues, patient health, and labor supply. American Economic Journal: Economic Policy, 16, 150–81, https://www.aeaweb.org/articles?id=10.1257/pol.20210399.
Latimer, E., Pflanz, F. and Waters, T., 2024. Health-related benefit claims post-pandemic: UK trends and global context. IFS Report, https://ifs.org.uk/publications/health-related-benefit-claims-post-pandemic-uk-trends-and-global-context.
Latimer, E., Ray-Chaudhuri, S. and Waters, T., 2025. The role of changing health in rising health-related benefit claims. IFS Report, https://ifs.org.uk/publications/role-changing-health-rising-health-related-benefit-claims.
Moscelli, G., Siciliani, L. and Tonei, V., 2016. Do waiting times affect health outcomes? Evidence from coronary bypass. Social Science & Medicine, 161, 151–91, https://doi.org/10.1016/j.socscimed.2016.05.043.
NHS England, 2024. Darzi Review Technical Annex - Section II - access to NHS services. https://digital.nhs.uk/supplementary-information/2024/darzi-review-technical-annex---section-ii---access-to-nhs-services.
Nikolova, S., Harrison, M. and Sutton, M., 2016. The impact of waiting time on health gains from surgery: evidence from a national patient-reported outcome dataset. Health Economics, 25, 955–68, https://doi.org/10.1002/hec.3195.
Office for Budget Responsibility, 2023. Fiscal risks and sustainability – July 2023. https://obr.uk/frs/fiscal-risks-and-sustainability-july-2023/.
Reed, S. and Georghiou, T., 2024. Still waiting: is it just England that still has a backlog problem? Nuffield Trust, https://www.nuffieldtrust.org.uk/news-item/still-waiting-is-it-just-england-that-still-has-a-backlog-problem.
Reichert, A. and Jacobs, R., 2018. The impact of waiting time on patient outcomes: evidence from early intervention in psychosis services in England. Health Economics, 27, 1772–87, https://doi.org/10.1002/hec.3800.
Data
NHS England, various. Consultant-led Referral to Treatment Waiting Times. https://digital.nhs.uk/data-and-information/publications/statistical/nhse-consultant-led-referral-to-treatment-waiting-times.
NHS England, various. NHS Talking Therapies Monthly Statistics Including Employment Advisors. https://digital.nhs.uk/data-and-information/publications/statistical/nhs-talking-therapies-monthly-statistics-including-employment-advisors.
NHS England, various. Psychological Therapies, Reports on the use of IAPT services. https://digital.nhs.uk/data-and-information/publications/statistical/psychological-therapies-report-on-the-use-of-iapt-services.
NHS England, 2025. Waiting List Minimum Data Set (WLMDS) information. https://www.england.nhs.uk/statistics/statistical-work-areas/rtt-waiting-times/wlmds/.
Endnotes
Authors

Max Warner
Max joined the IFS in 2020. His work covers health and social care, public spending and public sector productivity.

More from IFS
Understand this issue


Policy analysis


Academic research


