
Downloads
Download the report as a PDF
PDF | 826.56 KB
Executive summary
Nearly 900,000 18- to 24-year-olds in Great Britain were not in education, employment or training (NEET) at the end of 2025. Around 300,000 NEETs do not claim benefits, which means the benefit system has no contact with or information about them, and they fall outside the main routes for employment support through work coaches and Youth Guarantee initiatives. These ‘hidden NEETs’ were identified as ‘one of the most troubling findings’ of the interim report of the Milburn Review into young people and work.
This report examines the characteristics of hidden NEETs using the latest wave of the Millennium Cohort Study, which captures young people aged 22–23 in 2023–24. We study two issues: how hidden NEETs are supporting themselves and whether they are struggling financially; and whether hidden NEETs are in need of employment support, based on their labour market behaviour and underlying employability. We validate our main findings for all NEETs aged 18–24 using the Labour Force Survey.
Key findings
- Hidden NEETs aged 22–23 are more closely attached to the labour market than NEETs claiming benefits. 74% are actively looking for work (unemployed), 4% are volunteering and at least 4% are in temporary transitions (for example, have recently returned from university). The majority (57%) have been out of work for less than six months, compared with one-in-six (16%) NEETs on benefits.
- Hidden NEETs also have relatively good educational qualifications and health, which suggests that they are better placed to move into work than NEETs receiving benefits. Around half (54%) have a degree, similar to the share of young people in employment, education or training (EET) and far higher than the 12% for NEETs on benefits. They are around half as likely to report a disability, poor overall health or poor mental health than NEETs on benefits.
- Most hidden NEETs are supported financially by relatively well-off families. Four-in-five live with their parents, and a third of those who live alone receive money for living expenses from family. Hidden NEETs come from very similar family backgrounds to young people in EET: 37% come from families in the top third of household incomes, and 30% come from the bottom third. In contrast, only 6% of NEETs on benefits come from the top third, and 72% from the bottom third.
- As a result, hidden NEETs are less likely to report financial hardship than those receiving benefits despite not receiving benefit income. Just 7% of hidden NEETs say they are finding it ‘very difficult’ to manage financially, compared with 12% for NEETs on benefits.
- Our main data source covers NEETs aged 22–23, but our key findings hold more generally. Hidden NEETs aged 18–24 are also more likely to be living with their parents than NEETs on benefits, less likely to be disabled, and less likely to have low educational qualifications. They are more likely to be unemployed and searching for work (rather than economically inactive), and conditional on being unemployed, less likely to be long-term unemployed.
- The results suggest that investing substantial resources into identifying and tracking all hidden NEETs in a national database, as some have called for, would have limited returns. Many hidden NEETs are likely to move into employment without government intervention.
- However, a sizeable minority of hidden NEETs have been NEET for a long time but are excluded from employment initiatives within the Youth Guarantee – a collection of government schemes to get young people into work, which tie eligibility to the duration of benefit claims. The Jobs Guarantee requires 18 months of non-employment and the £3,000 Youth Jobs Grant requires six months. Among hidden NEETs aged 22–23, 19% and 43%, respectively, have been out of work for long enough to meet these thresholds, but are ineligible because they are not receiving benefits. There is a case for making employment initiatives open to all young people regardless of benefit claims, though doing so would increase the fiscal cost of these programmes, and there are practical implementation challenges.
1. Introduction
At the end of 2025, 870,000 18- to 24-year-olds in Great Britain were not in education, employment or training (NEET). Of these, around 240,000 claim benefits that require them to look for work and meet regularly with a work coach, whilst 310,000 claim out-of-work benefits with no work search requirements, largely because they have a health condition that limits their ability to work. A further 320,000 do not claim out-of-work benefits. This last group is outside the systems through which the government monitors and supports people out of work, and also outside the scope of recent employment initiatives within the Youth Guarantee. We estimate that almost all – just under 300,000 – of this group do not claim any benefits at all, which means that the Department for Work and Pensions does not have any contact with or information about them.1
These ‘hidden NEETs’ have become an increasing focus of policy attention. The interim report of the Milburn Review (Department for Work and Pensions, 2026) states that:
‘One of the most troubling findings of this Review is how many are hidden from the very systems meant to help them […] [who] are not themselves receiving benefits. They are out of work and out of sight. No institution is responsible for finding them or helping them. A system serious about participation would know who these young people are. Ours does not.’
A recent report by the charity Impetus called for an ‘outreach army’ to identify and engage hidden NEETs, arguing that doing so could generate long-run fiscal savings of up to £6 billion (Impetus, 2026).
Despite the growing policy interest, very little is known about who hidden NEETs are and whether they need support. Existing discussions often assume that NEETs outside the benefit system are a particularly disadvantaged group that has slipped through the cracks. But many may simply be temporarily between education and work, or from well-off families who do not need financial support from benefits. Distinguishing between these possibilities is important for designing and prioritising policies to increase youth participation.
This report provides evidence on hidden NEETs using data from the Millennium Cohort Study (MCS), a nationally representative longitudinal survey of people born around the millennium. The latest wave, carried out in 2023–24, surveyed around 10,000 respondents aged 22–23 on their economic activities, living arrangements, sources of income, and education and health outcomes. 15% of young people in the MCS are NEET at these ages, of whom 64% report claiming out-of-work benefits and 67% report claiming any state benefits (see Box 1 for details). The share claiming out-of-work benefits is similar to that derived from the Labour Force Survey (LFS; the official source of NEET statistics) and administrative benefit data (i.e. 60% for 21- to 24-year-olds for the corresponding period).2
Box 1. Identifying hidden NEETs in the Millennium Cohort Study
The Age 23 Sweep of the MCS asks respondents whether they or their partner receives universal credit (UC), and whether they or their partner receive any of a list of other benefits including jobseeker’s allowance (JSA), income support, housing benefit and child benefit. We define hidden NEETs as those who do not report receiving any adult-level benefits (excluding child benefit).
Many benefits, including UC, are paid at the family (benefit unit) rather than the individual level. For benefits paid at the individual level, such as carer’s allowance and disability benefits, the wording of the question means that we cannot tell whether the respondent or their partner receives it. To avoid classifying respondents as reporting these benefits when they are actually paid to their partners, we count someone as receiving carer’s allowance if they or their partner receives it and the respondent reports providing care. Similarly, we count someone as receiving a disability benefit if they or their partner receives it and the respondent reports having a disability.
Like all surveys, the MCS is unlikely to capture the most disadvantaged people, such as those experiencing homelessness or severe addiction. If these people are disproportionately likely to be hidden NEETs, this will also positively bias our results, though the numbers are likely to be too small to meaningfully change our conclusions. The MCS is also deliberately designed to over-sample disadvantaged groups and invests heavily in tracking cohort members with follow-up rates that far exceed other UK labour market surveys (Connelly and Platt, 2014).
This report addresses the following questions. First, how are hidden NEETs supporting themselves financially, and are they experiencing financial hardship as a result of not claiming benefits? Second, are hidden NEETs likely to benefit from employment support, based on their attachment to the labour market, educational attainment and health? Sections 2 and 3 address these questions in turn.
Our main results focus on hidden NEETs aged 22–23. They may not generalise to all hidden NEETs (aged 18–24), for example if hidden NEETs aged 22–23 are disproportionately likely to be recent university graduates. We therefore validate our key findings for all NEETs aged 18–24 in Section 4, using data from the LFS. Section 5 concludes.
2. Are hidden NEETs aged 22–23 struggling financially?
Young people not in education, employment or training (NEETs) who do not claim benefits could be missing out on at least £4,000 a year – the basic level of universal credit (UC) for single people aged under 25 – and more if they have health conditions or housing costs. In this section, we examine whether hidden NEETs are struggling financially as result of not claiming benefits, and how they appear to be supporting themselves.
It could be the case that NEETs who do not claim benefits are ineligible for means-tested benefits because they live with a high-earning partner.3 In practice, however, this is unlikely to be material, as only 12% live with a partner and 8% with a partner in work. Instead, living with parents is much more common, among young people in general and hidden NEETs in particular. Claimants are not disqualified from UC because they live with their parents, and eligibility is not dependent on parents’ financial circumstances.
Four-in-five (80%) hidden NEETs live with their parents, compared with 58% of NEETs on benefits and 68% of young people in employment, education or training (EET), as shown in Figure 1. A further 6% of hidden NEETs live by themselves but receive money from family members for their living costs. Family support therefore plays an important role in maintaining the living standards of hidden NEETs.
Figure 1. Living arrangements and help with living costs at age 22–23 by NEET status
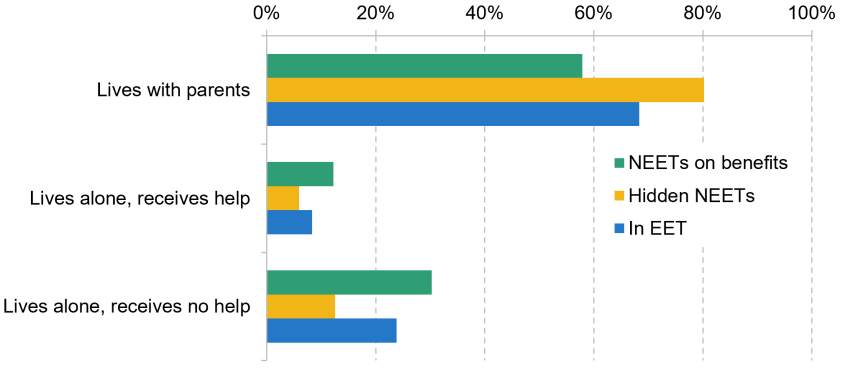
Note: Classed as ‘receives help’ if reports receiving money from a family member or relative towards paying general living expenses in the past month.
Source: Authors’ analysis of MCS Age 23 Sweep.
The financial support available to hidden NEETs reflects their relatively advantaged family backgrounds. Although the MCS does not capture parental circumstances at age 23, we can use an earlier survey wave at age 14 as a proxy. Half (52%) of hidden NEETs come from families that, at age 14, had at least one parent in a managerial or professional occupation, and 37% were in the top third of the household income distribution among households in the MCS (Figure 2). These figures are very similar to those for young people in EET, and far higher than for NEETs on benefits. Among the latter group, just 6% come from families in the top third of incomes, while 72% come from those in the bottom third.
Figure 2. Family socio-economic conditions at age 14 by NEET status at age 22–23
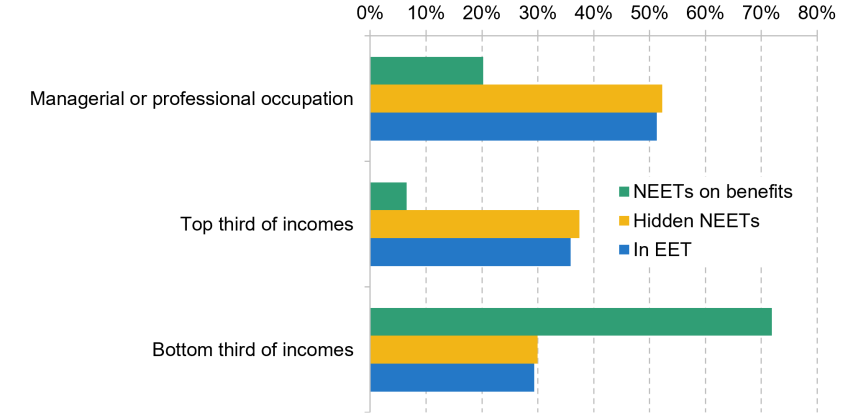
Note: Occupation class is based on the highest National Statistics socio-economic classification of either parent. Household incomes are equivalised using the OECD equivalence scale.
Source: Authors’ analysis of MCS Age 23 Sweep.
As a result of receiving support from relatively well-off families, hidden NEETs are less likely to report financial hardship than NEETs claiming benefits, despite not receiving benefit income. Figure 3 shows that 18% report living comfortably, halfway between the shares for NEETs on benefits (11%) and those in EET (24%). A further 38% say they are ‘doing alright’. The share who say they are finding it ‘very difficult’ to manage financially is just 7%, compared with 12% for NEETs on benefits.
Figure 3. Self-reported financial situation at age 22–23 by NEET status
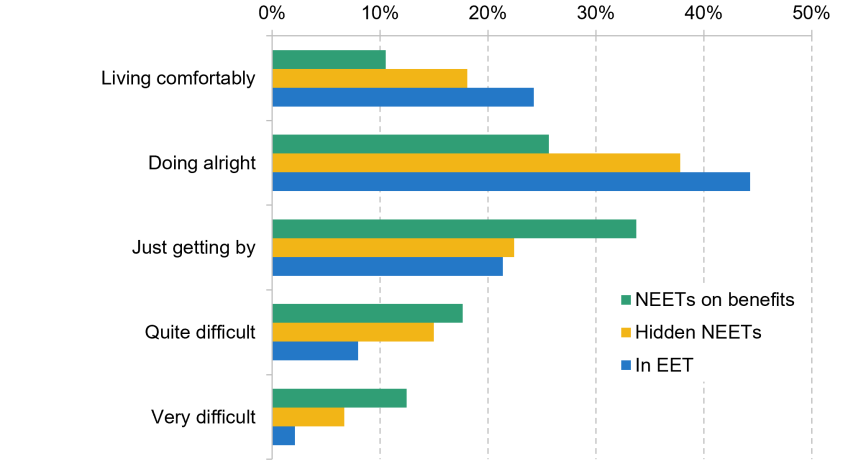
Note: Refers to the question: ‘how well would you say you (and your partner) are managing financially these days?’.
Source: Authors’ analysis of MCS Age 23 Sweep.
3. Do hidden NEETs aged 22–23 need employment support?
In Section 2, we show that many hidden NEETs receive support from relatively well-off families, and may therefore have little need for financial support through the benefit system. However, they may still benefit from the employment support that comes with claiming unemployment benefits. In this section, we consider whether hidden NEETs are likely to need employment support, from two perspectives: their attachment to the labour market – measured by their work search behaviour, time spent out of work and job expectations – and their underlying employment prospects in terms of their educational attainment and health.
Labour market attachment
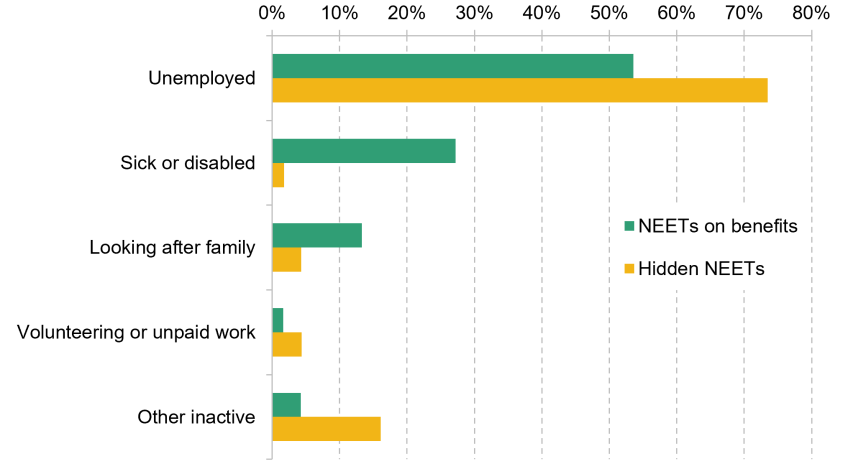
Figure 4 compares the economic activity of hidden NEETs to NEETs on benefits. The majority (74%) of hidden NEETs are unemployed and should be actively looking for work, and a further 4% are engaged in volunteering or unpaid work (Figure 4).4 Just 2% report being out of work because of sickness or disability. As such, hidden NEETs are a much more economically engaged group than NEETs claiming benefits, of whom just over half (54%) are looking for work and 27% are inactive because of ill health.
Figure 4. Economic activity at age 22–23 by NEET status
Note: Refers to main current activity.
Source: Authors’ analysis of MCS Age 23 Sweep.
One-in-six (16%) hidden NEETs report being inactive for ‘other’ reasons than ill health or looking after family. No more detail is available in the employment module of the MCS, but because four-in-five hidden NEETs live with their parents, we can use a question on why they are living with their parents to unpack this further. This suggests that at least 25% of those classed as ‘other inactive’ (4% of all hidden NEETs) are in temporary transitions: just returned from university or travelling, about to go travelling or move abroad, or between work contracts. Taken together, this means that at least four-in-five (82%) hidden NEETs are actively looking for work, doing voluntary work or in a transitional state.5
Most hidden NEETs have been out of employment or education for a short time: 41% for less than three months, and 16% between three and six months (Figure 5).6 That is, the majority of hidden NEETs have been NEET for less than six months, compared with just one-in-six (16%) NEETs on benefits. This is perhaps unsurprising, as the population of hidden NEETs will include people who are in the process of claiming benefits.7 However, a sizeable minority of hidden NEETs are long-term unemployed or economically inactive, with one-in-four (24%) out of work for more than a year, and one-in-five (19%) for more than 18 months.
Figure 5. Duration of NEET status at age 22–23 by NEET status
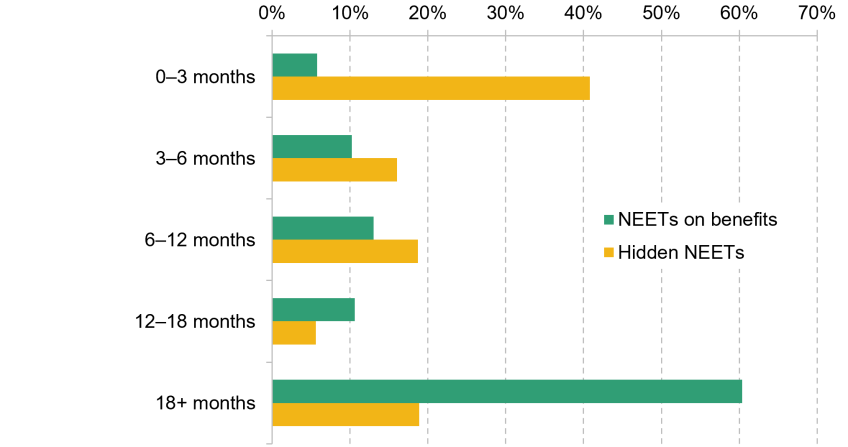
Note: Refers to the duration of the current main activity. If people move between NEET states (e.g. from unemployed to sick or disabled), this will understate their total out-of-work spell. Unfortunately, the MCS does not capture month-by-month employment histories from which continuous NEET spells can be constructed. 10% of NEETs on benefits and 3% of hidden NEETs are missing durations and excluded.
Source: Authors’ analysis of MCS Age 23 Sweep.
We can also use people’s self-reported expectations of future jobs to gauge their attachment to the labour market. 43% of hidden NEETs expect to earn ‘a lot of money’ by age 30, and 73% expect to have a worthwhile job (Figure 6). These expectations are very similar to those of young people in EET. In contrast, NEETs on benefits are around half as likely to expect to achieve these things by age 30.
Figure 6. Job expectations by age 30 at age 22–23 by NEET status
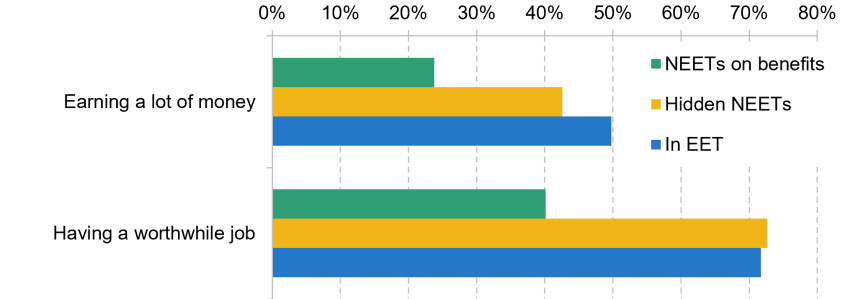
Note: Refers to the question: ‘by the time you are 30, which of the following do you think you will have achieved?’.
Source: Authors’ analysis of MCS Age 23 Sweep.
Education and health
Hidden NEETs also appear relatively advantaged in terms of characteristics associated with employability (see Figure 7). Around half (54%) have a degree, similar to the share of young people in EET (those still studying are classed according to the qualification they are studying towards). The share whose highest qualification is GCSEs or below is also similar to those in EET (around a third). In contrast, just one-in-eight (12%) NEETs on benefits have a degree, and three-in-four (76%) have no qualifications beyond GCSE level.
Figure 7. Highest achieved or expected qualification at age 22–23 by NEET status
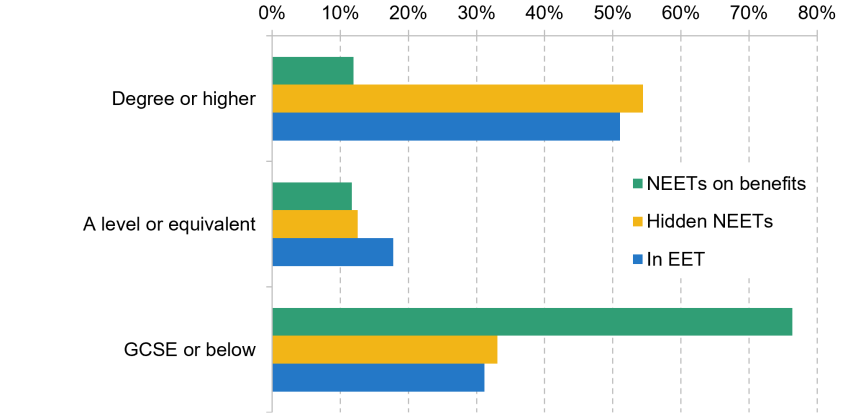
Note: Includes people still in education, who are classified by what they are currently studying towards. Excludes ‘other’ or non-UK qualifications (0.4% overall).
Source: Authors’ analysis of MCS Age 23 Sweep.
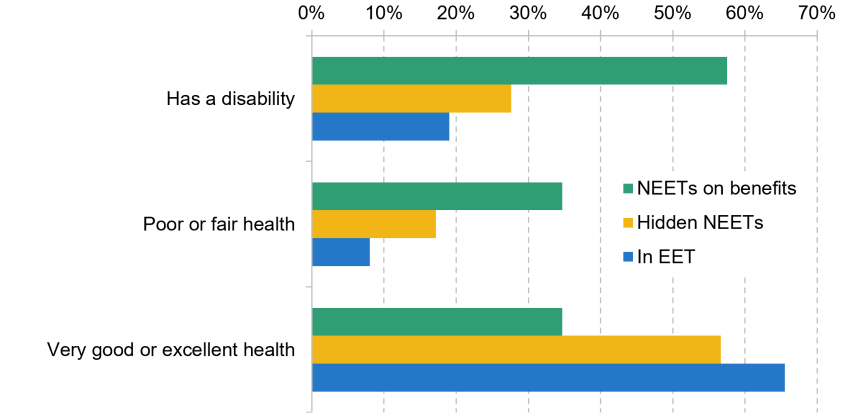
Health tells a similar story. 28% of hidden NEETs report having a disability, and 17% report having poor or fair general health. In both cases, the share of NEETs on benefits reporting health problems is around twice as high (Figure 8). Rates of poor mental health based on clinically validated mental health scales are also around twice as high for NEETs on benefits than for hidden NEETs (Figure 9).
Figure 8. Self-reported health at age 22–23 by NEET status
Note: Self-reported health is on a five-point scale, with the middle category of ‘good’ omitted.
Source: Authors’ analysis of MCS Age 23 Sweep.
Figure 9. Mental health outcomes at age 22–23 by NEET status
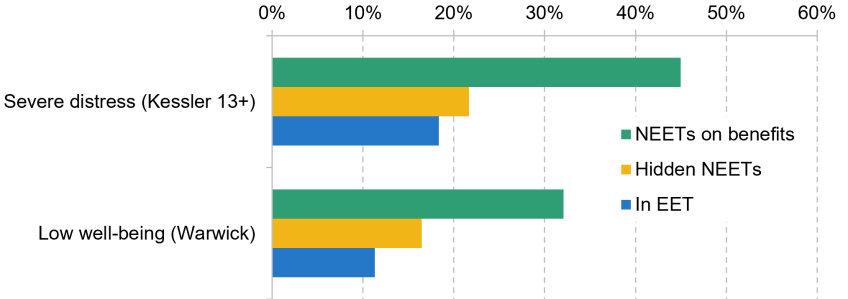
Note: Severe distress under the Kessler-6 scale is defined as a score of 13 or greater on a 0–24 scale. Low well-being under the Warwick–Edinburgh scale is defined as a score more than one standard deviation below the cohort mean.
Source: Authors’ analysis of MCS Age 23 Sweep.
Hidden NEETs have slightly poorer health outcomes than young people in EET. This may partly reflect the negative effect of worklessness on health (Marcus, 2013; Cygan-Rehm, Kuehnle and Oberfichtner, 2017), as very few (2%) hidden NEETs cite ill health as their reason for being NEET.
4. Are hidden NEETs aged 22–23 representative of all hidden NEETs?
Our results above are based on the Millenium Cohort Survey (MCS), which captures young people at ages 22–23. These results may not generalise to all NEETs who are eligible for benefits (aged 18–24), for example if hidden NEETs aged 22–23 are disproportionately likely to be recent university graduates.
We therefore validate our main findings for all NEETs using the Labour Force Survey (LFS), the official source of NEET statistics. The LFS has a smaller sample of young people and less detail on some circumstances, for example mental health and financial support from family. It has also had some well-documented issues with response rates and representativeness since the COVID-19 pandemic, though these have improved in recent years (Office for National Statistics, 2026). However, it has the advantage of capturing all NEETs aged 18–24.
We pool all quarters of the LFS from 2023 to 2025. The share of NEETs who report claiming benefits (other than child benefit) is 53% for 18- to 24-year-olds and 54% 22- to 23-year-olds. This is lower than the share in the MCS (67% for 22- to 23-year-olds), and also lower than the share of NEETs claiming out-of-work benefits implied by dividing the total number of benefit claimants in administrative data by the total number of NEETs in the LFS (63% for 18- to 24-year-olds and 58% for 22- to 23-year-olds).8 The low share of NEETs who report claiming benefits in the LFS – and the corresponding high share of hidden NEETs – is therefore likely to reflect under-reporting of benefit claims in the survey, or under-surveying of benefit claimants, or both.
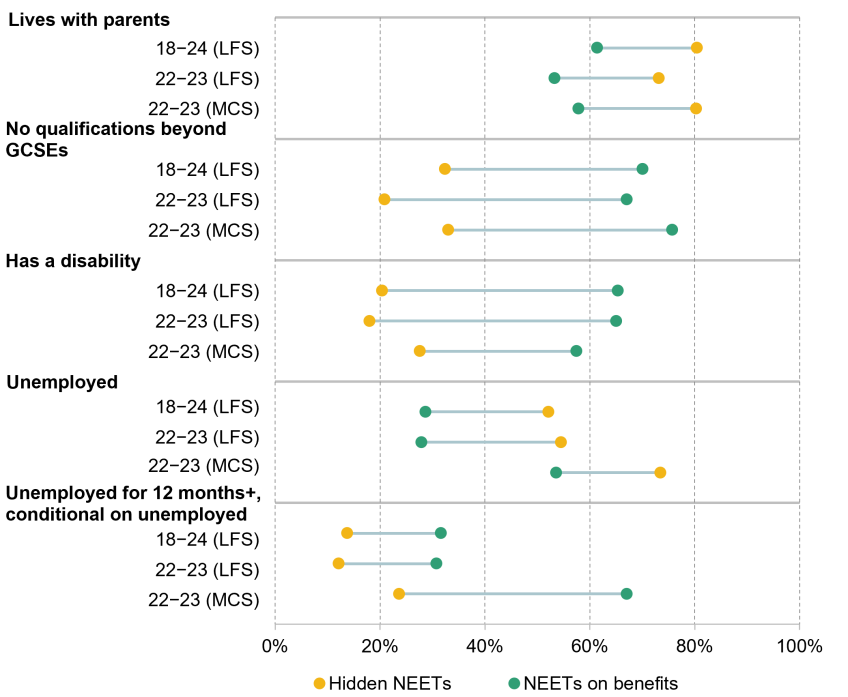
Bearing these data limitations in mind, hidden NEETs in the LFS also appear to be a more advantaged group than NEETs on benefits. This is true both for 22- to 23-year-olds and 18- to 24-year-olds as a whole, as shown in Figure 10. 80% of hidden NEETs aged 18–24 live with their parents, compared with 61% of NEETs on benefits. Hidden NEETs aged 18–24 have stronger employment prospects than those receiving benefits in terms of their education and health: only 32% have no qualifications beyond GCSEs, and only 20% have a disability, compared with 70% and 65%, respectively, for NEETs on benefits.
Figure 10. Characteristics of NEETs in the MCS (ages 22–23) and LFS (ages 18–24 and 22–23)
Note: Definition of unemployment differs in the MCS and the LFS (see footnote 9).
Source: Authors’ analysis of MCS Age 23 Sweep and LFS 2023Q1 to 2025Q4.
The share of NEETs who are unemployed, as opposed to economically inactive, is lower in the LFS than in the MCS.9 However, the LFS also shows that hidden NEETs are more likely to be unemployed than NEETs on benefits, and therefore likely to be closer to the labour market as they are actively searching for work. 52% of hidden NEETs aged 18–24 are unemployed, compared with 29% of NEETs on benefits. Conditional on being unemployed, hidden NEETs are also less likely to be long-term unemployed: 14% have been unemployed for more than a year, compared with 32% of NEETs on benefits.10
Taken together, this suggests that our main findings for NEETs aged 22–23 hold for NEETs more generally. Hidden NEETs appear to be a more advantaged group than NEETs on benefits in terms of family support, education and health outcomes, and attachment to the labour market.
5. Conclusion
Hidden NEETs who do not claim benefits have become an increasing concern for policymakers. This report suggests that they are a less worrying group than NEETs who are receiving benefits. Detailed survey data on 22- to 23-year-olds shows that most hidden NEETs are actively looking for work or in temporary transitions, and have education and health outcomes that are much closer to young people in education, employment or training than to NEETs claiming benefits. They are much more likely to be supported financially by higher-income families. The finding that hidden NEETs are more advantaged than NEETs on benefits holds in the (less detailed) data available for all NEETs aged 18–24.
This suggests that large-scale administrative efforts to track and engage all hidden NEETs, as some have called for, may have limited returns. Many people in this group are likely to move into employment without government intervention.
However, a sizeable minority have been NEET for a long time: 43% of hidden NEETs aged 22–23 have been NEET for more than six months and 19% for more than 18 months. These young people may benefit from employment support but are excluded from existing employment initiatives within the Youth Guarantee, where eligibility is tied to the duration of benefit claims. These include the Jobs Guarantee, which fully subsidises wages for six months for young people who have been in the UC ‘searching for work’ group for 18 months or more, and the £3,000 Youth Jobs Grant to employers hiring young people who have been on UC for six months or more.
A more proportionate response could be to widen access to these programmes to NEETs not on benefits, as recently recommended by the Work and Pensions Committee (2026). The eligibility criteria would need to be worked out. One option would be to base eligibility on a sustained lack of earnings in PAYE records rather than benefit duration, although this would also need to account for participation in education, for which administrative data may not be sufficiently up to date. Extending Youth Guarantee programmes to hidden NEETs is also likely to increase their fiscal cost. At present, the net cost of these programmes is reduced by the benefit savings generated when a claimant moves into work; because hidden NEETs are not claiming benefits, there would be no equivalent saving to offset the cost of supporting them.
References
Connelly, R. and Platt, L., 2014. Cohort profile: UK Millennium Cohort Study (MCS). International Journal of Epidemiology, 43(6), 1719–25, https://academic.oup.com/ije/article-abstract/43/6/1719/703283?redirectedFrom=fulltext
Cribb, J., Emmerson, C. and Karjalainen, H., 2024. Means-tested support for people approaching and beyond state pension age. IFS Report, https://ifs.org.uk/sites/default/files/2024-12/Means-tested-support-for-people-approaching-and-beyond-state-pension-age.pdf
Cygan-Rehm, K., Kuehnle, D. and Oberfichtner, M., 2017. Bounding the causal effect of unemployment on mental health: nonparametric evidence from four countries. Health Economics, 26, 1844–61, https://onlinelibrary.wiley.com/doi/10.1002/hec.3510
Department for Work and Pensions, 2026. Young people and work: interim report. Department for Work and Pensions report, https://www.gov.uk/government/publications/young-people-and-work-interim-report/young-people-and-work-interim-report
Impetus, 2026. Closing the youth jobs gap. Impetus report, https://impetus-org.files.svdcdn.com/production/assets/publications/Report/Impetus-Closing-the-Youth-Jobs-Gap-2026.pdf?dm=1784035999.
Office for National Statistics, 2026. Labour Force Survey quality update: April 2026. https://www.ons.gov.uk/employmentandlabourmarket/peopleinwork/employmentandemployeetypes/articles/labourforcesurveyqualityupdate/april2026
Marcus, J., 2013. The effect of unemployment on the mental health of spouses – evidence from plant closures in Germany. Journal of Health Economics, 32, 546–58, https://www.sciencedirect.com/science/article/abs/pii/S0167629613000118?via%3Dihub
Work and Pensions Committee, 2026. Youth employment, education and training. House of Commons report, https://publications.parliament.uk/pa/cm5902/cmselect/cmworpen/180/report.html
Youth Futures Foundation, 2026. Trends in young people not in education, employment or training: July–September 2025. Youth Futures Foundation report, https://youthfuturesfoundation.org/publication/trends-in-young-people-not-in-education-employment-or-training-july-september-2025/
Endnotes
Authors

Jed Michael
Jed joined the IFS in 2025 and works in the Income, Work and Welfare (IWW) sector.

Xiaowei Xu
Xiaowei joined the IFS in 2018 and works in the Income, Work and Welfare sector.
More from IFS
Understand this issue


Policy analysis


Academic research


