
Downloads
Download the chapter as a PDF
PDF | 1.64 MB
Correction: This chapter was edited on 15 October 2025. We estimate the fiscal saving from a 6-month UI to be £1.4 billion a year, and from a 12-month UI to be £0.6 billion a year. In a previous version of this chapter, we estimated these savings to be worth £3 billion and £2 billion respectively. The updated figures reflect that existing NS ESA claimants on means-tested legacy benefits, and not only those currently claiming UC, could expect to be compensated with a higher award of means-tested benefits in the event that they lost eligibility to the new UI.
Key findings
- The UK social security system offers relatively little income protection after job loss. Across all OECD countries, single homeowners who have just lost their jobs retain 55% of their in-work incomes on average, falling to 22% five years into unemployment. In the UK, this ‘replacement rate’ is 12% in both cases, as means-tested benefits (available for those on low incomes) are low relative to average earnings and non-means-tested contributory benefits (available to those who have previously ‘paid in’) are not set at a higher rate. The UK system is slightly more generous for renters with children, but still has the (joint) fourth-lowest replacement rate immediately after job loss among OECD countries.
- At the same time as taxes have risen to a post-war high, and are expected to rise further, spending on contributory benefits has fallen to just 0.3% of national income and to 6% of the working-age benefits bill. This is down from 1.3% of national income and 41% of working-age benefits in 1978–79. Contributory benefits have become less generous relative to means-tested benefits, eroding the link between contribution and reward that originally underpinned the welfare state.
- The government proposes to introduce a new ‘unemployment insurance’ (UI) that would replace the existing working-age contributory benefits for those not in paid work, new style jobseeker’s allowance (NS JSA) and new style employment & support allowance (NS ESA). The new UI would offer time-limited support at the higher NS ESA rate, currently only available to those assessed to have work-limiting health conditions.
- The government’s proposed UI would still offer little income protection by European standards. The proposed rate of £140.55 a week, up from £92.05 a week for NS JSA, amounts to an increase from 12% to 19% of average (mean) earnings, equivalent to a third (33%) of full-time earnings on the National Living Wage. This is a very big increase. But most European countries have graduated UI schemes that replace around 60–80% of previous earnings up to a cap, which generally exceeds a third of average full-time earnings.
- The government has yet to decide on how long individuals will be able to claim the new benefit for. NS JSA is currently available for up to six months, and NS ESA is available indefinitely for most claimants. Taking NS ESA and NS JSA together, four in five current benefit claimants have been in receipt of the benefit for at least one year, with 88% of NS benefit spending going towards these long-term claims. Nearly two-thirds of claimants have claimed for five or more years.
- Because there are so many long-term claimants, fiscal savings fromtime-limiting the new UI benefit are likely to offset the cost of higher benefit levels and extending the benefit to the self-employed. We estimate that replacing NS benefits with a 6-month UI would reduce spending by around £1.4 billion a year in the long run, after any transitional protections are exhausted. A 12-month UI would reduce spending by around £0.6 billion in the long run.
- If the reforms only applied to new claimants, with existing NS ESA claimants unaffected, savings would take many years to materialise. One option is to ‘reset the clock’ for existing NS ESA claimants, moving them onto the new UI and allowing them to claim for up to the new maximum benefit duration, to give them time to adjust to any falls in income. Low-income households should be protected, as they would be able to claim universal credit at the same rate as the NS ESA Support Group rate. For a 12-month UI, this would mean a fiscal cost of £1.5 billion in the first year (from higher rates and expanded eligibility), with savings only materialising in the second year.
- Estimated fiscal effects are sensitive to assumptions on the post-reform take-up rate, though the overall take-up rate (across all individuals with sufficient contributions) would have to exceed 90% for a 6-month UI to result in a fiscal cost rather than a saving; for a 12-month UI, take-up would have to exceed 50%.
- Given the likely fiscal savings from the reform, the government could choose to be bolder on benefit duration – for example, by offering the new UI for 12 months rather than 6. Just over half (53%) of workers who lose their jobs find another job within 12 months, so a 12-month UI benefit would cover about half of workers for their entire out-of-work spells.
- The reform offers an opportunity to improve some of the policy design issues in the current system – for example, the time period used to assess an individual’s National Insurance contributions record and the treatment of earnings whilst on the benefit. It will be important that the new UI is closely integrated with universal credit, to ensure that low-income households who have made sufficient contributions also benefit from higher rates and to avoid unintended effects on work incentives.
8.1 Introduction
In March 2025, the government proposed a wide-ranging set of reforms to working-age benefits in the ‘Pathways to Work’ Green Paper (Department for Work and Pensions, 2025). While the high-profile reforms to personal independence payments have since been dropped, one significant proposal remains which has largely escaped media attention: a redesign of the UK’s contributory benefits system for working-age individuals who have lost their jobs.
Contributory benefits are benefits that are awarded based on past contributions rather than current need (that is, they are not means-tested). In many countries, the amount of contributory benefits payable, as well as eligibility, is related to past contributions – for example, they may be paid in proportion to previous earnings (up to a cap) or the number of years worked. The UK has two contributory benefits for people who are out of work: new style jobseeker’s allowance (NS JSA), available to those deemed able to work and who are actively seeking work, and new style employment & support allowance (NS ESA), for those assessed as being unable to work for health reasons. Both benefits pay a flat rate, but are contributory in the sense that eligibility for them depends on an individual’s past National Insurance contributions (NICs), not on their savings or household income. The government proposes to replace these benefits with a single ‘unemployment insurance’ (UI), paid at the higher rate of NS ESA.
The UK’s contributory benefits system is ripe for reform. Contributory JSA and ESA have not been reformed since their introductions in 1996 and 2008 respectively – they were simply rebranded ‘new style’ with the move to universal credit (UC), which overhauled the means-tested working-age benefits system. The number of people claiming contributory benefits has declined over time and they now account for a negligible portion of overall spending on working-age benefits. The COVID-19 pandemic exposed the inability of the current system to insure against widespread shocks, requiring a new earnings-related benefit – the furlough scheme – to be swiftly built from scratch.1 The tax take has risen to a post-war high and is expected to rise further, further eroding the link between contributions and rewards, and raising questions in some quarters about the need for a new social contract based on the contributory principle.
This chapter discusses the context for the proposed reform and assesses potential policy options, with a particular focus on benefit duration – the key parameter of the proposed benefit that the government has yet to set. Section 8.2 sets out the government’s stated reasons for the reform and briefly discusses the wider historical context. Section 8.3 describes the current and proposed contributory benefit systems and compares them. In Section 8.4, we discuss the implications of different benefit durations in terms of people’s incentives to find work and the coverage and fiscal cost of the proposed system. More detailed policy design options, such as how the new benefit interacts with universal credit and how eligibility is determined, are discussed in Section 8.5. Section 8.6 concludes.
8.2 Context for reform
The ‘Pathways to Work’ Green Paper announced plans to establish ‘a new, simple and clear “Unemployment Insurance” benefit through the reform of contributory working-age benefits’ (Department for Work and Pensions, 2025). This would be a new time-limited, non-means-tested entitlement for people who have made sufficient National Insurance contributions, paid at a higher rate than the standard allowance of universal credit. The benefit would not require a health assessment, and claimants would be expected to seek work actively ‘with easements for those with work-limiting health conditions’, thereby removing the binary distinction between jobseekers and those who are unable to work for health reasons in the current contributory benefits system.
The Green Paper cites two key reasons for the proposed reform. First, it seeks to re-establish the ‘something-for-something’ principle upon which the welfare state was founded, stating that ‘as part of restoring faith in the social security system, people need to know that if they have paid in, they will get support when they need it’. Second, the proposed system forms part of the government’s wider plan to make the welfare system more ‘pro-work’, by reducing the incentive for claimants to demonstrate an inability to work in order to access more generous benefits. Unlike the current system, the proposed unemployment insurance would not have a higher rate for people with health conditions (those receiving universal credit would still be able to access means-tested health elements), and would be time-limited for all claimants. In addition, claimants of the proposed unemployment insurance would be required ‘as a minimum, to participate in conversations’ about returning to work with employment support coaches, ‘with appropriate exemptions’.
To understand the wider context of the proposal, it is worth bearing two things in mind. First, the UK is unusual among European countries in not having a temporary higher level of benefits for those who have recently lost their jobs. Combined with the relatively low level of means-tested support available through universal credit, this means that many people face large drops in living standards following job loss. Second, the tax take (as a share of GDP) is at historical highs and is expected to rise further, whilst the role of contributory benefits has fallen. This has led some to call for a renewed social contract based on a reassertion of the contributory principle. We discuss these points below.
The UK is unusual in not having a temporary higher level of benefits after job loss
Most OECD countries have two layers of support for people who are not in work: means-tested social safety-net benefits for those on low incomes; and non-means-tested unemployment insurance benefits, which are based on previous contributions and generally time-limited.2 In the vast majority of OECD countries, unemployment insurance benefits are tied to previous earnings and are significantly higher than social safety-net benefits. In contrast, contributory unemployment benefits in the UK are paid at a low flat rate, equivalent to the standard rate in universal credit (the means-tested social safety-net benefit for working-age families). This means that people often face large drops in income immediately after losing their jobs.
Figure 8.1 shows the proportion of disposable in-work income that is retained in unemployment – the ‘net replacement rate’ – in OECD countries for a single homeowner on the average wage without children. The replacement rate one month after job loss is denoted by diamonds and the rate five years after job loss is denoted by lines. In the UK, the replacement rate is 12% in both cases, meaning that single homeowners who have lost their jobs retain under an eighth of their in-work disposable income, both immediately after job loss and five years into unemployment. Across all OECD countries, single homeowners who have just lost their jobs face an average replacement rate of 55%, which falls to 22% five years into unemployment as time-limited benefits are withdrawn.
Figure 8.1 Net replacement rates in unemployment for a single homeowner on average wage without children, OECD countries, 2024
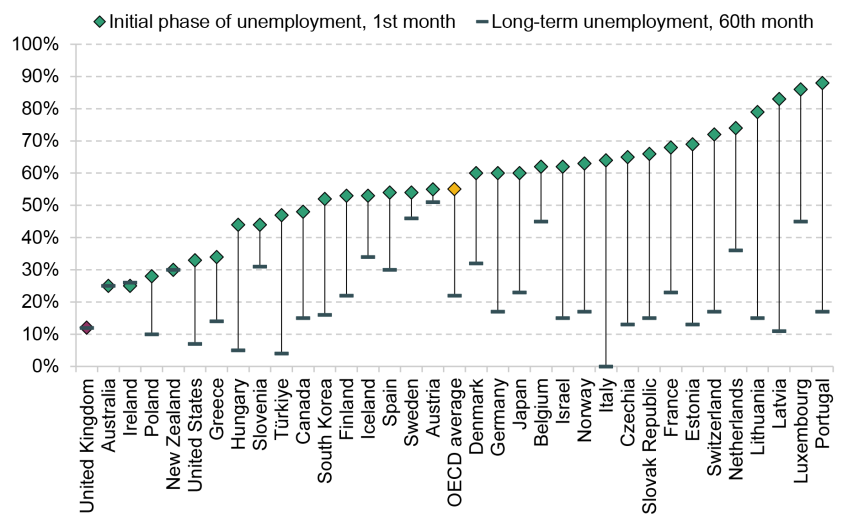
Note: Replacement rate defined as percentage of disposable household income before job loss. Unemployment schemes in the US vary by state; the figures are based on Michigan.
Source: OECD Data Explorer, DSD_TAXBEN_NRR@DF_NRR table.
In large part, this reflects the different foundations of the welfare state in the UK, summarised in Box 8.1. Unlike the earnings-related model adopted by most European countries, the UK opted for a system of flat-rate subsistence benefits (Timmins, 2024). An earnings-related element was introduced to the contributory UK unemployment benefit in 1966, but this was abolished in 1982. Whilst Beveridge intended for the flat-rate contributory benefits to always be higher than the means-tested rate, in practice there has never been a stable contributory premium (Brien et al., 2022). Standard rates of contributory and means-tested benefits have been aligned since 1996, with the exception of the COVID-19 pandemic, when for 18 months the £20 a week uplift to universal credit meant that means-tested benefits were more generous than contributory benefits.
Box 8.1 Beveridge’s design for Britain’s modern welfare statea
Most European countries built their modern welfare states around the Bismarckian model introduced in Germany in the late 19th century, which involves earnings-related benefits in exchange for earnings-related contributions. By contrast, William Beveridge’s report of 1942 – widely regarded as the foundation of the British welfare state – proposed a National Insurance system that involved flat-rate benefits in exchange for flat-rate contributions. The benefits would be granted ‘as of right and without means test’, intended to be considered insurance rather than charity. They would be set at subsistence level, in order to preserve incentives to save and to return quickly to work, but would be higher than the means-tested safety net, in order to reward contributions.
National Insurance benefits were the primary out-of-work benefit when the system was introduced in 1948, with means-tested National Assistance playing a residual role. However, changes to the labour market, family structure and housing market led to an expansion of means-tested benefits, and a series of government policies further eroded the contributory premium and the ‘something-for-something’ principle.
a. This summary of William Beveridge’s 1942 report, Social Insurance and Allied Services, draws from Brien et al. (2022) and Timmins (2024).
Figure 8.1 shows that for single homeowners without children, unemployment benefits immediately after job loss in the UK are by far the least generous among OECD countries.3 This is partly because the UK welfare state is heavily focused on supporting families with children and housing costs. Figure 8.2 plots replacement rates for a single renter on the average wage with two children. The UK is less of an outlier on this measure, though it still has the (joint) fourth-lowest replacement rate in the first month of unemployment, and is in the bottom third in terms of long-term unemployment. The gap (of 6% of the average wage) between replacement rates immediately after job loss and in long-term unemployment reflects the nine-month ‘grace period’ in the benefit cap, which disproportionately affects renter families with children.
Figure 8.2. Net replacement rates in unemployment for a single renter on average wage with two children, OECD countries, 2024
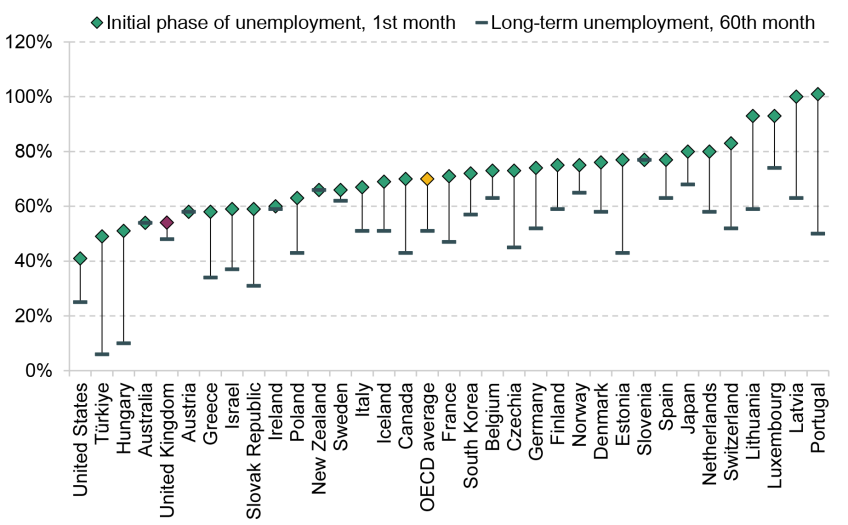
Note: Replacement rate defined as percentage of disposable household income before job loss. Unemployment schemes in the US vary by state; the figures are based on Michigan.
Source: OECD Data Explorer, DSD_TAXBEN_NRR@DF_NRR table.
It is worth noting that the UK is less of an outlier among anglophone countries in not having a higher, earnings-related benefit immediately after job loss. Australia and New Zealand do not have contributory, non-means-tested unemployment benefits, though social security benefits are more generous in New Zealand than in the UK, and the Australian system is more generous for single homeowners. Ireland also had a flat-rate benefit in 2024 (captured in Figures 8.1 and 8.2), but it introduced a new earnings-related system in 2025. Canada has an earnings-related benefit, and unemployment benefits in the US vary by state, but virtually all of them are earnings-related.
The low replacement rates in the UK mean that individuals who lose their jobs can face large drops in their living standards, unless they have sufficient savings. This can be challenging as households often have spending commitments that are difficult to adjust in the short term, such as rent or debt repayments, and many have low savings (Sturrock, 2020). It also means that the system as a whole is poorly equipped to cushion against widespread shocks. As a result, when the pandemic struck, the government designed a furlough scheme from scratch in order to reduce the drop in household incomes and consumption. Looking ahead, the possibility of more disruptions – for example, from trade conflicts or artificial intelligence – could provide a case for higher temporary benefits to tide people over periods of transition and/or give them time to adjust their spending.
The tax take has increased to historical highs whilst contributory benefits have fallen
A second important piece of context is that the tax take has risen sharply since the pandemic and is projected to rise further. Having remained remarkably stable at around 33–34% over the 2010s, taxes as a share of GDP have increased rapidly since the pandemic, to 35.0% in 2024–25 (Figure 8.3). In March 2025, the Office for Budget Responsibility forecast that the tax take would continue to rise, reaching a post-war high of 37.7% by 2027–28. Direct taxes on the very-highest-income households have increased substantially since 2010–11, whilst entitlements such as child benefit and the new childcare subsidies have been withdrawn from, or not made available to, this group.
Figure 8.3. Taxes and contributory benefits as a share of national income
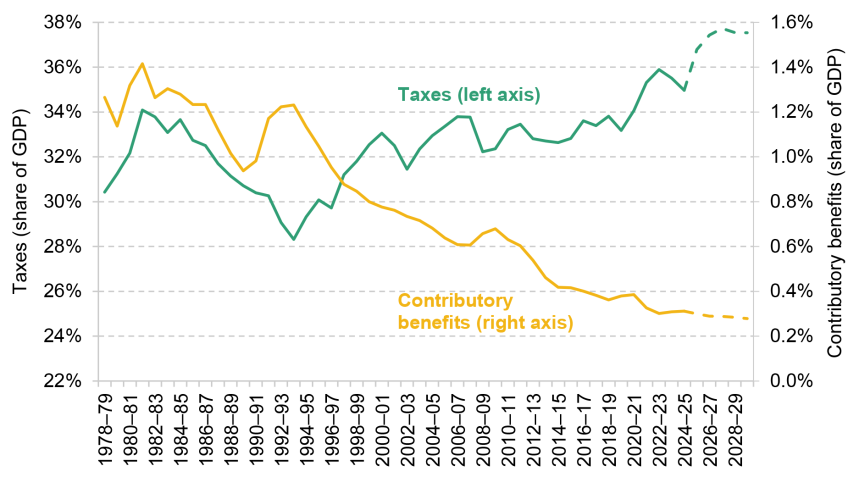
Source: Department for Work and Pensions, Benefit Expenditure and Caseload Tables, Spring Statement 2025; Office for Budget Responsibility, Economic and Fiscal Outlook, March 2025.
At the same time, the role of contributory benefits has shrunk, eroding the ‘something-for-something’ principle that underpinned foundations of the welfare state. Figure 8.4 shows total spending on working-age benefits since 1978–79 in 2025–26 prices. Whilst total spending on working-age benefits in 2025–26 is forecast to be 3.4 times higher than at the start of the period, spending on contributory benefits has actually declined in real terms, almost halving from £17 billion in 1978–79 to £9 billion this year. As a share of GDP, this represents a fall from 1.3% to just 0.3% (Figure 8.3).
Figure 8.4. Spending on working-age benefits, 2025–26 prices

Note: ‘Other’ includes non-contributory and non-income-related benefits excluding child benefit, including disability benefits. Child benefit has been withdrawn for high-income families from 2013, and so could be thought of as a means-tested benefit from that point. Figures from 2025–26 onwards are forecasts, and are consistent with Office for Budget Responsibility, Economic and Fiscal Outlook, March 2025.
Source: Department for Work and Pensions, Benefit Expenditure and Caseload Tables, Spring Statement 2025.
Beveridge originally proposed a system of flat-rate benefits in return for flat-rate contributions. The 1960s saw a move towards both contributions and benefits being graduated by income: National Insurance contributions (NICs) stopped being payable at a flat rate, and earnings-related components were introduced in both the state pension and contributory unemployment benefits. Today, whilst NICs continue to be levied as a proportion of earnings, neither pensions nor unemployment benefits are earnings-related.4 Further, contributory benefits have become less generous relative to the means-tested safety net. For example, contributory and means-tested rates were aligned with the introduction of jobseeker’s allowance (JSA) in 1996, and contributory JSA became payable for only six months, rather than a year, with claimants required to ‘actively seek work’.5
Meanwhile, there has been a massive expansion of means-tested working-age benefits, reflecting a rise in spending on in-work, housing and disability benefits. The combination of rising means-tested benefits and shrinking contributory benefits means that the latter now constitute a negligible part of the overall benefits system. Spending on contributory benefits has fallen from 41% of total working-age benefits in 1978–79 to just 6% in 2025–26 (see Figure 8A.1 in the appendix). As a recent report from the Social Security Advisory Committee and the Institute for Government put it, ‘for those of working-age, the reward for paying what used to be known as “the stamp” – i.e. NICs – has shrunk over the years’ (Brien et al., 2025).
This has led some to call for a renewed social contract, based on a reassertion of the contributory principle. The think tank Labour Together, for example, recently proposed reinstating ‘the stamp’ in digital form, and introducing an earnings-based unemployment insurance (Wild, 2025). Other think tanks such as Demos, Policy Exchange and the Resolution Foundation have also called for earnings-based contributory benefits (O’Leary, 2013; Hughes and Miscampbell, 2015; Brewer and Murphy, 2023). ‘Rewarding contribution’ is expected to be a key theme of the upcoming Budget.6
8.3 Current and proposed systems
This section provides an overview of the two current contributory benefits for out-of-work working-age individuals and compares them with the proposed unemployment insurance benefit. Some detailed policy design options, including earnings disregards, tax treatment and the interaction with universal credit, are discussed in Section 8.5.
New style jobseeker’s allowance and employment & support allowance
NS JSA and NS ESA are contributory out-of-work benefits for working-age adults. They are not means-tested, which means that eligibility does not depend on an individual’s savings or their partner’s income. They are the continuation of JSA (introduced in 1996) and ESA (introduced in 2008), which included both means-tested and contributory elements. After the introduction of universal credit (UC), which replaced the means-tested elements, the contributory elements were renamed ‘new style’ and continued to operate mostly unchanged.
The two contributory benefits are mutually exclusive. Table 8.1 later outlines the key features of NS JSA and NS ESA, as well as those of the proposed unemployment insurance. NS ESA is for people with health conditions that limit their ability to work, as determined by a work capability assessment, which also determines eligibility for the health element of UC. Those assessed as having ‘limited capability for work and work-related activity’ and placed in the Support Group – who made up 94% of all NS ESA claimants in February 2025 – are eligible for the benefit indefinitely; others (assessed as having limited capability for work but able to prepare for work) face a maximum benefit duration of 12 months. NS JSA is intended to provide temporary support to people who are able to work, and is payable for around six months (182 days).
Rates of NS JSA are aligned with the standard allowance of UC, currently £92.05 a week for adults aged 25 and over. Claimants are expected to look actively for work, with equivalent work-search conditions to those for out-of-work UC claimants. NS ESA claimants in the Support Group are entitled to a higher rate of £140.55 a week. This is lower than the current UC entitlement for people with health conditions (£189.50 a week), but roughly equivalent to the reduced amount available to new claimants from April 2026. NS ESA claimants in the Support Group are not required to engage in any work-search activities, similar to recipients of the health element in UC.
Those who are eligible for UC can claim it alongside NS JSA or NS ESA, but in the case of dual claims, the UC award is reduced pound for pound by the value of new style (NS) benefits received. Since NS JSA has the same rate as the standard allowance in UC and the same work-search requirements, and NS ESA is less generous than UC for those with work-limiting health conditions, those entitled to means-tested benefits currently have little incentive to claim contributory benefits alongside.7
Eligibility for NS benefits is assessed based on National Insurance contributions (NICs) made in the two tax years prior to the claim. Eligibility criteria are complex, but essentially have both a work duration condition and an earnings condition: claimants must be treated as having paid NICs – that is, they must have earned at least the lower earnings limit (LEL, currently £125 a week) – on at least 26 weeks in one of the two previous tax years; and have earned at least 50 times the LEL in each of the two previous tax years.8 This is a relatively low threshold – for example, someone continuously working 20 hours a week on the National Living Wage would earn £244 a week, around £6,350 over six months, taking them above both the duration and earnings thresholds for that year. It is worth noting that under the current system, people can be eligible for contributory benefits without ever having paid NICs (or income tax), which is only payable on earnings above the primary threshold of £242 a week. NS JSA is based on Class 1 NICs, so is only available to employees, whilst NS ESA is also available to the self-employed (based on Class 1 or Class 2 NICs).9
The number of claimants on contributory benefits has been in gradual decline, in part due to the focus on rolling out UC (Social Security Advisory Committee, 2022). The rise in self-employment, especially at the more precarious end of the labour market, may also have contributed to falling entitlements to NS JSA (Giupponi and Xu, 2020). Figure 8.5 shows that the caseload for contributory JSA fell from around 200,000 in the late 1990s to just 46,000 in 2024–25, with a temporary (sixfold) uptick over the pandemic. Contributory ESA caseloads stood at 752,000 in 2024–25, with no visible uptick in the pandemic; its predecessor, contributory incapacity benefit, had a caseload of 1.8 million in 1996–97. We estimate that around 13,300 new claims were made for NS ESA in the latest data in February 2025 and 34,400 new claims for NS JSA.10
Figure 8.5. Caseload for contributory out-of-work benefits
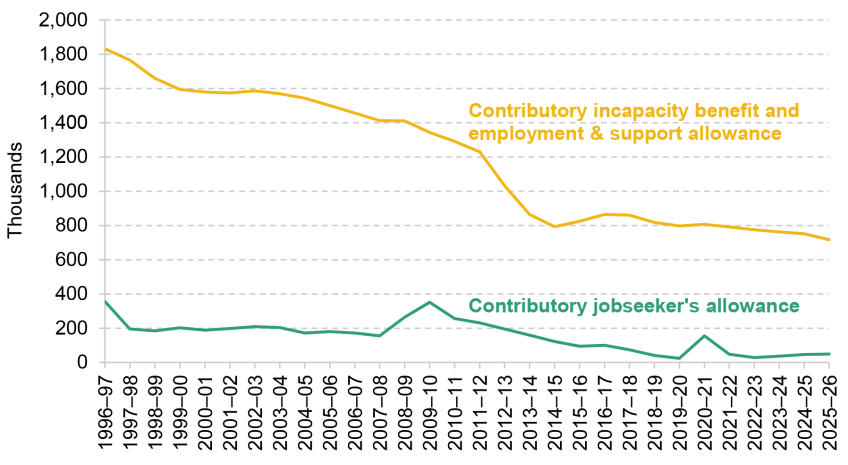
Note: Caseloads shown are an average over the financial year. ESA was introduced in 2008–09. Its predecessor, incapacity benefit, was virtually phased out by 2014–15 and fully phased out by 2018–19.
Source: Department for Work and Pensions, Benefit Expenditure and Caseload Tables, Spring Statement 2025.
Proposed unemployment insurance
The ‘Pathways to Work’ Green Paper proposed to establish a new unemployment insurance (UI) benefit that would replace NS JSA and NS ESA, paid at the NS ESA Support Group rate (currently £140.55 a week). The Green Paper specified that the government would look to ‘carry over’ the current eligibility criteria based on National Insurance contributions in the last two tax years and also plans to extend the new benefit to the self-employed.
The benefit would be time-limited, though the Department for Work and Pensions is still consulting on the benefit duration; the Green Paper gives the example of 6 to 12 months. This would end the indefinite entitlement to NS ESA for new claimants – in February 2025, 90% of NS ESA claimants had claimed for at least a year and 70% for at least five years. The Green Paper further states that unlike the current system, where virtually all NS ESA claimants are exempt from job-search requirements, ‘almost all disabled people and people with long-term health conditions receiving the new contributory benefit would be required, as a minimum, to participate in conversations as part of a new offer of tailored employment support with appropriate exemptions’.
The proposed UI benefit represents a substantial increase in the generosity of unemployment benefits, of £48.50 per week or more than 50% (see Table 8.1). However, it would still be low relative to average earnings, at just 22% of median (19% of mean) weekly earnings in 2025–26, or 19% of median (12% of mean) full-time weekly earnings.11 For those working full-time on the National Living Wage, the UI would represent 33% of in-work earnings. In contrast, the vast majority of Western European countries have graduated UI schemes that replace around 60–80% of previous earnings up to a cap, where in every case this cap is set at more than a third of average full-time wages (see Table 8A.1 in the appendix for a summary). Ireland has recently moved from a flat-rate UI benefit to one that replaces 50–60% of earnings in the initial phase of unemployment; Greece, the only remaining Western European country with a flat rate other than the UK, is currently piloting a UI with both flat-rate and earnings-based components.12
Table 8.1. Comparison between current and proposed contributory benefits

Note: Caseloads are rounded to the nearest hundred and exclude Northern Ireland. NS JSA figures are a forecast for 2025–26 and NS ESA figures are from February 2025. A further 39,900 claimants were in the NS ESA assessment phase in February 2025.
Source: Government websites; Department for Work and Pensions, Benefit Expenditure and Caseload Tables, Spring Statement 2025; DWP Stat-Xplore.
The groups of people who are financially affected by the proposed UI are summarised in Table 8.2. Previously employed individuals eligible for NS JSA under the current system would gain from the higher benefit level, and could gain from a longer benefit duration if it is extended beyond six months. Previously self-employed workers without health conditions who become eligible for the new UI would also gain. In contrast, out-of-work individuals who are past the new UI duration, who would have been eligible for NS ESA indefinitely under the current system, would lose out from the proposed UI, though those eligible for means-tested benefits could get the same amount in UC. The relative sizes of these groups under different benefit durations are discussed in Section 8.4. Beyond financial impacts, claimants with health conditions who face no work-search requirements under the current system (in the NS ESA Support Group) would be required to ‘participate in conversations’ under the proposed UI – of course, whether this counts as a gain or a loss depends on the extent to which they would benefit from employment support.
Table 8.2. Groups affected financially by proposed unemployment insurance (UI), relative to current system
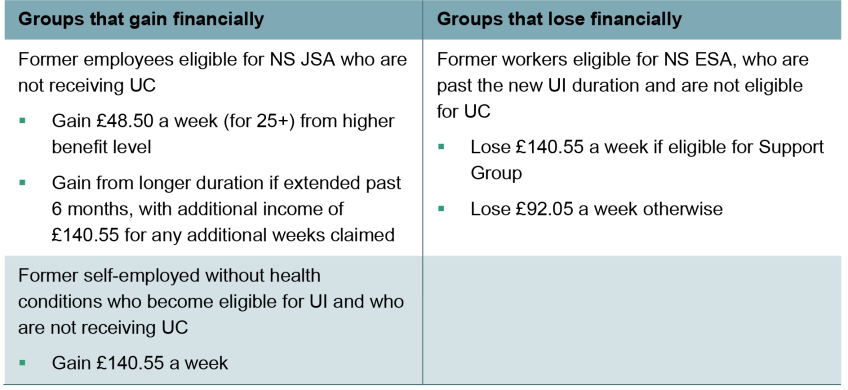
Note: If the new UI benefit does not have a lower youth rate, under-25s would gain by £67.65 a week.
8.4 Options for benefit duration
Having announced the rate of the proposed unemployment insurance, perhaps the key remaining option to decide on is the benefit duration. This section discusses the implications of different benefit durations for potential incentives to return to work. It uses Department for Work and Pensions (DWP) administrative data on current contributory benefit claimants, and panel data from the Understanding Society survey, to examine how the coverage and fiscal implications of the proposed UI would vary with different benefit durations.
In choosing the duration of unemployment insurance benefits, governments face a trade-off between protecting the living standards of those who have recently lost their jobs for longer, and maintaining incentives for them to look for work. The theory and empirical literature on the effects of unemployment insurance duration is summarised in Box 8.2. In short, there is widespread consensus that increasing benefit duration increases the length of non-employment spells, with the median estimate across studies suggesting that a 1-month increase in benefit duration delays re-employment by around a week. Empirical studies do not generally find a positive relationship between benefit duration and re-employment job quality; in other words, they do not typically find that those who take longer to move into paid work as a result of benefits being available end up in higher-quality jobs.
Box 8.2. The trade-off between insurance and moral hazarda
In economic theory, the canonical model of optimal unemployment insurance is the Baily–Chetty model, which posits a key trade-off (Baily, 1978; Chetty, 2006). On the one hand, higher rates of unemployment insurance allow workers to smooth their consumption better upon job loss, which improves their welfare. On the other hand, they reduce workers’ incentives to look for work (‘moral hazard’), lengthening their unemployment spells and hence increasing government spending and reducing taxes. A similar logic applies to extending the duration of unemployment insurance (Schmieder and von Wachter, 2016). In designing unemployment benefits, governments need to find the right balance between supporting incomes and maintaining incentives.
There is widespread consensus that increasing the generosity of unemployment benefits – generally captured in empirical studies by increases in potential benefit duration (PBD) – increases non-employment duration. For example, Card, Chetty and Weber (2007) find that an increase in PBD from 20 to 30 weeks in Austria increased non-employment duration by about a week. Schmieder, von Wachter and Bender (2016) find that an increase in PBD from 12 to 18 months in Germany increased non-employment duration by nearly a month, whilst an increase from 18 to 22 months increased it by around 2 weeks. Looking across the 21 estimates from 12 studies from Europe and the US reviewed by Schmieder and von Wachter (2016), the median marginal effect was 0.21, meaning that a 1-month increase in PBD increases non-employment by just under a week. Half of the estimates fell between 0.1 and 0.33,b meaning that a 1-month PBD extension results in an increase in non-employment of 3 to 10 days.
Some argue that increasing non-employment duration is not necessarily a bad thing, as giving jobseekers more time to find a good match could lead to improvements in job quality and productivity (e.g. Brewer and Murphy, 2023). However, the effect on job quality is theoretically ambiguous: more generous benefits increase the wages jobseekers require to take a job (their ‘reservation wages’), but they could also reduce the quality of jobs offered to these jobseekers – for example, if their skills depreciate (or are perceived by employers to depreciate) over the course of a longer spell of unemployment. Nekoei and Weber (2017) find that an increase in PBD from 30 to 39 weeks increased re-employment wages by 0.5%. However, the vast majority of studies find no effect or negative effects, generally with imprecise estimates (Card, Chetty and Weber, 2007; Lalive, 2007; van Ours and Vodopivec, 2008; Centeno and Novo, 2009; Le Barbanchon, 2016; Schmieder, von Wachter and Bender, 2016; Johnston and Mas, 2018). Of these, the most precise estimate is from Schmieder et al. (2016), who find that doubling PBD reduces re-employment wages by 1.4%.
a. This summary draws heavily from Le Barbanchon, Schmieder and Weber (2024). b. This is the 25th percentile to 75th percentile of estimated marginal effects.
The Green Paper gives the example of 6 to 12 months when discussing potential duration of the UI benefit. NS JSA is currently available for 6 months, and NS ESA for those not in the Support Group is available for 12 months. Most Western European countries have unemployment insurance durations of 12 months or more, as shown in Table 8A.1 in the appendix.
Half of out-of-work spells would be fully covered by unemployment insurance lasting for one year
One way to think about the effect of different duration choices is to consider what proportion of non-employment spells in the UK would be covered under different durations. We use reported employment histories from the Understanding Society (USoc) survey, and use data from before the pandemic because the fall in survey response rates over the pandemic means that individuals often had large gaps in their recorded employment histories.13 Since the new UI benefit is intended to cover those who are actively seeking work or have work-limiting health issues, we focus here on working-age individuals who report being unemployed, or economically inactive due to long-term sickness.14
Figure 8.6 shows the duration of out-of-work spells for people who lost their jobs, using data from 2012 to 2019. Around 1 in 450 (0.22%) workers become unemployed in any given month. Of these, 60% are still out of work 6 months after losing their jobs; and 42% are still out of work after 12 months. Far fewer workers lose their jobs due to long-term sickness, with around 1 in 3,000 (0.03%) workers becoming long-term sick in any given month. However, long-term sickness is much more persistent than unemployment – 72% are still out of work 12 months after losing their jobs.
Figure 8.6. Persistence of worklessness for people who become unemployed or long-term sick, 2012–19
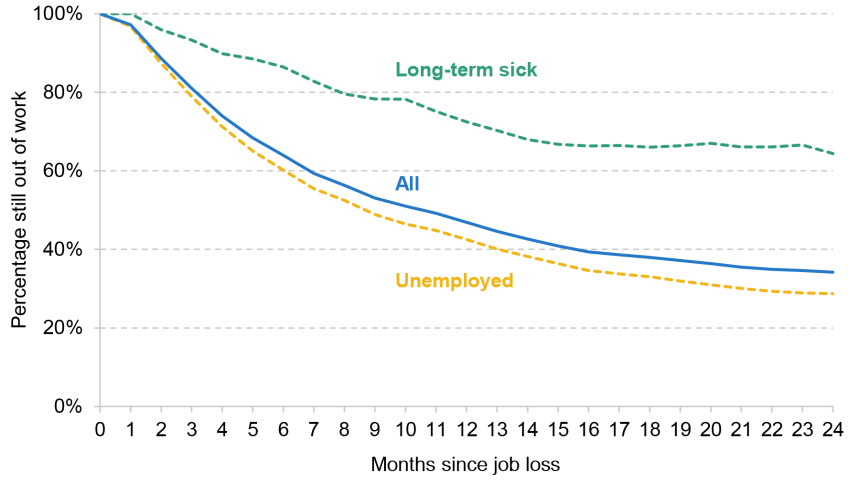
Note: Aged 16–63 at time of job loss. Monthly data are based on reported employment histories between waves. We keep one employment status per month; very short spells are either dropped or marked as lasting a month.
Source: Understanding Society, waves 1–11.
Overall, across both unemployment and long-term sickness, more than a third (36%) of out-of-work spells end before 6 months, just over a half (53%) before 12 months and 62% before 18 months. This implies that if the new UI were available for 12 months, it would cover about half of recently out-of-work individuals for the entire duration of their spells.
Four in five current new style benefit claimants have claimed for at least a year
The fact that sickness is much more persistent than unemployment, however, means that the current caseload of contributory benefits is skewed towards long-term NS ESA claimants. That is, the majority of out-of-work spells are shorter than one year, but the vast majority of existing claimants have been out of work for at least one year.
In the latest available data, more than two-thirds (70%) of NS ESA claimants have been on the benefit for five or more years; a further 20% have claimed for between one and five years. Figure 8.7 plots all contributory benefit claims by benefit and the duration of the claim so far.15 Panel A shows that because NS ESA claims make up the vast majority of the current contributory benefit caseload, more than four in five (84%) of claimants (672,500 individuals) have claimed for at least one year. That is, if contributory benefits had been restricted to 12 months, the vast majority of current claimants would not be eligible for the benefit as they would have already hit the time limit.
Figure 8.7. Number of NS JSA and NS ESA claimants and share of spending on new style benefits, by current duration of claim

Note: New style jobseeker’s allowance figures are a forecast for 2025–26. New style employment & support allowance figures are the latest available data for February 2025 and include contributions-based claims and both income- and contributions-based claims. Figures exclude Northern Ireland. In Panel B, all cases are assumed to receive the maximum amount.
Source: Department for Work and Pensions, Benefit Expenditure and Caseload Tables, Spring Statement 2025; DWP Stat-Xplore.
The fact that benefit rates are higher for most NS ESA claimants than for NS JSA claimants means that spending on contributory benefits is even more skewed towards higher durations than caseloads. Claims lasting at least one year account for 88% and those lasting at least six months account for 92% of total NS benefit spending, as shown in Panel B of Figure 8.7.
NS ESA claimants tend to be towards the end of their working lives. Figure 8A.2 in the appendix, which breaks down the NS ESA caseload by age, shows that 32% of claimants (241,000 individuals) are aged 60 or over, and a further 37% (274,750 individuals) are aged 50–59. The share of claimants over 50 is more than double the share in the total working-age population. 59% of NS ESA claimants simultaneously receive universal credit or other means-tested benefits, which means that 41% are unlikely to be compensated through the means-tested benefits system if they lose their entitlement to NS ESA, perhaps because they have a partner who has sufficient earnings so that they are not eligible for universal credit. Some form of transitionary protections may be required for current long-term claimants, discussed further in Section 8.5.
Extending unemployment insurance from 6 to 12 months doubles the number of potential claimants at any point in time
To estimate the effect of different benefit durations on the number of individuals able to claim the new benefit, we combine caseloads from DWP administrative data with employment histories from the Understanding Society survey. USoc is the only large-scale survey with monthly employment histories, which are required to model eligibility for contributory benefits. We use data from the 2019 calendar year16 – since two-year employment histories in the latest post-COVID year (2023) are affected by the pandemic – and scale these up to 2025 population estimates. For this and other reasons set out in Box 8.3, the estimates below should be taken as rough approximations, rather than precise estimates of policy effects.
Box 8.3. Modelling contributory benefits in Understanding Society
Understanding Society is the only UK survey that captures monthly employment histories for more than two years, which are required to model eligibility for contributory benefits. However, there are issues with the reporting of contributory benefits receipt in the data. A key limitation is that it does not distinguish between income-based and contributory JSA and ESA. We assume that all eligible JSA claimants with claims lasting 12 months or less are on NS JSA (as income-based JSA was no longer available to new claimants in 2019). For ESA, we assume that individuals in households receiving other legacy benefits, and no universal credit, are receiving income-based ESA; the remainder are assumed to be claiming NS ESA.a
Table 8.3 compares estimates of the number of NS JSA and NS ESA claimants based on the USoc data with official DWP statistics. USoc caseloads are 13% lower for NS JSA and 37% lower for NS ESA than caseloads in the 2019–20 DWP data. This size of gap is comparable to estimates from a recent study, which finds both underreporting of benefits and underrepresentation of benefit claimants in another UK household survey, the Family Resources Survey (Department for Work and Pensions, 2024). Further, DWP statistics show that the caseload for NS JSA has increased since 2019 – when our data are based – whilst the caseload for NS ESA has fallen, making USoc data from 2019 an even less reliable guide to current caseloads.
Table 8.3. New style benefit caseload in survey and administrative data (in thousands)

Note: NS JSA figure for 2025–26 is a DWP forecast. NS ESA figure for 2025–26 refers to the latest available data for February 2025.
Source: Authors’ calculations using: Understanding Society; Department for Work and Pensions, Benefit Expenditure and Caseload Tables, Spring Statement 2025; and DWP Stat-Xplore.
We therefore rely on the latest available DWP statistics for the number of contributory benefits recipients and reweight our USoc data accordingly. In particular, we assume a higher proportion of recipients of NS benefits among those we model as eligible based on employment histories, so as to match actual caseloads for each broad category of claim duration.
a. DWP data suggest that the vast majority of income-based ESA claimants also claim other means-tested benefits.
The number of people potentially affected by the proposed UI, under different benefit durations, is set out in Table 8.4. We start with the total number of out-of-work individuals aged 16–64, which we estimate at 8.8 million in 2025.17 (The proposed UI benefit is meant for people who are unemployed or not working for health reasons, but we do not restrict our analysis based on self-reported labour market status in USoc as this is not always informative, and in practice 15% of contributory benefit recipients in USoc report being retired or inactive for other reasons such as looking after family.) The first column shows that of these, around 730,000 have been out of work for no longer than six months, of whom 440,000 (60%) are eligible for NS JSA based on their employment history in the previous two tax years. DWP data show that 90,000 currently receive either NS JSA or NS ESA, which combined with modelled eligibility in USoc implies a take-up rate of NS benefits of roughly a fifth.
Note that we model eligibility for NS benefits based on contributions history alone, and do not account for other eligibility criteria such as the requirement to search for work for up to 35 hours a week (for NS JSA). We also do not consider deductions against private pension incomes or reasons for leaving previous jobs (in principle, individuals who leave their jobs ‘without good reason’ are ineligible and can be subject to sanctions, but in practice no sanctions have been applied since 201318). For these reasons, the number of eligible individuals is likely to be lower than our modelling suggests, and the take-up rate higher.
Table 8.4. Individuals eligible for new style benefits and the proposed unemployment insurance, 2025 (in thousands)
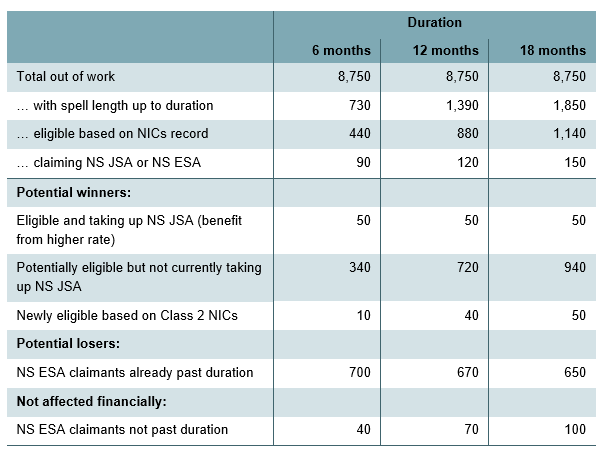
Note: Numbers are rounded to the nearest 10,000 and may not sum due to rounding. NS JSA caseload is based on DWP forecasts for 2025–26. NS ESA claimants within the benefit duration are not financially affected, but those in the Support Group would be required to do some work search.
Source: Authors’ calculations using: Understanding Society; Department for Work and Pensions, Benefit Expenditure and Caseload Tables, Spring Statement 2025; and DWP Stat-Xplore.
The lower part of Table 8.4 shows the number of potential winners and losers from moving from the current system to the proposed UI benefit. We assume that people on universal credit would receive a contributory top-up to their UC entitlement, rather than having their UC reduced pound for pound by the amount of the new UI, as discussed in Section 8.5. If claims of the new benefit were capped at six months, the 50,000 current NS JSA claimants would gain from the higher benefit amount. Up to 340,000 out-of-work individuals who are eligible for, but not currently taking up, contributory benefits could also gain if the higher benefit amount (and perhaps greater emphasis on the benefit from DWP or higher public awareness as a result of the reform) induces them to take up the benefit. The size of their income gains would vary and these individuals might not wish to claim if they did not want to meet the requirement to be actively seeking paid work. Those currently on UC – around 20% in our data – could gain by up to £48.50 a week (£67.65 if under 2519) by also claiming the new UI benefit; those not on UC could gain the full £140.55 a week. A further 10,000 individuals would gain eligibility through their work histories in self-employment. Up to 700,000 current NS ESA claimants, who have been out of work for at least six months, could lose financially from the policy, though those on means-tested benefits – 59% in DWP data – could see their means-tested benefits rise in response.20
The last two columns of the table show how the numbers affected would change if the new UI benefit were available for 12 or 18 months, rather than 6 months. The total number of out-of-work individuals eligible for the benefit would be 880,000 under the 12-month duration and 1.1 million under the 18-month duration, compared with 440,000 under the 6-month duration. Figure 8A.3 in the appendix, which plots the number of eligible individuals by household income quintile, shows that under a 6-month duration, 38% of eligible individuals would be in the bottom fifth of household incomes and 15% in the top fifth. Around one-third of those who gain eligibility under a longer benefit duration are in the bottom quintile – reflecting both the higher incidence and longer spells of worklessness in low-income households. The number of NS ESA claimants who stand to lose from the policy, however, changes little across the three durations, since the vast majority of current claimants have already been out of work for at least 18 months. Extending the benefit to 18 months, rather than 6 months, would reduce the number of potential losers from 700,000 to 650,000 (by 8%).
The estimates here are rough approximations due to challenges with the data. The big picture is that there could be a large number of ‘unemployed’ gainers – those who would be eligible for NS JSA, but not NS ESA, under the current system – and will depend on how many people eligible for the benefit choose to take it up (discussed below). A large number of people currently eligible for NS ESA would lose out from the reform. This is not sensitive to the assumptions being made, and is driven by the fact that NS ESA claimants tend to stay on the benefit for much longer than any likely maximum duration of the new UI.
Unemployment insurance lasting 12 months is likely to result in fiscal savings in the long run
Of course, not all eligible individuals will take up the new UI, and the number of individuals actually gaining from it will depend on take-up. Similarly, the number losing will depend on whether those who would have been entitled to long-term NS ESA, but are beyond the duration of the new UI, can move onto universal credit. To calculate the likely fiscal effects of the proposed UI, we make the following assumptions:
For individuals eligible for the new UI and currently taking up NS or means-tested benefits, we assume a take-up rate of 100%.
For eligible individuals who do not currently claim NS or means-tested benefits, we apply a take-up rate of 21%, consistent with the implied take-up rate of NS JSA.
59% of current NS ESA claimants beyond the new duration cap are fully compensated by means-tested benefits, based on the share of current NS ESA claimants who also receive UC legacy means-tested legacy benefits.21
Table 8.5. Approximate fiscal effects of the proposed unemployment insurance with no transitional protections, 2025 (in £ million)

Note: Assumes full take-up among those receiving means-tested benefits, 21% take-up rate otherwise, and no transitional protections. Numbers are rounded to the nearest £50 million and may not sum due to rounding.
Source: Authors’ calculations using: Understanding Society; Department for Work and Pensions, Benefit Expenditure and Caseload Tables, Spring Statement 2025; and DWP Stat-Xplore.
Table 8.5 shows the resulting estimated fiscal impact for different benefit durations. If the new UI is limited to 6 months, and there were no transitional protections for existing claimants, the reform would result in a net saving of £1.4 billion a year as the saving from removing eligibility from long-term NS ESA claimants outstrips the cost of higher benefit amounts and extending eligibility to the previously self-employed. As context, the projected spend on NS benefits in 2025–26 is just £5.2 billion. As set out in Figure 8.7 earlier, this reflects the fact that over 90% of current NS benefit spending goes on claimants who have claimed for at least 6 months.
Extending the new UI to 12 months roughly doubles the cost of supporting eligible individuals, but this would still be outweighed by the saving from removing eligibility from long-term NS ESA claimants, which is only reduced slightly. Claimants with durations of at least 12 months account for 88% of current NS benefit spending. A benefit duration of 12 months would reduce spending by £0.6 billion, whereas a duration of 18 months would make the reform overall roughly fiscally neutral.
To the extent that current NS ESA claimants are given transitional protections, these figures could be interpreted as the long-run fiscal effects after transitional protections are exhausted. For example, if the government introduced a UI benefit lasting 12 months and effectively ‘reset the clock’ on current NS ESA claimants, allowing them to claim for up to another 12 months (as discussed in Section 8.5), then the savings from the reform would only materialise one year after its introduction. In the first year of the reform, the policy would result in a net cost of roughly £1.5 billion. If the reforms only applied to new claimants, with all existing claimants unaffected, the savings would take much longer to materialise, and the policy is unlikely to generate substantial fiscal savings over the remainder of the parliament.
These estimates do not account for potential behavioural responses to extending benefit duration, although the expectation that the proposed reform would represent a fiscal saving overall is fairly robust to plausible changes in both take-up of benefits and the duration of out-of-work spells.
The precise estimates of fiscal effects are very sensitive to assumptions on the take-up rate for those not currently claiming NS or means-tested benefits, which we set at 21%22. Each increase of 5 percentage points in this rate would increase spending by approximately £0.1 billion, £0.2 billion and £0.3 billion under durations of 6, 12 and 18 months respectively. If 87% of eligible individuals (who are not currently claiming NS or means-tested benefits) took up the new UI benefit implying an overall take-up rate of 92%, including those on NS and means-tested benefits a UI lasting 6 months would result in a fiscal cost rather than a saving. For a 12-month duration to result in a fiscal cost, overall take-up would have to reach 56%.
Extending benefit rates or duration may also affect how long individuals are out of work for, and hence the number eligible for the new benefit. As set out in Box 8.2, the median estimated effect across a number of European and US studies suggests that a 1-month increase in the duration of unemployment benefits extends out-of-work spells by around a week. Based on this figure, a new UI benefit of 12 months’ duration, compared with the current NS JSA duration of 6 months, could increase out-of-work spells of eligible individuals by perhaps a little over a month on average. A back-of-the-envelope calculation suggests that if all non-employment spells were extended by 1 month, the total number of out-of-work individuals would be around 100,000 (1%) higher in the 2019 data, or 110,000 higher scaled to 2025 population figures.23 Even if all these additional people were eligible for and took up the new UI – a conservative estimate as roughly 60% of out-of-work individuals are eligible today, and we estimate that around a fifth take up the benefit – this would increase the cost of a 12-month UI by less than £0.2 billion..24 Further, for those eligible for NS ESA under the current system, the reform represents a shortening of benefit duration. If some of this group move back into work sooner as a result of the reform, this could offset some of the effects of lengthening benefit duration for claimants without work-limiting health conditions.
There is a case for varying benefit duration with macroeconomic conditions
The fundamental trade-off between providing insurance and avoiding moral hazard implies that there is a case for varying UI duration (and/or rates) depending on macroeconomic conditions. In recessions, vacancies are scarce and job-search efforts are less likely to result in a job, so reduced incentives to search are less detrimental (reducing the moral hazard cost of UI). On the other hand, people are likely to remain unemployed for longer, which increases the insurance value of longer UI durations. Both these channels have been documented in the recent empirical literature (Schmieder, von Wachter and Bender, 2012; Kroft and Notowidigdo, 2016). Further, extending UI duration during recessions could help to keep up household spending as unemployment rates rise, stabilising the macroeconomy (Brewer and Murphy, 2023).25
In the US, federal and state programmes typically increase UI duration when local unemployment rates exceed predefined levels (Le Barbanchon, Schmieder and Weber, 2024). France has also recently adopted a countercyclical UI: as of 2022, the benefit duration is 18 months in normal times and 24 months when the unemployment rate exceeds 9%. The temporary £20 a week uplift in universal credit during the pandemic can be seen as following this same logic.
As shown in Table 8A.1 in the appendix, some Western European countries such as France, Luxembourg, the Netherlands and Spain also have different UI durations depending on the claimant’s employment record or age. The economic argument here is less clear-cut – older unemployed people (with longer employment histories) tend to find it harder to find work, but also tend to have higher savings, which reduces the insurance value of UI. On the other hand, one could argue that in the absence of earnings-related UI benefits, linking UI duration to contributions history could be one way to strengthen the link between contributions and rewards.
Many countries also have lower benefit levels at longer durations. In Italy, for example, benefit amounts are reduced by 3% per month after the sixth month of unemployment. In the Netherlands, benefits are set at 75% of in-work earnings for the first two months of unemployment, declining to 70% thereafter. A declining path can be justified by the theoretical insights in Shavell and Weiss (1979), who show that holding overall spending on UI constant, declining benefit levels provide strong incentives for people without savings to search for jobs. On the other hand, if workers have savings at job loss, smoothing consumption points to delaying benefit payments to later periods of the unemployment spell when workers have depleted their savings. This could result in an optimal path for benefits that is increasing over time. Recent empirical evidence has been mixed: Lindner and Reizer (2020) find that a reform in Hungary that front-loaded benefits without changing the overall amount paid increased job-finding early on in the spell, whilst Kolsrud et al. (2018) find the opposite in Sweden – that increasing benefits early in the spell reduced job-finding more than increasing benefits later in the spell.
8.5 Other policy design options
In addition to deciding on the duration of the UI benefit, there are a number of more detailed policy design choices that need to be made. A comprehensive discussion of potential options can be found in a report by the Social Security Advisory Committee (2022). Rather than repeating that analysis here, in this section we briefly discuss some of the more important policy design choices, such as how the new benefit interacts with universal credit. Our recommendations on these options are summarised in Table 8.6.
Table 8.6. Recommendations on policy design options
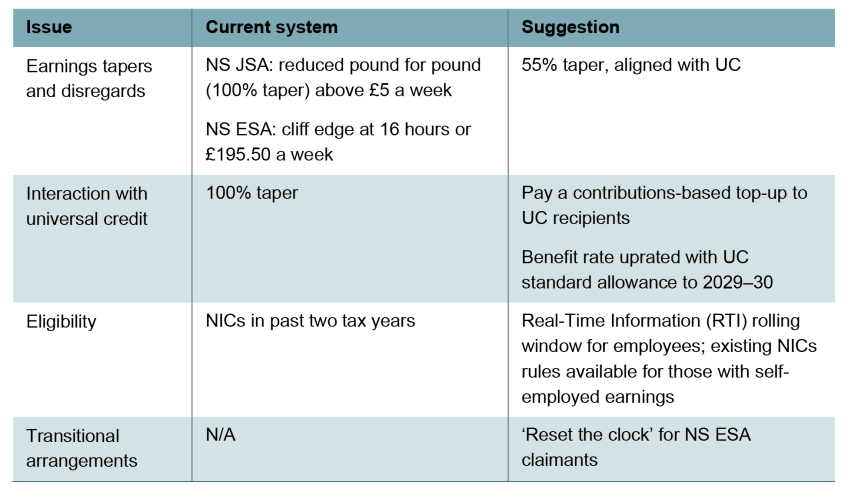
Earnings tapers and disregards
NS JSA and NS ESA currently have different rules for working while in receipt of the benefit. NS JSA is essentially incompatible with work: earnings above £5 a week reduce entitlements pound for pound, so claimants have no financial incentive to work. NS ESA claimants can work up to 16 hours a week, and earn up to £195.50 a week after tax, without any deductions to their benefits; work above this threshold disqualifies people from the benefit.
We recommend that the new UI benefit retains an incentive for claimants to work, as in NS ESA, but avoids the cliff edge of the current system. Applying a taper rate of 55% as in UC – meaning that every pound earned from work reduces benefits by 55p – is one potential solution. Indeed, the UC White Paper in 2010 recommended aligning earnings rules of contributory benefits with UC (Department for Work and Pensions, 2010), but this was never implemented. Given that NS JSA recipients have no incentive to work and NS ESA recipients do not have their benefit withdrawn while working, this change would not increase fiscal costs and could result in modest savings. Other taper rates are also possible, though would complicate the treatment of dual UI and UC claims (discussed below).
Interaction with universal credit
Income from NS JSA and NS ESA is currently treated as unearned income for the purpose of calculating UC entitlements, which means that it reduces UC amounts pound for pound. Earned income in UC is subject to a 55% taper rate, in order to preserve incentives to work. Under the current system, replacing one benefit with another of the same amount does not affect work incentives, so a 100% taper rate is in principle justified.
However, with a new UI set at a higher rate than the UC standard allowance, a 100% taper rate would imply that UC claimants who have made sufficient National Insurance contributions would be no better off than those who have not. This would mean that workers in low-income households would not benefit from the ‘something-for-something’ principle.
One option would be to treat UI as earnings and apply a 55% taper. However, this could substantially weaken work incentives. It could use up (a part of) the household’s work allowance – the amount of money a household can earn before their UC is withdrawn – and thus increase their effective tax rate upon returning to work. Dual UI–UC claimants who are already on the UC taper (for example, because they do not have a work allowance or because their partner’s earnings take them above the work allowance) would face an effective taper rate of 80%, with benefits withdrawn by 80p for every additional pound earned.26
We therefore recommend that the proposed benefit is integrated with UC and paid in the form of a contributions-based top-up to the individual’s UC standard allowance, equivalent to £48.50 per week at current rates. This would also help avoid marginal tax rates in excess of 100% in cases where UI and UC are tapered with earnings separately.
It is worth noting that with the recent benefit reforms, the standard allowance of UC is set to grow faster than inflation until 2029–30. If the new UI benefit is uprated with inflation, as NS rates have been in recent years, this would imply a fall in the contributions-based premium over time for those not on UC. There is an argument for uprating the proposed benefit in line with the UC standard allowance, including any temporary uplifts such as those introduced during the pandemic.
The taxation of benefits also affects how the new UI benefit interacts with UC. At present, NS JSA and NS ESA are subject to income tax, while UC is not. Yet UC entitlements are withdrawn pound for pound by the gross amount of contributory benefits, rather than the post-tax amount. As a result, UC recipients who are eligible for NS benefits can actually end up worse off by claiming them. The same problem could arise if the new UI is taxed: a worker would be worse off on UI alone than on both benefits, which would undermine the contributory principle. There may be a case for simplifying the system by not subjecting the new UI benefit to income tax, as with UC, though this could increase the cost of the reform.
Eligibility
The Green Paper states that the government wants to maintain the current eligibility rules based on NICs in two full recent tax years. However, these rules create various timing anomalies, leading to unequal treatment of otherwise similar individuals. Eligibility can change sharply between December and January when the two tax years being assessed change. Depending on when claims are made, some people are eligible after only 8 months of work, whilst others may be deemed ineligible even after 33 months of continuous work.27 The arbitrary distinctions based on tax years can be especially harmful for people with multiple years of contributions but brief work interruptions, or those with irregular incomes or work patterns.
An obvious improvement would be to use Real-Time Information (RTI) from tax records for employees and assess eligibility based on a rolling window, potentially with the option of also taking into account more earlier years. Using RTI would also make it easier to implement the earnings taper we recommend above. However, this would not be possible for the self-employed. The existing NICs rule could be maintained for the self-employed, who could be asked to file their tax returns early as part of the benefit claim in order to provide the most up-to-date information. Workers with earnings from both employment and self-employment could qualify based on either RTI or NICs rules, with their employment and self-employment earnings potentially added together in the latter case.
Transitional arrangements
There were 625,400 NS ESA claimants with claims lasting at least two years in the latest data. If the new UI benefit is available for less than two years, as might be expected, this would mean large numbers of current claimants not being eligible for the benefit under the new system. One option would be for their claims to be ended immediately. At the other extreme, the government could choose to protect current claimants indefinitely, as it has done for the recent halving of the health element of UC. However, doing so would create arbitrary inequalities in how people are treated based on the date of their claim, and significantly increase the cost of the policy, given that NS ESA claimants tend to stay on the benefit for a long time.28
A suggested way between these two options would be for the government to move all NS ESA claimants onto the new system, and to allow them to claim for up to the new maximum benefit duration from the point of the switch, effectively resetting the clock and giving them time to adjust to any falls in income. This would essentially give them the same notice period as new claimants of UI. Low-income households should be wholly or partially protected, since the rate available to new single UC claimants with work-limiting conditions is roughly equivalent to the current NS ESA Support Group rate, and such individuals would still be able to claim UC indefinitely. Providing such temporary transitional protection would mean that savings from the reform would materialise only after one or two years, with short-term fiscal costs from higher rates and expanded eligibility.
8.6 Conclusion
The UK social security system was founded on the ‘something-for-something’ principle, offering more generous support than basic means-tested assistance to those who have contributed to the system. Over time, this principle has been eroded, and contributory benefits have been reduced to a negligible and often ignored part of the welfare state. One opportunity for a major reform of the contributory system was missed at the introduction of universal credit. Now, the government is trying to reinstate the contributory principle with a new unemployment insurance benefit.
The proposed UI would provide much better income protection for jobseekers, with a boost of up to £48.50 per week. But it would remain far less generous than most European systems, representing 22% of median earnings as compared with the 60–80% replacement rates common in European countries. Further, the fiscal savings from time-limiting UI for all claimants are likely to offset the costs of higher benefit amounts and widening eligibility to former self-employed workers. The government could therefore choose to be bolder on duration – for example, offering the benefit for 12 months, which would cover around half of recently out-of-work individuals for the entirety of their non-employment spells and is still likely to deliver savings relative to the current system. This is because the vast majority of current spending on new style benefits (88%) goes on those who have been in receipt of one for at least a year.
Any probable time limit on the new UI benefit would mean that the vast majority of current claimants of new style employment & support allowance would no longer be eligible under the new system. More than 40% of ESA claimants do not claim means-tested benefits, which means that they are unlikely to be compensated. Transitional protections are likely to be required – for example, ‘resetting the clock’ on their claim duration and allowing them to claim UI for the new maximum duration, to give them time to adjust their spending.
The government also needs to make a number of detailed policy design choices with respect to the new benefit. Simply carrying over the existing design would be another missed opportunity for meaningful reform. The introduction of UI should be accompanied by wider improvements: aligning earnings tapers with UC to preserve work incentives; integrating the benefit with UC to maintain a contributory premium for low-income households and ensure they are not made worse off by claiming UI; and reforming eligibility using Real-Time Information and a rolling window to avoid arbitrary exclusions. Taken together, these changes would help to modernise the contributory system.
Appendix 8A. Additional figures and table
Figure 8A.1. Share of spending on types of working-age benefits
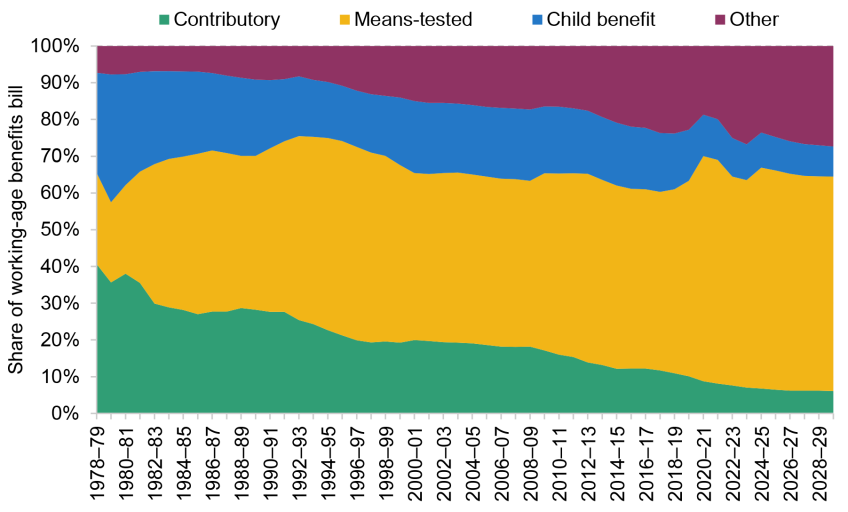
Note: ‘Other’ includes non-contributory and non-income-related benefits excluding child benefit, including disability benefits. Child benefit has been withdrawn for high-earning families from 2013, and so could be thought of as a means-tested benefit from that point. Figures from 2025–26 onwards are forecasts, and are consistent with Office for Budget Responsibility, Economic and Fiscal Outlook, March 2025.
Source: Department for Work and Pensions, Benefit Expenditure and Caseload Tables, Spring Statement 2025.
Table 8A.1. Summary of other Western European UI systems as of 2024

Note: Most countries pay a proportion of previous earnings up to a cap, which is set out in the last column. Ireland has introduced a new earnings-related UI scheme as of 2025. The table shows the previous flat-rate regime. Greece is currently piloting a new earnings-related UI scheme, also not shown in the table.
Source: OECD Policy Tables and OECD Descriptions of Tax and Benefit Systems, 2024.
Figure 8A.2. Caseload for new style employment & support allowance, by age, February 2025
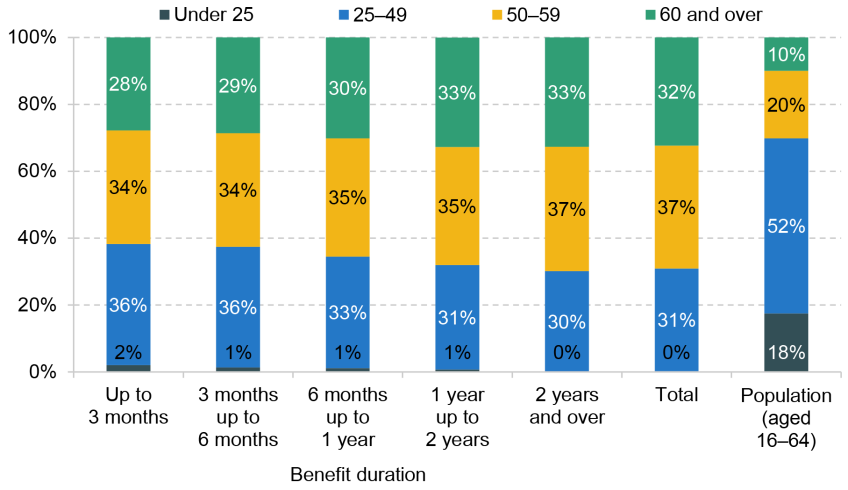
Note: New style employment & support allowance includes contributions-based claims and both income- and contributions-based claims. Figures exclude Northern Ireland.
Source: DWP Stat-Xplore. Office for National Statistics, 2022-based national population projections.
Figure 8A.3. Number of people eligible for the proposed unemployment insurance at any one time, under different benefit durations, by household income quintile
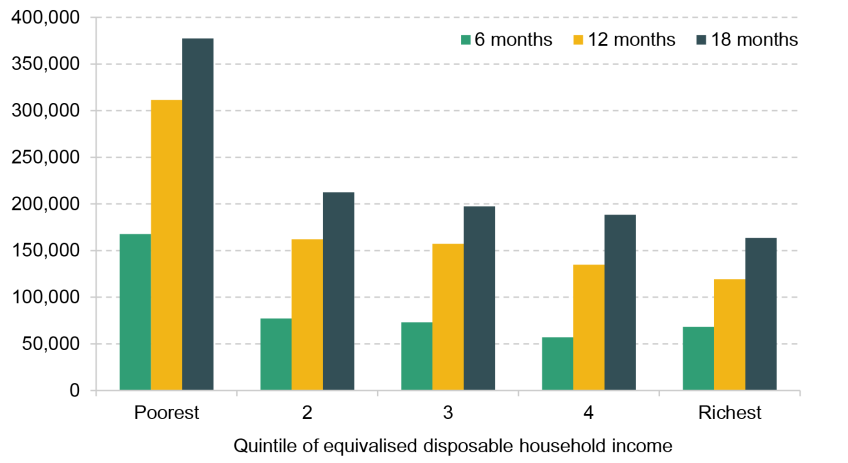
Source: Understanding Society, waves 10–11, scaled to 2025 population estimates using Office for National Statistics, 2022-based national population projections.
References
Baily, M. N., 1978. Some aspects of optimal unemployment insurance. Journal of Public Economics, 10(3), 379–402, https://doi.org/10.1016/0047-2727(78)90053-1.
Brewer, M. and Murphy, L., 2023. From safety net to springboard: designing an unemployment insurance scheme to protect living standards and boost economic dynamism. Resolution Foundation, The Economy 2030 Inquiry, https://economy2030.resolutionfoundation.org/reports/from-safety-net-to-springboard/.
Brien, S., Emmerson, C., Tetlow, G. and Timmins, N., 2022. Jobs and benefits: the COVID-19 challenge. Social Security Advisory Committee and Institute for Government, https://www.gov.uk/government/publications/jobs-and-benefits-the-covid-19-challenge/jobs-and-benefits-the-covid-19-challenge.
Card, D., Chetty, R. and Weber, A., 2007. The spike at benefit exhaustion: leaving the unemployment system or starting a new job? American Economic Review, 97(2), 113–18, https://www.jstor.org/stable/30034431.
Centeno, M. and Novo, Á. A., 2009. Reemployment wages and UI liquidity effect: a regression discontinuity approach. Portuguese Economic Journal, 8(1), 45–52, https://doi.org/10.1007/s10258-009-0038-8.
Chetty, R., 2006. A general formula for the optimal level of social insurance. Journal of Public Economics, 90(10–11), 1879–901, https://doi.org/10.1016/j.jpubeco.2006.01.004.
Department for Work and Pensions, 2010. Universal credit: welfare that works. White Paper, https://www.gov.uk/government/publications/universal-credit-welfare-that-works.
Department for Work and Pensions, 2024. Family Resources Survey transformation: integrating administrative data into the FRS. https://www.gov.uk/government/publications/family-resources-survey-transformation-integrating-administrative-data-into-the-frs.
Department for Work and Pensions, 2025. Pathways to work: reforming benefits and support to get Britain working. Green Paper, https://www.gov.uk/government/consultations/pathways-to-work-reforming-benefits-and-support-to-get-britain-working-green-paper.
Giupponi, G. and Xu, X., 2020. What does the rise of self-employment tell us about the UK labour market? IFS report, https://ifs.org.uk/publications/what-does-rise-self-employment-tell-us-about-uk-labour-market.
Hughes, S. and Miscampbell, G., 2015. Welfare manifesto. Policy Exchange, https://policyexchange.org.uk/wp-content/uploads/2016/09/welfare-manifesto.pdf.
Johnston, A. C. and Mas, A., 2018. Potential unemployment insurance duration and labor supply: the individual and market-level response to a benefit cut. Journal of Political Economy, 126(6), 2480–522, https://doi.org/10.1086/699973.
Kolsrud, J., Landais, C., Nilsson, P. and Spinnewijn, J., 2018. The optimal timing of unemployment benefits: theory and evidence from Sweden. American Economic Review, 108(4–5), 985–1033, https://www.jstor.org/stable/26527996.
Kroft, K. and Notowidigdo, M., 2016. Should unemployment insurance vary with the unemployment rate? Theory and evidence. The Review of Economic Studies, 83(3), 1092–124, https://www.jstor.org/stable/43869561.
Lalive, R., 2007. Unemployment benefits, unemployment duration, and post-unemployment jobs: a regression discontinuity approach. American Economic Review, 97(2), 108–12, https://www.jstor.org/stable/30034430.
Latimer, E. and Oulton, M., 2025. When and how should the government protect existing claimants from benefit cuts? IFS comment, https://ifs.org.uk/articles/when-and-how-should-government-protect-existing-claimants-benefit-cuts.
Le Barbanchon, T., 2016. The effect of the potential duration of unemployment benefits on unemployment exits to work and match quality in France. Labour Economics, 42, 16–29, https://doi.org/10.1016/j.labeco.2016.06.003.
Le Barbanchon, T., Schmieder, J. and Weber, A., 2024. Job search, unemployment insurance, and active labor market policies. In C. Dustmann and T. Lemieux (eds), Handbook of Labor Economics, volume 5, North Holland.
Lindner, A. and Reizer, B., 2020. Front-loading the unemployment benefit: an experimental assessment. American Economic Journal: Applied Economics, 12(3), 140–74, https://doi.org/10.1257/app.20180138.
Nekoei, A. and Weber, A., 2017. Does extending unemployment benefits improve job quality? American Economic Review, 107(2), 527–61, https://www.jstor.org/stable/24911341.
Office for Budget Responsibility, 2025. Economic and fiscal outlook – March 2025. https://obr.uk/efo/economic-and-fiscal-outlook-march-2025/.
O’Leary, D., 2013. Something for something: restoring a contributory principle to the welfare state. Demos, https://demos.co.uk/wp-content/uploads/files/Something_For_Something_-_DuncanOLeary.pdf.
Schmieder, J. F. and von Wachter, T., 2016. The effects of unemployment insurance benefits: new evidence and interpretation. Annual Review of Economics, 8(1), 547–81, https://doi.org/10.1146/annurev-economics-080614-115758.
Schmieder, J. F., von Wachter, T. and Bender, S., 2012. The effects of extended unemployment insurance over the business cycle: evidence from regression discontinuity estimates over 20 years. Quarterly Journal of Economics, 127(2), 701–52, https://doi.org/10.1093/qje/qjs010.
Schmieder, J. F., von Wachter, T. and Bender, S., 2016. The effect of unemployment benefits and nonemployment durations on wages. American Economic Review, 106(3), 739–77, https://doi.org/10.1257/aer.20141566.
Shavell, S. and Weiss, L., 1979. The optimal payment of unemployment insurance benefits over time. Journal of Political Economy, 87(6), 1347–62, https://www.jstor.org/stable/1833336.
Social Security Advisory Committee, 2022. The future of working age contributory benefits for those not in paid work. SSAC Occasional Paper 26, https://www.gov.uk/government/publications/ssac-occasional-paper-26-the-future-of-working-age-contributory-benefits-for-those-not-in-paid-work.
Sturrock, D., 2020. Despite short-term relief, households could face debt problems as a result of the coronavirus (COVID-19) pandemic. IFS comment, https://ifs.org.uk/articles/despite-short-term-relief-households-could-face-debt-problems-result-coronavirus-covid-19.
Timmins, N., 2024. Why has the UK’s social security system become so means-tested? Oxford Open Economics, 3(Supplement_1), i1274–82, https://doi.org/10.1093/ooec/odad067.
van Ours, J. C. and Vodopivec, M., 2008. Does reducing unemployment insurance generosity reduce job match quality? Journal of Public Economics, 92(3–4), 684–95, https://doi.org/10.1016/j.jpubeco.2007.05.006.
Wild, M., 2025. The case for contribution. Labour Together, https://www.labourtogether.uk/all-reports/case-for-contribution.
Data
University of Essex, Institute for Social and Economic Research. (2025). Understanding Society: Waves 1-14, 2009-2023 and Harmonised BHPS: Waves 1-18, 1991-2009. [data collection]. 19th Edition. UK Data Service. SN: 6614, DOI: http://doi.org/10.5255/UKDA-SN-6614-20
Endnotes
Authors

Martin Mikloš
Martin is a research economist at TaxDev and works on taxation in developing countries.

Xiaowei Xu
Xiaowei joined the IFS in 2018 and works in the Income, Work and Welfare sector.
More from IFS
Understand this issue


Policy analysis


Academic research


