
Downloads
Download the report as a PDF here
PDF | 663.15 KB
Key findings
1. Average (median) disposable household income before deducting housing costs rose by 0.5% in 2021–22, but remained 1.2% lower than its pre-pandemic level. The relatively muted increase in 2021–22 reflected a 4.8% rebound in nominal incomes being largely offset by a sharp rise in inflation. A fall in housing costs over the pandemic means that average incomes measured after deducting housing costs were 0.2% higher in 2021–22 than in 2019–20.
2. Income growth was stronger among poorer households, with those in the bottom third of the distribution seeing a rise between 2019–20 and 2021–22 of 1.5% before deducting housing costs and 2.7% after deducting housing costs. Large falls in employment income among this group were more than offset by a rise in benefit incomes (in particular the temporary £20 uplift to universal credit) and a fall in housing costs, both of which affected low-income households more than households further up the income distribution.
3. The increase in benefit incomes among low-income households did not simply reflect a fall in employment income. Average benefit receipt in 2021–22 was higher than in 2019–20 at every level of earnings, due to the £20 universal credit uplift that persisted until October 2021 and the increased generosity of universal credit for in-work households from November 2021. The share of households in the bottom third of incomes that received disability benefits rose by 26%, from 12% in 2019–20 to 15% in 2021–22, driven entirely by an increase among working-age households.
4. Individuals aged 50–70 who moved from employment into economic inactivity in 2020–21 were more likely to end up in poverty (in the year of exit) than those who became inactive in previous years. This is despite poverty rates falling among 50- to 70-year-olds who had been inactive for more than a year (that is, it does not reflect an overall fall in living standards among inactive individuals in the age group). Measures of self-reported well-being also declined more for recently inactive individuals in 2020 than for those who had been inactive for longer. For people who became inactive in 2021–22, outcomes were much more similar to those seen among people who became inactive pre-pandemic, suggesting that there is particular cause for concern for the 2020–21 cohort.
5. This decline in living standards and well-being challenges the perception that exits into inactivity over the pandemic were driven by wealthy individuals who could afford to retire in comfort. Instead, many of those who left the workforce in 2020–21 may have been ‘forced’ into early retirement, with an associated hit to their living standards and well-being. People who become inactive at older ages often never re-enter the workforce, so it is likely that many in this cohort will experience persistently low living standards. In contrast, those who became inactive in 2021–22, when the labour market disruption and health risk had largely subsided, are more likely to have done so out of choice.
This chapter examines recent trends in and drivers of households’ living standards, with a particular focus on the impact of the COVID-19 pandemic in 2020–21 and 2021–22. We begin by reviewing trends in household incomes across the income distribution, documenting the effects of the onset of the pandemic and subsequent recovery and discussing their implications for income inequality. We then examine the sources of changes to household incomes in more detail, focusing on changes in income from employment and benefits across the income distribution, and setting post-pandemic trends in their recent historical context. Finally, we examine how the recent rise in economic inactivity among older individuals has affected their living standards and well-being.
We primarily rely on the Households Below Average Income (HBAI) statistics. To examine the living standards of recently inactive individuals, we also corroborate results using the HBAI data with data from Understanding Society: The UK Household Longitudinal Study (UKHLS), a panel survey that samples households at annual intervals. We also draw on the Annual Population Survey (APS) to track self-reported well-being measures among those who recently entered economic inactivity.
2.1 Trends in household incomes
Figure 2.1 shows recent trends in average (median) household income, adjusted for inflation and household size and expressed as the equivalent income for a childless couple in 2021–22. When measured before deducting housing costs (BHC), median household income grew by 0.87% a year on average in the years before the pandemic, from 2002–03 to 2019–20. Median household income fell by 1.7% in the first year of the pandemic, a relatively small change given the disruption to the economy, which reflects the huge government interventions to mitigate falls in income, including the Coronavirus Job Retention Scheme (or furlough scheme, which cost around £60 billion in 2020–21) and the £20 a week uplift to universal credit. Between 2020–21 and 2021–22, median income rebounded slightly, but at £29,495 remained £350 (1.2%) below its pre-pandemic level. A fall in housing costs since the start of the pandemic means that the initial fall in median income after deducting housing costs (AHC) was slightly smaller, at 1.4%, and by 2021–22 median AHC income was 0.2% higher than its pre-pandemic level.
Figure 2.1. Median disposable household income
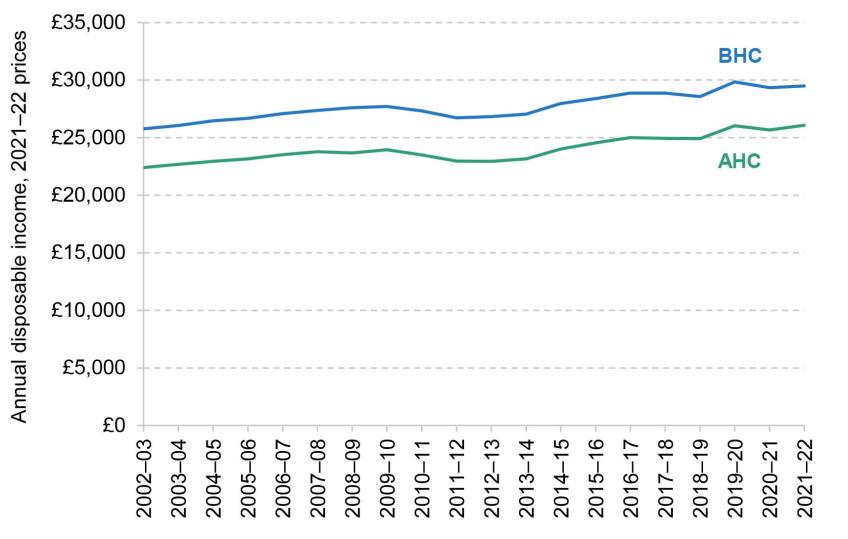
Note: Incomes have been measured net of taxes and benefits, and are expressed in 2021–22 prices. All incomes have been equivalised using the modified OECD equivalence scale and are expressed in terms of equivalent amounts for a childless couple.
Source: Authors’ calculations using the Family Resources Survey, 2002–03 to 2021–22.
The recovery in household incomes in 2021–22 was substantially moderated by a sharp rise in inflation over the year, from 0.4% in 2020–21 to 4.2% in 2021–22. Figure 2.2 shows that in cash terms (not adjusted for inflation), median household income grew by 4.8% in 2021–22, a high growth rate by historical standards. However, this recovery was eroded by rising price levels, which increased by 4.0% that year. As a result, real household incomes (adjusted for inflation) increased by only 0.5%. It is worth noting that this is before the very high rates of inflation seen recently: between April 2022 and April 2023, inflation has averaged about 9%.
Figure 2.2. Median household income growth compared with BHC inflation
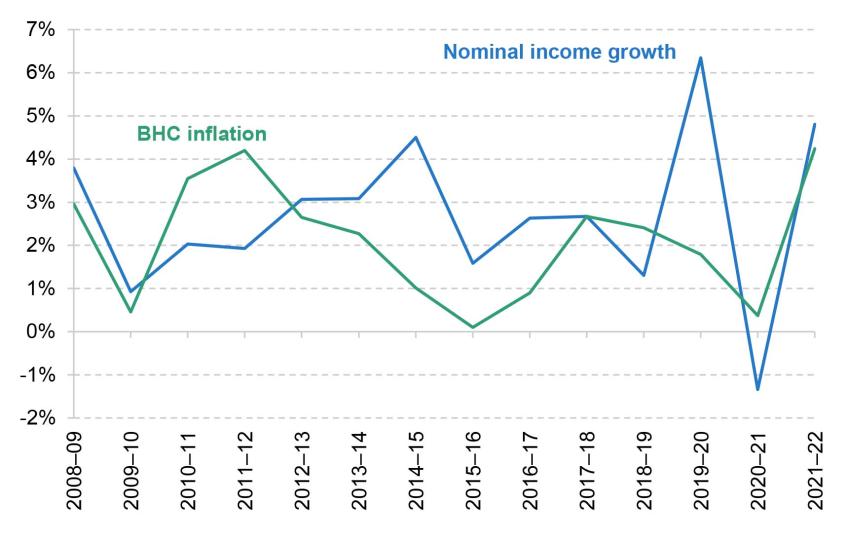
Note: Incomes have been measured net of taxes and benefits and before housing costs have been deducted. All incomes have been equivalised using the modified OECD equivalence scale.
Source: Authors’ calculations using the Family Resources Survey, 2008–09 to 2021–22.
The stagnation in real median household incomes since 2019–20 masks significant differences across the income distribution. These are shown in Figure 2.3, which plots the average annual growth in BHC household incomes at each percentile of the distribution. A line sloping downwards indicates that poorer households have seen higher income growth than richer households, whereas a line sloping upwards indicates that richer households enjoyed higher income growth.
Figure 2.3. Average disposable household income growth (BHC), by income percentile
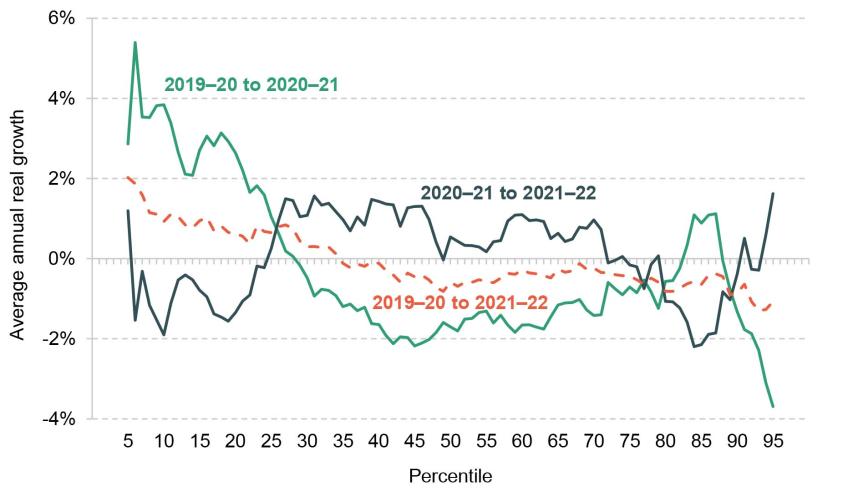
Note: Incomes have been measured net of taxes and benefits and before housing costs have been deducted, and are expressed in 2021–22 prices. All incomes have been equivalised using the modified OECD equivalence scale.
Source: Authors’ calculations using the Family Resources Survey, 2019–20 to 2021–22.
Focusing on the first year of the pandemic (the green line), we see that whilst incomes fell across most of the distribution between 2019–20 and 2020–21, households in the bottom quarter of the income distribution actually saw their incomes increase. As we discuss in more detail in Section 2.2, this is because low-income households were more affected by benefit increases during this period, in particular the £20 per week uplift to universal credit. In addition, low-income households receive less of their income from employment, so the labour market disruption over the pandemic had a smaller effect on them.
This pattern was partly reversed in the second year of the pandemic, between 2020–21 and 2021–22 (the black line). Households at the bottom of the income distribution saw modest declines in their income, as the £20 uplift was withdrawn, while households around the middle saw a modest increase in their income as the labour market rebounded.
The dashed red line brings the other two together and shows annualised income growth between 2019–20 and 2021–22. Growth in household incomes over this period was generally progressive, with households at the lower end of the income distribution seeing modest increases in income and those at the higher end slight falls. The pattern of growth is similar to that seen in the four years after the Great Recession, between 2007–08 and 2011–12, as documented in Cribb et al. (2022).
Implications for income inequality
We now turn to the headline measures of income inequality that come out of the changes examined above. Figure 2.4 plots the 90:50 ratio, which gives the ratio between the 90th and 50th percentiles of the income distribution, and the 50:10 ratio, which is defined correspondingly. There has been little change in the 90:50 ratio since the start of the pandemic. In contrast, the 50:10 ratio fell rapidly from 2.07 in 2019–20 to 1.96 in 2020–21, as household incomes increased at the bottom of the income distribution whilst falling in the middle. It then rebounded to 2.01 in 2021–22, below its level immediately before the pandemic, reflecting the overall progressive pattern of income growth since the start of the pandemic shown in Figure 2.3.
Figure 2.4. 90:50 and 50:10 ratios for disposable household income (BHC)

Note: Incomes have been measured net of taxes and benefits and before housing costs have been deducted. All incomes have been equivalised using the modified OECD equivalence scale.
Source: Authors’ calculations using the Family Resources Survey, 1994–95 to 2021–22.
Taking a longer view, both ratios have hovered around 2 since the mid 1990s (meaning that households at the 90th percentile have about double the incomes of those at the middle, and those at the middle have double the incomes of those at the 10th percentile). The 90:50 modestly declined in the decade leading up to the pandemic and the 50:10 modestly increased.
Figure 2.5 plots the Gini coefficient, a measure of inequality that takes the entire distribution of incomes into account. A higher score implies greater inequality, with 1 indicating one person having all the income and 0 indicating all individuals having equal income. Since the beginning of the pandemic, there has been a slight fall in the Gini coefficient, from 0.35 to 0.34. This continues the pattern seen since the early 1990s, during which time the Gini coefficient has changed very little indeed, following a substantial increase in the 1980s.
Figure 2.5. Gini coefficient
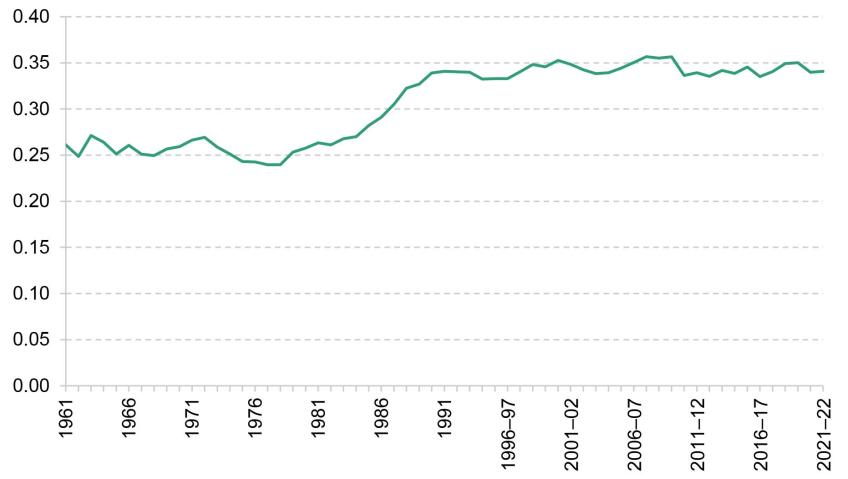
Note: Incomes have been measured net of taxes and benefits and before housing costs have been deducted. All incomes have been equivalised using the modified OECD equivalence scale.
Source: Authors’ calculations using the Family Resources Survey, 1994–95 to 2021–22, and the Family Expenditure Survey, 1961 to 1993.
2.2 Contributions to household income trends
In this section, we examine the changes in household incomes since the pandemic in more detail, and set them in their recent historical context. To do this, we separate out different components of households’ income, showing the contributions of employment income, benefits, income from investment, savings and private pensions, and housing costs to overall AHC income growth. We consider income growth across all households, as well as across the income distribution, splitting households into three equally sized income groups or ‘tertiles’. We distinguish between benefits for pensioner households (households with at least one pensioner in them) and benefits for working-age households, further splitting the latter into disability benefits and benefits unrelated to disability.
To contextualise changes over the pandemic, we start by showing the role played by the various income sources in driving household income growth between 2011–12 and 2019–20 – in other words, between the recovery from the Great Recession and the pandemic. The first black diamond in Figure 2.6 shows that total household incomes grew by 10.5% between 2011–12 and 2019–20, an average of 1.25% a year. By far the most important contributor was growth in employment incomes, which more than accounts for total income growth over this period. Employment incomes increased faster at the bottom of the income distribution than at the top, contributing 18.9% among the lowest-income households, 14.5% among middle-income households and 7.0% among the highest-income households. However, this was partly offset by reductions in working-age benefits, which overwhelmingly affected households in the bottom third of the income distribution. There was also an increase in other income for households in the middle and top tertiles, largely a consequence of higher incomes from private pensions. Taken together, growth in total incomes was similar across the income distribution, and slightly higher for middle-income households.
Figure 2.6. Contributions to net household income growth (AHC), 2011–12 to 2019–20, by AHC income tertile
Note: Incomes have been measured net of taxes and benefits and after housing costs have been deducted. All incomes have been equivalised using the modified OECD equivalence scale. Very-high-income households and those with negative incomes are excluded. ‘Other’ income contains mostly pension income, investment income and payments such as student loan repayments, but also includes private benefits and child income.
Source: Authors’ calculations using the Family Resources Survey, 2011–12 and 2019–20.
Patterns of income growth were very different in the two years since the pandemic, as shown in Figure 2.7. Employment incomes fell across the income distribution, and more so at the bottom, in a reversal of pre-pandemic trends. This reflects the labour market disruption at the start of the pandemic, which was only partly offset by the furlough scheme and its self-employment equivalent, as well as earnings not keeping up with inflation in 2021–22.
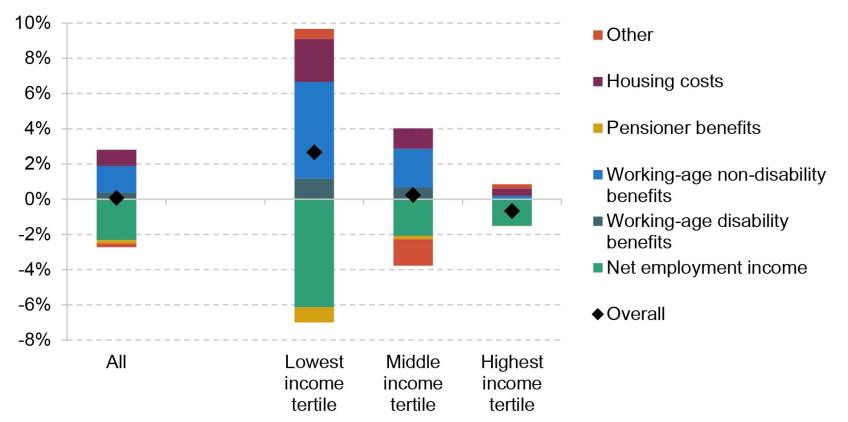
Figure 2.7. Contributions to net household income growth (AHC), 2019–20 to 2021–22, by AHC income tertile

Note: Incomes have been measured net of taxes and benefits and after housing costs have been deducted. All incomes have been equivalised using the modified OECD equivalence scale. Very-high-income households and those with negative incomes are excluded. ‘Other’ income contains mostly pension income, investment income and payments such as student loan repayments, but also includes private benefits and child income.
Source: Authors’ calculations using the Family Resources Survey, 2019–20 and 2021–22.
However, these falls in employment income were offset by an increase in working-age benefits, which particularly benefited lower-income households. Again, this represents a reversal of pre-pandemic trends. Two key policies were the £20 per week uplift to universal credit, which lasted from the start of the pandemic until October 2021, and the increases in work allowances and reduction in the taper rate for universal credit from the end of November 2021. In addition, local housing allowance rates, which govern the maximum amount of housing support private renters can receive and which had been frozen for four years, were significantly increased at the start of the pandemic. There was also a rise in disability benefits, which contributed 1.2% to total income growth among the lowest-income households. A progressive fall in housing costs further pushed up AHC incomes among lower-income households. Taken together, total incomes increased by 2.7% among the lowest-income third of households, remained roughly constant at the middle (0.2%) and fell slightly (–0.7%) among the highest-income households between 2019–20 and 2021–22.
In the rest of this section, we discuss the key changes in income sources since the beginning of the pandemic in more detail: the fall in employment incomes which was concentrated among lower-income households; the rise in benefit incomes; and in particular the rise in disability benefits among working-age households.
Employment incomes
The decline in net employment income between 2019–20 and 2021–22, especially among lower-income households, was a notable departure from pre-pandemic trends. This has been caused by both a fall in the proportion of households in work and a fall in earnings for those in work.
Figure 2.8 shows the share of workless households in each income tertile, split by whether the household contains at least one pensioner or only working-age adults. The fraction of low-income households with no one in paid work rose by 2.9 percentage points, driven by working-age households. The changes for households in the middle and upper tertiles were much more modest (0.4 and 0.8 percentage points respectively). Part of this rise in worklessness reflects an increase in exits from employment into economic inactivity among people aged 50 and over, documented by Boileau and Cribb (2022) and discussed in more detail in Section 2.3.
Figure 2.8. Share of households out of work, by AHC income tertile
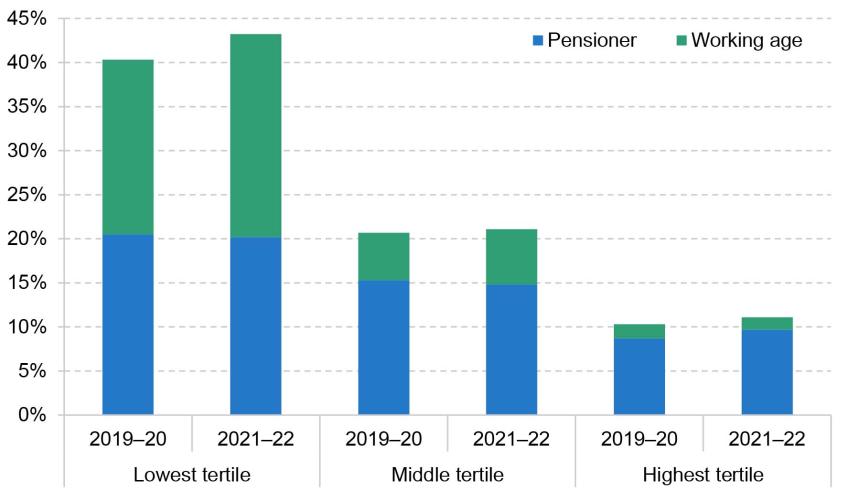
Note: Incomes have been measured net of taxes and benefits and after housing costs have been deducted. All incomes have been equivalised using the modified OECD equivalence scale. Very-high-income households and those with negative incomes are excluded.
Source: Authors’ calculations using the Family Resources Survey, 2019–20 and 2021–22.
As well as more households out of work, Figure 2.9 shows that those who remained in work saw a decline in their net earnings. The fall was biggest for the middle tertile, where employment income of in-work households fell by more than 4%. Among high-income households, the fall was 0.7% For the lowest-income households, those in work saw their employment income fall by 1.7%, on top of the changes in worklessness discussed above. The combination of these two trends led to the particularly stark decline in employment income for the poorest households.
Figure 2.9. Average weekly net employment income for in-work households, by AHC income tertile
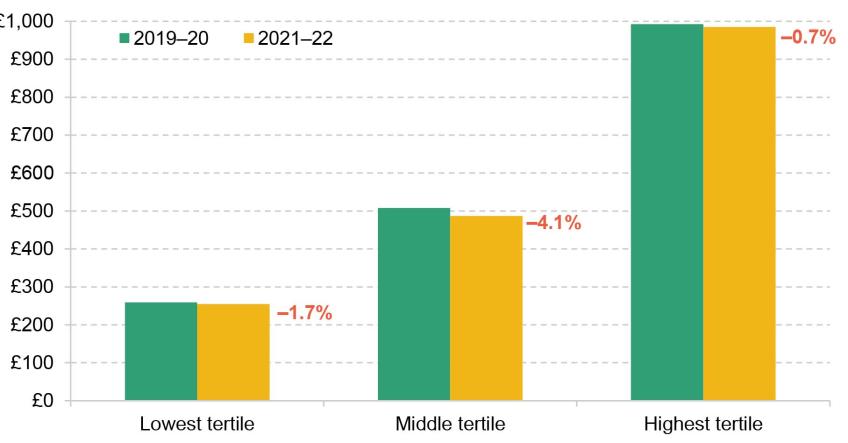
Note: Incomes have been measured net of taxes and benefits and after housing costs have been deducted, and are expressed in 2021–22 prices. All incomes have been equivalised using the modified OECD equivalence scale. Very-high-income households and those with negative incomes are excluded.
Source: Authors’ calculations using the Family Resources Survey, 2019–20 and 2021–22.
Benefit incomes
Changes to employment incomes have direct consequences for benefit incomes: in broad terms, as earnings fall, households’ benefit entitlements rise.1 However, the rise in benefit incomes shown in Figure 2.7 was not only the result of falling employment incomes. Instead, it reflects a number of policy changes, in particular the £20 per week uplift to universal credit rates between March 2020 and September 2021, and changes to the universal credit work allowances and taper rate from the end of November 2021.
Figure 2.10 plots the average weekly benefit income (adjusted for inflation and household size) for households by their pre-tax weekly earnings. We restrict to households not receiving disability benefits to strip out changes caused by increased numbers of disability benefit claimants, discussed below. First, we can see that for non-disabled households earning up to £400 a week, average benefit incomes were higher in 2021–22 than in 2019–20. This is driven by the £20 uplift to universal credit, which was in place for the first six months of the financial year, and the changes to the taper rate and work allowances, which were in place for the last four months of the year. Second, average benefit incomes for households earning less than £400 per week were lower in 2021–22 than in 2020–21, whilst the reverse is true for slightly higher-earning households (between £400 and £800 per week). This reflects the fact that the changes to the taper rate and work allowances more than compensated for the removal of the £20 uplift for higher-earning households on low incomes, but not for lower-earning households.
Figure 2.10. Household benefit income by gross earnings level, 2019–20 to 2021–22
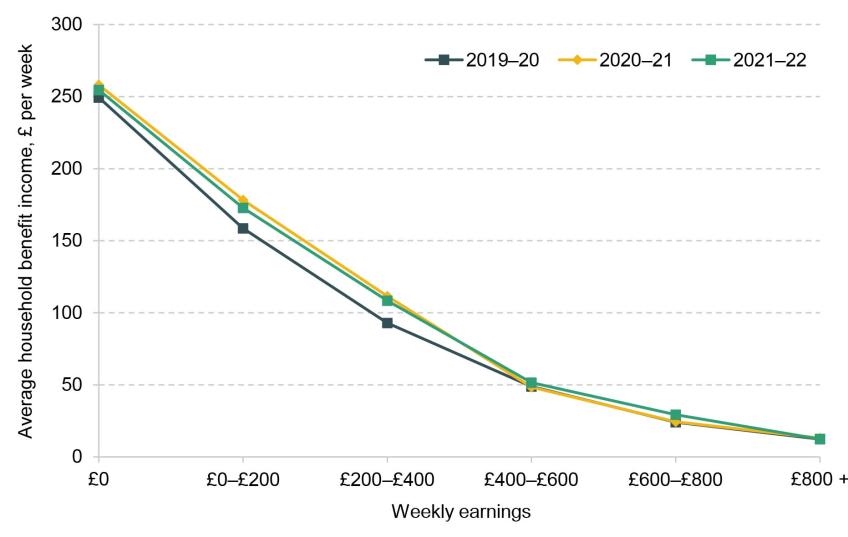
Note: Earnings and benefits have been equivalised using the modified OECD equivalence scale, and are expressed in 2021–22 prices.
Source: Authors’ calculations using the Family Resources Survey, 2019–20 to 2021–22.
Perhaps surprisingly, the increase in benefit levels is smaller for out-of-work households than for those on low earnings, with benefit incomes for this group rising by only £5 per week between 2019–20 and 2021–22, compared with £14–£15 for those earning £0–£200 and £200–£400 per week. This may partly reflect a change in composition of workless benefit claimants following the start of the pandemic. An increase in out-of-work single individuals making claims will tend to pull down the average benefit amount, since they have lower entitlements to universal credit.2 Another contributing factor could be the fact that workless households may be subject to the benefit cap, which limits the total amount of income a household can get from certain benefits. The benefit cap was not raised between 2019–20 and 2021–22, and so if a household was already capped before the uplift it would not have benefited from the £20 uplift.
Disability benefits
Another notable difference between the pre- and post-pandemic periods is the increased importance of working-age disability benefits, which accounted for more than 1% of income growth for the bottom income tertile between 2019–20 and 2021–22. This is consistent with other work that has shown large increases in the number of new disability benefit claimants across the UK (Joyce, Ray-Chaudhuri and Waters, 2022). It is worth noting that, although increases in disability benefit receipt lead to higher incomes for households, these may not translate into higher living standards due to the higher costs associated with disability – indeed, it is precisely these costs that disability benefits are supposed to compensate for.
The higher receipt of disability benefit among the working-age population is a consequence of a higher number of claimants rather than increases to the rates paid to existing claimants. Figure 2.11 plots the share of households receiving disability benefits by income level both before the pandemic and in the latest year of data. For the bottom income tertile, the share of households receiving disability benefits rose by 3 percentage points between 2019–20 and 2021¬–22, from 12% to 15%, driven entirely by an increase among working-age households. For households in the middle of the income distribution, the change was similar (rising from 15% to 18%). In proportional terms, a given rise in disability benefit receipt will have a bigger impact on the incomes of poorer households, leading to its bigger contribution for them in Figure 2.7.
Figure 2.11. Share of households receiving disability benefit, by AHC income tertile
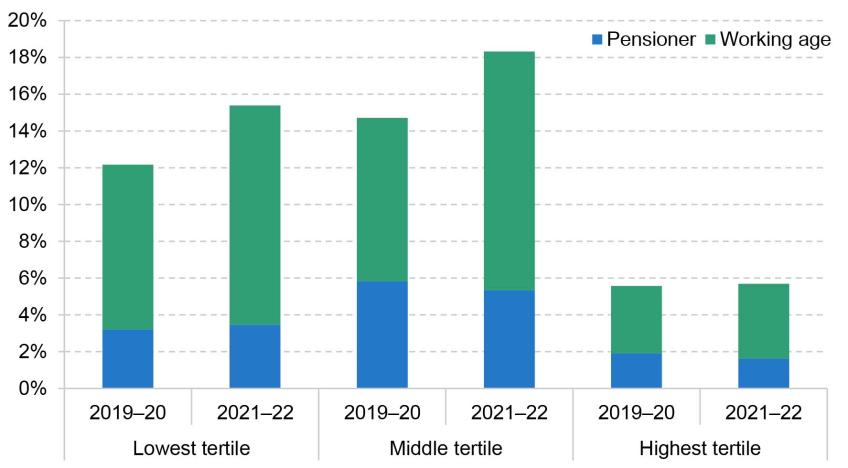
Note: Incomes have been measured net of taxes and benefits and after housing costs have been deducted. All incomes have been equivalised using the modified OECD equivalence scale.
Source: Authors’ calculations using the Family Resources Survey, 2019–20 and 2021–22.
2.3 Living standards of the recently inactive
One of the most widely discussed economic legacies of the pandemic has been a rise in economic inactivity. This has been driven by older individuals close to the state pension age, with flows from employment into inactivity mostly driven by early retirements (Boileau and Cribb, 2022). As Figure 2.12 shows, labour market exits of people aged 50–64 peaked in the first year of the pandemic and remained well above pre-pandemic levels in 2021–22. This section examines the implications of this wave of exits into inactivity for individuals’ living standards and well-being.
Figure 2.12. Flows from employment into inactivity among 50- to 64-year-olds
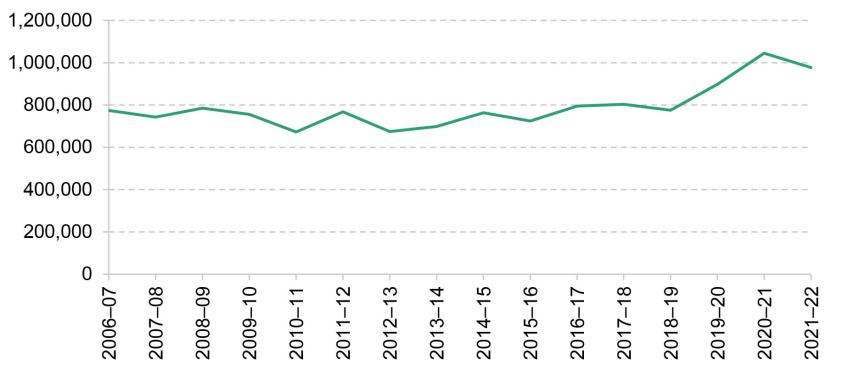
Note: Financial year 2006–07 includes data from 2006Q2 to 2007Q1.
Source: Authors’ calculations using the two-quarter Labour Force Survey, April–June 2006 to January–March 2022.
To understand how exits into inactivity have affected living standards, we start by examining how the living standards of recently inactive individuals have changed over time. Figure 2.13 plots various measures of living standards for individuals aged 50–70 who entered economic inactivity from employment one year ago or less, using data from the Family Resources Survey. For comparison, it also plots the same measures for economically inactive individuals who last worked more than one year ago. Note that the individuals represented by the yellow dots are not the same over time: those who are in the ‘Last worked 0-1 years ago’ series in one year will not be in it in the subsequent year. Figure 2A.1 in the appendix plots the same outcomes, breaking down inactive individuals by whether they last worked two years ago or less, or more than two years ago.
Figure 2.13. Living standards of inactive individuals aged 50–70, by when last worked
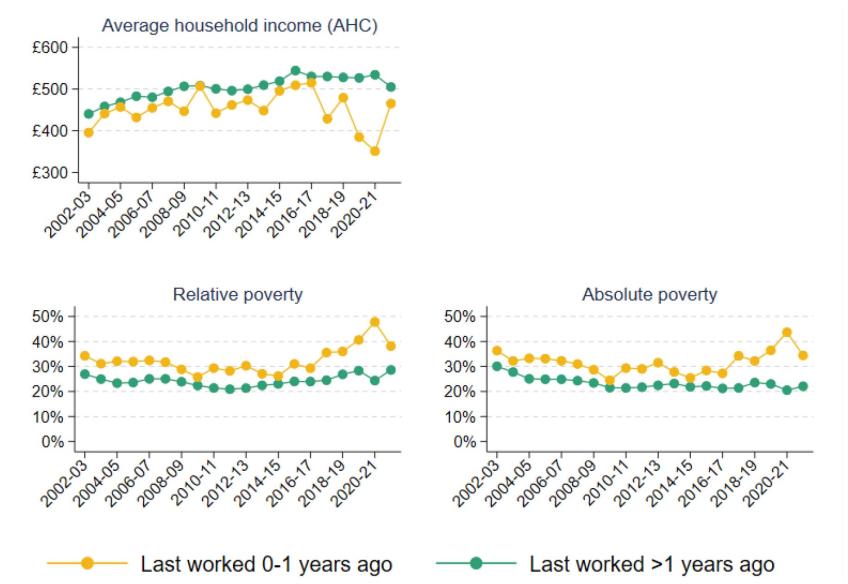
Note: Absolute poverty is defined as having income below 60% of median income in 2010–11. Average (mean) household incomes are measured net of taxes and benefits and after housing costs have been deducted, and have been equivalised using the modified OECD equivalence scale. Individuals who have never worked are included in the ‘Last worked >1 years ago’ category.
Source: Authors’ calculations using the Family Resources Survey, 2002–03 to 2021–22.
We first focus on those who became inactive during 2020–21 – the penultimate yellow dot in each of the panels in Figure 2.13. The first panel shows that average household income among the recently inactive was low by historical standards in 2020–21, though the data are noisy and incomes were not that much lower than for the equivalent group who became inactive the year before. Measures of low living standards, however, clearly show an increase in the incidence of poverty among those who became inactive in the first year of the pandemic. The share of recently inactive 50- to 70-year-olds who were in relative poverty increased by 7 percentage points (18%) between 2019–20 and 2020–21, a large increase at a time when relative poverty fell among inactive individuals as a whole (due to the fall in employment incomes among middle-income households discussed in Section 2.2). The share of recently inactive individuals in absolute poverty also increased by 7 percentage points in the first year of the pandemic.
Turning to those who became inactive in the second year of the pandemic (the last yellow dot – those who last worked a year ago or less in 2021–22), living standards look notably better: average income, relative poverty and absolute poverty among this group were all similar to those among the cohort who became inactive immediately before the pandemic. This suggests that it is the 2020–21 cohort of people who became inactive who are a particular cause for concern.
The increase in poverty among the 2020–21 cohort reflects the fact that individuals who moved from employment into economic inactivity in that year were less likely to have access to the state pension and private pensions than those who moved into inactivity in previous years. As shown in Figure 2.14, those who became inactive in 2020–21 were 8 percentage points less likely to be above the state pension age, and 5 percentage points less likely to have a private pension, than those who became inactive in 2019–20. Nearly half (49%) of the 2020–21 cohort did not have access to either private or state pensions, compared with 43% of the 2019–20 cohort.
Figure 2.14. Pension status of inactive individuals aged 50–70, by when last worked
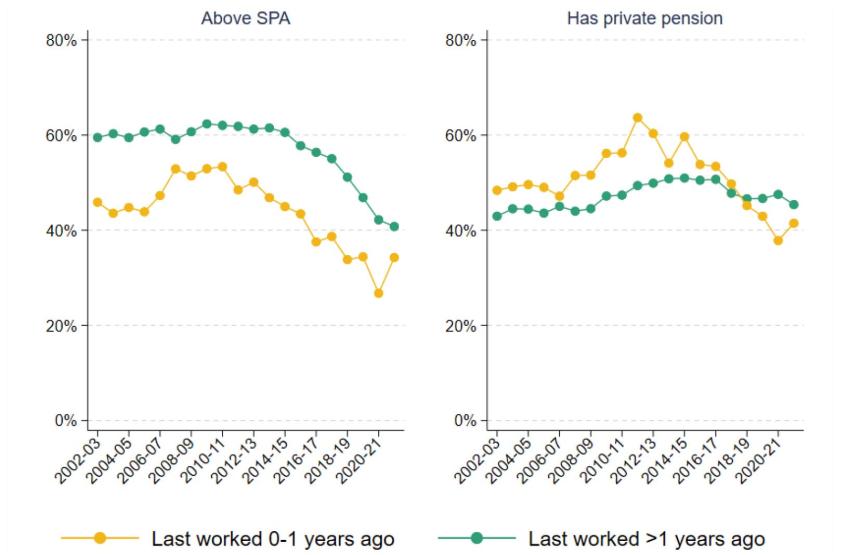
Note: SPA refers to state pension age.
Source: Authors’ calculations using the Family Resources Survey, 2002–03 to 2021–22.
In contrast, whilst the number of flows into inactivity in 2021–22 remained higher than pre-pandemic, recently inactive individuals in that year had similar access to the state pension and private pensions to those who became inactive before the pandemic. This suggests that there was something different about the 2020–21 cohort, who were perhaps more likely to have been ‘forced’ into leaving work because of labour market disruptions or health concerns. In contrast, by 2021–22 the labour market had largely recovered and the vaccine had been rolled out,3 so those who became inactive in that year are more likely to have done so out of choice.
The fall in living standards among those who became inactive at the start of the pandemic is corroborated by data from Understanding Society, a panel survey that interviews the same individuals year after year. The survey is conducted in overlapping waves of two calendar years each (Wave 10 spans 2019 and 2020, Wave 11 spans 2020 and 2021, and so on), so the timing of the data does not map precisely onto the financial years discussed above. Because we follow the same individuals, here we focus on the change in various outcomes they experience between one wave and the next.
The Understanding Society data suggest that older individuals (aged 50–70) who have exited the labour market since the pandemic began experienced larger deteriorations in their living standards than previous cohorts, based on a number of measures in Figure 2.15. For example, the average weekly food expenditure among those who became inactive in 2020–2021 fell by around £60 on average compared with the year before they became inactive, and 20% of this group entered relative poverty upon exiting the labour market, up from 16% the previous wave. These changes were much larger than among individuals who became inactive more than a year ago, which means that they do not simply reflect wider declines in living standards among the older inactive population over the pandemic. In addition, the fact that the data track the same individuals over time shows that the trends in Figure 2.13 are not simply due to a selection effect. That we see consistent patterns, even when following the same individuals, suggests that the trends are not because those who became inactive in 2020–21 already had low living standards. Instead, the results indicate that those who became inactive during that year experienced a deterioration in their living standards.
Figure 2.15. Change in living standards of inactive individuals aged 50–70, by when last worked
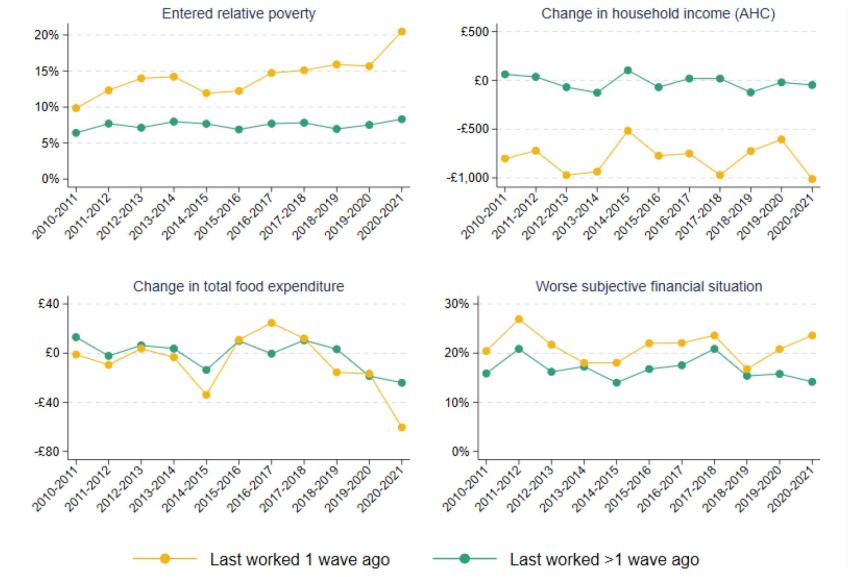
Note: Average household incomes are measured net of taxes and benefits and after housing costs have been deducted, and have been equivalised using the modified OECD equivalence scale. Food expenditure includes expenditure on groceries, food outside the home and alcohol. Household income is measured at the monthly level. Subjective financial situation is coded on a 1–5 scale, ranging from ‘finding it very difficult’ to ‘living comfortably’; in a given wave, an individual is coded as being in a worse subjective financial situation if their self-reported score is worse than their score in the previous wave. Individuals who have never worked are included in the ‘Last worked >1 wave ago’ category.
Source: Authors’ calculations using Understanding Society, Waves 2–12.
Finally, we turn to self-reported well-being in Figure 2.16, which uses data from the Annual Population Survey. Levels of anxiety, happiness, life satisfaction and the perception of life being worthwhile all deteriorated in 2020, but the deterioration was much larger among those who had become inactive one year ago or less than among those who became inactive more than a year ago. In particular, in 2020, the percentage increase in anxiety among the cohort who became inactive that year was more than double the increase among those who had been inactive for longer, and the percentage fall in the perception of life being worthwhile was 60% larger. As with measures of living standards shown in Figure 2.13, self-reported well-being largely rebounded among those who were recently inactive in 2021 and 2022.
Figure 2.16. Well-being of inactive individuals aged 50–70, by when last worked
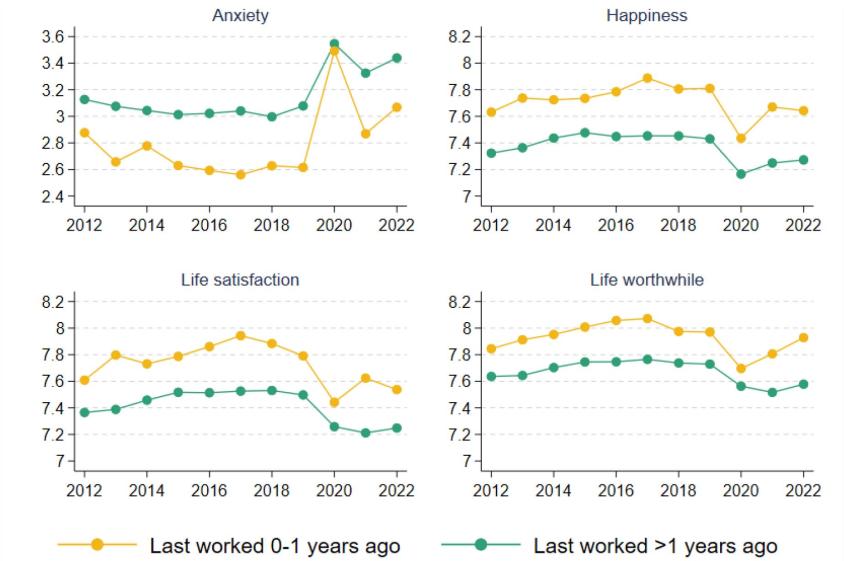
Note: All outcomes are scored on a 0–10 scale. Individuals who have never worked are included in the ‘Last worked >1 years ago’ category.
Source: Authors’ calculations using the Annual Population Survey, January–December 2012 to January–December 2022.
This analysis challenges the perception that all exits into inactivity over the pandemic were driven by wealthy individuals who could afford to retire in comfort. Existing research shows that the rise in inactivity is mainly a lower-middle-income phenomenon, concentrated in sectors that were hit hard by the pandemic and not amenable to working from home (Carrillo-Tudela, Clymo and Zentler-Munro, 2022). Consistent with this, our analysis suggests that many of those who became inactive in the first year of the pandemic may have been ‘forced’ into early retirement, to the detriment of their living standards and well-being. Conversely, those who became inactive in 2021–22 – when the labour market turmoil had largely dissipated and the vaccine had been rolled out – are more likely to have done so out of choice.
The fact that those who became inactive more recently have better living standards does not mean that this is an issue of only historical interest. People do not usually experience much change in their incomes after retirement, and so – unless they are able to get back into work – it is likely that many of the 2020–21 cohort will experience persistent low living standards. This is especially true for those who retired many years before their state pension age.
2.4 Conclusion
The recovery in household incomes in 2021–22 was stifled by a sharp rise in inflation. As result, average (median) household income was 1.2% below the pre-pandemic peak, and just back to pre-pandemic levels when measured after deducting housing costs. However, low-income households saw modest increases in their incomes in the two years since the pandemic started, implying a fall in income inequality at the bottom of the distribution.
This rise in incomes among low-income households was seen despite large falls in their incomes from employment. This is because lower employment rates and earnings were offset by lower housing costs and higher benefit incomes. The changes to benefit policy over this period – in particular the £20 uplift to universal credit, which persisted until October 2021, and changes in the universal credit work allowances and taper rate from November 2021 – increased benefit entitlements at any given level of earnings, and the share of low-income households receiving disability benefits also rose substantially over this period.
Looking beyond 2021–22, important changes in benefits policy will shape patterns in incomes. While six months of 2021–22 had the £20 uplift to universal credit, going forward that uplift has been withdrawn and replaced with an increase to work allowances and a reduction in the taper rate. Those reforms are worth about half the £20 uplift to claimants on average, and are targeted towards households slightly higher up the income distribution (Waters and Wernham, 2021a and 2021b). Local housing allowances – which had been increased in the pandemic – have once again been frozen in nominal terms, further pushing down real incomes at the bottom of the income distribution (Ray-Chaudhuri and Waters, 2023). Pushing in the other direction is the £37 billion support package implemented in response to the cost of living crisis which will have substantially bolstered incomes at the bottom of the distribution. At the same time, earnings have not kept pace with inflation, reducing real incomes across the board but especially among middle- and higher-income households. Taken together, it is likely that income inequality will have continued to fall in the period since 2021–22, largely due to the temporary cost of living support. How living standards and inequality evolve into the future will depend, among other things, on the path of earnings growth across the distribution and the government’s tax and benefit policies.
A key legacy of the pandemic has been the rise in economic activity among older adults. Data on living standards and well-being suggest that the cohort of 50- to 70-year-olds who left the labour market in the first year of the pandemic experienced higher rates of poverty than previous cohorts, and suffered worse declines in self-reported well-being. This did not simply reflect a general deterioration in living standards and well-being among the older inactive population. Our analysis challenges the perception that exits into inactivity over the pandemic were driven by wealthy individuals who could afford to retire in comfort, and suggests that many individuals were ‘forced’ into early retirement at the start of the pandemic. Further analysis using the English Longitudinal Study of Ageing (ELSA) will be important to identify which groups saw the largest declines in living standards upon leaving the labour market, and to what extent they are continuing to experience low living standards.
Appendix 2A
Figure 2A.1. Living standards of inactive individuals aged 50–70, by when last worked
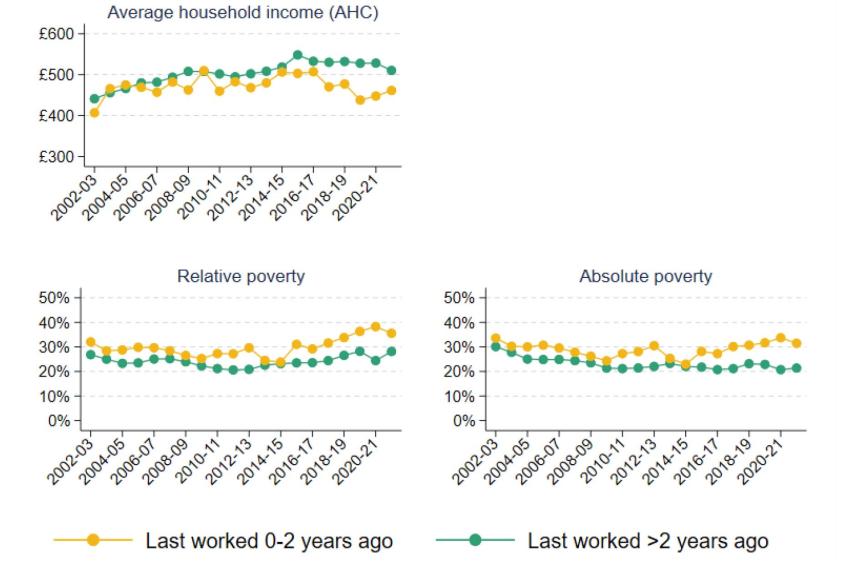
Note: Absolute poverty is defined as having income below 60% of median income in 2010–11. Average (mean) household incomes are measured net of taxes and benefits and after housing costs have been deducted, and have been equivalised using the modified OECD equivalence scale. Individuals who have never worked are included in the ‘Last worked >2 years ago’ category. The category ‘Last worked 0-2 years ago’ includes those who retired less than a year ago; because of routeing issues in the data, it may not capture all individuals who retired 1–2 years ago.
Source: Authors’ calculations using the Family Resources Survey, 2002–03 to 2021–22.
Data
Department for Work and Pensions, NatCen Social Research. (2021). Family Resources Survey. [data series]. 4th Release. UK Data Service. SN: 200017, DOI: http://doi.org/10.5255/UKDA-Series-200017
Office for National Statistics. (2019). Family Expenditure Survey. [data series]. 3rd Release. UK Data Service. SN: 200016, DOI: http://doi.org/10.5255/UKDA-Series-200016
Office for National Statistics. (2023). Annual Population Survey. [data series]. 7th Release. UK Data Service. SN: 200002, DOI: http://doi.org/10.5255/UKDA-Series-200002
Office for National Statistics. (2023). Labour Force Survey. [data series]. 9th Release. UK Data Service. SN: 2000026, DOI: http://doi.org/10.5255/UKDA-Series-200002
University of Essex, Institute for Social and Economic Research. (2022). Understanding Society: Waves 1-12, 2009-2021 and Harmonised BHPS: Waves 1-18, 1991-2009. [data collection]. 17th Edition. UK Data Service. SN: 6614, DOI: http://doi.org/10.5255/UKDA-SN-6614-18
Endnotes
Authors

Xiaowei Xu
Xiaowei joined the IFS in 2018 and works in the Income, Work and Welfare sector.

Sam Ray-Chaudhuri
Sam joined the IFS in 2022 and works as a research economist in the Income, Work and Welfare sector.
More from IFS
Understand this issue


Policy analysis


Academic research


