IFS Election 2017 analysis is being produced with funding from the Nuffield Foundation as part of its work to ensure public debate in the run-up to the general election is informed by independent and rigorous evidence. For more information, go to http://www.nuffieldfoundation.org.
Key findings
1. The UK population is ageing rapidly. Over the five years 2016 to 2021 the total population is forecast to grow by 3%, but the population aged 65 and over is forecast to grow by 9%, and the population aged 85 and over by 15%. These figures are even starker in the longer term. By 2066 26% of the population is projected to be aged 65 and over, compared to 18% in 2016 (and 12% in 1966).
2. This ageing of the population puts pressure on public spending because older individuals receive state pensions and they are more likely to use relatively expensive health and social care. For example, average health spending on a 70 year old is three times that on a 30 year old, and average spending on 90 year old almost eight times that on a 30 year old.
3. Pressure on state pension spending from population ageing is being tempered by increases in the State Pension Age. Despite this, pensioner-specific benefit spending is still projected to rise, increasing by 1.8% of national income – equivalent to £37 billion in today’s terms – between 2016–17 and 2066–67. This pressure would be halved if the state pension was earnings-indexed rather than increases being “triple locked”.
4. Demographic pressures could increase health spending by 0.8% of national income between 2016–17 and 2066–67. However, other cost pressures (including increasing relative health care costs and technological advances) are potentially even more important. Taken together the Office for Budget Responsibility projects that health spending faces upwards spending pressures amounting to 5.3% of national income between 2016–17 and 2066–67. This is equivalent to £109 billion in today’s terms.
5. While large, the projected increases in health and pension spending are not out of line with recent history. Between 1949–50 and 2015–16 spending on these areas increased from 6.5% to 12.2% of national income. The same period saw sharp falls in spending as a share of national income on debt interest (a decline of 3.8% of national income since 1948–49) and defence (a decline of 7.3% of national income since 1953–54).
6. Official projections imply that if all of the demographic and other pressures were accommodated through increasing public spending health and pensions would increase as a share of non-debt interest spending from nearly a third in 2015–16 to 45% by 2066–67 (with non-debt interest spending increasing from 38.0% to 43.8% of national income). If the pressures were accommodated by cutting spending elsewhere, then spending on health and pensions would account for 55% of non-debt interest spending by 2066–67. Doing so would also require cutting other spending by around a quarter, and delivering this would clearly be very challenging.
7.We face an unavoidable choice: increase the size of the state; rein in spending on health, long-term care and state pensions; or continue to refocus existing public spending towards these areas at the expense of spending elsewhere. The demographic and cost pressures facing health care are not new, but successive governments have yet to consider seriously their implications over the long term. The next government would be wise to consider these long run trends carefully, and to start focusing on finding and implementing a long term solution to these funding pressures now, rather than just announcing further short term funding fixes.
Population ageing will continue to put pressure on public spending
The UK population is not just growing, but also ageing. Over the five years 2016 to 2021 the Office for National Statistics projects that the UK population will grow by 3%, but within that the population aged 65 and over is projected to grow by 9%, and the population aged 85 and over by 15%. Over the fifty years starting in 2016 the population as a whole is projected to grow by 24%, with the population aged 65 and over growing by 80% and the population aged 85 and over more than tripling. This is similar to the rate of growth in the population over the previous fifty years. Figure 1 shows the implications of projected population growth for the proportion of the population in different age bands.
Figure 1. Projected age composition of the UK population
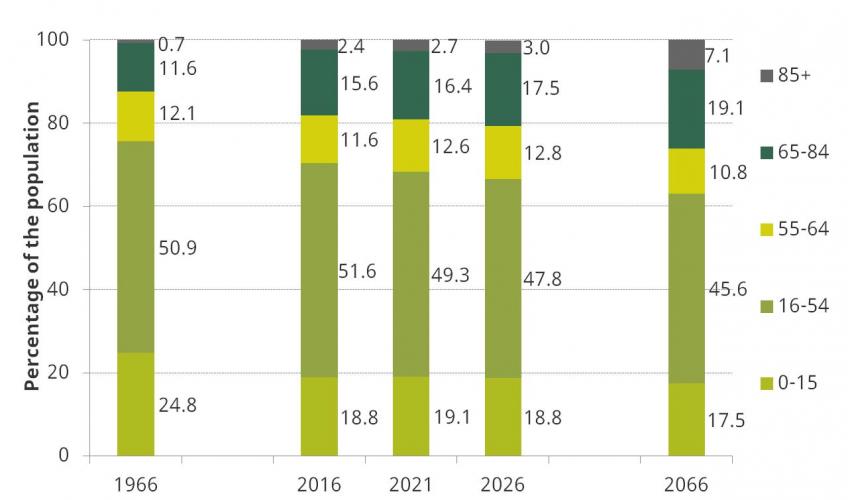
Notes: Figures for 1966 relate to Great Britain. Projections are 2014-based.
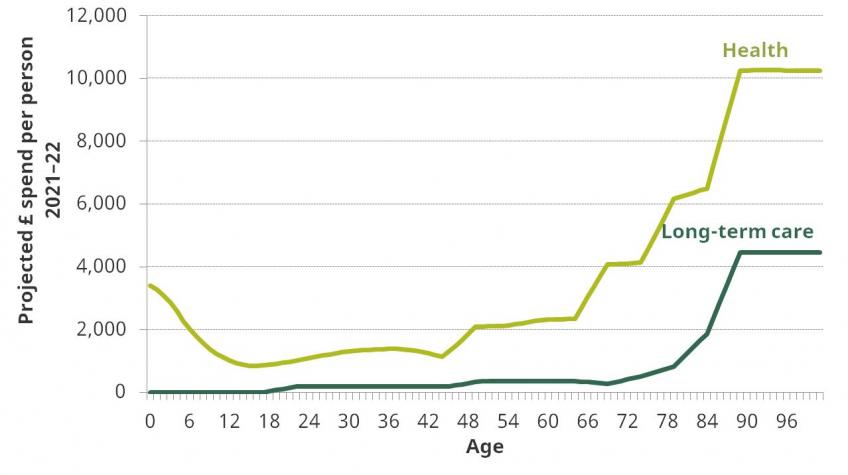
This ageing of the population puts pressure on public spending because older individuals receive state pensions, and they are more likely to use relatively expensive health and social care. Figure 2 shows estimated age profiles for spending on health and long-term care. For example, average health spending on a 65 year old is estimated to be double that on a 30 year old. The ratio rises steeply at older ages, with average spending on a 70 year old three times, and spending on a 90 year old almost eight times, that on a 30 year old.
Figure 2. Age profiles of spending on health and long-term care
The pressure on state pension spending from the ageing population is being tempered by increases in the State Pension Age (SPA). The proportion of the population that is projected to be of pensionable age in future is illustrated in Figure 3. Between 2016 and 2020 the proportion of the population that is of pensionable age is projected to fall to 18%, as the SPA for men and women rises to age 66 in October 2020. Thereafter the proportion of the population of pensionable age is forecast to rise, reaching 19% in 2026 and climbing further during the subsequent decade.
Figure 3. Projected proportion of the population of pensionable age
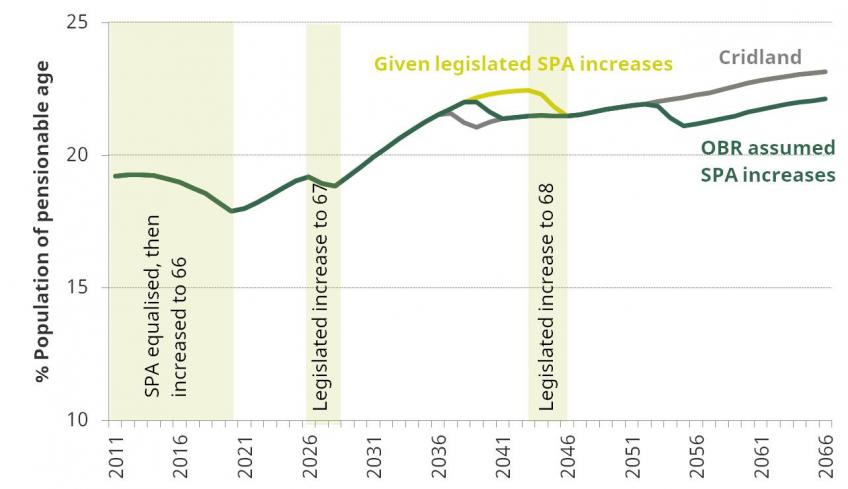
Notes: Legislated policy is that the SPA for both men and women will increase to 67 between 2026 and 2028 and to 68 between 2044 and 2046. The recent Independent Review of the State Pension Age led by John Cridland recommended that the increase in the SPA to 68 is brought forwards to between 2037 and 2039. The OBR Fiscal Sustainability Report 2017 assumed that the SPA increase to 68 would be brought forward to between 2039 and 2041, and that a further rise to 69 would take place between 2053 and 2055.
Half of pressure from spending on pensioner specific benefits driven by triple lock
The OBR’s projections for future spending on pensioner specific benefits (that is the state pension, pension credit and winter fuel payments), taking into account these demographic pressures, is shown in Figure 4. Spending on these benefits is projected to be fairly stable at just over 5% of national income until the start of the 2030s, after which point the increase in the proportion of the population of pensionable age, combined with the continued impact of triple lock indexation (see below), feeds through into an increase in pension spending. Spending on pensioner specific benefits as a share of national income is projected to reach 6.4% of national income by 2038–39, and 7.1% of national income by 2066–67. This would be an increase of 1.8% of national income compared to the level of spending in 2016–17. This is equivalent to £37 billion in today’s terms.
Figure 4. Projected spending on state pension and other pensioner specific benefits
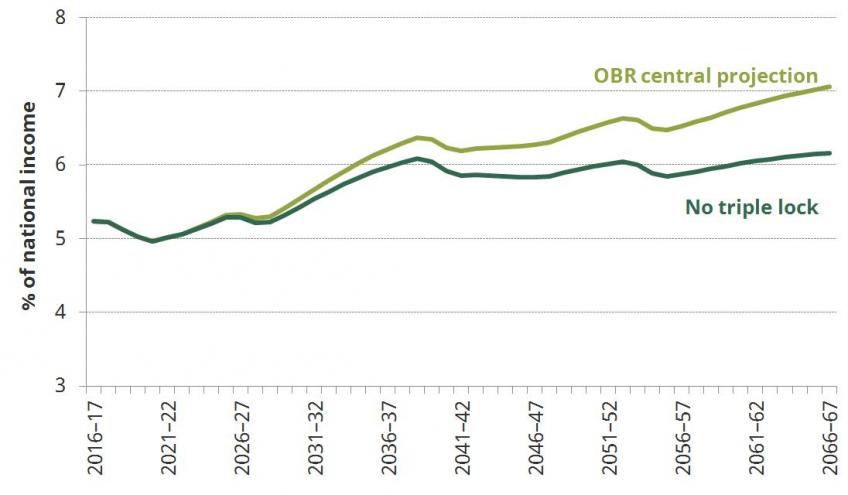
If the government were to increase the level of the state pension over time in line with growth in average earnings, rather than the higher of the growth in average earnings, inflation or 2½% (the “triple lock”), then this would reduce the projected increase in spending on pensioner specific benefits such that it would be projected to rise to 6.2% of national income in 2066–67. This would imply an increase in spending relative to 2016–17 of 0.9% of national income (£18 billion in today’s terms) rather than 1.8% of national income. In other words the future pressure on the public finances from spending on the state pension and other pensioner specific benefits could at a stroke be halved by replacing the triple lock with a policy of earnings indexation.
Projected pressures on health and long-term care spending are considerable
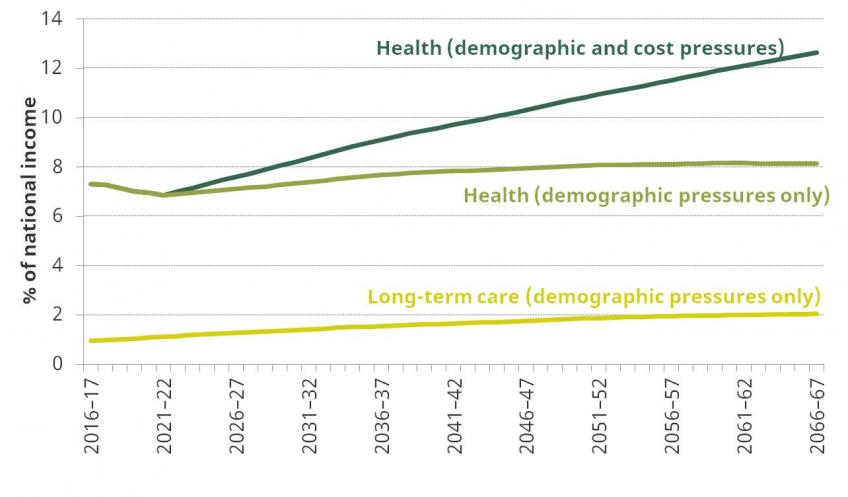
Figure 5 shows the OBR projections for spending on health over the long term, taking into account the changing size and age structure of the population and assuming that health spending per person of a given age and sex grows in line with average earnings. These projections illustrate that demographic pressures alone could put upward pressure on health spending of 0.5% of national income between 2016–17 and 2041–42, and of 0.8% of national income between 2016–17 and 2066–67. These are equivalent to £11 billion and £17 billion, respectively, in today’s terms.
However, it is not just demographics that are putting upward pressure on spending. Other cost pressures, including increasing relative health care costs and technological advances, are potentially even more important. Figure 5 shows the OBR projection for long run health spending assuming that spending is increased to cover both demographics and an estimate of these other cost pressures. This would see health spending increasing by 2.4% of national income between 2016–17 and 2041–42, and by 5.3% of national income between 2016–17 and 2066–67. These are equivalent to £49 billion and £109 billion, respectively, in today’s terms. These numbers assume that the planned cut to spending on health as a share of national income to the end of the current decade can and will be delivered.
Long-term care spending also faces upward pressure from the ageing of the population. Furthermore, the planned cap on lifetime care costs that was announced by the Government in response to the Dilnot Commission will increase public spending on care. The OBR projection for public spending on long-term care in light of these pressures is shown in Figure 5. Long-term care spending is projected to increase by 0.7% of national income between 2016–17 and 2041–42, and by 1.1% of national income between 2016–17 and 2066–67. These are equivalent to £14 billion and £22 billion, respectively, in today’s terms. These estimates do not take account of any cost pressures on long-term care, and therefore likely underestimate the pressure on spending going forwards.
Figure 5. OBR projections for spending on health and long-term care
Projected future increases in spending on health and pensions are not out of line with recent history
The increases in spending on pensioner-specific benefits and health projected by the OBR for the next fifty years (shown in Figures 4 and 5 respectively) are large, but they would not be out of line with recent historical spending trends. Figure 6 illustrates how spending on health and state pensions has changed over the last few decades. In 1955–56 spending on each amounted to less than 3.0% of national income. By 2015–16 spending on health amounted to 7.4% of national income and spending on state pensions 4.8% of national income. Between 1978–79 and 2007–08 (i.e. just prior to the financial crisis) health spending increased by 2.6% of national income – an average increase of 0.1 percentage points of national income each year. This is a similar rate of increase to that projected on average after 2021–22.
Figure 6. Historical and projected health and pensions spending
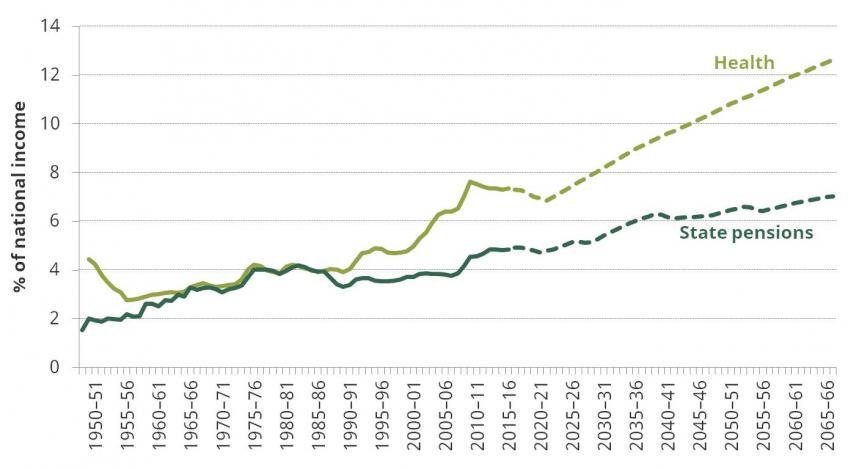
Notes: Historical pension spending is for Great Britain only. State pension spending is pensioner specific benefit spending excluding pension credit – i.e. state pension plus winter fuel payments.
Past increases in spending on health and pensions funded by both increasing the size of the state and by cutting elsewhere
Since the mid 20th century the share of national income spent publicly on state pensions and health has increased significantly. These increases occurred over a period in which:
- The overall size of the state increased slightly, from 39.0% of national income in 1948–49 to 40.0% of national income in 2015–16. This 1.0% of national income increase is equivalent to £20 billion in today’s terms.
- Spending on debt interest fell substantially from 5.6% of national income in 1948–49 to 1.8% of national income in 2015–16. This 3.8% of national income fall is equivalent to £78 billion in today’s terms.
- Spending on defence also fell substantially, from 9.2% of national income in 1953–54 to 1.9% of national income in 2015–16, due to demilitarisation after the Second World War and the subsequent end of the Cold War. This 7.3% of national income fall is equivalent to £148 billion in today’s terms.
This increase in the size of the state, and drop in spending on debt interest and defence as a share of national income, enabled spending in other areas to grow substantially. As shown in Table 1, in addition to spending on both health and state pensions growing as a share of national income, over the longer-term there has also been growth in the share of national income spent publicly on other benefits, education, social care and overseas aid.
The change in spending as share of national income between 1953–54 and 2015–16 spent publicly in different areas is illustrated in Figure 7, and the change between 1978–79 and 2015–16 is shown in Figure 8.
Figure 7. Public spending as a share of national income, 1953–54 and 2015–16 compared
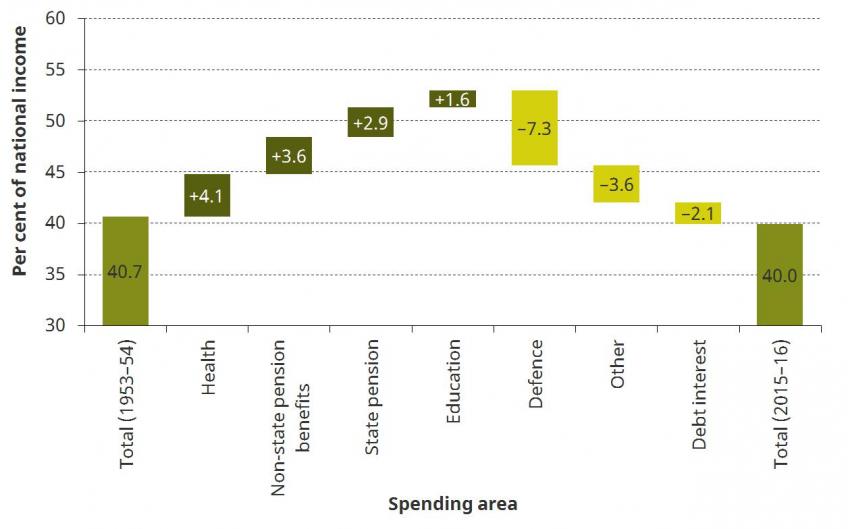
Figure 8. Public spending as a share of national income, 1978–79 and 2015–16 compared
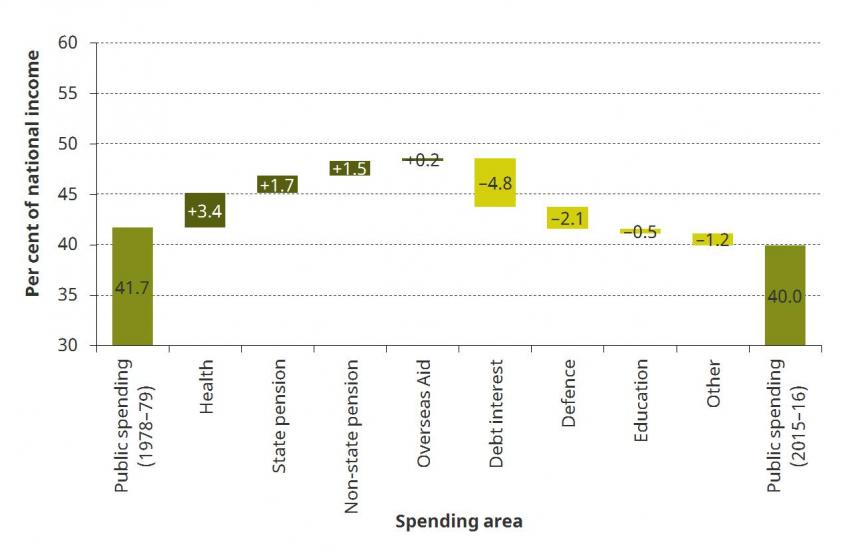
Table 1. Long-run change in public spending as a share of national income across different areas
| Start year | Start % of GDP | 2015–16 % of GDP | Change % of GDP |
Total public spending | 1948–49 | 39.0 | 40.0 | +1.0 |
Debt interest | 1948–49 | 5.6 | 1.8 | –3.8 |
Total spending less debt interest | 1948–49 | 33.4 | 38.2 | +4.8 |
|
|
|
|
|
Total benefits | 1948–49 | 3.9 | 11.1 | +7.3 |
Of which |
|
|
|
|
State pension | 1948–49 | 1.5 | 4.8 | +3.3 |
Other benefits | 1948–49 | 2.4 | 6.3 | +3.9 |
|
|
|
|
|
Health | 1949–50 | 4.4 | 7.4 | +2.9 |
Education | 1953–54 | 2.8 | 4.5 | +1.6 |
Defence | 1953–54 | 9.2 | 1.9 | –7.3 |
Overseas Aid | 1960–61 | 0.1 | 0.7 | +0.5 |
Social care | 1977–78 | 0.6 | 1.3 | +0.6 |
Public order & safety | 1978–79 | 1.4 | 1.6 | +0.2 |
Transport | 1978–79 | 1.4 | 1.5 | +0.1 |
The government faces an important and undeniable choice: how to pay for future increases in health, care and pension spending
While the projected long run increases in health and pension spending going forwards are not unprecedented, paying for them will not be easy. The next government – and its successors – essentially have three options: rein in spending on these areas, or increase spending to meet these pressures by increasing the size of the state, or cut spending elsewhere.
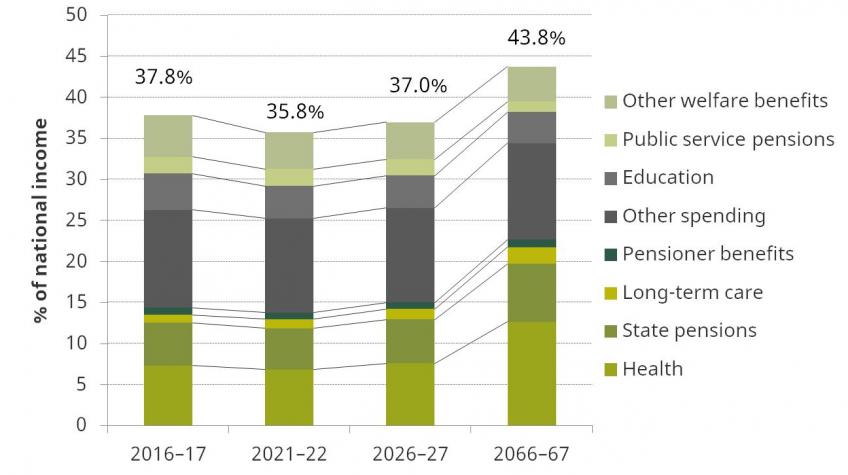
The full OBR projections for non-interest public spending in future are shown in Figure 9. Demographic changes and implemented policy reforms do suggest falls in spending on some other areas, specifically education, public-service pensions and non-pensioner welfare. On the other hand, spending on non-age related benefits which are also received by pensioners is projected to increase slightly.
Taken together, public non-interest spending outside of pensioner specific benefits, health and long-term care is projected by the OBR to fall by 2.3% of national income between 2016–17 and 2066–67 under current government policy. This means that the 8.2% of national income increase in spending on pensioner specific benefits, health and long-term care projected between 2016–17 and 2066–67 would require an increase in total non-debt interest spending or further cuts to spending elsewhere of 5.9% of national income. This is equivalent to £121 billion in today’s terms.
Figure 9. OBR non-interest spending projections
It would certainly not be possible to fund such an increase in spending simply through higher government borrowing. The OBR projections in the 2017 Fiscal Sustainability Report illustrate that such additional borrowing would push debt onto an unsustainable trajectory, increasing remorselessly over time and surpassing 100% of national income before the start of the 2040s.
One option would be to increase taxes to cover the increase in non-debt interest spending as a share of national income. This would leave the long-run public finances in roughly the same position as implied by the most recent Budget. However an increase in the tax take of 5.9% of national income – equivalent to £121 billion in today’s terms – also feels unlikely, at least when looking at UK history. This would push total government receipts as a share of national income to around 44%, which would be higher than at any point since 1950.
If non-interest public spending were to be kept constant, then any increase in spending on pensions, health and long-term care would need to be paid for by reducing spending elsewhere. Such cuts would be harder to achieve than they were historically, since public spending outside of these areas is much lower than it used to be. A 5.9% of national income reduction in spending outside of health, pensions and long-term care would be a cut of a quarter to the current level of spending on these areas. Figure 10 shows the level and composition of spending in 2015–16 on the areas from which cuts would need to be sought.
Figure 10. Composition of "other" spending in 2015–16
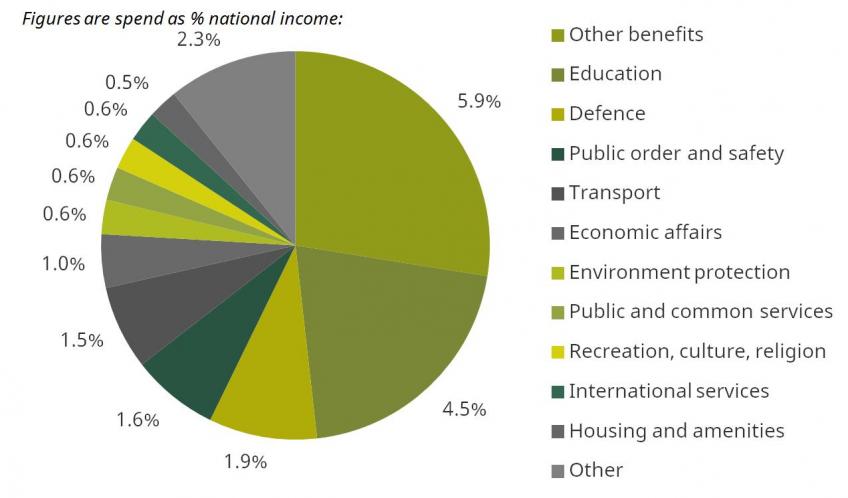
Notes: Composition of public spending excluding health, long-term care, pensioner-specific benefits, debt interest and accounting adjustments.
Figure 11 illustrates how the proportion of non-debt interest public spending going on health and state pensions has changed over time. Taken together it has almost doubled from around one-sixth in the mid-1950s to nearly a third in 2015‒16. The figure also shows how this could change going forwards given the OBR projections for spending on health and pensions: the dashed line assumes that non-debt interest public spending is increased to cover the additional demographic and other pressures, while the dotted line assumes that total non-debt interest spending is held constant after 2021–22 and that additional spending on health and pensions is accommodated by cutting spending elsewhere. Under the former scenario spending on health and pensions would account for 45% of the all non-interest spending by 2065‒66, while under the latter it would account for 55%.
Figure 11. Share of non-interest spending on health and state pensions
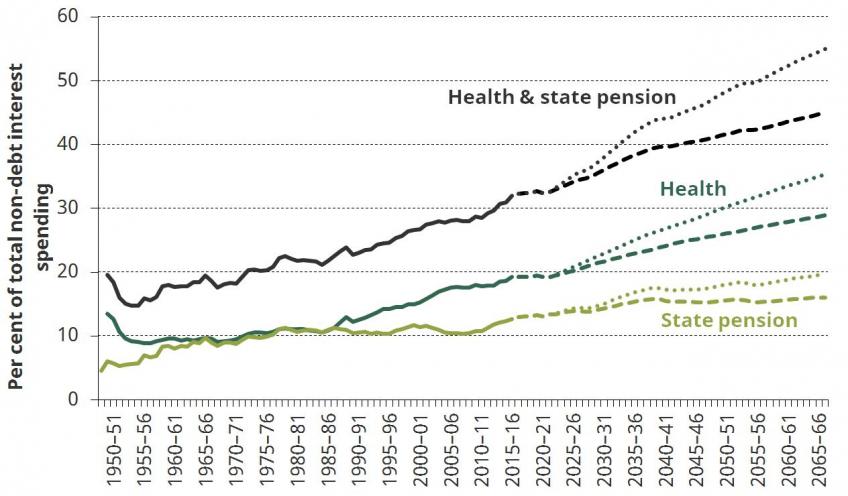
Notes: Dashed lines assume that public spending is increased to pay for additional health and state pension spending. Dotted lines assume that non-debt interest spending is held constant after 2021-22 and that increased spending on health and pensions is accommodated by cutting spending elsewhere.
The government faces an important and undeniable choice
In summary, we face an unavoidable choice: increase the size of the state, continue refocusing existing public spending on health, long-term care and pensions, or rein in spending on these areas – in particular on health care. The demographic and cost pressures facing health care are not new, but successive governments have yet seriously to consider their implications over the long term. The next government would be wise to consider these long run trends carefully, and to start focusing on finding and implementing a long term solution to these funding pressures now, rather than just announcing further short term funding fixes.
Sources
Figure 1
Sources: Office for National Statistics, Population projections and population estimates.
Figure 2
Source: Office for Budget Responsibility, Fiscal Sustainability Report 2017, Chart 3.7.
Figure 3
Source: Authors’ calculations using Office for National Statistics population projections and Office for National Statistics factors to calculate the population of state pension age.
Figure 4
Source: Office for Budget Responsibility, Fiscal Sustainability Report 2017, Chart 3.10.
Figure 5
Sources: Office for Budget Responsibility, Fiscal Sustainability Report 2017, Chart 3.8 and Supplementary Tables Table 1.1
Figure 6
Sources: DWP Benefit Expenditure Tables, OBR Fiscal Sustainability Report 2017, Office for Health Economics and HMT Public Expenditure Statistical Analyses.
Figures 7 and 8, Table 1
Sources: DWP Benefit Expenditure Tables, OBR Public Finances Databank (May 2017), Office for Health Economics, Office for National Statistics, OECD DAC database (http://stats.oecd.org/qwids/) and HMT Public Expenditure Statistical Analyses.
Figure 9
Source: Office for Budget Responsibility, Fiscal Sustainability Report 2017.
Figure 10
Sources: HM Treasury, Public Spending Statistics Release May 2017, OBR, Fiscal Sustainability Report 2017.
Figure 11
Source: As Figure 6.
