
Downloads
Download report PDF
PDF | 565.51 KB
Executive summary
The state pension age (SPA) for women rose from 60 to 66 between 2010 and 2020 (and for men from 65 to 66 between 2018 and 2020). Further increases to the SPA (for both men and women) are legislated starting from next year, such that it reaches 67 in early 2028. Understanding the effects of previous increases in the SPA is crucial for informing policymakers of the potential effects of future increases. This report focuses in particular on a group disproportionately affected by SPA increases: those who are already not in paid work prior to the SPA rise occurring.
Key findings
- Increasing the female SPA from 60 to 65 lifted the employment rate of women aged 60–64 by 11 percentage points overall. But this increase was entirely concentrated among the women who were still in paid work at 58; those already out of work by this age did not return to the labour market as the SPA was increased. On average, this group of women are worse off on several dimensions than those in paid work in their late 50s, with lower incomes, having worse health and being more likely to be renters.
- Increasing the SPA leads to lower incomes, especially for those who had already left paid work by their late 50s. Average individual income for 60- to 64-year-old women fell by £48 per week as a result of being below the SPA. For those who were out of paid work by age 58, the income loss was much larger at £81 per week, largely because they did not offset the loss of state pension with increased earnings. Those already out of work in their late 50s are therefore particularly vulnerable to the financial impact of a rising SPA.
- Despite the fall in income, we find no evidence that affected women reduced spending on a basket of (predominantly) ‘essential’ items such as food and energy. This could reflect households adjusting spending on other spending categories. However, we do find that the likelihood of participating in leisure activities declines. For those who had left the labour market by their late 50s, the increased SPA reduced their likelihood of visiting cultural venues at least once every few months by 8 percentage points. These women were also more likely, as a result of the increase in the SPA, to report that financial constraints limited their ability to do what they wanted.
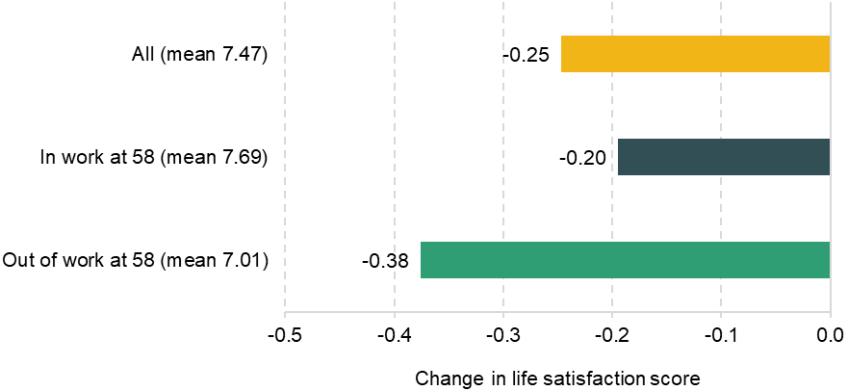
- Life satisfaction fell by 0.25 points on a 0–10 scale (with a baseline average of 7.5) as a result of the increase in the SPA among all affected women. For those already out of paid work by age 58, the fall was larger (0.38 points, compared with a baseline average of 7.0) and is equivalent to the fall in well-being associated with moving from the second lowest to the lowest quarter of the wealth distribution. This result is consistent with the fall in income and reduced participation in social activities contributing to lower life satisfaction.
- Overall, these findings show that the effects of increasing the SPA fall harder on those who were already not in paid work by their late 50s – who had lower incomes and worse health and were more likely to be renters. Further increases in the SPA will deliver fiscal savings but at a cost particularly borne by lower-income groups who struggle to be in paid work at older ages. A key focus for policymakers should be to help people remain in and return to paid work at older ages. In addition, as recommended by the IFS Pensions Review, targeted financial support through the working-age means-tested benefit system for those approaching the SPA could mitigate the effects of a higher SPA for the hardest-hit groups. This could also help bolster political support for future SPA increases.
1. Introduction
The government is facing increasing fiscal pressures as a result of rising life expectancies and an ageing population. One way in which the government has eased these pressures is through raising the state pension age (SPA), the earliest age at which an individual can claim the state pension. Increasing the SPA eases the fiscal burden of an ageing population by reducing state pension spending and by boosting tax receipts from individuals who delay retirement and remain in paid work for longer as a result of the change.
Between 2010 and 2018, the SPA rose from 60 to 65 for women. Then, from 2018 to 2020, it rose from 65 to 66 for both men and women. Further increases are legislated, with the SPA due to rise to 67 by 2028 and to 68 in the mid 2040s. Especially given these further increases to the SPA, it is vital for policymakers to understand how increasing the SPA can affect different individuals. This report seeks to inform them by looking at the effects of previous increases in the SPA. It is particularly timely as in July 2025 the government announced the start of a new independent review of the SPA to be led by Suzy Morrissey, Deputy Director of the Pensions Policy Institute (Department for Work and Pensions, 2025), following the first two such reviews by John Cridland (Department for Work and Pensions, 2017) and Baroness Neville-Rolfe (Department for Work and Pensions, 2023).
Past evidence shows that increases in the female (and later male) SPA increase average retirement ages (Cribb, Emmerson and Tetlow, 2016; Coile et al., 2025). However, at the same time, average household incomes fall and poverty rates rise, as overall the loss in state pension income is only partially offset by an increase in employment earnings (Cribb and Emmerson, 2019; Cribb and O’Brien, 2022). Furthermore, the effects of the female SPA increases are not felt equally. On average, only around 9 in 100 women are found to delay their retirement as a result of an increase in the SPA (Coile et al., 2025). In part, this is because many have left employment well before they reach the SPA – in 2018, only 59% of 60-year-old women were in paid work.1 This raises an important question – how do those already not in paid work fare when the SPA rises?
This policy report summarises new findings on the effects of raising the UK’s female SPA from 60 to 65 on income, expenditure and well-being using two household surveys – the English Longitudinal Study of Ageing (ELSA) and the Annual Population Survey (APS). The report draws heavily on a more detailed research paper published alongside it (Cribb, Henry and Karjalainen, 2025). Throughout this report, we focus particularly on understanding how increasing the SPA affects women who have already left paid work.
2. The effect of increasing the state pension age on incomes, spending and well-being
Increasing the SPA means that people have to wait longer to receive a state pension. The impact of this change on household finances and well-being will naturally differ across individuals. In particular, some will be able to adjust to a higher SPA by remaining in paid work for longer, and will not see significant falls in their living standards as a result. However, those who have already left the labour market well before reaching their (old) SPA may find it very difficult to return to paid work as a result of the reform.
Indeed, our analysis shows that across all women in our sample, 11 out of 100 women delayed retirement as a result of the increase in the SPA, but this increase was entirely driven by women who are still in paid work in their late 50s. Amongst women aged 60–64 who were in employment at age 58, there was a 16 percentage point increase in employment rate when the SPA increased from 60 to 65, whereas women who were not in paid work at age 58 did not see any significant increase in their employment rate. This means that women who were already out of paid work at 58 did not return to work as a result of a rising SPA, but instead remained out of employment. This is the group of women we focus on in this report.
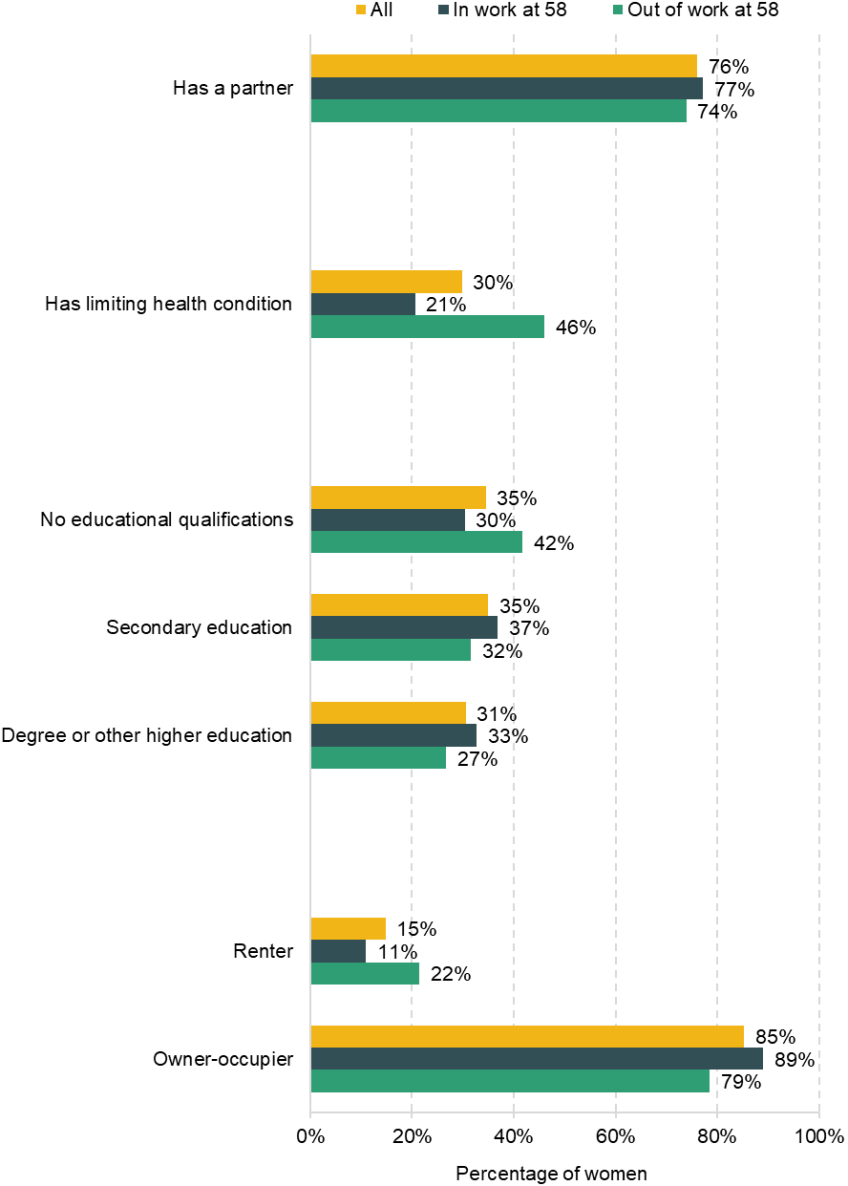
In addition to not adjusting to a higher SPA by returning to paid work, those who had left employment earlier were also worse off in other ways compared with other women in this age group. Women who were out of employment at 58 were, on average, poorer, in terms of both individual and family income, than those who were still in paid work at age 58. They were also more than twice as likely to have a limiting health condition, more likely to have no educational qualifications and more likely to be renters. (See Figures A1 and A2 in the appendix for more details.)
Incomes and expenditure
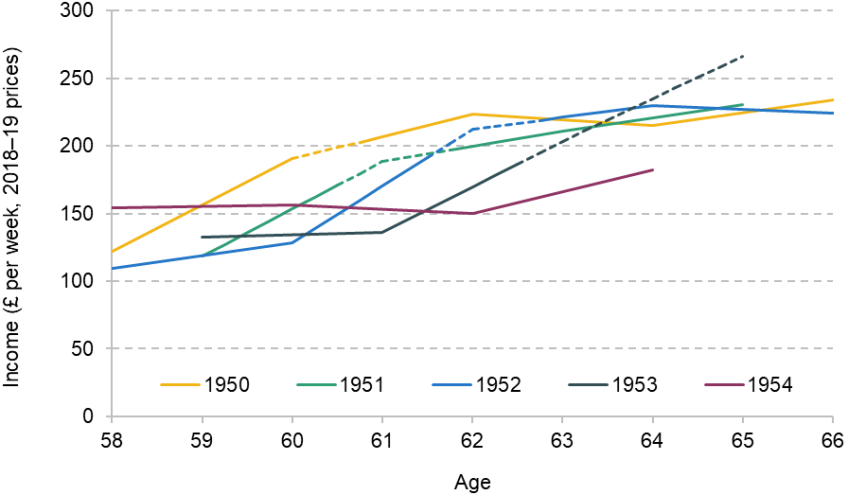
Figure 1 shows how individual incomes of those born between 1950 and 1954 change from their late 50s to mid 60s, focusing entirely on women who had already left the labour market by the age of 58. The dashed lines indicate the period over which the SPA was increasing for the particular year-of-birth group. This means that all the datapoints before the dashed section will show the average outcome for women of a particular year-of-birth group below the SPA. Similarly, if we take a datapoint after the dashed section for a particular year-of-birth group, this will show the average outcome for women who are above the SPA.
Figure 1. Mean individual income by year of birth, for women out of paid work at age 58, by age
Note: The lines are dashed over the period when the SPA was changing for the women in that year-of-birth group; to the left of the dashed part all women in the cohort were below SPA and to the right above SPA. Income is winsorised to the 99th percentile. Some datapoints are omitted due to small sample size.
Source: Authors’ calculations using English Longitudinal Study of Ageing, 2008–09 to 2018–19.
We can see from Figure 1 that among women who were out of paid work at age 58, average incomes increase around the time of reaching the SPA. As the different year-of-birth groups reach the SPA at different ages, the increase in average incomes also happens at different ages. This increase in average incomes at the point of reaching SPA is mainly driven by the fact that the sources of income are different above and below the SPA. For the average individual above the SPA, the most significant source of income is the state pension, whereas for individuals just under the SPA and not in paid work, the largest sources of income are working-age state benefits and private pensions (Cribb, Henry and Karjalainen, 2024).
Figure 1 shows visually how average incomes changed among the affected age groups of women as the SPA increased, but in the remainder of this report we will give the results of careful econometric analysis which isolates the effect of an increase in the SPA on different outcomes (set out in more detail in Cribb, Henry and Karjalainen (2025)). We utilise the fact that the increase in SPA for women was rolled out slowly, with women born in successive months having a slightly higher SPA. As we set out, those who have left employment well before the SPA may be more vulnerable to the effects of increases in the SPA. We therefore show how raising the SPA affects the outcomes of two distinct groups – women who were out of paid work at age 58 and those who were still in paid work at that age.
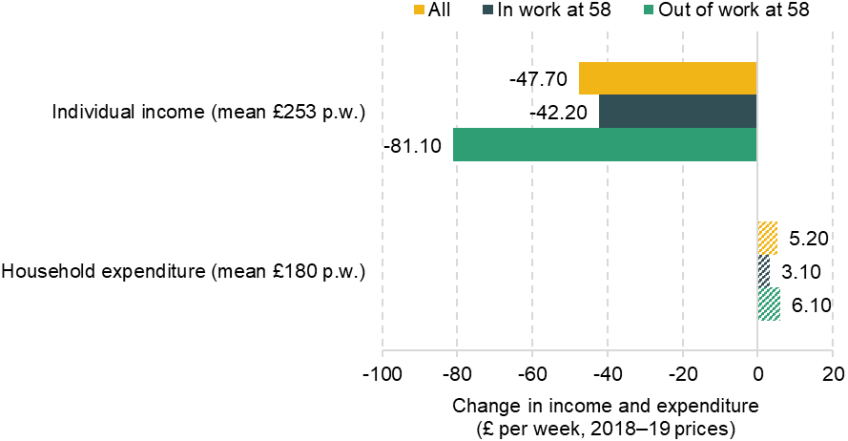
Figure 2 shows how increasing the SPA affects individuals’ income and household expenditure. When the SPA for women increased from 60 to 65, the average individual income of women aged 60–64 fell by around £48 a week. Importantly, the fall in income was significantly larger for women who were already out of employment by age 58: on average, this subgroup of women faced an £81 fall in income when the SPA increased. As women who were out of employment at age 58 did not return to employment, they did not have increased earnings to make up for the loss of income from the state pension.
Figure 2. Effect of increasing state pension age from 60 to 65 on the weekly individual income and expenditure of 60- to 64-year-old women
Note: See tables 2 and 3 of Cribb, Henry and Karjalainen (2025) for full details. Effects are statistically significantly different from zero at (at least) the 5% level, except those with striped bars, which are not. The means are measured at age 59. Income is winsorised to the 99th percentile.
Source: Authors’ calculations using English Longitudinal Study of Ageing, 2008–09 to 2018–19.
Figure 2 also shows that despite this relatively large change in income, on average household expenditure does not seem to change significantly when the SPA increases. Our measure of expenditure contains about 40% of total spending amongst women in this age group – in particular, we capture spending on food consumed at home (excluding alcohol and tobacco), food consumed out of the home (e.g. at restaurants), gas and electricity, clothing and leisure, so we capture a higher proportion of ‘essential’ items than of overall expenditure.
It is striking that there is no significant change in this measure of expenditure captured in ELSA alongside the fall in income, even for the women who were not in paid work in their late 50s who faced a relatively large fall in income as a result of the rise in the SPA. There could be a number of reasons why expenditure does not change when the SPA rises. Individuals may be adjusting expenditure on components of expenditure not captured in the data that we use – for example, transport, holidays and furniture, which are the main sources of household spending that the measure we use does not include. It is possible that the items we do capture, weighted heavily towards ‘essentials’, are simply less responsive to changes in income.
Alternatively, it could be the case that individuals are smoothing their spending – economic theory suggests that individuals would prefer to have a steady flow of consumption over time rather than have intermittent periods of very high and low consumption. Using this logic, it is plausible that people do not change their spending when they experience a change in income, as they will have already made sufficient adjustments when they became aware that the change in income was coming.
Participation in leisure activities
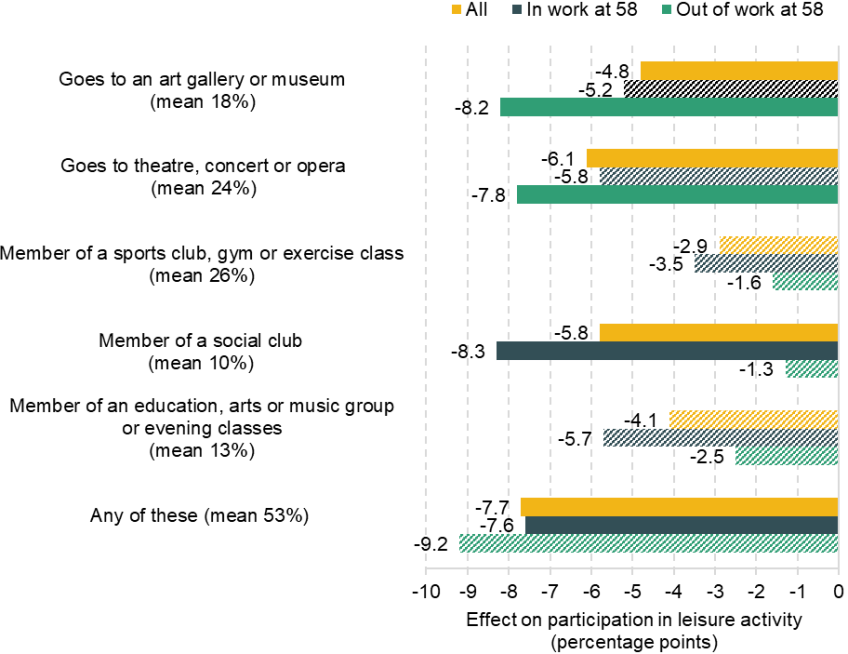
Whilst we find no evidence of an effect of the increase in the SPA on a measure of reported spending, or indeed on average reported spending on leisure (in the previous four weeks), there is evidence that people are reducing how often they take part in some leisure activities outside of home. Figure 3 shows the estimated effect of increasing the SPA on the likelihood of having taken part in various leisure activities at least ‘once every few months’ in the previous year. The results show that increasing the SPA leads to a decrease in the likelihood of taking part in certain leisure activities, including going to art galleries, museums, the theatre, concerts or the opera and being a member of a social club.
In particular, we find that there was a significant reduction in the likelihood of going to a gallery, art museum, theatre, concert or opera among those who were out of paid work at 58. This aligns with another finding from our analysis – that increasing the SPA leads to a 10 percentage point increase in the proportion of women not in paid work at age 58 reporting that ‘money prevents them from doing what they want’.2 On the other hand, among those who were still in paid work at 58, whose time use may be more directly affected by an increase in the SPA (because they are more likely to remain in paid work), were less likely to be a member of a social club as a result of the reform.
Figure 3. Effect of increasing state pension age from 60 to 65 on probability of participating in leisure activities of 60- to 64-year-old women
Note: See table 4 of Cribb, Henry and Karjalainen (2025) for full details. Effects are statistically significantly different from zero at (at least) the 5% level, except those with striped bars, which are not. The means are measured at age 59.
Source: Authors’ calculations using English Longitudinal Study of Ageing, 2008–09 to 2018–19.
Life satisfaction
So far, we have shown that when the SPA is increased, some women are more likely to remain employed but overall they face a fall in income, and although reported spending on many items is unchanged, there is evidence of people worrying about money more and of reduced participation in social/leisure activities.
To understand how these changes combine to affect life satisfaction, Figure 4 shows how increasing the SPA affects life satisfaction. In particular, we use a measure of life satisfaction that requires individuals to rank how satisfied they feel about their life on a scale of 0 to 10, where 0 indicates a person is not all satisfied with their life and 10 indicates they are very satisfied. This is a standard measure of well-being in academic literature (Frijters and Krekel, 2021) and is the measure used by the UK government to measure well-being (HM Treasury, 2021) when evaluating the effects of public policies on well-being.
Figure 4. Effect of increasing state pension age from 61 to 66 on the life satisfaction score of 61- to 65-year-old women
Note: See table 6 of Cribb, Henry and Karjalainen (2025) for full details. Effects are all statistically significantly different from zero at (at least) the 5% level. The means are measured at age 59.
Source: Authors’ calculations using the Annual Population Survey, 2013Q1 to 2021Q2.
Figure 4 shows that when the SPA increases, life satisfaction falls. Particularly, the average life satisfaction score falls by around 0.25 (compared with a baseline of around 7.5) when the SPA rises from 61 to 66.3 The fall in life satisfaction as a result of the increase in the SPA is larger for women who had already left employment in their late 50s – the life satisfaction score falls by 0.38 amongst this group of women when the SPA rises. This is an even larger change proportionally, as life satisfaction among this group was lower to begin with (7.0 on average). As shown in the accompanying research paper (Cribb, Henry and Karjalainen, 2025), this is equivalent to the change in life satisfaction achieved by moving down from the average for the second lowest quarter of the wealth distribution to the average for the lowest quarter of the wealth distribution.
While this analysis shows that increasing the SPA has a negative impact on life satisfaction, it is important to consider the magnitude of this effect in the wider context of public finance constraints. Frayman et al. (2024) argue that the reduction in life satisfaction brought about by an increase to the SPA is small relative to the saving to public finances, whereas they estimate that there are other areas of public spending where the benefit in terms of well-being is very large compared with the cost in terms of public expenditure.4
3. Summary and policy implications
Raising the state pension age is an effective tool for reducing state pension spending and also raises additional tax revenue from those who remain in employment – around £6 billion per year for a one-year increase in the SPA for both men and women (Cribb et al., 2025). However, it has disproportionately large adverse consequences for certain groups, such as those who had already left employment before they reached their old SPA. People in this group are generally poorer on a range of dimensions, in terms of their income, health and housing tenure, and importantly their lower attachment to the labour force means that increasing the SPA does not lead to them returning to paid work in response. Instead, increasing the SPA leads to particularly large negative outcomes for this group; they see a larger fall in income and fall in life satisfaction than the average woman in their age group.
This does not mean that the government should not continue to use increases in the SPA as a tool to manage the rising costs of the state pension system. There is a strong rationale to increase the SPA when life expectancies at older ages rise, and indeed many governments across the world have chosen to increase pension eligibility ages. But policymakers should think carefully about the impact on individuals in poorer groups when they are considering raising the SPA. The priority should be to help people remain in and return to paid work at older ages – for example, by making sure that work coaches in jobcentres have the skills and support they need to help these groups in particular.
But additional support will also be needed for the individuals who are disproportionately affected. By targeting additional support at lower-income people, the government could mitigate the effects of a higher SPA for the most vulnerable groups. In addition, this might help build political support for further rises in the SPA. This was one of the recommendations from the IFS Pensions Review (Cribb et al., 2025), and should be part of the considerations for the current independent review of the state pension age and the government’s subsequent response to it.
Appendix
Figure A1. Mean income of women aged 58–64, by work status at age 58

Note: Means are calculated for women aged between 58 and 64 in the period 2008Q2 to 2019Q1. Incomes are net of tax. Individual income includes that from employment, self-employment, private pension, state pension and state benefits. Income including partner also includes asset income. Incomes are winsorised to the 99th percentile.
Source: English Longitudinal Study of Ageing, 2008–09 to 2018–19.
Figure A2. Average characteristics of women aged 58-64, by work status at age 58
Note: Means are calculated for women aged between 58 and 64 in the period 2008Q2 to 2019Q1.
Source: English Longitudinal Study of Ageing, 2008–09 to 2018–19.
References
Coile, C., Cribb, J., Emmerson, C. and O’Brien, L., 2025. Why does raising the early retirement age affect employment? IFS Working Paper, https://ifs.org.uk/publications/why-does-raising-early-retirement-age-affect-employment.
Cribb, J. and Emmerson, C., 2019. Can’t wait to get my pension: the effect of raising the female early retirement age on income, poverty and deprivation. Journal of Pension Economics and Finance, 18(3), 450–72, https://doi.org/10.1017/S1474747218000057.
Cribb, J., Emmerson, C., Johnson, P., Karjalainen, H. and O’Brien, L., 2025. The Pensions Review: final recommendations. IFS report, https://ifs.org.uk/publications/pensions-review-final-recommendations.
Cribb, J., Emmerson, C. and Tetlow, G., 2016. Signals matter? Large retirement responses to limited financial incentives. Labour Economics, 42, 203–12, https://doi.org/10.1016/j.labeco.2016.09.005.
Cribb, J., Henry, A. and Karjalainen, H., 2024. How have pensioner incomes and poverty changed in recent years? IFS report, https://ifs.org.uk/publications/how-have-pensioner-incomes-and-poverty-changed-recent-years.
Cribb, J., Henry, A. and Karjalainen, H., 2025. The effects of increasing the female state pension age and the interactions with labour market histories, IFS working paper, https://ifs.org.uk/publications/effects-increasing-female-state-pension-age-and-interactions-labour-market-histories.
Cribb, J. and O’Brien, L., 2022. How did increasing the state pension age from 65 to 66 affect household incomes? IFS report, https://ifs.org.uk/publications/how-did-increasing-state-pension-age-65-66-affect-household-incomes.
Department for Work and Pensions, 2017. Independent Review of the State Pension Age: smoothing the transition. https://assets.publishing.service.gov.uk/media/5a81eb22ed915d74e3400c27/print-ready-independent-review-of-the-state-pension-age-smoothing-the-transition.pdf.
Department for Work and Pensions, 2023. Independent Review of the State Pension Age 2022. https://assets.publishing.service.gov.uk/media/642402ce2fa848000cec0e34/print-ready-state-pension-age-independent-review-2022.pdf.
Department for Work and Pensions, 2025. Third Review of State Pension Age: independent report terms of reference. https://www.gov.uk/government/publications/third-review-of-state-pension-age-independent-report-terms-of-reference.
Frayman, D., Krekel, C., Layard, R., MacLennan, S. and Parkes, I., 2024. Value for money: how to improve wellbeing and reduce misery. Centre for Economic Performance report, https://cep.lse.ac.uk/_new/publications/abstract.asp?index=11099.
Frijters, P. and Krekel, C., 2021. Handbook of Wellbeing Policy for the UK. Oxford University Press.
HM Treasury, 2021. Wellbeing guidance for appraisal: supplementary Green Book guidance. https://assets.publishing.service.gov.uk/media/60fa9169d3bf7f0448719daf/Wellbeing_guidance_for_appraisal_-_supplementary_Green_Book_guidance.pdf.
Data
NatCen Social Research, University College London, Institute for Fiscal Studies. (2023). English Longitudinal Study of Ageing. [data series]. 7th Release. UK Data Service. SN: 200011, http://doi.org/10.5255/UKDA-Series-200011.
Office for National Statistics. (2025). Annual Population Survey. [data series]. 9th Release. UK Data Service. SN: 200002, DOI: http://doi.org/10.5255/UKDA-Series-200002.
Acknowledgements
Funding for this research was provided by the IFS Retirement Saving Consortium: Aegon; Age UK; Association of British Insurers; Association of Consulting Actuaries; Aviva; Department for Work and Pensions; Franklin Templeton; Institute and Faculty of Actuaries; The Investment Association; Joseph Rowntree Foundation; Lane, Clark and Peacock; Money and Pensions Service; Nucleus; Pensions UK; The People’s Pension; Royal London; and Standard Life.
We are also grateful for funding from the Economic and Social Research Council (ESRC) Joint Programming Initiative More Years Better Lives (project ‘Unequal ageing: life-expectancy, care needs and reforms to the welfare state’, grant reference ES/W001594/1) and for the support of the ESRC Centre for the Microeconomic Analysis of Public Policy (ES/T014334/1) at the Institute for Fiscal Studies. We have benefited from the advice and comments of the members of the Retirement Saving Consortium, Carl Emmerson and seminar participants at IFS.
Endnotes
Authors

Jonathan Cribb
Jonathan joined IFS in 2011. His research areas includes: pensions, ageing and demographic change, public sector pay, housing, and inequalities.


Heidi Karjalainen
Heidi is a Senior Research Economist in the Retirement, Saving & Ageing sector. Her current research is on pensions and saving for retirement.
More from IFS
Understand this issue


Policy analysis


Academic research


