
Downloads
Download report PDF
PDF | 937.78 KB
This report describes patterns of co-residence of young adults at a parental home in the United Kingdom. We show how the rate of co-residence varies across dimensions such as income, region and ethnicity. We show how it has changed in recent years and discuss potential drivers of the rise observed. We quantify how much young adults who co-reside with parents could be saving in rent and how much this appears to increase their savings.
Key findings
- The proportion of UK adults in their 20s and 30s co-residing with their parents has risen by over a third over the last two decades. Between 2006 and 2024, the rate of co-residence among 25- to 34-year-olds rose by 5 percentage points, from 13% to 18%. This represents around 450,000 more 25- to 34-year-olds living at a parental home than if co-residence were at its 2006 rate.
- Co-residing is more common for young men than for young women, and rates of co-residence are particularly high among some ethnic minority groups. In 2023–24, 23% of men and 15% of women aged 25–34 lived at a parental home. Rates of co-residence were particularly high among UK-born Bangladeshi and Indian 25- to 34-year-olds, with 62% and 50% living at a parental home respectively.
- Among those in their 50s and 60s, having co-residing adult children is particularly common for those living in London, consistent with those young people who grew up in London being particularly likely to co-reside with parents. However, among 25- to 34-year-olds living in London, the co-residence rate is not atypically high (20% compared with the UK average of 19%), likely driven by the significant inflow of young people to the capital from other regions.
- Co-residing is particularly common among those on the lowest incomes. Almost half of 25- to 34-year-olds in the bottom fifth by income are living at a parental home, compared with just 2% of those in the top income quintile. Co-residence can be seen as a transfer from parents to their adult children, allowing these children to avoid paying full – or any – rent and potentially to save on other costs such as heating.
- These patterns of co-residence by income contrast with the patterns of direct financial transfers made from parents to children at these ages. The share of people in their 20s and early 30s receiving a direct financial transfer over an eight-year period increases with income, rising from 13% in the lowest-income fifth to 54% in the highest-income fifth.
- Increases in co-residence have been concentrated among those in their 20s and have tended to be higher in parts of the country that have seen particularly high house price growth since 2006. The largest increases in co-residence between 2006–07 and 2023–24 occurred in the East, South West, North West and South East of England. While London has seen the highest house price growth over this period, it saw only slightly above average increases in the rate of co-residence.
- Changes in the age, sex, education, immigrant and ethnic composition of 25- to 34-year-olds cannot explain the increased rates of co-residence and in fact would have been expected to drive a decline in the rate of co-residence from 13% to 12% between 2006 and 2024. Within this age group, the population has become more educated and slightly older on average, and a rising share have been born outside the UK. All these characteristics are associated with being less likely to co-reside at a parental home, so would have been expected to lead to a decline in co-residence rates.
- Lower rates of parenthood and marriage and increased reported experience of ill health among 25- to 34-year-olds have coincided with the increase in co-residence over the period. Since 2006, the proportion of 25- to 34-year-olds who are married has fallen sharply from 39% to 29%, and the proportion with a dependent child has fallen even more, from 45% to 33%. In addition, the proportion of 25- to 34-year-olds with a health condition lasting at least a year has risen from 17% to 31%, with half of this rise having happened since the beginning of 2020. These changes have the potential to explain 2 percentage points of the increase in co-residence. However, the trends in marriage and parenthood may themselves be influenced by decisions to co-reside.
- Taking the changes in marital status, parenthood and health status together with changes in 25- to 34-year-olds’ region of residence, age, sex, education, migration status and ethnicity can explain at most one-tenth of the observed increase in co-residence since 2006 (and probably less than this given that some of these trends will be partly driven by co-residence). Therefore, it is likely that other factors – such as the declining affordability of housing – have been much more important in driving up rates of co-residence.
- We estimate that co-residers would be paying around £560 per month in rent on average if they lived in the private rented sector, with the highest average amount (£1,000) for those living in London. This coincides with patterns of direct financial transfers made: we know that those in London and the South East are more likely to receive direct financial transfers than those in the North East.
- Those living with parents are likely to have some ability to reduce debts, increase saving or increase spending relative to if they lived in private rented accommodation. Having co-resided over a two-year period, rather than having privately rented, is associated with a higher likelihood of having a larger increase in financial wealth. Those who co-reside are 3.9 percentage points more likely to have accumulated more than £10,000 in net financial wealth over a two-year period. However, co-residing is also associated with a higher likelihood of seeing a large decline in net financial wealth, consistent with some people moving in with parents as a result of adverse events.
1. Introduction
Rising numbers of young adults are living at their parents’ home, both in the United Kingdom and elsewhere across the world (Esteve and Reher, 2021). Since 2006, the proportion of 25- to 34-year-olds who live at a parental home has risen from 13% to 18% in the UK. In the most recent data, the proportion is on a downward trend, after a spike up to 21% of 25- to 34-year-olds during the COVID-19 pandemic. But the 5 percentage point rise since 2006 still represents around 450,000 more 25- to 34-year-olds living at a parental home in 2024 than if the proportion had remained at its 2006 level.
Using slightly different data, we know that 20- to 29-year-olds were slightly less likely to live with their parents than the OECD average in 2022 (OECD, 2024).1 Levels of co-residence were close to other English-speaking countries (the US, Canada and Australia) and higher than Nordic countries. They were significantly lower than levels of co-residence in Southern Europe.
Figure 1. Share of 25- to 34-year-olds living at a parental home, 2006 to 2024
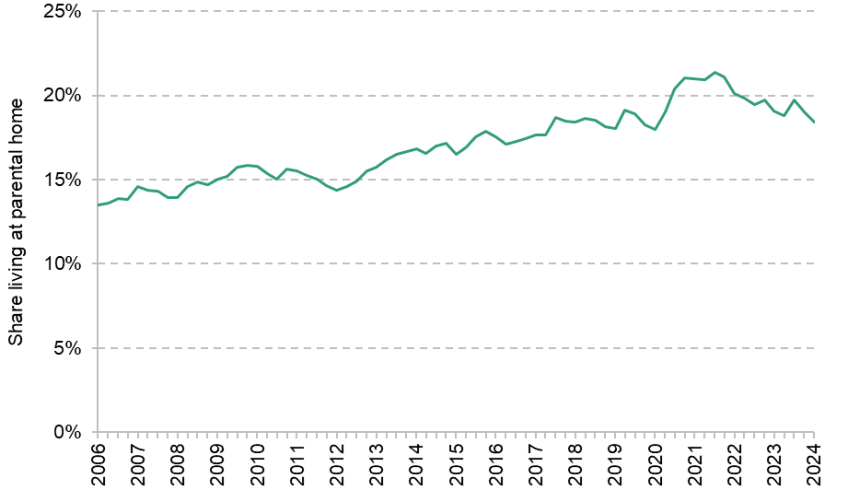
Source: Authors’ calculations using the Labour Force Survey.
This rise in the number of young people living at a parental home – or ‘co-residing’ – has been attributed to various factors.
Rising house prices and rents are likely to have made it more difficult to afford to live independently. The Office for National Statistics (ONS) noted that, in 2021, adults were more likely to be co-residing with their parents in areas where housing was less affordable, suggesting that high housing costs could be one factor behind the rising prevalence of co-residence (Office for National Statistics, 2023).
It has also been argued that delays in household formation may have caused a rise in the proportion of young adults who choose to live at a parental home. It may be easier, and more desirable, to live at a parental home if single and childless. The average age of first-time mothers has been increasing since 1970, for example, and the average age at first marriage is also rising over time (Office for National Statistics, 2024). These factors might make living at a parental home more appealing. Of course, causation might run in the other direction, with more young people living at a parental home resulting in delayed marriage and childbirth – or it might be that a common factor, such as rising house prices and rents, causes both more co-residence with parents and delayed marriage and parenthood.
In the US, an increasingly difficult labour market context for university graduates has been argued to be important in driving up rates of co-residence (Albanesi, Gihleb and Zhang, 2022). According to this argument, a decline in graduate job availability relative to the numbers of graduates in the US has meant co-residence has become more common, allowing graduates to attempt to ‘hold out’ for a better job rather than needing to accept a non-graduate job. The UK has seen an increase in the share of graduates in non-graduate jobs over the last three decades (Xu, 2023), so a similar dynamic could also have played out in the UK. Rising inequality in the US has also been highlighted as a reason for increasing levels of co-residence, with co-residence rising particularly strongly since 2000 among those with parents with lower levels of educational attainment (Floridi, 2024).
There is a range of ways in which co-residence could affect the outcomes of young adults. Among other things, co-residence could act as a form of insurance against labour market (or other) shocks. Research in the US found that the option to move back to a parental home insured young low-skilled workers who lost their job (Kaplan, 2010). The Office for National Statistics (2023) also found that those living at a parental home in the UK were more likely to be unemployed or providing care, implying that life events, whether in the lives of adult children or their parents, could precipitate a move back to a parental home. Living at a parental home could have important job-match effects, allowing young adults to spend more time unemployed or at lower-paying jobs searching for a higher-quality or better-fitting job (Albanesi, Gihleb and Zhang, 2022). It could also allow young adults to save, including for a house deposit, through paying no or heavily reduced rent, as well as saving on other household costs. Not all potential effects of co-residence are beneficial. Recent research found that young men in the US who lived at a parental home for a year in their late 20s experienced better labour market outcomes than those who did not co-reside with their parents. However, staying at a parental home for a longer period (four to six years) was associated with a reduced likelihood of securing full-time employment (Saydam and Raley, 2024).
Despite the significant numbers of young adults co-residing with their parents, the growth in this group in recent years and the potential scale and distribution of the implicit financial transfer being made from parents to children, relatively little is known about co-residence in the UK context. Using data from the Labour Force Survey, Understanding Society, and the Wealth and Assets Survey, we document levels and patterns of co-residence in the UK, provide estimates for the level of private rent that co-residers could be saving through living at a parental home, and quantify the role of co-residence in the accumulation of saving and the insurance of shocks.
In the next section, we characterise those young adults who are living at a parental home, and the parents of this group. In Section 3, we examine changes in the rate of co-residence over time. In Section 4, we describe the potential rent that those who co-reside might be saving. Section 5 concludes.
Data
In this report, we primarily use data from the Labour Force Survey (LFS) and the Wealth and Assets Survey (WAS). We also use some data from the English Longitudinal Study of Ageing (ELSA) and Understanding Society (USoc) in order to supplement and verify our main results.
The LFS is a cross-sectional household survey dataset from the ONS covering the United Kingdom, surveying individuals for five consecutive quarters. It has – for a survey – a particularly large sample size. Differential attrition problems from following the same individuals over time will be limited, since individuals are followed for only five quarters, and one-fifth of the sample is refreshed each quarter. We do not focus only on results from the LFS, since it does not capture wealth or income, which are related to co-residence. Especially importantly, the LFS does not measure private rental payments, which we use to estimate the potential savings from co-residence.
During the COVID-19 pandemic, the response rate to the LFS fell sharply, prompting concerns about the accuracy of estimates derived from the LFS. These concerns led the ONS to suspend publication of the LFS between October 2023 and February 2024. Although the LFS has since been reintroduced, it has not, as of December 2024, been redesignated a ‘National Statistic’ (Office for Statistics Regulation, 2024).
Despite this, we still believe that the LFS is a reliable source of data for our topic of interest. As shown in Figure 1, the rise in the share of 25- to 34-year-olds living with parents is apparent even before the pandemic: we see a rise from 13% to 18% between 2006 and 2019. Moreover, in Figure B5 of Appendix B, we show that rates of co-residence by age as measured in the LFS in 2023–24 track rates of co-residence by age in the 2021 Census closely for those aged 25 and older. These factors together increase our confidence in the robustness of our findings.
WAS is a longitudinal household survey dataset from the ONS covering Great Britain, following the same people over time, surveying them every two years. The most recent wave of the survey covers 2018–20. It has good detail on area of residence, individual and household wealth, the characteristics of housing and a range of household demographics.
This dataset has issues with differential sample attrition, which particularly affects the estimated proportion of co-resident individuals. This differential attrition is not fully accounted for by the survey weights available in WAS. This is an issue that affects other longitudinal datasets: we have confirmed that it is also present in Understanding Society. We highlight this here to provide information for interested researchers: Appendix B provides more detail on the differential sample attrition across different surveys and our approach to addressing this attrition in WAS. In brief, we reweight our data using the first observation of WAS refreshment samples (which are not affected by differential sample attrition) as a benchmark.
Throughout our report, we focus on just those co-residing aged between 25 and 34, in order largely to abstract from periods of university attendance.
We define an individual as co-residing with a parent if they or their cohabiting partner are living with a parent (biological, adopted, foster or step-parent). An individual is defined as the parent of a cohabiting child if they are living with a child (biological, adopted, foster or step-child). We use the relationship grids available in the LFS and WAS to construct an indicator for being or having a co-resident adult child aged between 25 and 34. Neither WAS nor the LFS collects information on whether an individual has children living outside of their household, but this information is available in Understanding Society, allowing us to illustrate the prevalence of co-residence when restricting to parents.
In Sections 2 and 3, where we provide evidence on the characteristics of co-residers, and show how co-residence has changed over time, we largely rely on the Labour Force Survey. In Section 4, where we characterise the rent that co-residers could be saving and the amount that is actually saved in practice, we largely use estimates from the Wealth and Assets Survey.
2. Who is co-residing?
In this section, we describe the characteristics of those aged 25–34 who co-reside with their parents, or with the parents of their cohabiting partner or spouse. We also describe the characteristics of those who are parents of co-residing young adults. We primarily rely on the Labour Force Survey to document the characteristics of co-residing young adults, as well as using Understanding Society to document characteristics of the parents of co-residing young adults and the Wealth and Assets Survey to document patterns by young adults’ and their parents’ wealth and income levels.
Age and gender
There is a steep gradient by age in the proportion of young adults co-residing with their parents. In 2023–24, 43% of 25-year-olds were living at a parental home, compared with 9% of 34-year-olds. Co-residing is also more common for young men than for young women at each year of age, as Figure 2 shows. At age 25, around 49% of men and 38% of women live with their parents. This falls to 5% of women and 12% of men by age 34, so at that age more than twice as many men as women are living with their parents. Overall, 23% of 25- to 34-year-old men and 15% of 25- to 34-year-old women were living at a parental home in 2023–24. This gender imbalance, with men more likely to co-reside, is common in an international context (Esteve and Reher, 2021).
Figure 2. Share of adults living at a parental home, by age and sex, 2023–24

Source: Authors’ calculations using the Labour Force Survey, 2023Q2 to 2024Q1.
Figure 3 shows the proportion of adults with at least one co-residing child aged 18–34, as well as the proportion of parents with a co-residing child aged 18–34.2 We can see that the proportion of adults with any co-residing adult child peaks in people’s early 50s: more than two-fifths of adults in their early to mid 50s have at least one co-residing adult child, and more than half of parents. This peak is, unsurprisingly, later and lower when looking at the proportion of adults with an older co-residing child, aged 25–34: around a fifth of adults in their late 50s and early 60s have at least one co-resident child aged 25–34.3
Figure 3. Shares of parents and of adults with at least one co-residing adult child who is aged (a) 18–34 and (b) 25–34, by year of age, 2017–20
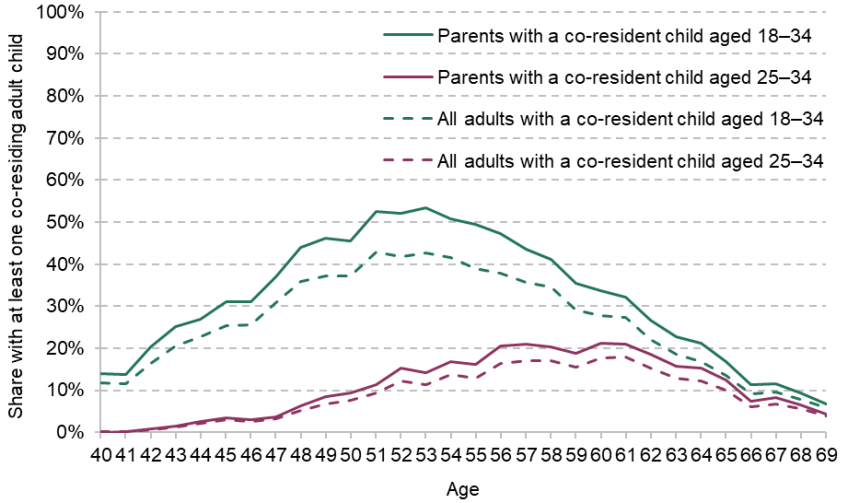
Source: Authors’ calculations using Understanding Society Waves 9 and 10 (2017–20).
Region
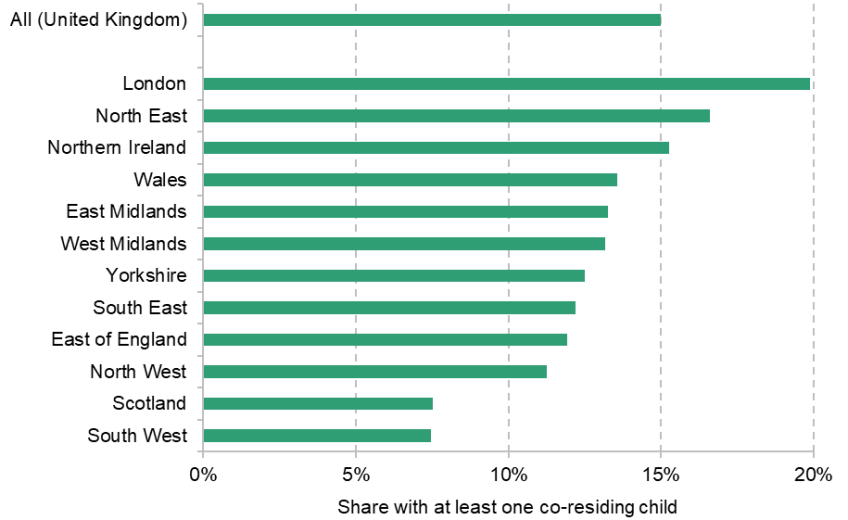
Figure 4 shows the proportion of 25- to 34-year-olds who were co-residing with a parent in 2023–24 by their current region of residence. Co-residing with a parent was most common in Northern Ireland, where 23% of 25- to 34-year-olds were co-residing in 2023–24, and least common in the North East of England, where the figure was 17%.
Figure 4. Share of 25- to 34-year-olds living at a parental home, by region, 2023–24

Source: Authors’ calculations using the Labour Force Survey, 2023Q2 to 2024Q1.
One fact that may be initially surprising is that regions with especially high house prices and rents – principally London and the South East – do not have particularly high rates of young people co-residing. However, the relationship between rates of co-residence and local house prices and rents is complex. For given economic opportunities in an area, higher rents and house prices would be expected to drive higher rates of co-residence (by driving some young people who would have lived independently to co-reside or move to a different region). However, an improvement in the desirability of an area (e.g. due to increased economic opportunities) could lead both to high rents and house prices and to a greater movement of young people into the area, pushing down co-residence rates. This second mechanism is likely to explain, at least partly, the fact that London does not have an especially high co-residence rate despite high housing costs. Around a quarter of graduates who, by age 27, have moved from the Travel to Work Area in which they lived as a teenager, have moved to London (Britton et al., 2021).
Figure 5 shows the share of adults aged 50–69 who have a co-resident child aged 25–34 as measured in Understanding Society.4 We find that using adults’ current region of residence or their region of residence when their child was at a younger age gives similar patterns, meaning that the patterns in Figure 5 broadly approximate the rates of co-residence among young adults who grew up in each region. London stands out in having a relatively high proportion of adults in their 50s and 60s co-residing with a child aged 25–34. This reinforces the hypothesis that rates of co-residence among those whose parents live in London are relatively high, but that rates of co-residence among all young people resident in London are pushed down by the movement of young people to London (who, having done so, cannot live with their parents unless their parents have also relocated). Co-residence in London could be particularly important because rents there are significantly higher than in the rest of the country.
Figure 5. Share of 50- to 69-year-olds with a co-resident child aged 25–34, by region, 2017–20
Note: Proportions differ across datasets, as charted in Appendix Figure B7, but patterns are broadly similar.
Source: Authors’ calculations using Understanding Society Waves 9 and 10 (2017–20).
Ethnicity
Co-residence rates vary substantially across ethnic groups. Figure 6 illustrates the proportions of 25- to 34-year-olds from each ethnic group who co-reside with a parent. Those from Bangladeshi backgrounds are the most likely to be living at a parental home, with 41% of this group co-residing. Those from mixed or multiple ethnic groups, and from Black, Pakistani, Indian and White backgrounds, are also particularly likely to be co-residing. Among White 25- to 34-year-olds, 19% co-reside with their parents. Co-residence is least likely among those from Chinese backgrounds – only 8% of Chinese 25- to 34-year-olds live at a parental home.
Figure 6. Share of 25- to 34-year-olds living at a parental home, by ethnic group, among everyone and among only those born in the UK, 2023–24
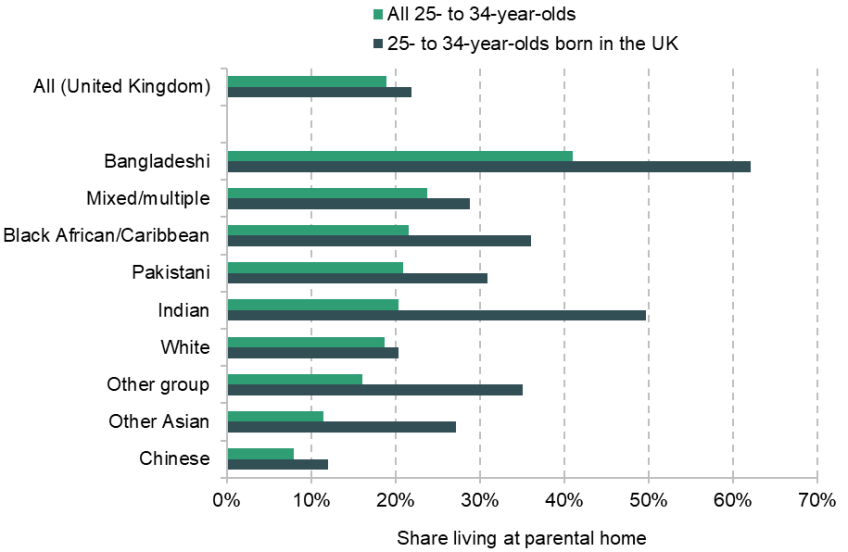
Source: Authors’ calculations using the Labour Force Survey, 2023Q2 to 2024Q1.
Ethnicity is correlated with immigration status, which itself is likely to affect individuals’ propensity to co-reside with parents. Looking at the rates of co-residence among only those born in the UK tells us something more about the proportion of people by ethnic group who both have the option to live at a parental home in the UK and who take this option.
As shown in Figure 6, when looking only at those born in the UK, rates of co-residence are substantially higher. They increase particularly among Bangladeshi and Indian 25- to 34-year-olds. Around half of Indian 25- to 34-year-olds born in the UK live at a parental home and almost two-thirds of Bangladeshi 25- to 34-year-olds born in the UK live at a parental home.
While these differences by ethnic group are important in and of themselves, we also explore the extent to which they can be explained by the different age, income, wealth, health and regional distributions within different ethnic groups. Figure 7 presents the difference in the co-residence rate for each minority ethnic group compared with White people, first showing raw differences, then the differences when controlling for age, sex and whether individuals were born in the UK, then when additionally controlling for marital status, economic activity, an indicator for reporting health problems, and current region of residence.
Figure 7. Average marginal effects of ethnicity on the probability of co-residing for 25- to 34-year-olds, compared with the probability of co-residing among White 25- to 34-year-olds

Note: Average marginal effects from three probit regressions are shown. The effect of being in given ethnic groups is compared with being White. Error bars represent 95% confidence intervals.
Source: Authors’ calculations using the Labour Force Survey, 2023Q2 to 2024Q1.
The raw differences replicate the gaps between groups we see in Figure 6. We can see that Bangladeshi 25- to 34-year-olds are statistically significantly more likely to live at a parental home than those who are White and that Chinese or other Asian 25- to 34-year-olds are statistically significantly less likely to live at a parental home.
Differences in age, sex and whether the individual was born in the UK can explain the lower observed rate of co-residence among Chinese young people. Once these factors are taken into account, the rate of co-residence looks lowest among White young people compared with all other ethnic groups (except Chinese). This is driven by those from other ethnic groups being more likely to have been born outside the UK, which would be expected to drive a lower co-residence rate than is observed.
When we additionally take marital status, economic activity, current region of residence and health status into account, the unexplained difference compared with the White group is lower for Black, mixed, other Asian, Bangladeshi and Indian groups. These changes are largely driven by the lower proportion of these groups who cohabit with a partner, conditional on other characteristics, coupled with the fact that cohabiting with a partner is negatively associated with co-residing with parents.5 Ultimately, for Black, Bangladeshi, Pakistani and Indian groups, all the factors we control for do not explain the higher rates of co-residence among these groups compared with White young people.
These differences point to important differences in family support across ethnic groups and are useful background for our discussion of the potential transfer value of co-residence. Of course, family support can run in both directions and provision of support through co-residence may also have negative consequences, such as restricting movements to areas with job opportunities.
Housing tenure
Figure 8 shows the composition of household-level housing tenure among 25- to 34-year-olds who are and are not co-resident. Housing tenure here refers to the tenure status of the house in which individuals are currently living, and so for co-resident 25- to 34-year-olds will tend to be determined by whether their parent rents or owns the property and whether those parents have a mortgage. As shown, a larger proportion of 25- to 34-year-olds who are co-resident live in houses that are owned or mortgaged: this represents the tenure type of 65% of those who are co-resident and 47% of those who are not. A larger proportion also live in social housing: 25% of those who are co-resident, compared with 14% of those who are not.6 In contrast, those not co-resident are significantly more likely to be living in private rented accommodation (36%, compared with 9% of those who are co-resident).
Figure 8. Share of 25- to 34-year-olds living in different household-level tenure types, by whether co-resident, 2023–24

Source: Authors’ calculations using the Labour Force Survey, 2023Q2 to 2024Q1.
Life-cycle factors
Co-residence interacts with other milestone events in the life cycle for young adults. Around two-fifths (42%) of 25- to 34-year-olds who do not live with a partner are co-resident with their parents, compared with just 3% of those who are cohabiting with a partner and 4% of those who are married. This is consistent with the idea that co-residence has important interactions with household formation. A higher proportion of unemployed young adults are co-residing: 32% of 25- to 34-year-olds who are unemployed are co-resident with parents, and a further 25% of those who are economically inactive – that is, not in paid work and not seeking work – are co-resident, compared with 18% of those who are employed. This points to co-residence providing the sort of insurance role examined by Kaplan (2010).
Income and wealth
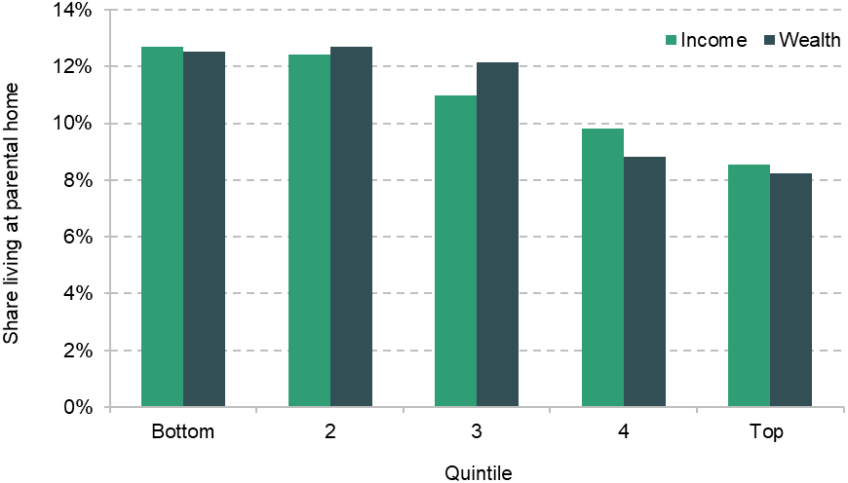
Figure 9 shows the rates of co-residence by ‘benefit-unit’ income and wealth quintiles among 25- to 34-year-olds, using the Wealth and Assets Survey. A benefit unit is defined as an individual and their partner plus any dependent children, implying that a co-resident child is in a separate benefit unit from their parent. The graph shows that those with lower income and lower wealth are more likely to be living at a parental home, pointing to co-residence acting as a form of within-family insurance of financial shocks, or being a choice for those with lower lifetime income.
Figure 9. Share of 25- to 34-year-olds living at a parental home, by benefit-unit income and wealth quintiles

Note: Quintiles are here defined within each five-year age group. Here a ‘benefit unit’ is an individual and their partner, along with any dependent children.
Source: Authors’ calculations using the Wealth and Assets Survey, Round 7 (2018–20).
The gradient is particularly strong in the case of income: almost half of 25- to 34-year-olds in the bottom benefit-unit income quintile are living at a parental home, compared with around 2% of those in the top income quintile. This pattern is very different from that observed when looking at direct financial transfers. We know that the share of people in their 20s and early 30s receiving a direct transfer over an eight-year period increases with income, rising from 13% in the lowest-income fifth to 54% in the highest-income fifth (Boileau and Sturrock, 2023a). The relationship between wealth and co-residence is less clear at the bottom of the wealth distribution, but from the second to fifth deciles of the wealth distribution the probability of co-residing drops significantly: 30% of those in the second quintile of the wealth distribution co-reside, compared with 5% of those in the top quintile.
All the factors examined in this section are interrelated. We can examine the ‘effect’ of all factors together using a probit regression specification to control for the roles explained by different characteristics simultaneously. Unsurprisingly, age retains its significant association with the probability of co-residing, with older 25- to 34-year-olds less likely to be co-residing than younger ones, all else equal. Men are statistically significantly more likely to be co-residing than women, and those who are not living with a partner are statistically significantly more likely to be living at a parent’s home than those who are married. Young adults in the lowest income quintile are more likely to co-reside, all else equal, with being in the lowest income quintile being associated with a 10.4 percentage point (ppt) higher probability of co-residing compared with being in the middle income quintile. When controlling for other factors, young adults in the bottom wealth quintile are less likely to co-reside with parents. Being in the lowest wealth quintile as a young adult is associated with an 8.2ppt lower probability of co-residing with parents compared with being in the middle quintile, a stronger difference than seen in the raw data in Figure 9. For both income and wealth, we do not see statistically significant associations between being at higher points in the distribution compared with the middle income quintile and the probability of co-residing. After controlling for other factors, the observed regional differences in co-residence are not generally statistically significant but, as was shown in Figure 7, ethnicity remains strongly related to co-residence.
Figure 10 shows the relationship between the benefit-unit wealth and income of 50- to 69-year-olds and the probability of having a co-resident child aged 25–34.7 Slightly more of those at the bottom of the wealth and income distributions have co-resident children, but this is much less marked than the gradient we see when looking at the income of co-resident children themselves. 13% of those in the bottom quintile of the income distribution have a co-resident child, compared with 9% of those in the top quintile. The pattern is similar in the case of wealth, with a drop from 13% of those in the bottom quintile of the wealth distribution to 8% in the top decile.
Figure 10. Share of 50- to 69-year-olds with a co-residing adult child aged 25–34, by benefit-unit income and wealth quintiles
Note: Quintiles are here defined within each five-year age group of the parent. Here a ‘benefit unit’ is an individual and their partner, along with any dependent children.
Source: Authors’ calculations using the Wealth and Assets Survey, Round 7 (2018–20).
When thought of as a transfer from parents to children, in the sense of allowing children to avoid paying private rent, the patterns of having a co-residing adult child by wealth look very different from those observed for direct financial transfers. We know that around 15% of those in the highest wealth quintile had made a transfer of some sort – whether gift or loan – to their children in the last two years in 2018–20, compared with less than 5% of those in the lowest wealth quintile (Boileau and Sturrock, 2023b). In contrast, those in the lowest wealth quintile are more likely to have a co-residing child.
With this picture of those who co-reside (and parent co-resident children) in mind, we move on to the next section, where we examine how these characteristics have changed over time.
3. How has co-residence changed over time?
The rate of co-residence has increased over time, with the proportion of 25- to 34-year-olds co-residing with a parent increasing from 13% to 18% between 2006 and 2024. The drivers of this change can be decomposed into two channels:
Changes in the composition of the population of 25- to 34-year-olds. For example, over time, an increasing share of this group hold a university degree. If those with a degree are less likely to co-reside than those without a degree, this would result in a change in the overall rate of co-residence among this group.
Changes in the probability of 25- to 34-year-olds with certain characteristics co-residing. For example, young people with a university degree could be becoming more or less likely to co-reside with their parents over time.
We provide evidence on each of these channels in turn.
Changes in the composition of 25- to 34-year-olds
We quantify the role of the changing composition of 25- to 34-year-olds by estimating the relationships between characteristics and the probability of co-residing in 2006 and using these relationships, combined with the changing composition of the group, to predict the evolution of the rate of co-residence after 2006.
We first use a set of characteristics – age, sex, educational status, ethnicity and an indicator for being born outside the UK – that could be described as ‘predetermined’: that is, where the characteristic itself is unlikely to be influenced by co-residence. We then look at the extent to which the changing age and sex structure, educational status, and ethnic and migrant composition of 25- to 34-year-olds alone can explain the change in the overall rate of co-residence since 2006. Appendix Table A1 lists the characteristics we include in more detail.
Figure 11 shows the results from this exercise: the green line is the observed rate of co-residence and the purple line is the predicted rate resulting from changes in the age, sex, educational, ethnic and migrant composition of 25- to 34-year-olds over this period alone. This changing composition cannot explain the rise in co-residence we see: it would in fact have been expected to result in a decline of 1.4 percentage points in the rate of co-residence after 2006, as shown in the figure, from 13.5% in the first quarter of 2006 to 12.1% in the first quarter of 2024.
Figure 11. Share of 25- to 34-year-olds living at a parental home between 2006 and 2024: comparing out-turn and predictions from changing composition
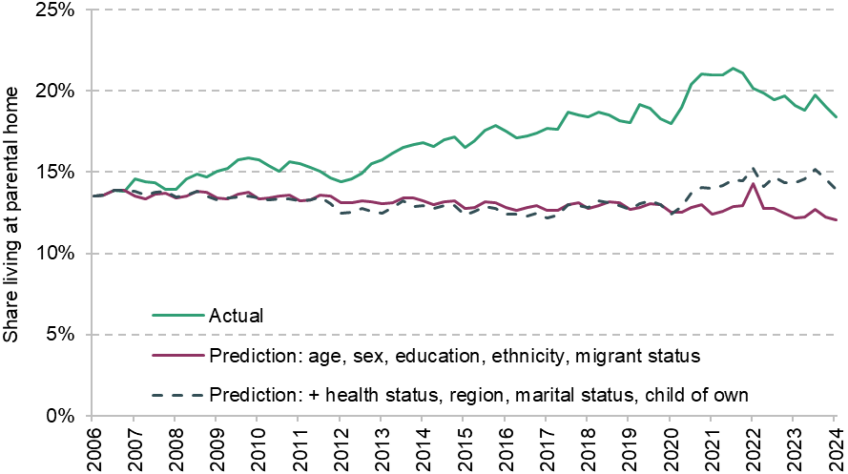
Note: Prediction lines are constructed using regression of a dummy for co-residing on the variables described in Table A1 in 2006. These estimated relationships are then used to predict rates of co-residence over time, with changes resulting solely from changes in the proportion of 25- to 34-year-olds with these characteristics.
Source: Authors’ calculations using the Labour Force Survey, 2006Q1 to 2024Q1.
Just over half of this predicted decline is the result of a sharp increase in the share of 25- to 34-year-olds with a degree, from 28% in the first quarter of 2006 to 50% in the first quarter of 2024,8 combined with the fact that having a degree is negatively associated with co-residence. Having a degree, conditional on age, sex, migrant status and ethnicity, was associated with a 3.5ppt lower rate of co-residing in 2006. The 22.5ppt increase in the share of people with a degree between 2006 and 2024 thus contributed 54% to the overall predicted decline in the rate of co-residence.
In contrast, while there were some changes in the composition of 25- to 34-year-olds by ethnicity and whether born in the UK, these contributed less to the overall change in the predicted rate of co-residence, since they were smaller. The share of 25- to 34-year-olds who were White and born in the UK fell by 8.9ppt over this period, from 78% to 69%, and the proportion of 25- to 34-year-olds born outside the UK increased by 6.4ppt overall, from 18% to 24% (with increases concentrated among those who were White, Indian and Black Caribbean/African). There were small increases in the proportions of those from all other ethnic groups (apart from those who were Indian) born in the UK. Overall, these changes explain around 16% of the predicted decline in the rate of co-residence, driven by the increase in the proportion of people born outside the UK.
The average age of the 25- to 34-year-old group has increased slightly over time, with a 2.1ppt decline in the proportion of this group aged 25 and a 1.0ppt decline in the proportion of this group aged 26. This change, combined with the steep age gradient in co-residence, explains around 27% of the predicted decline in co-residence. Changes in the composition of 25- to 34-year-olds in terms of sex explain the remaining decline, with a very small increase in the proportion who are female and the fact that being female is associated with a lower rate of co-residing.
Changes in the composition of 25- to 34-year-olds, in terms of age, sex, ethnicity, migrant status, and educational attainment, therefore cannot explain the rise in co-residence we see, with changes in all these characteristics in fact expected to drive a decline in co-residence. Instead, it is changes in the propensity to co-reside conditional on these characteristics that must explain the rise we see.
We can think about a broader range of characteristics that might help to explain co-residence. We include current region of residence, marital status, having a child of their own, and experiencing health problems expected to last for a year or more, along with the factors described above, in a second specification (with all factors listed in Table A1). These new factors are likely to be jointly determined with co-residence: while being married may make an individual less likely to co-reside, for example, it may also be the case that co-residing makes marriage less likely. We show an upper bound for how much these factors can explain of the change in co-residence, assuming causality only works in one direction (from each factor to the probability of co-residence). Figure 11 shows results from this exercise as the dashed line. This specification is associated with the rate of co-residence slightly increasing, by 0.5ppt. The observed 4.9ppt increase in co-residence is largely left unexplained.
There has been very little change in the distribution of young people across regions between 2006 and 2024. The largest change in a single region was a 0.7ppt decline in the proportion living in London. This change contributes essentially nothing to the change in co-residence predicted overall, as shown in Figure 12.
Figure 12. Contribution of the changing composition of 25- to 34-year-olds to the change in the rate of co-residence between 2006 and 2024
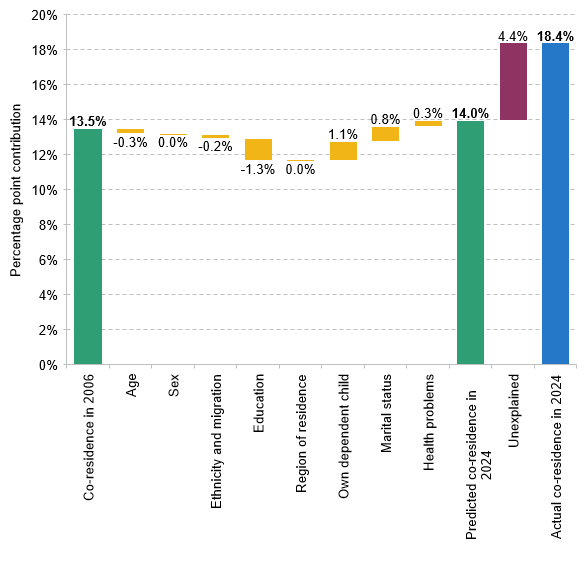
Note: Regression specifications as described in Table A1.
Source: Authors’ calculations using the Labour Force Survey, 2006Q1 to 2024Q1.
There has been a large change in the share of young people with a dependent child. This has fallen from 45% of 25- to 34-year-olds in 2006 to 33% of 25- to 34-year-olds in 2024. Having a co-resident child is associated with a 9.6ppt lower rate of co-residing, conditional on the other factors included in our specification. This means the decline in the proportion of young people with a child of their own would have been expected to drive a 1.1ppt rise in co-residence.
We also see large changes in the proportions of young people with different marital statuses over this period. The share of young people who are not living with a partner has risen 5.7ppt over this period and the share cohabiting has risen 6.7ppt. Meanwhile, the share who are married has fallen by 10.0ppt and the share divorced, widowed or separated has fallen by 2.4ppt (from 4% to 2%). Marital status was strongly associated with the probability of co-residing in 2006: those who are married were 23.7ppt less likely to be co-residing in 2006 than those who are not living with a partner, and those cohabiting were 29.4ppt less likely to be co-residing. Overall, then, these changes alone would have led to an increase in the rate of co-residence of 0.8ppt.
Finally, there has been a substantial 13.2 percentage point rise in the share of 25- to 34-year-olds experiencing a health problem that has lasted, or is expected to last, for a year or more, from 17% to 31%. Experiencing a health problem was associated with a 2.4ppt lower probability of co-residing in 2006, implying that this increase would have led to a 0.3ppt rise in the rate of co-residence.
Figure 12 summarises the contribution of each factor to the predicted and observed changes in co-residence between 2006 and 2024. Together, changes in marital status, the presence of children and the prevalence of health problems would have been expected to drive a rise in rates of co-residence, expected to offset the modest falls predicted by the changes in the age, ethnicity and educational composition of the group of 25- to 34-year-olds. Overall, the rise in co-residence over this period is largely unexplained by changes in the composition of young people along the dimensions we examine here.
Changes in co-residence by different characteristics
Rather than changes in the composition of young people’s characteristics, changes in the probability of young people with certain characteristics co-residing are likely to have been the important factor in driving the increase in co-residence since 2006. To investigate this, we again use the regression specifications defined above. We compare the rate of co-residence by various characteristics in 2023–24 with three relevant comparators:
The rate of co-residence by these characteristics in 2006–07. This shows how co-residence has in fact changed by various characteristics over this period. Within each of the characteristics, there are likely to have been compositional changes: for example, the ethnic composition of 25-year-olds may have been different in 2006–07 and 2023–24. We would like to strip out these compositional changes and look only at the change in the probability of co-residing for similar-looking people.
The predicted rate of co-residence by these characteristics using our first regression specification. This accounts for compositional changes in terms of age, sex, ethnicity, being born outside the UK and educational achievement. However, arguably these do not capture all relevant compositional changes that have affected this group.
The predicted rate of co-residence by these characteristics using our second regression specification. This accounts for a wider range of compositional changes – including marital status, having a child, health status and current region of residence – but, as discussed above, may overstate the role of compositional change.
Figure 13 shows that the rise in co-residence was driven by those in their mid to late 20s rather than those at older ages. The proportion of 25-year-olds living at a parental home has risen by 14ppt, from 29% in 2006–07 to 43% in 2023–24, and the overall share of those in their late 20s living with parents has risen from 20% to 28%. In contrast, the rate of co-residence after age 30 has changed very little. Accounting for the changing composition of 25- to 34-year-olds in terms of sex, ethnicity and migrant status, and educational achievement (‘2023–24: prediction 1’) makes almost no difference.
Figure 13. Share of 25- to 34-year-olds living at a parental home, by age, 2006–07 and 2023–24
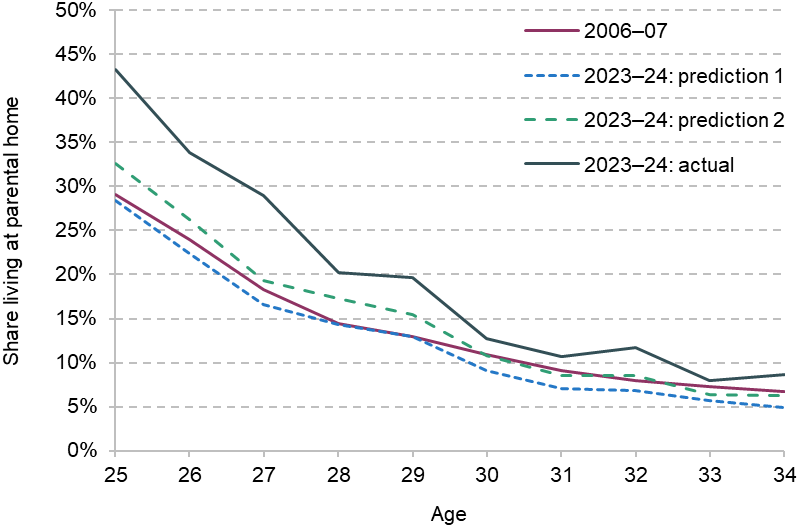
Note: Prediction lines are constructed using regression of a dummy for co-residing on the variables described in Table A1 in 2006. These estimated relationships are then used to predict rates of co-residence by year of age in 2023–24, with changes resulting solely from changes in the proportion of 25- to 34-year-olds with these characteristics.
Source: Authors’ calculations using the Labour Force Survey, 2006–07 and 2023–24.
When we additionally account for the changing composition in terms of marital status, living with a dependent child, health status and region of residence (‘2023–24: prediction 2’), the increase at younger ages looks slightly less stark, but still cannot explain the majority of the difference we see. The proportion of 25-year-olds living at a parental home is 11ppt higher than its predicted level when accounting for these compositional changes, implying that changing composition in terms of these characteristics can account for around a quarter of the change we see at this age at most. At older ages, the increase in co-residence we see is essentially unchanged by accounting for these compositional changes.
The rate of co-residence has increased within most, but not all, ethnic groups. Figure 14 shows how the rate of co-residence by ethnicity has changed between 2006–07 and 2023–24. The proportion of White 25- to 34-year-olds living at a parental home increased by 5.5 percentage points, from 13% in 2006–07 to 19% in 2023–24. This increase drives the overall increase in co-residence, since White individuals made up around 80% of this age group in 2023–24. The largest percentage-point increase in the rate of co-residence was among Bangladeshi 25- to 34-year-olds, for whom the rate of co-residence was 28% in 2006–07 and 41% in 2023–24. There were also marked rises in the Black and mixed ethnic groups, and a smaller 3ppt increase in the proportion of Chinese 25- to 34-year-olds co-residing. In contrast, there were declines of around 8 and 6 percentage points in the rate of co-residence for Indian and Pakistani 25- to 34-year-olds respectively over this period.
Figure 14. Share of 25- to 34-year-olds living at a parental home, by ethnic group, 2006–07 and 2023–24

Note: Prediction lines are constructed using regression of a dummy for co-residing on the variables described in Table A1 in 2006. These estimated relationships are then used to predict rates of co-residence by ethnic group in 2023–24, with changes resulting solely from changes in the proportion of 25- to 34-year-olds with these characteristics.
Source: Authors’ calculations using the Labour Force Survey, 2006–07 and 2023–24.
The changing age structure, sex composition, migration patterns and educational attainment within ethnic groups would have been expected to drive a fall in co-residence within all groups between 2006–07 and 2023–24 (‘2023-24: prediction 1’). These falls would have been particularly large among Indian, Pakistani and Bangladeshi young people. Accounting for these changes could help to explain the fall in the rate of co-residence observed for Pakistani and Indian young people but does not contribute to explaining the rise observed for all other groups.
Accounting for the changing marital and parental status, health status and region of residence within each group (‘2023–24: prediction 2’) implies that the rate of co-residence would have risen among White, mixed, Bangladeshi and ‘other’ Asian (not Chinese, Indian, Bangladeshi or Pakistani) groups if all that drove changes in co-residence were these compositional changes. Among all but the other Asian group, this predicted rise is smaller than the actual rise, implying that there is still a role for other factors in explaining the change. The large rise in co-residence among Bangladeshi young people remains largely unexplained by these factors. The increased rates of co-residence among Chinese and Black young people are particularly hard to account for in terms of these compositional changes – for both groups, if all that had changed between 2006–07 and 2023–24 were these compositional changes, a decline in co-residence would be predicted, whereas we have observed a rise in co-residence within each group.
Figure 15 shows that in all regions, the proportion of 25- to 34-year-olds co-residing increased between 2006–07 and 2023–24. The increase was especially large in the East of England (7.8ppt), the South West (6.8ppt) and the North West (6.2ppt), and especially small in the West Midlands (0.3ppt), the North East (2.2ppt) and Northern Ireland (2.2ppt).
Figure 15. Share of 25- to 34-year-olds living at a parental home, by region, 2006–07 and 2023–24
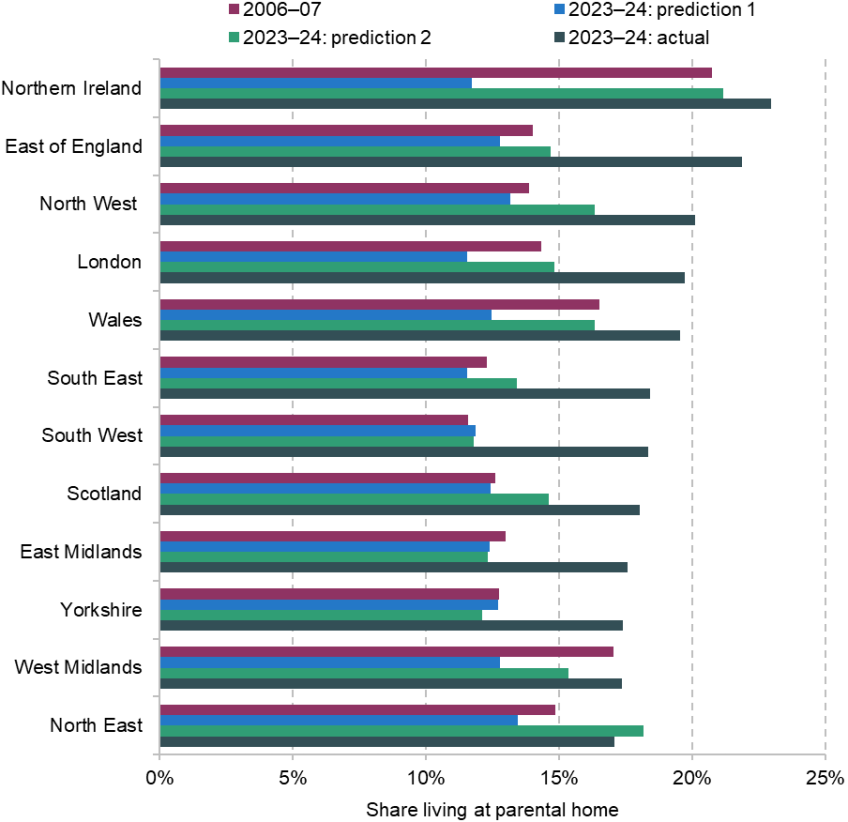
Note: Prediction lines are constructed using regression of a dummy for co-residing on the variables described in Table A1 in 2006. These estimated relationships are then used to predict rates of co-residence by region in 2023–24, with changes resulting solely from changes in the proportion of 25- to 34-year-olds with these characteristics.
Source: Authors’ calculations using the Labour Force Survey, 2006–07 and 2023–24.
Accounting for the changing composition of 25- to 34-year-olds in terms of age, sex, ethnicity, migration and education explains little of the rise in most regions, and indeed would have been expected to lead to falls in co-residence in all areas apart from the South West (particularly substantively in Northern Ireland, the West Midlands and Wales, where the age composition of this group has shifted to older ages more than elsewhere). Accounting additionally for the changing marital, health and parental status of young people in each region, we would have expected to see rises in the rate of co-residence in most areas apart from Yorkshire, the East and West Midlands, and Wales. We observe a higher rate of co-residence in 2023–24 than predicted using these compositional changes in all regions apart from the North East. This difference was especially dramatic in the East of England (7.2ppt), the South West (6.5ppt) and Yorkshire and the East Midlands (both 5.3ppt).
4. What value could co-residence be providing?
In this section, we quantify the potential financial value that people who co-reside could be deriving from living at a parental home. We consider the amount of rent that could be described as being ‘transferred’ from their parents, in the sense that co-residers may not have to pay full private market rents when living at a parental home. We then examine how much young adults who co-reside with their parents are adding to their savings, compared with others who have similar characteristics and income but are not co-residing. We here use the Wealth and Assets Survey for analysis, since this has detail on the private rent paid by households and on individuals’ savings.
Savings in private rent
We first consider the amount that those who co-reside might be paying in private rent under other circumstances. This saving could be seen as a financial transfer from parents to adult children (unless the parents are charging them rent). In order to estimate the private rent that those who live at a parental home might be being transferred, we build two regression models to get at the relationship between various factors and per-person rent paid in the private rental sector.
We refer to the first model as a personal model. This specification aims to capture what those who are living at a parental home might expect to pay if they moved out, based on what people similar to them who are private renting are paying. It assumes that if co-residers moved out, they would privately rent in the same region as they are currently living in. Taking a sample of individuals aged 25–34 living in private rented accommodation in 2018–20, we regress the log of per-person rent (i.e. rent paid for the whole property divided by the number of residents) on single year of age indicators, ethnic group, ‘benefit unit’ wealth and income deciles, marital status, education, indicators for region of residence, and economic activity. We then use the estimated relationships between these variables and rent to predict the rent that co-residers might pay if they moved into private rented accommodation.
We refer to the second model as a property model. This specification aims to capture what those who are living at a parental home might expect to pay if paying to live in a property like the one they are currently living in. Taking a sample of all individuals in privately rented accommodation in 2018–20, we regress the log of per-person rent on region, the number of bedrooms in the property interacted with the number of people in the property, the type of accommodation (e.g. detached, semi-detached) and the average property price in the individual’s local authority. Similarly, we then use the estimated relationships between these variables and rent to predict what co-residers would pay to rent the accommodation they are co-residing in (if the rent was equally shared with the same number of people they live with). Appendix Table A2 lists the characteristics we include in more detail.
We are here approximating the potential transfer from rent saved as a result of the decision to co-reside: we make some assumptions which are unlikely to hold perfectly in practice. In our personal model, we are assuming that the alternative housing tenure choice for all those who co-reside would be private renting within the same region. Some of those who co-reside would, if the opportunity to co-reside was not available, instead move into social housing or their own homeownership. Some would move between regions.
We think that private renting in the same region is the best alternative to co-residing at a parental home to model for various reasons. It is relatively difficult to move into social housing as a young person, particularly without a dependent child of one’s own (having a child is much less common among co-residers than it is among non-co-residing 25- to 34-year-olds in social housing: 61% of non-co-residing 25- to 34-year-olds in social housing have a dependent child of their own, compared with just 6% of co-residing 25- to 34-year-olds overall). Even among those who would in fact move into social housing if not co-residing, the amount they are implicitly being transferred in private rent is still of interest: in social housing, they could still be described as receiving a transfer in relation to this benchmark, but this would be being made by the government rather than by their parents. Movement into homeownership is not a likely alternative given that co-residence is most common among those in the lower quintiles of the wealth distribution. Our assumption that young people would stay in the same region if private renting, while imperfect, is supported by the fact that most people stay in the region in which they grew up (Britton et al., 2021).
When interpreting our estimated rent figures as amounts ‘transferred’ by co-residing, we assume that those who currently co-reside are not paying rent to their parents. Some of those living at a parental home will be paying rent to their parents, but there is limited evidence on this from survey datasets because generally rental payments are elicited at the household level where the property as a whole is rented.9 In a study of University of Southampton graduates, Sage, Evandrou and Falkingham (2013) find that just a third of students who returned to a parental home after completing their studies made any financial contribution to any household costs and that 97% either made no contribution to rent or made a reduced contribution. In a qualitative study of UK co-resident graduates, West et al. (2017) found that in most cases where graduates returned to a parental home there was no expectation that they contributed financially. This evidence helps to justify our assumption, although our calculations will inevitably be an upper bound on rent saved.
While an upper bound on rent avoided, our estimates will not be an upper bound on the total savings that could be made through co-residence. Those living at a parental home might not contribute to household bills and might benefit from economies of scale on expenses such as food (at least compared with an alternative where they live alone). These are beyond the scope of this report but are important considerations when interpreting our findings.
Overall, the transfer we estimate is around £360 per month (in November 2024 prices) based on property characteristics and £560 per month based on personal characteristics. The transfer based on personal characteristics is higher, implying that those who are co-residing are typically in accommodation that would fetch less on the private rental market than a typical private renter who is similar to that person pays in rent. We can use housing characteristics elicited in the Wealth and Assets Survey to document aspects of this. In particular, the average number of bedrooms per ‘benefit unit’ (couple with any dependent children) for those who are co-resident is lower. Those who are not co-resident have 2.0 bedrooms per benefit unit on average, while those who are co-resident have 1.3 bedrooms per benefit unit. Co-residers are thus living in more densely occupied environments.
Figure 16 shows how mean predicted private rents vary by the region in which co-residers are living. The transfer implied by the personal regression is higher throughout. London stands out, with 25- to 34-year-olds co-residing there receiving far larger implicit transfers than those co-residing in other areas. The transfer implied by the personal regression is around £1,000 a month in London, compared with around £600 in the next-highest-saving region, the East of England. Savings are lowest in the North East and Wales, where savings implied by the personal regressions are around £340 a month. This coincides with patterns of direct financial transfers received: we know that those in London and the South East are more likely to receive direct financial transfers than those in the North East (Boileau and Sturrock, 2023a).
Figure 16. Mean predicted monthly private rents that would be paid by 25- to 34-year-old co-residers, based on (a) personal and (b) property characteristics, by region
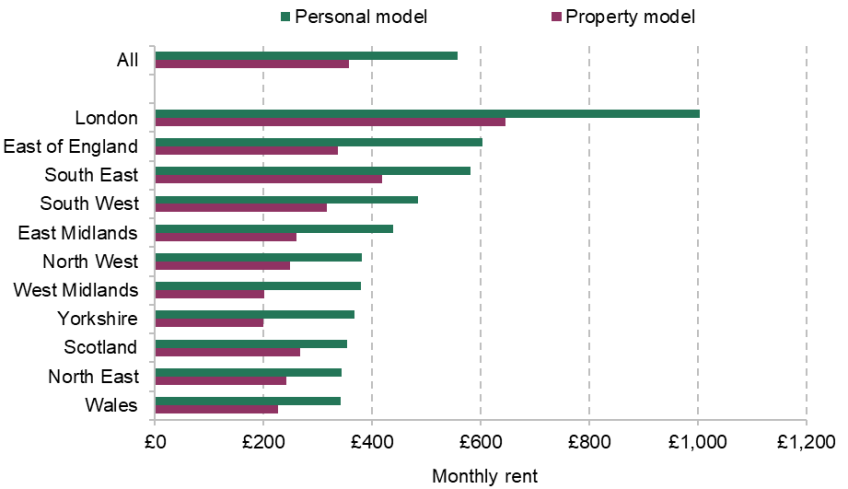
Note: Regression specifications are as described in Table A2.
Source: Authors’ calculations using the Wealth and Assets Survey, Round 7, 2018–20.
Figure 17 shows the patterns we see by co-residers’ age and education levels. There is an increase in implicit transfers by age when looking at the property regressions – those living at a parental home at older ages are living in locations that would fetch more on the private rental market – but there is no clear pattern for the personal-level characteristics.
Figure 17. Mean predicted monthly private rents that would be paid by 25- to 34-year-old co-residers, based on (a) personal and (b) property characteristics, by age and education
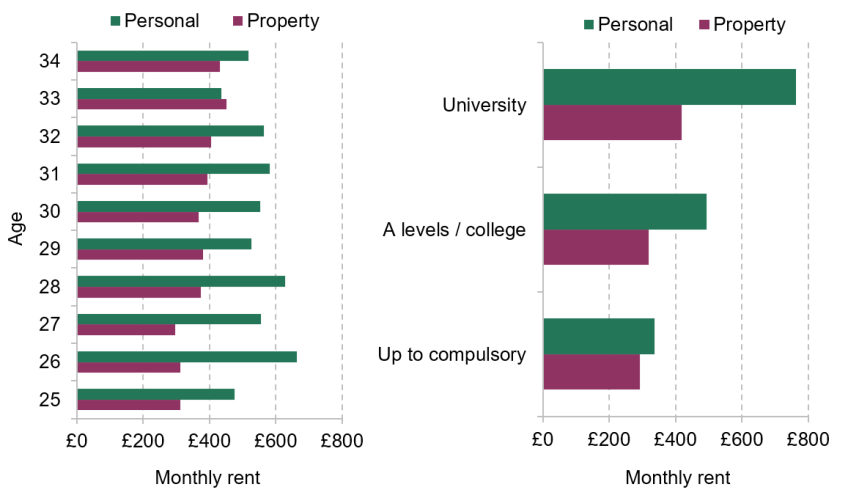
Note: Regression specifications are as described in Table A2.
Source: Authors’ calculations using the Wealth and Assets Survey, Round 7, 2018–20.
We see stronger patterns in rent transferred by co-residers’ educational level. Estimated monthly transfers based on the property model are around £420 for those who went to university, compared with £290 for those who only attended up to compulsory levels of education. The gradient is stronger when using the personal model, with university graduates receiving estimated transfers of around £760 compared with £340 for those with up to compulsory levels of education.
We do not see a strong pattern in the amount of rent implicitly transferred by income or wealth decile of young people, in either our personal or property model regressions. These estimated patterns are among co-residers and, as we have shown among all 25- to 34-year-olds, the probability of co-residing is higher at lower points in the income and wealth distributions. This implies that the transfer in aggregate to those at lower points in both distributions is much larger in cash terms, and larger still as a share of income or wealth.
Estimated transfers based on the personal regression are around £520 a month for co-residers in the bottom quintile of the income distribution and £540 a month for those in the top quintile. Figure 9 showed that 47% of those in the bottom income quintile are co-residing, compared with 2% of those at the top. This implies unconditional transfers of around £240 a month for 25- to 34-year-olds in the lowest quintile and just £10 a month for those at the top. The difference in rates of co-residence is less strong for wealth, but we estimate unconditional transfers of £140 a month based on the personal regression in the highest quintile of the wealth distribution and £30 a month in the bottom quintile. These patterns are the opposite of what we see when looking at the pattern of direct financial transfers by wealth and income deciles (Boileau and Sturrock, 2023b).
Saving
We can also look at the extent to which those who live at a parental home do indeed appear to be saving, rather than spending, any transfer they are receiving through paying reduced rent. This also helps to get at the extent to which parents are in fact charging their children rent, which would mean the savings children can make are lower than those predicted above.
To examine this, we look at those aged 25–34 who are observed either co-residing or private renting in one wave of WAS, and who are in the same situation in the next wave of WAS. We can see their financial wealth in both waves, as well as their income, their debts, and other variables such as their education level.
We calculate the change in financial wealth between the two waves, adjusting for extreme values using winsorisation. Specifically, changes in financial wealth smaller than the 1st percentile are set to the 1st percentile value, and changes larger than the 99th percentile are set to the 99th percentile value. We then look at how this change in financial wealth is related to individuals’ housing tenure – whether they are co-residing or private renting – controlling for their average income over the two-year period, their region and their level of education. We estimate that co-residing rather than private renting is associated with around an £880 greater increase in net financial wealth over a two-year period, although our estimate is noisy and not statistically significantly different from zero.
This average effect is the product of potentially different impacts for different people. While for some, co-residing will be for the purpose of saving – whether for a deposit or for other big life expenses – for others, co-residence is likely to be driven by some adverse events. We therefore investigate the heterogeneity in financial accumulation by examining whether those who are co-residing with a parent, rather than privately renting, accumulate more than a given amount in net financial wealth. We again control for average income, region and education level.
Figure 18 shows the results. Those who co-reside with a parent are more likely to have accumulated higher amounts of net financial wealth over the two-year period than similar private renters. Co-residing is associated with being 3.9ppt more likely than private renters to have accumulated more than £10,000 in net financial wealth over a two-year period, conditional on average income, education and region, and with being 3.1ppt more likely to have accumulated more than £20,000. 14% of co-residers accumulated more than £10,000 in a two-year period, more than a third higher than the 10% estimated rate for similar young adults in private rented accommodation.
Figure 18. Association between co-residing with a parent and accumulating more than a given amount in (a) gross and (b) net financial wealth in a two-year period, among 25- to 34-year-olds

Note: Figure shows average marginal effects from 32 probit regressions. We regress accumulating above certain thresholds in (a) gross and (b) net financial wealth on an indicator for co-residing, including controls for education level, average income and region. Our sample is 25- to 34-year-olds in WAS who are observed co-residing or privately renting in two consecutive waves.
Source: Authors’ calculations using the Wealth and Assets Survey, Waves 3–5 and Rounds 6 and 7.
It is also the case that co-residers are less likely to have accumulated more than various negative thresholds (£6,000, £8,000, and £10,000) in net financial wealth, as Figure 18 also shows. In other words, they are more likely to have decumulated net financial wealth by this magnitude or more, by drawing on savings or taking out debt. Co-residing is associated with being 1.5ppt more likely to have seen a net wealth decline of £10,000 or more, although this estimate is not statistically significant.
These findings imply that co-residing is likely to be associated with higher saving for at least some of those who co-reside, implying that some proportion of our estimated savings in private rent are realised in higher saving among this group. However, the fact that there is a greater proportion of co-residers than private renters who see significant falls in their net wealth also suggests that some of the co-residing group are experiencing negative economic events which may be partly driving their decision to co-reside.
Summary
We estimate that co-residers are being implicitly transferred, on average, around £560 a month (in our personal model) in terms of the private rent avoided, or around £6,700 a year. The estimated average saving of £880 over a two-year period, or £440 a year, is therefore a very small share of the average implicit transfer. The fact that the two estimates are of different magnitudes could result from various factors. We would not expect all of the estimated transfer to be saved rather than spent. Those who co-reside could be paying some rent to parents, although data on this are hard to obtain. Co-residers could have higher costs than those who are not co-residing on average: for example, they could be living further from their jobs, so spending more on commuting. They could also have returned to a parental home after a shock of some description, such as divorce or unemployment, which could result in higher related costs. This final explanation would also be consistent with our finding that co-residing is associated with both large increases and declines in financial wealth compared with private renters.
5. Conclusion
In this report, we have examined patterns of young people’s co-residence with their parents, illustrating the demographic groups among which this is more common. Those who are younger, and those who are male, are more likely to co-reside with their parents. Differences by ethnic group are large, with those who are Bangladeshi significantly more likely to co-reside than those who are White; these differences remain significant even when controlling for other factors, such as age, region and economic activity. The relationship between region and the probability of co-residence is complex, affected by both the probability of co-residing and the movement of young people between regions. Living in London is associated with a higher likelihood of having a co-resident child, indicating that those who have parents living in the capital are particularly likely to co-reside with them. Those on lower incomes are also particularly likely to live with one or more parent.
We find that the increase in co-residence between 2006 and 2024 is unlikely to have been driven by changes in the composition of 25- to 34-year-olds. Indeed, the changes in the educational, age, sex, migrant and ethnic composition of this group would be expected to push down the rate of co-residence, all else equal. To some extent, the declining proportions of 25- to 34-year-olds who are married or have a child of their own could have driven up the share of co-residence over this period, since those who are married or have children are significantly less likely to co-reside with parents. The same is true for the increasing proportion of 25- to 34-year-olds experiencing health problems, which are associated with an increased probability of co-residing with parents. But these changes could themselves have been driven by the increasing prevalence of co-residence, rather than the other way around. These demographic changes can in any case explain at most a tenth of the total increase. The vast majority of the rise in co-residence is therefore explained by changes in co-residence rates conditional on these factors, in line with changing housing costs or changes in attitudes towards housing or co-residence driving the change.
Co-residence can be seen as a financial transfer from parents to children (Suh, 2020). We examine the potential scale of this transfer, in terms of the private rent saved, and find that, among co-residers, it is particularly large for those living in London, those who are more highly educated and those who are older. When taking into account the proportions of different groups who are co-resident, the transfer looks particularly significant at the bottom of the income distribution, driven by lower-income young people being much more likely to co-reside. This is in contrast to the pattern of direct financial transfers by income.
We find that being co-resident is associated with around an £880 greater mean increase in financial wealth over a two-year period, compared with private renters of the same age, income and education. This implies that those co-residing tend to save some of the proceeds of their reduced rent. However, we see a diversity of experiences, with co-residers being more likely than renters to accumulate significant sums of savings but also more likely to see substantial falls in their financial wealth. This is consistent with co-residence being a means to accumulate savings for some and a response to a negative life event for others. As well as the fact that some may be returning home due to adverse events, the fact that the overall average rent saved is substantially larger than the average effect on savings that we observe could be explained by higher discretionary spending or higher costs for co-residers, co-residers paying some rent to parents, or some combination of these.
Appendix A. Additional tables
Table A1. Factors included in two regression specifications for probability of co-residing
Prediction 1 | Prediction 2 |
Single year of age | Single year of age |
Sex | Sex |
Ethnicity (10 categories), interacted with dummy for being born in the UK | Ethnicity (10 categories), interacted with dummy for being born in the UK |
Dummy for having degree-level education or above | Dummy for having degree-level education or above |
Quarter of year | Quarter of year |
| Marital status (4 categories: single, married, cohabiting with a partner, widowed/divorced/separated) |
| Current region of residence |
| Dummy for experiencing a health problem (expected to last) for a year or more |
| Dummy for presence of dependent child in benefit unit |
Table A2. Factors included in personal and property models of per-person private rent
Personal model | Property model |
Single year of age | Type of accommodation |
Current region of residence | Current region of residence |
Ethnic group (10 categories) | Number of bedrooms |
‘Benefit unit’ wealth decile | Average house price in individual’s local authority |
‘Benefit unit’ income decile | Number of individuals in the household |
Marital status (3 categories: single, married, cohabiting with a partner) |
|
Education (3 categories: up to compulsory, A levels / college, university) |
|
Economic activity (3 categories: employed, unemployed, economically inactive) interacted with a dummy for being at university |
|
Appendix B. Data reweighting
The problem
Round 7 of the Wealth and Assets Survey seems to dramatically overestimate the level of co-residence.
To get a sense of the ‘true’ rate of co-residence by age, we can compare evidence from Round 7 of WAS (covering 2018–20) and the rate of co-residence we see in the 2021 Census. This comparison, if anything, will understate the extent to which co-residers are over-represented in WAS. We are treating the 2021 Census as giving the ‘true’ rate of co-residence we should expect to see in the 2018–20 wave of WAS, but the 2021 Census took place in March 2021, when England was in its third national lockdown, and more younger people might have chosen to live with their parents. In comparison, WAS Round 7 took place between April 2018 and March 2020, so before any effects of the pandemic.
Figure B1 shows the proportion of people living at a parental home by year of age, in WAS and in the 2021 Census. The over-representation of co-residers in WAS is evident, particularly at younger ages. To some extent, the higher proportion of co-residers at the very youngest ages in WAS will be a result of the fact that WAS does not sample those living in institutional settings, in particular university halls. But the importance of excluding university halls should drop away quickly along the age distribution. According to the Census, 15% of 30-year-olds were living at a parental home; according to WAS, 29% of 30-year-olds lived at a parental home, almost double the Census figure.
Figure B1. Shares of 19- to 40-year-olds living at a parental home, by year of age, in the 2021 Census and in the Wealth and Assets Survey (Round 7, 2018–20)

Source: Authors’ calculations using the Wealth and Assets Survey Round 7 and Census 2021.
We hypothesise that this over-representation of co-residers is a result of people not being successfully followed in WAS when they leave their parents’ home. This would mean that, as the sample matures, the sample of younger people becomes increasingly weighted towards those who have remained at a parent’s home.
One test of this hypothesis is to compare Wave 1 of the Wealth and Assets Survey (2006–08) with the 2011 Census. This wave of WAS should not be affected by the problem we describe, as it was sampled cross-sectionally from the population rather than attempting to follow a previous group of people over time. As shown in Figure B2, the proportions of people co-residing look much more similar to the 2011 Census in Wave 1. We see a slight overestimation of co-residence in WAS at the youngest ages covered, likely as a result of a lack of coverage of institutional settings, but in general the proportions track one another well.
Figure B2. Shares of 19- to 40-year-olds living at a parental home, by year of age, in the 2011 Census and in the Wealth and Assets Survey (Wave 1, 2006–08)

Source: Authors’ calculations using the Wealth and Assets Survey Wave 1 and Round 7, and Census 2011 and 2021.
We can also see this sort of pattern in other longitudinal datasets. Understanding Society (USoc), in particular, also seems to overestimate the rate of co-residence. Figure B3 shows the rate of co-residence by age in Wave 12 of Understanding Society, compared with the 2021 Census; we see a similar overestimation to that seen in the Wealth and Assets Survey. Again, earlier waves of USoc look much more similar to the Census: Figure B4 compares Wave 1 of USoc and the 2011 Census. As when comparing Wave 1 of WAS and the 2011 Census, the two track one another much more closely.
Figure B3. Shares of 19- to 40-year-olds living at a parental home, by year of age, in the 2021 Census and in Understanding Society (Wave 12, 2020–22)
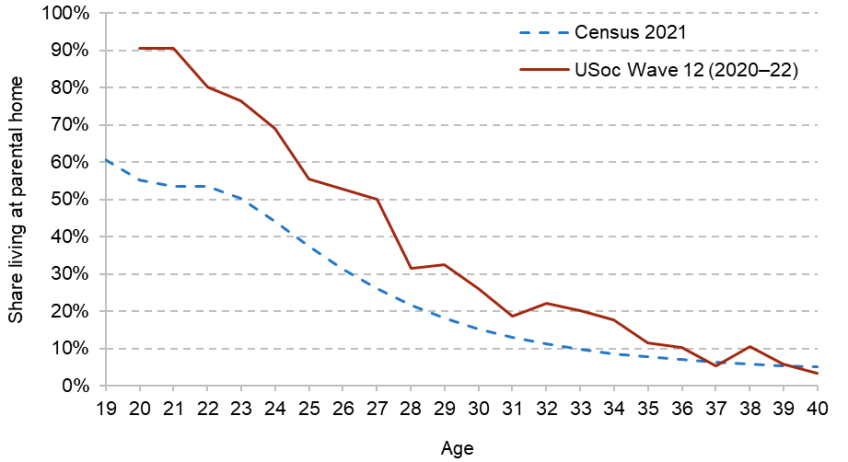
Source: Authors’ calculations using Understanding Society Wave 12 (2020–22) and Census 2021.
Figure B4. Shares of 19- to 40-year-olds living at a parental home, by year of age, in the 2011 Census and in Understanding Society (Wave 1, 2009–10)
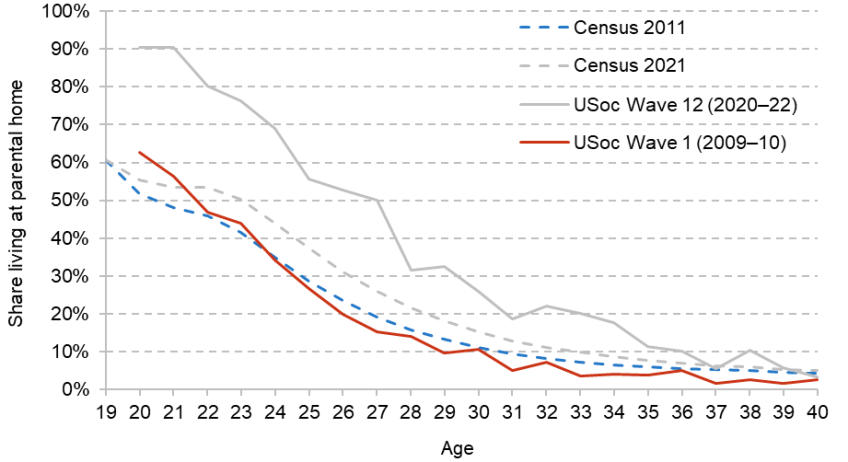
Source: Authors’ calculations using Understanding Society Waves 1 and 12 (2009–10 and 2020–22), and Census 2011 and 2021.
Using the Labour Force Survey (LFS), a cross-sectional survey, we can see that the proportion co-residing with a parent looks much more similar to the proportion in the Census. This further confirms the idea that the over-representation of co-residing younger people we see in WAS and USoc is a result of a failure to follow some people over time. Figure B5 shows the proportion of 19- to 40-year-olds living at a parental home by year of age in the LFS, in Round 7 of WAS, and in the 2021 Census. The LFS clearly tracks results from the Census better.
Figure B5. Shares of 19- to 40-year-olds living at a parental home, by year of age, in the 2021 Census, the Labour Force Survey in 2023–24, and Round 7 of the Wealth and Assets Survey

Source: Authors’ calculations using the Wealth and Assets Survey Round 7, Census 2021 and Labour Force Survey (2023Q2 to 2024Q1).
Our solution
In the Wealth and Assets Survey, we can treat the ‘boost’ sample within Round 7 – a new sample added to the existing panel using the same method used to draw the initial WAS sample, designed to combat attrition – as a true representation of housing tenure, not subject to these differential attrition issues.
Using total wealth, income, sex, age, education level, region, ethnicity and parental status interacted with a four-category variable for household tenure (owner-occupier, private renter, social renter, co-residing), we run a probit regression to predict the probability of being in the boost sample in Round 7.
We then use our predicted probability to construct new weights for those not in the boost sample. These new weights scale individuals’ cross-sectional weight by a function of their predicted probability of being in the boost sample, which is based on the above characteristics.
Parents of co-residers
Different datasets give us different proportions of 50- to 69-year-olds who have at least one co-resident child aged 25–34. We show the rates from the Wealth and Assets Survey, Labour Force Survey, English Longitudinal Study of Ageing and Understanding Society in Figure B6. The age profile of co-residence peaks at a similar age in each survey, but the levels are different.
Figure B6. Share of adults with at least one co-residing adult child aged 25–34, by age

Source: Authors’ calculations using the Labour Force Survey (2023Q2 to 2024Q1), Understanding Society Waves 9 and 10 (2017–20), ELSA Wave 9 (2018–19) and the Wealth and Assets Survey Round 7 (2018–20).
We also see strong differences between datasets when it comes to the proportion of 50- to 69-year-olds with a co-resident child aged 25–34 by region (see Figure B7). The LFS implies much lower shares of individuals with a co-resident child, particularly in London. This is concerning, and worthy of further investigation.
Figure B7. Share of 50- to 69-year-olds with a co-resident child aged 25–34, by region and dataset

Note: WAS does not contain data for Northern Ireland, and ELSA does not contain data for Scotland, Wales or Northern Ireland.
Source: Authors’ calculations using the Labour Force Survey (2023Q2 to 2024Q1), Understanding Society Waves 9 and 10 (2017–20), ELSA Wave 9 (2018–19) and the Wealth and Assets Survey Round 7 (2018–20).
References
Albanesi, S., Gihleb, R. and Zhang, N., 2022. Boomerang college kids: unemployment, job mismatch and coresidence. National Bureau of Economic Research, Working Paper 30397, https://doi.org/10.3386/w30397.
Boileau, B. and Sturrock, D., 2023a. Who gives wealth transfers to whom and when? Patterns in the giving and receiving of lifetime gifts and loans. Institute for Fiscal Studies, Report 243, https://ifs.org.uk/publications/who-gives-wealth-transfers-whom-and-when-patterns-giving-and-receiving-lifetime-gifts.
Boileau, B. and Sturrock, D., 2023b. Who gives and receives substantial financial transfers in Britain? Institute for Fiscal Studies, Working Paper 23/08, https://ifs.org.uk/publications/who-gives-and-receives-substantial-financial-transfers-britain.
Britton, J., van der Erve, L., Waltmann, B. and Xu, X., 2021. London calling? Higher education, geographical mobility and early-career earnings. Department for Education, Research Report, https://ifs.org.uk/publications/london-calling-higher-education-geographical-mobility-and-early-career-earnings.
Esteve, A. and Reher, D. S., 2021. Rising global levels of intergenerational coresidence among young adults. Population and Development Review, 47(3), 691–717, http://www.jstor.org/stable/45419225.
Floridi, G., 2024. Inequality and socio-economic divides in parental transfers to young adults in the United States. Social Forces, soae148, https://doi.org/10.1093/sf/soae148.
Kaplan, G., 2010. Moving back home: insurance against labor market risk. Federal Reserve Bank of Minneapolis, Research Department, Working Paper 677, https://jstor.org/stable/community.28111377.
OECD, 2024. Living arrangements by age groups. https://webfs.oecd.org/Els-com/Affordable_Housing_Database/HM1-4-Living-arrangements-age-groups.pdf.
Office for National Statistics, 2023. More adults living with their parents. https://www.ons.gov.uk/peoplepopulationandcommunity/populationandmigration/populationestimates/articles/moreadultslivingwiththeirparents/2023-05-10.
Office for National Statistics, 2024. Milestones: journeying through modern life. https://www.ons.gov.uk/peoplepopulationandcommunity/populationandmigration/populationestimates/articles/milestonesjourneyingthroughmodernlife/2024-04-08.
Office for Statistics Regulation, 2024. Quality under challenge: regulating statistics and data from the Labour Force Survey. https://osr.statisticsauthority.gov.uk/blog/quality-under-challenge-regulating-statistics-and-data-from-the-labour-force-survey/.
Sage, J., Evandrou, M. and Falkingham, J., 2013. Onwards or homewards? Complex graduate migration pathways, well-being, and the ‘parental safety net’. Population, Space and Place, 19(6), 738–55, https://doi.org/10.1002/psp.1793.
Saydam, A. and Raley, K., 2024. Slow to launch: young men’s parental coresidence and employment outcomes. Journal of Marriage and Family, 86(4), 1009–33, https://doi.org/10.1111/jomf.13001.
Suh, E., 2020. Young British adults’ homeownership circumstances and the role of intergenerational transfers. Longitudinal and Life Course Studies, 11(3), 383–407, https://doi.org/10.1332/175795920X15846933259695.
West, A., Lewis, J., Roberts, J. and Noden, P., 2017. Young adult graduates living in the parental home: expectations, negotiations, and parental financial support. Journal of Family Issues, 38(17), 2449–73, https://doi.org/10.1177/0192513X16643745.
Xu, X., 2023. The changing geography of jobs. Institute for Fiscal Studies, Report 286, https://ifs.org.uk/publications/changing-geography-jobs.
Data
Banks, J., Batty, G. David, Breedvelt, J., Coughlin, K., Crawford, R., Marmot, M., Nazroo, J., Oldfield, Z., Steel, N., Steptoe, A., Wood, M., Zaninotto, P. (2024). English Longitudinal Study of Ageing: Waves 0-10, 1998-2023. [data collection]. 40th Edition. UK Data Service. SN: 5050, DOI: http://doi.org/10.5255/UKDA-SN-5050-27.
Office for National Statistics. (2024). Labour Force Survey. [data series]. 11th Release. UK Data Service. SN: 2000026, DOI: http://doi.org/10.5255/UKDA-Series-2000026.
Office for National Statistics. (2019). Wealth and Assets Survey. [data series]. 2nd Release. UK Data Service. SN: 2000056, DOI: http://doi.org/10.5255/UKDA-Series-2000056.
University of Essex, Institute for Social and Economic Research. (2023). Understanding Society: Waves 1-13, 2009-2022 and Harmonised BHPS: Waves 1-18, 1991-2009. [data collection]. 18th Edition. UK Data Service. SN: 6614, http://doi.org/10.5255/UKDA-SN-6614-19.
Endnotes
Authors

Isabel Atkinson

Bee Boileau
Bee joined the IFS in 2021 as a Research Economist and works in the Retirement, Saving and Ageing sector.

More from IFS
Understand this issue


Policy analysis


Academic research


