
Downloads
Download the report as a PDF
PDF | 1.5 MB
Executive summary
Tax and benefit microsimulation models (MSMs) and fiscal incidence analyses (FIAs) are important tools for understanding how fiscal policies affect households across the income distribution. They are used to assess who bears the burden of taxation, who benefits from public spending, and how alternative fiscal reforms may affect poverty, inequality, and the public finances. Interest in these approaches has grown substantially in low- and middle-income countries (L&MICs) over the past two decades, driven by improvements in household survey data, expanding administrative data systems, and an increasing policy focus around poverty reduction, inequality, and domestic revenue mobilisation.
This report compares three families of models that have been developed and applied in L&MICs: SOUTHMOD, led by UNU-WIDER and based on the EUROMOD platform; TaxDev models, developed by the Institute for Fiscal Studies (IFS); and CEQ models developed by the Commitment to Equity Institute, alongside related tools implemented by the World Bank. Although all these approaches seek to analyse the distributional effects of fiscal policy, they differ in their objectives, analytical architecture, methodological assumptions, country coverage, institutional arrangements, and intended users.
Key findings from the comparison of the three families of models
- Country coverage differs substantially across models. SOUTHMOD currently covers 12 core countries using the EUROMOD platform, with additional country models developed by partner institutions using the same architecture. TaxDev has developed full MSMs for Ghana and Ethiopia and selected Latin American countries, alongside partial models and analytical tools for several other African countries. CEQ analyses have been implemented in more than 80 countries, while the World Bank has developed tailored MSMs for more than 50 developing countries since 2016.
- MSMs and FIA differ in their main focus and analytical approach. MSMs such as SOUTHMOD and TaxDev focus primarily on simulating counterfactual reforms and supporting ongoing policy design, monitoring, and evaluation. They simulate tax liabilities and benefit entitlements by applying statutory rules to household survey data alongside incidence and compliance assumptions. FIA approaches such as CEQ focus particularly on analysing the distributive effects of existing fiscal systems and benchmarking fiscal redistribution across countries. They place greater emphasis on the allocation of existing taxes and expenditures across households using survey data, administrative aggregates, and simulation methods combined with incidence and compliance assumptions.
- The models differ in the scope of fiscal instruments covered. SOUTHMOD and TaxDev MSMs generally focus on direct and indirect taxes and cash transfers and are particularly well suited for simulating policy reforms. CEQ studies provide the broadest coverage of fiscal instruments, including direct and indirect taxes, subsidies, and cash and in-kind transfers such as education and health spending. World Bank MSMs tend to focus on a narrow set of tax instruments.
- All approaches rely primarily on nationally representative household surveys and use static (arithmetic) simulations. In their standard versions, they generally abstract from behavioural responses to policy changes and wider macroeconomic effects.
- Methodological choices vary across models. Important differences include the treatment of social insurance contributions, assumptions about tax compliance and informality, approaches to calibration and validation, the choice of welfare measures (income versus consumption), and the way the analysis is presented.
- Institutional models and intended users also differ. SOUTHMOD and CEQ place strong emphasis on collaboration with local researchers and wider accessibility outside government. TaxDev and World Bank models are often developed in close partnership with ministries of finance (MoF) and tax authorities to support specific tax reform processes, strengthen the analytical capacity of tax policy units, and address other technical assistance needs.
- FIA and MSM approaches should often be seen as complementary. CEQ FIA provides the most comprehensive diagnostic assessment of the existing fiscal systems, which helps identify potential areas for reform. However, MSMs are then needed to analyse any alternative policy proposals.
- Gradually embedding these tools within policymaking institutions is critical. Their long-term value depends not only on technical quality but also on whether governments develop the capacity, incentives, and institutional ownership needed to use them regularly in fiscal policymaking. Starting with simpler analysis focusing on a subset of fiscal instruments and gradually expanding the models over time is a good strategy in countries where these tools are not yet available. In contrast, maintaining multiple overlapping models in settings with limited capacity can create confusion by unexplained model differences and hence harm take-up.
The choice of model ultimately depends on the user’s objectives. For a detailed diagnosis of the existing fiscal system, analysing a broader set of fiscal instruments, and benchmarking against other countries, CEQ-style FIA may be more appropriate. For a more forward-looking agenda focused on evaluating alternative reforms to taxes and cash transfer, analysts should aim for an MSM instead. SOUTHMOD models are based on standardised methodology that enables cross-country comparisons and have a wider community of users that fosters sustainability of their tools. For a more country-specific analysis that allows for more complex modelling, a bespoke approach, as taken by TaxDev, may be preferred.
The report also emphasises that the long-term value of these tools depends not only on technical sophistication but also on whether they become embedded within national policymaking processes. Building sustainable analytical capacity within MoF, revenue authorities (RA), statistical agencies, universities, and research institutes is therefore critical. Countries do not necessarily need to begin with highly sophisticated models covering the entire fiscal system. Starting with simpler analyses focused on key taxes or transfers can already provide valuable policy insights and help build institutional familiarity with distributional analysis. Over time, models can be expanded to incorporate additional fiscal instruments, administrative data, behavioural assumptions, and indirect effects through production chains.
Ultimately, effective use of FIA and MSM tools can help governments move beyond analysing individual taxes or expenditures in isolation and instead evaluate packages of reforms, fiscal trade-offs, and the combined effects of revenue and spending measures on different population groups. As governments face increasing pressure to reconcile fiscal sustainability with poverty reduction and inequality objectives, these tools are likely to become increasingly central to evidence-based fiscal policymaking in L&MICs.
1. Introduction
Understanding the distributional and behavioural impact of taxation – and the public spending it finances – is a key component of effective fiscal policy design and evaluation. Over the past two decades, interest in this area has grown significantly within low- and middle-income countries (L&MICs). Driven by the growing availability of data infrastructure in L&MICs (particularly of household surveys capturing expenditures, incomes, and demographic characteristics), numerous initiatives have emerged to develop analytical tools for assessing the distributional, poverty, and inequality impacts of fiscal policies at the household and individual levels.
Fiscal incidence analysis (FIA) and comprehensive microsimulation models (MSMs) examine how current tax and spending policies affect households across the welfare distribution, assessing who bears the burden of taxation and who benefits from government transfers. MSMs are also designed to estimate changes in fiscal incidence at the individual or household level under alternative policy scenarios. These tools rely heavily on micro-level data. Modelling is typically ‘static’ as these models primarily account for immediate impacts of taxes paid and benefits received on incomes or consumption. Potential behavioural responses of individuals or households to policies are usually not reflected, though these tools can be combined with elasticity estimates to partially account for these responses. Currently, for some countries, there may be more than one MSM or an MSM and a FIA study, each with distinct strengths and limitations. This can create uncertainty about which model is best suited for a particular policy question and, at times, confusion over why different models produce divergent results.
This report aims to support researchers, analysts, and policymakers to better understand the functionalities of different models and the assumptions that underpin them, and thus make more informed decisions about model selection. It focuses on three key families of models developed for several L&MICs: SOUTHMOD, developed by the United Nations University World Institute for Development Economics Research (UNU-WIDER); TaxDev models, created by researchers at the Institute for Fiscal Studies (IFS), UK; and CEQ models, created by the Commitment to Equity (CEQ) Institute, along with related models built by the World Bank based on the CEQ approach. The latter is more orientated towards FIA, while the first two are primarily designed as MSMs. The report highlights the key features of these tools, helping users to assess their differences, evaluate their comparability across multiple dimensions, interpret results more effectively, and select the model that best fits their research and policy needs – particularly when multiple options are available.
This report builds on a small number of studies that compare MSM and FIA models. Paulus and Sutherland (2016) provide a high-level overview of four different projects that mostly focus on developed countries: EUROMOD, which is the foundational model for European countries upon which SOUTHMOD and others were subsequently built; CEQ (this is the exception to the developed country focus); Luxembourg Income Study (LIS) database of harmonised microdata; and TAXSIM model for the USA based at the National Bureau of Economic Research. Their focus is primarily on the types of resources that each project offers – such as methodological guidelines, harmonised microdata, and tax-benefit policy modelling – without delving into the detailed approaches or assumptions underlying each model. Abramovsky et al. (2018) present a brief overview of different models developed specifically for Ethiopia, including CEQ and SOUTHMOD. They offer more detailed comparisons, particularly regarding input data, coverage of tax instruments (such as consumption taxes), and modelling assumptions such as on tax incidence and evasion or informality rates. The CEQ Handbook (Lustig, 2022a) contains a brief comparison of the CEQ approach with EUROMOD and LATAX – the first TaxDev model. Amjad, Lustig, and Popova (2024) provide an extensive survey of methodological approaches to assess the distributional impact of fiscal policies, covering FIA and MSMs, but do not discuss the existing tools in detail.
The rest of the report is structured as follows. Section 2 presents the MSMs and FIA models we considered. Section 3 outlines the framework we use for the comparative assessment of these models, which is, in turn, presented in Section 4. Section 5 concludes with key takeaways.
2. The models considered in this report
Background on microsimulation and fiscal incidence analysis
Before describing the families of models considered in this report, it is helpful to recap why household-level MSMs and FIA are useful tools for policy analysis.
Both tools are primarily designed to estimate the distributional impacts of tax and spending policies (either of individual policies or packages of policies) across different population groups. They calculate how much tax is paid or public spending is accrued at the household or individual level, by income/expenditure levels, demographic characteristics (such as marital status, gender, and age), or geographic location (urban/rural). They therefore provide estimates of the distribution of people’s incomes or consumption, showing who gains and who bears the costs of different policies, helping policymakers understand their distributional and poverty impacts.
While the two approaches are closely related, FIA focuses particularly on analysing the distributional effects of existing fiscal systems. It provides detailed ex-post estimates of the separate and combined impact of individual policies, helping identify potential areas for reform.
On the other hand, MSMs can provide not only ex-post estimates but also ex-ante estimates under alternative policy scenarios, providing insights into proposed reforms before they are introduced. Additionally, microsimulation tools can be used to estimate the revenue effects of different policy proposals, or the impact of policies on financial work incentives for different types of workers. This includes the incentive for those in work to increase their income (at the intensive margin) and the incentive for those out of work to be in work at all (at the extensive margin). This type of analysis can therefore provide information on whether a policy meets its intended distributional, revenue, and incentive purposes – or, alternatively, whether it has unintended adverse effects. By analysing the effects of individual policies as well as their combination, MSMs can also help inform the design of measures that aim to compensate for or ameliorate some of these negative consequences.
However, these types of household models cannot answer other relevant questions such as the impact of a tax reform on businesses, which can be explored using other models based on firm-level data. Nor can these models in isolation account for general equilibrium and wider economy-wide impacts.1 However, they contribute a vital piece to the evidence base that is crucial for better policymaking.
There are also simplified hypothetical-household models that are built on synthetic individuals or household types.2 These models are useful for illustrative purposes and are often employed for cross-country comparisons. However, they lack representativeness and do not capture the full heterogeneity of real-world populations and are not the focus of this paper.3
MSMs as well as FIAs typically rely on representative survey data, such as household income and expenditure surveys, or administrative data, such as tax records, or a combination of both to leverage the strengths of each. Additionally, these models may be supplemented with other data sources, such as national accounts or revenue and expenditure information from individual policies, to enhance their comprehensiveness and accuracy. As such, the scope, quality, and accuracy of these models hinge on the quality and type of the underlying data sources and how they are processed.
At the same time, different modelling approaches can be adopted for analysing specific policy questions. Table 1 presents a broad typology.4 Static models estimate outcomes based on observed behaviour, behavioural models incorporate responses to fiscal policies, and dynamic models analyse outcomes over time. These approaches differ substantially in their complexity, data requirements, and scope of analysis.
Table 1. Typology of micro-level data-driven models
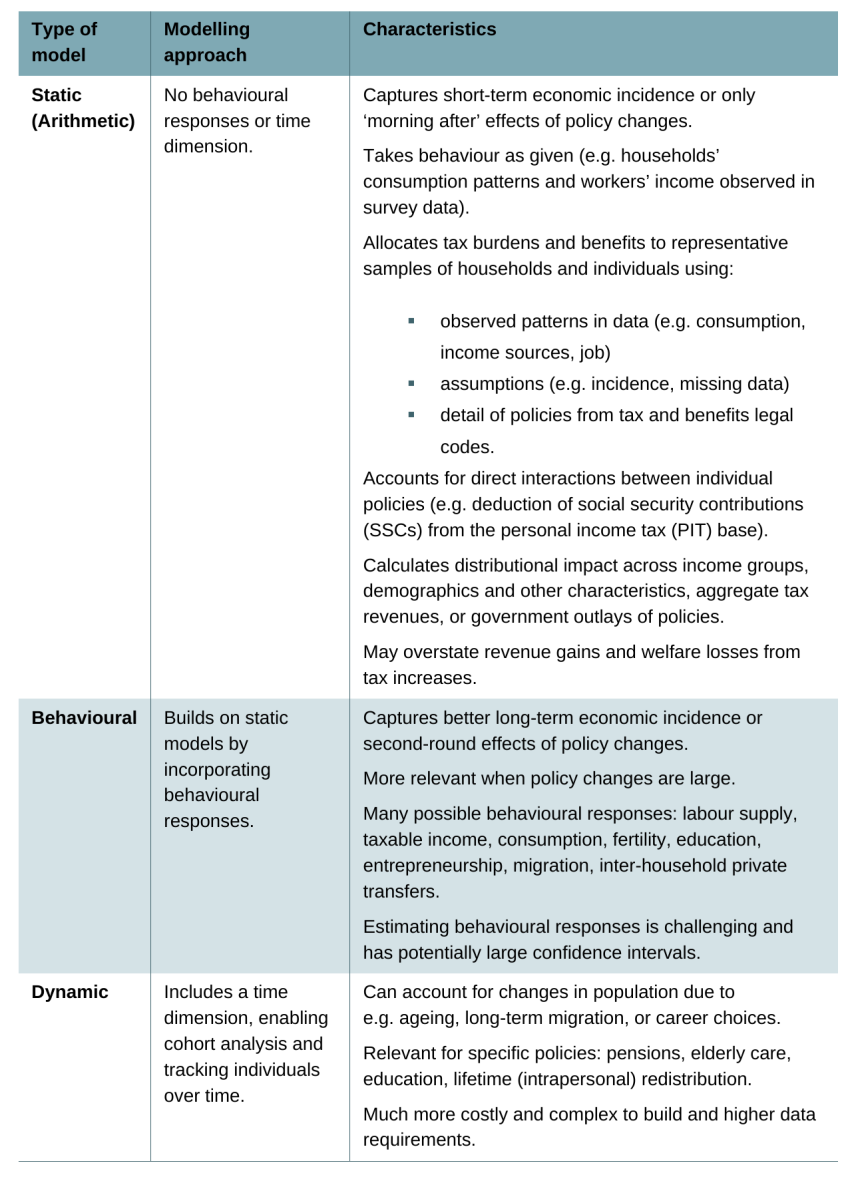
Standard FIA models are generally static and estimate distributional and poverty impacts of taxes and transfers observed in the data under specific incidence assumptions. However, some FIA applications incorporate behavioural parameters to approximate actual economic incidence more closely. Similarly, static MSMs focus on the ‘morning after’ effects of reforms but can be combined with elasticity estimates to account for behavioural responses.
In this report, we focus on static models. These are useful for modelling short-term impacts and small policy changes where behavioural impacts are expected to be limited. Of course, households can respond to policy changes in many ways and sometimes a change in behaviour is one of the policy goals (such as with sin taxes). This approach might therefore not be accurate for modelling long-term impacts and large policy changes with significant behavioural and general equilibrium responses. Nevertheless, static analysis is often necessary as the first step in further, more complex analyses. Furthermore, many policy changes at the margin do not generate large changes in behaviour, at least not in the short to medium term. Because of this and due to their flexibility, relative simplicity and ease of use, and comparatively lower data and modelling requirements than behavioural or dynamic approaches, the use of static models is quite widespread.
Researchers, government institutions, and development partners often develop ad-hoc models tailored to individual countries to assess the distributional, inequality, and poverty impacts of tax and spending policies based on their specific needs. There are a range of models that tend to be complementary and that vary over fiscal instruments covered, type of model, methodology, data used, accessibility, flexibility, countries covered, user-friendliness, and users. Many governments and think tanks, mostly in high-income countries (HICs), develop and maintain their own models to inform policy choices and public debate. However, only a few initiatives aim to take a systematic approach across multiple countries, with some explicitly focused on contributing to public research infrastructure and building a cross-country evidence base. A notable example is EUROMOD, a family of MSMs for European countries, which is used by governments and researchers (Sutherland, 2018).
This report does not attempt to summarise all models or research on the distributional effects of tax and transfers in different country contexts. Instead, it focuses on three selected initiatives that have developed static comprehensive models covering multiple tax and transfer policies for several L&MICs.5 While the models are static, they have sometimes been used in conjunction with estimates of behavioural response in specific contexts (Abramovsky, Attanasio, and Phillips, 2015; Jouste et al., 2024; Osei, Pirttilä, and Rattenhuber, 2019).
Three families of models
SOUTHMOD
SOUTHMOD6 was launched in 2016 and is led by UNU-WIDER alongside partners such as the Southern African Social Policy Research Insights (SASPRI) and the London School of Economics (LSE). It develops, updates, and maintains tax-benefit MSMs in collaboration with local organisations and/or government. The aim is to support evidence-based research and policy formulation and evaluation, helping to assess the impact of tax and transfer policies on poverty, inequality, and government revenues. A key feature of the project has been a strong focus on building local capacity, with dedicated national teams in each country and local research collaborations. The country-specific models are built using the EUROMOD platform, originally developed by the Institute for Social and Economic Research (ISER) at the University of Essex and now maintained by the European Commission’s Joint Research Centre (JRC).
TaxDev
A first generation of these models was developed for selected Latin American countries in the early 2010s by researchers at the IFS. Building on the same principles, models for African countries were subsequently developed through IFS’s work under the Centre for Tax Analysis in Developing Countries (TaxDev) in collaboration with national governments. Established by the IFS in 2016, TaxDev is now run in partnership with ODI Global and funded by the UK Government Public Finance Centre of Expertise as part of UK International Development.7 TaxDev supports more effective tax policymaking in L&MICs through close partnerships with governments and researchers. A central aim of its collaboration with MoFs and RAs is to strengthen data systems and analytical capacity, and to co-develop sustainable, country-specific tools – such as MSMs – that support long-term, evidence-based policymaking.
CEQ and World Bank
The Commitment to Equity (CEQ) Institute, founded by Nora Lustig at Tulane University in 2015, focuses on reducing inequality and poverty through rigorous tax and benefit incidence analysis. Lustig and colleagues developed the CEQ framework for FIA, which is outlined in the CEQ Handbook (Lustig, 2022a).8 The framework has been applied to the production of FIA studies for tens of countries, covering HICs and L&MICs, and underpins one of the indicators for the Sustainable Development Goals (SDGs).9 The focus of the CEQ methodology is on characterising the distributional effects of existing tax and spending systems from multiple perspectives and across different population groups, including its impacts on children or women, rather than simulating alternative systems. Even though some of these studies examine potential specific reforms to tax and transfer policies, they do not necessarily provide comprehensive microsimulation tools that can be used systematically to assess ex-ante counterfactual policies. The CEQ Institute has developed a simple Excel-based tool that uses decile-level data for quick and rough policy simulations (see Enami, Larroulet, and Lustig, 2022b). It also provides guidance on turning CEQ FIA into MSMs (Popova, 2024 as cited in Amjad, Lustig, and Popova, 2024). Since 2016, the World Bank has developed tailored, simpler, and more user-friendly MSMs for individual countries based on the CEQ framework for FIA to enable the ex-ante assessment of specific tax and benefit reforms by governments (World Bank, 2022).
Examples of distributional analysis outputs
This section illustrates the types of distributional questions that these three modelling initiatives are able to answer.
All these models can provide diagnostic assessments of the distributional and poverty impacts of existing fiscal systems within a single country, serving as a foundation for better informed policy discussions. For example, Jara and Varela (2019) use SOUTHMOD to simulate taxes and benefits in Ecuador and compare the results to values reported directly in survey data, and TaxDev has assessed the redistributive impact of direct and indirect taxes in Ghana (Iddrisu et al., 2023). CEQ studies, which often include a broad range of fiscal instruments, typically provide the most comprehensive assessment of the net impact of fiscal policies on household welfare. For example, Figure 1 shows high-level incidence of taxes and transfers in Kenya based on the FIA by Manda et al. (2020). The results show that households in all income deciles except the poorest in the first decile pay more in taxes than they receive in cash transfers (black line). However, once in-kind transfers are taken into account, the bottom 70% of the population become net beneficiaries of the overall fiscal system (grey line).
Figure 1. Incidence of taxes and transfers in Kenya by household income deciles
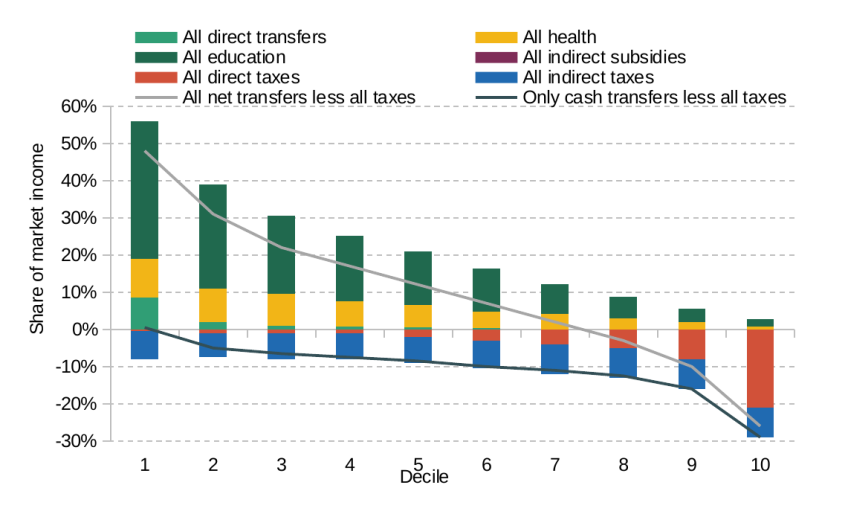
Source: Visual approximation of Figure 4 from Manda et al. (2020).
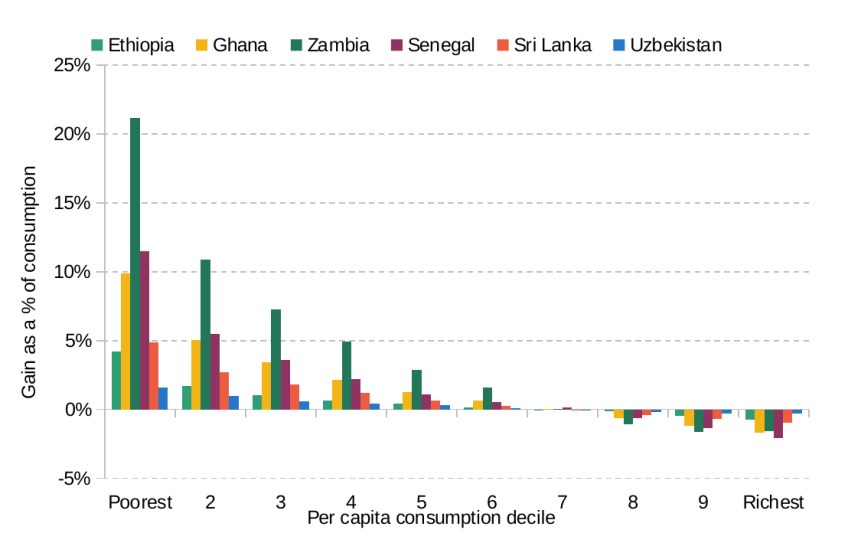
MSMs can also provide detailed insights into the impacts of recent or proposed reforms in a given country, such as TaxDev’s evaluation of the introduction of excise duty on fruit juices in Ghana (Iddrisu et al., 2023). Figure 2 shows this was a clearly progressive reform with the additional tax burden concentrated among the richest households both in cash terms (green bars) and as a share of household consumption (black line).
Figure 2. Distributional effect of introducing excise duty on fruit juices in Ghana
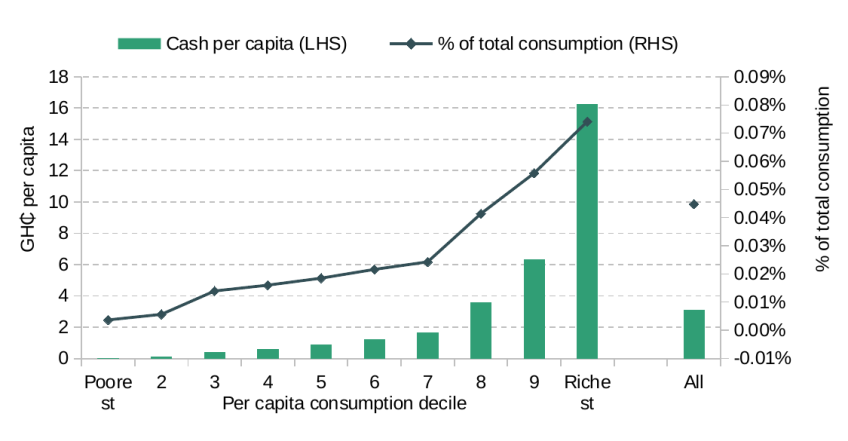
Source: Figure 4.18 in Iddrisu et al. (2023).
Even though certain modelling choices may differ between countries (for example due to data availability), the harmonisation of their core methodologies allows both CEQ and SOUTHMOD to extend these single-country studies to conduct indicative comparative assessments of the distributional effects of the tax-benefit systems in multiple countries. This includes both the distributional analysis of the existing systems (see Lastunen et al., 2024 and Lustig, 2022b, for example) and a high-level comparison of the effects of policy changes in individual countries over time (see Lastunen et al., 2024).
Finally, these different approaches can be brought together to assess proposed counterfactual reforms across multiple countries. For example, CEQ and TaxDev collaborated to evaluate the redistributive power of cash transfers and value-added tax (VAT) exemptions in multiple countries. Figure 3, reproduced from Warwick et al. (2022), shows that VAT exemptions are poorly targeted and even a simple universal cash transfer is more redistributive and poverty reducing. Such analysis can then inform efforts to expand the VAT base and propose adequate compensatory measures.
Figure 3. The distributional impact of implementing a uniform VAT and using 100% of the revenue gain to fund a universal transfer in six L&MICs
Source: Figure 6.1 in Warwick et al. (2022).
3. Framework for comparison
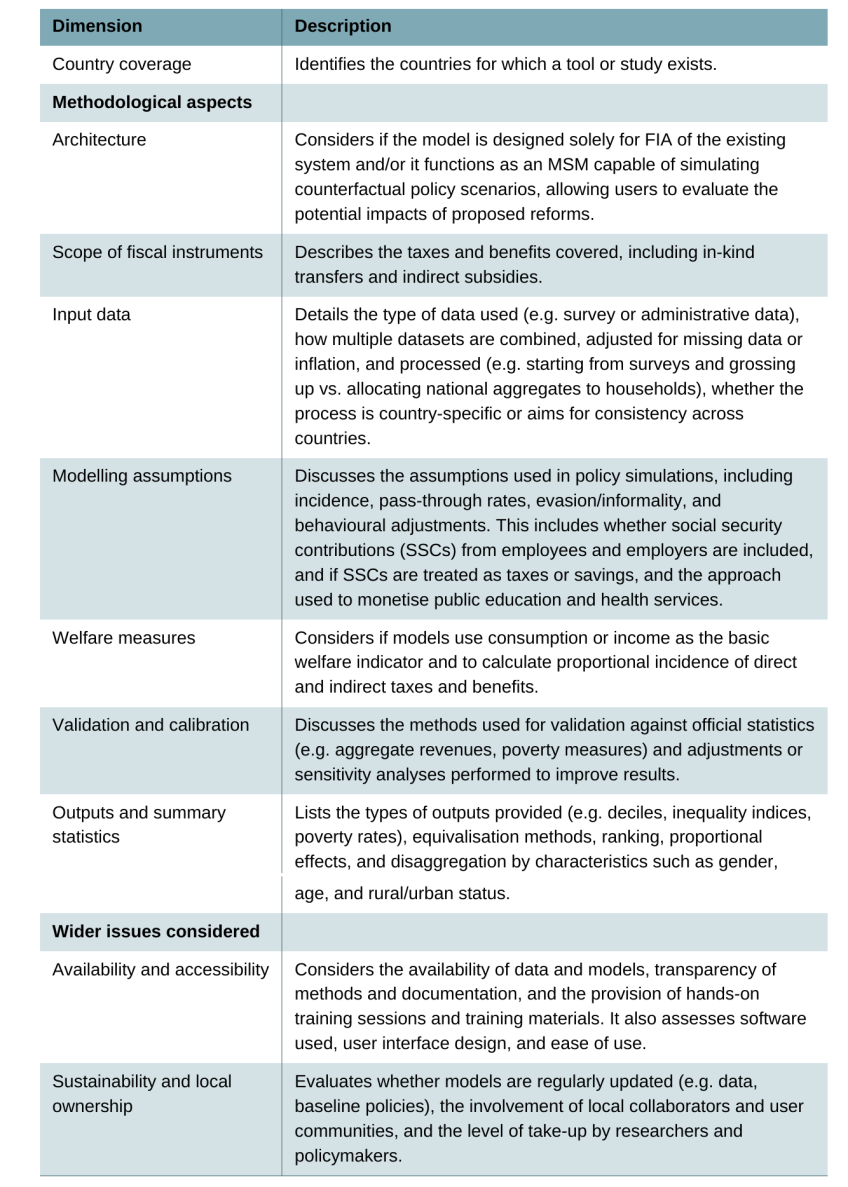
Table 2 outlines three broad sets of criteria to systematically assess and compare the different families of models: 1) country coverage, 2) methodological choices that can impact the type of analysis that can be performed, the resulting findings, and how they are presented, and 3) wider issues that can affect the uptake by governments and researchers.
Table 2. Framework for comparison of families of models
4. Comparative assessment
Country coverage
At the time of writing, the SOUTHMOD project has directly developed and maintains models for twelve core countries covering Africa (Ethiopia, Ghana, Mozambique, Rwanda, Tanzania, Uganda, Zambia), Latin America (Bolivia, Colombia, Ecuador, Peru), and Southeast Asia (Vietnam), and a separate model for Zanzibar as a semi-autonomous region. A new model for Egypt is scheduled to be released in mid-2026. In addition, there is a wider family of tax-benefit MSMs based on the EUROMOD platform which are developed using the same principles and modelling conventions but are led by different teams.10 These models currently cover another 16 L&MICs (see Table 3).
Table 3. Countries with coverage across families of models
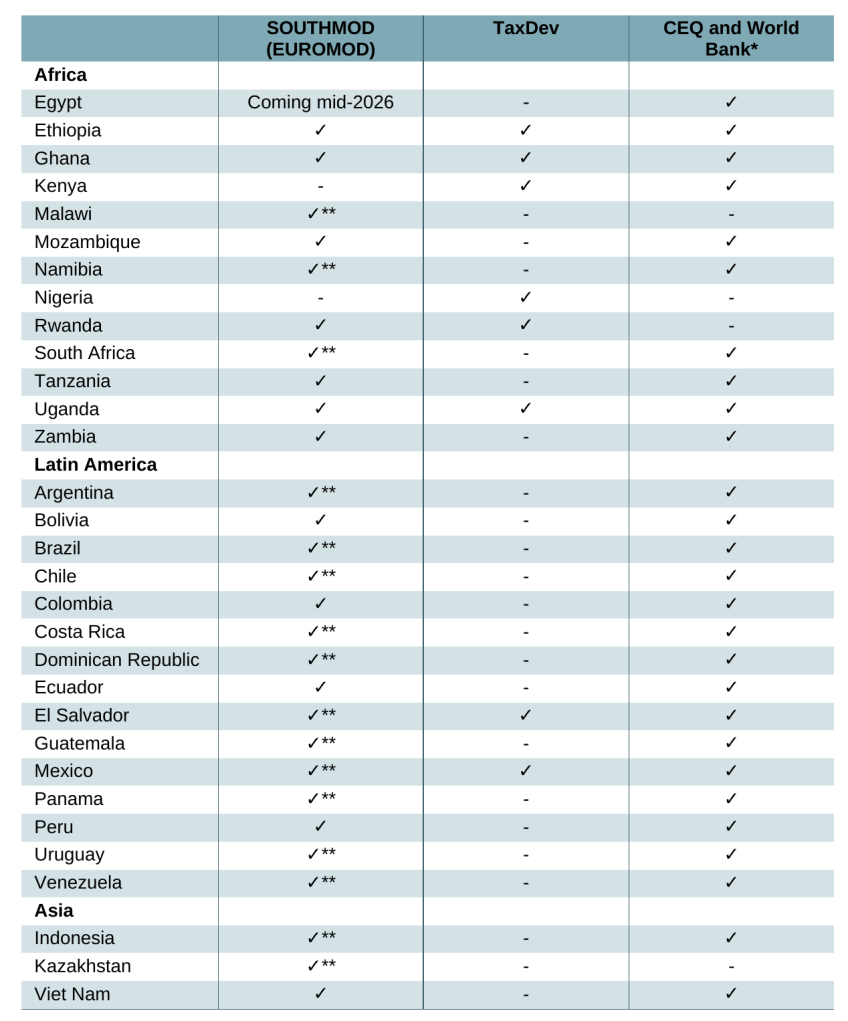
Note: The table lists countries covered or likely to be covered soon by SOUTHMOD or TaxDev. *The CEQ Institute and the World Bank have conducted FIA exercises or built microsimulation tools for a substantially larger set of countries. Other countries covered by CEQ/World Bank can be found in CEQ Data Center on Fiscal Redistribution (https://commitmentoequity.org/datacenter) and Sinha, Inchauste, and Narayan (2024). ** Models for these countries are developed and maintained by other teams (such as LATINMOD) or by SOUTHMOD collaborators rather than by the core team at UNU-WIDER.
TaxDev developed the first generation of its models for Mexico and El Salvador, which were later extended and adapted into a more flexible framework known as LATAX, allowing their application to other countries such as Colombia. Building on this approach, subsequent models for Ethiopia (EthTax) and Ghana (GhaTax) were developed in partnership with national governments. Partial models to estimate the distributional impact of specific reforms to individual taxes have been developed for Kenya, Nigeria, Rwanda, and Uganda.
At the time of writing, FIA exercises based on the CEQ methodology have been produced by the CEQ Institute for 83 countries, including some HICs in Europe and the US (CEQ Institute, 2024; Sinha, Inchauste, and Narayan, 2024).11 Results from most of these studies are publicly available in reports or research papers. The World Bank has conducted FIA exercises in 58 countries (World Bank, 2022). Some of these are done in collaboration with the CEQ Institute, but some of the analyses are conducted as part of the bank’s country missions and are often confidential and publicly unavailable. In addition to the FIAs, the World Bank has developed tailored MSMs for more than 50 developing countries since 2016, including around 20 African countries (World Bank, 2022, 2024).
Methodological aspects
Architecture
A key distinction between FIA and tax-benefit MSMs lies in their underlying analytical architecture and purpose – whether they are primarily designed to analyse the distributional impact of the existing fiscal system or to simulate counterfactual policy reforms. While all models rely primarily on nationally representative household surveys that have information on demographics, income, and consumption – allowing fiscal instruments to be analysed jointly – they differ fundamentally in how they calculate tax liabilities and benefit entitlements at the individual and household levels.
MSMs, such as those by TaxDev, SOUTHMOD, and the World Bank, use household and individual characteristics reported in household surveys, combined with specific policy rules about tax bases, tax rates, and eligibility criteria for cash transfers, to simulate the theoretical tax liabilities and benefit entitlements of individuals and households. They usually start from current policy rules to model the baseline system, but they also allow for the simulation of counterfactual policy scenarios in which any of the policy rules (including the tax rates and the tax base, as well as benefit eligibility and generosity) can be modified.
FIA, the approach taken by CEQ studies, also starts from household surveys but focuses primarily on analysing the redistributive effects of the existing fiscal system. The burden of taxation and the benefits of transfers in the existing system are allocated to individuals and households using different methods. First, data on actual tax payments and expenditure receipts directly observed in surveys are the most preferred source of information. Second, when only beneficiaries and taxpayers are directly identified in the survey, the tax and transfer amounts should be imputed based on the programme rules and effective tax rates and unit-level subsidies, derived from administrative data on aggregate revenues, expenditures, and the total number of taxpayers and recipients. Only in cases when the survey does not directly identify eligible individuals can policies be simulated or individuals identified using regression-based prediction or matching with alternative surveys.12 Therefore, in contrast to MSMs, simulation of entitlements and liabilities based on legislative rules is only one of the secondary methods used in FIA. As such, alternative policies can be evaluated in FIA only to some extent and only when simulation plays a bigger role.
Scope of fiscal instruments: taxes and spending covered
MSMs and FIAs typically focus on policies whose effects can be linked directly to individuals and households using relatively few assumptions. This includes personal direct taxes, downstream indirect taxes on final products, indirect subsidies on consumption goods, and selected cash and in-kind benefits.
The scope and level of detail of fiscal instruments covered, however, vary substantially across countries and models. Coverage depends critically on the quality of the available input microdata, including the granularity of income and expenditure information, as well as on the time and technical resources available for model development. As a result, while FIAs and some MSMs offer more comprehensive coverage of household-level taxes and transfers, others – including those developed by the World Bank or by TaxDev in selected countries – may include only a subset of the taxes and transfers covered. For example, a separate consumption model of VAT and excises or an income tax model may be developed where there is a particular policy interest in the partner countries.
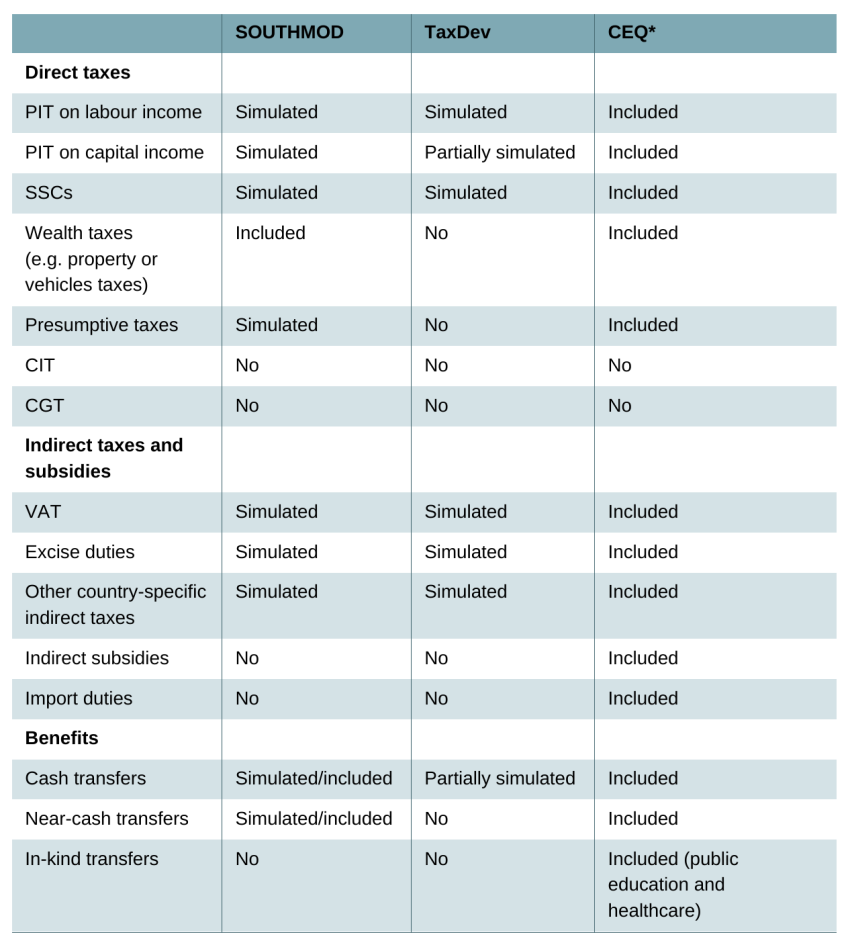
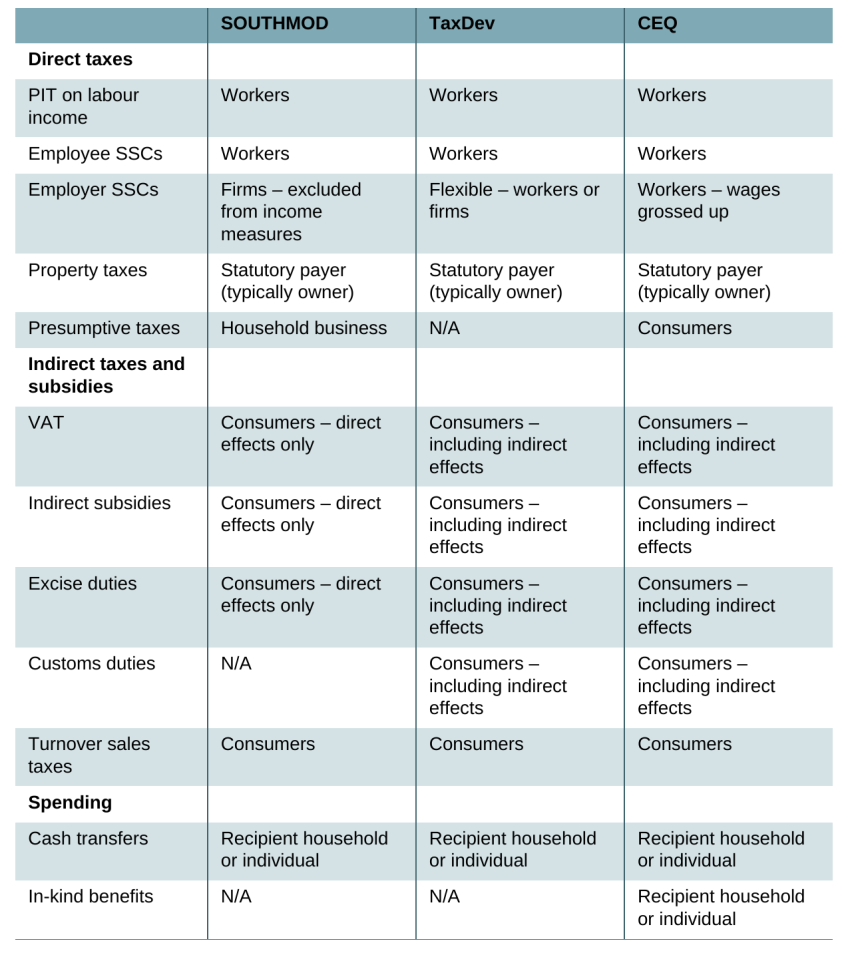
Direct taxes
All three model families cover personal direct taxes. This includes the PIT on labour income and, where underlying microdata permit, taxes on capital and rental income as well as employee, employer, and self-employed SSCs or other payroll taxes. CEQ offers a distinctive treatment of public pension contributions, which can be classified either as private savings – thus included in market or pre-fiscal income – or as direct taxes contributing to post-fiscal redistribution.
Where relevant in individual country contexts, most models also cover presumptive turnover taxes levied on self-employed individuals or small household businesses. In addition, some CEQ country studies include other presumptive direct taxes, such as agricultural income taxes or land use fees, for example in Ethiopia (see Hill et al., 2017; Mesfin and Gao, 2020) or Pakistan (Amjad, Carassco, and Meyer, 2025). On the other hand, presumptive withholding taxes (such as the vehicle income tax in Ghana or taxes on communication services in Pakistan), which are creditable if one files an income tax return and which are designed to collect some taxes from the informal sector, are usually not modelled by any of these approaches.
Wealth and property taxes are usually not simulated due to the lack of data on asset ownership and valuation in household surveys. Even though many surveys collect self-reported information on wealth and property taxes paid by households, which could be incorporated directly in the analysis, analysts need to be mindful of the data reliability. Depending on the country, SOUTHMOD covers recurrent property taxes, property transfer taxes, motor vehicle taxes, and wealth and inheritance taxes, but its scope is quite limited.13 CEQ generally includes self-reported property taxes in the analysis but, in order to promote cross-country comparability, it suggests not including one-off or extraordinary taxes such as on inheritance or lottery winnings. If this information is available in surveys and included in the analysis for the given country, market income needs to be adjusted by including the value of the tax on this irregular income (because CEQ does not include irregular income in its income measures). TaxDev models do not cover any self-reported taxes because the input surveys do not collect this information.
Direct taxes that are generally not covered by any of these models include corporate income taxes (CITs) and capital gains taxes (CGTs) because data on business ownership or the gains from the disposal of assets, which would allow these taxes to be linked to individual households without strong assumptions, are usually not available.14
Indirect taxes and subsidies
Downstream indirect taxes that are charged directly on household consumption are generally covered in all models. This usually includes the VAT, excise duties, and similar consumption taxes. Some country-specific turnover or other sales taxes (such as the VAT-related levies in Ghana) also tend to be included.
CEQ also includes indirect subsidies in its analyses, mostly on energy and fuel, but some country-specific subsidies are covered in individual studies – for example wheat subsidies in Ethiopia (Ambel, Tesfaye, and Yonis, 2022), fertiliser subsidies in Tanzania (Younger, Myamba, and Mdadila, 2016) or Ghana (Younger, Osei-Assibey, and Oppong, 2017), or water and agricultural input subsidies in Uganda (Jellema et al., 2016). SOUTHMOD covers indirect fuel subsidies in its public models for the years 2022–24 where applicable, and specific studies have separately modelled these policies even for earlier years (see Kalikeka et al., 2025). Earlier TaxDev template models for Latin American countries included the option to simulate price subsidies, but they are not covered in any of the existing models.
Upstream indirect taxes that are charged on firms’ inputs such as import duties and fuel taxes impact households mostly indirectly through the production process. These indirect effects of indirect taxes can be modelled through input-output linkages (more on this below). CEQ attempts to cover these upstream taxes where data are available. Earlier TaxDev models simulated import duties as well, but simulation is limited only to fuel duties and indirect effects of other taxes in the latest version of the models. SOUTHMOD currently does not cover these taxes and does not model indirect effects in the public models at all. Individual studies may incorporate these indirect effects outside of the main model, with aims to incorporate them properly in the future.
Table 4. Scope of fiscal instruments covered
Note: (Partially) simulated – based on policy rules (if data are available), Included – survey based or from other external data, without the option to model counterfactual policies. *CEQ FIA allocates aggregate revenue and expenditure to households (using policy rules and households’ characteristics), where simulating tax and benefits is just one allocation method. However, CEQ-based MSMs primarily simulate some of these instruments.
Benefits
Key non-contributory cash transfers are covered by most models. This applies primarily to the main targeted social assistance and safety net programmes, present in most L&MICs. Where the input data allow, these are directly simulated, but some MSMs must rely on self-reported values. In contrast, contributory transfers are usually not simulated in any model due to lack of data on work and contribution history. Where self-reported amounts are available in surveys, these transfers are usually included in the analysis (as part of household income or welfare measure). This applies especially to pension income.
SOUTHMOD also covers the monetary value of near-cash transfers in the countries where these are provided. These include programmes such as direct food provision, school feeding and uniform programmes, or the provision of some productive capital (such as a cow in Rwanda). Some instruments are simulated fully only based on household characteristics and some are partially simulated, combining self-reported participation in a programme with assumptions about the monetary value.
CEQ includes these as well and extends the analysis to broader in-kind benefits such as education and healthcare. The alternative scenarios that CEQ models provide, where pension contributions can be treated either as taxes or as savings, extend naturally to pension income itself. Pensions are treated either as government transfers or as deferred income respectively. These alternatives each provide a different picture about the extent of market inequality and government redistribution.
Input data
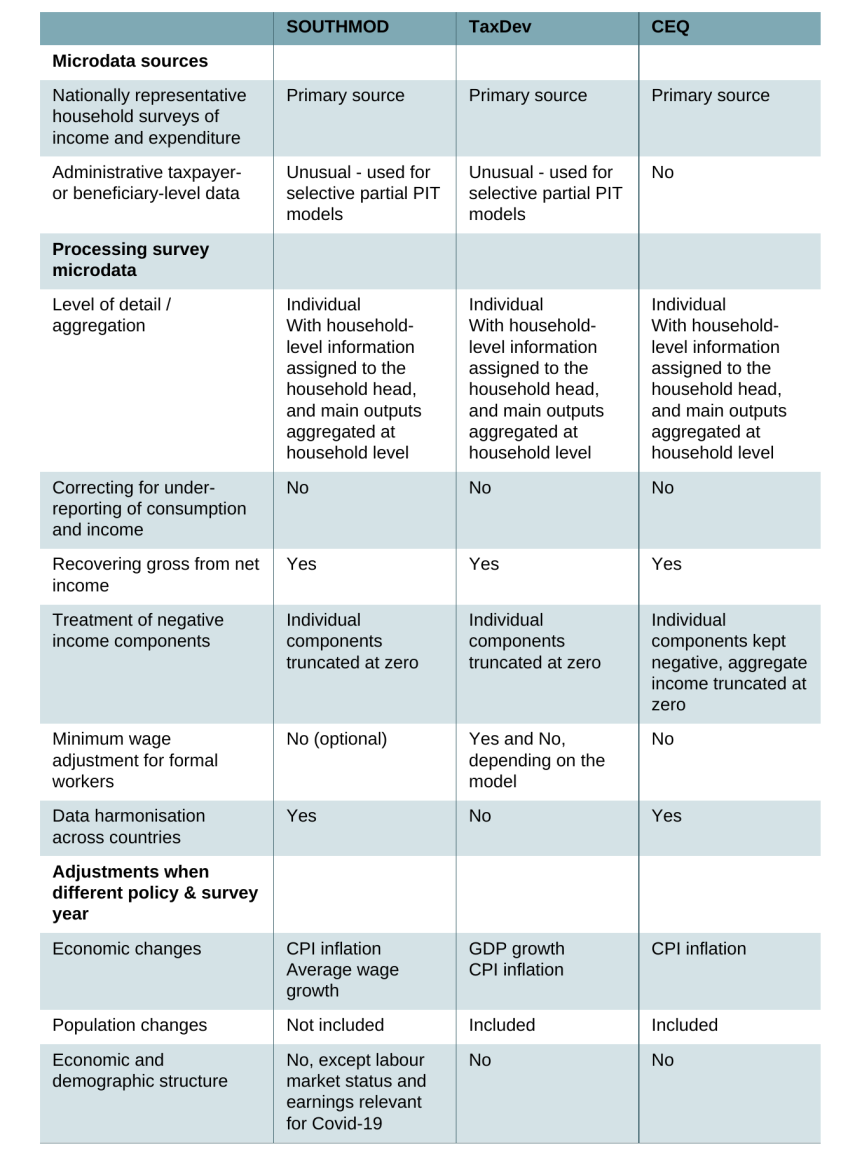
Microdata sources
All model families primarily rely on nationally representative household surveys that contain information on demographics, expenditure, and income of individuals and households. This allows taxes to be modelled on income and on consumption as well as benefits for the same household.
Administrative microdata are used more selectively. While they can improve the modelling of specific fiscal instruments – notably PITs – their use is typically limited by restricted access and by the lack of complementary information at the household and individual levels such as data on consumption, household structure, and information on households or individuals that do not typically interact with tax or benefit administrations. As a result, administrative data usually complement, rather than replace, survey data, and only for specific components of the fiscal system. In a few instances, the modelling initiatives have collaborated directly with country governments, enabling the use of administrative microdata for specific components of the tax system. This includes partial SOUTHMOD models in Uganda (UGAMOD-TAX), developed with the Uganda Revenue Authority (see Barugahara et al., 2025), and in South Africa (PITMOD), developed for internal use by the South African Revenue Service and the National Treasury (see Steyn et al., 2021). While TaxDev models for Ethiopia and Ghana have also been developed in partnership with MoFs and RAs, the use of administrative microdata within TaxDev MSMs has so far been limited given data availability issues, with Uganda being the main case where such data have been incorporated for PIT modelling.
Processing microdata
Cross-country differences in household survey design and in the quality of survey and administrative data – particularly in L&MICs – have important implications for model coverage, precision, and comparability across countries. Across model families, there are both commonalities and differences in how input data are adjusted and processed, reflecting underlying methodological choices and practical constraints. These can impact the resulting fiscal incidence estimates in different ways. In general, none of the model families systematically adjust for under-reporting of income or consumption relative to aggregate statistics, or for the under-representation of certain groups such as high-income individuals, which is commonly observed in nationally representative household surveys.15 Instead, consistency with aggregate statistics is typically assessed through validation checks and sensitivity analyses.16
SOUTHMOD models place particular emphasis on data harmonisation, partly driven by the requirements of the underlying EUROMOD software, which relies on standardised variables for built-in queries and cross-country comparability. This includes the use of common variable naming conventions, the harmonisation of key demographic variables (such as education levels) and labour market variables (such as economic status, occupation, industry), as well as the harmonisation of consumption expenditures according to the United Nations’ Classification of Individual Consumption According to Purpose (COICOP). CEQ also emphasises the importance of harmonising the underlying microdata using a common methodology to generate estimates of the impact of fiscal policy on inequality and poverty comparable across countries and over time. However, the allocation of taxes and transfers often requires a lot of judgement and discretion in individual countries depending on the quality of the data, which means that cross-country comparability should be interpreted with some caution. By contrast, TaxDev models, despite using some common approaches and assumptions, focus on capturing the specific details of the given country as accurately as possible, even at the expense of harmonisation and comparability across the different country models.
All model families use a broadly similar approach when only net incomes are observed, as is common in most African countries. Gross incomes are imputed by inverting the statutory tax rules in place at the time of data collection and, where necessary, by making assumptions about tax compliance. Some extreme outlier values are also manually adjusted in a similar way, while CEQ studies may also impute income components that were top-coded by the data provider.
Regarding the treatment of negative income recorded in the survey, CEQ retains negative values for individual income components, and only truncates aggregate income concepts at zero if their sum is negative. By contrast, both SOUTHMOD and TaxDev set all individual negative income components to zero. This is especially important for the case of self-employment or business income, which can result in a loss in any given period. While the CEQ approach implies that these losses are offset by other sources of income, the latter approach ignores any losses altogether.
Most models do not adjust self-reported earnings of workers identified as formal when these fall below the country’s statutory minimum wage. Earlier TaxDev models for Latin American countries adjusted earnings of all formal workers to at least the minimum wage. SOUTHMOD includes minimum wage adjustment as an option in some Latin American country models, although the default treatment is not to adjust wages. CEQ methodology does not explicitly address minimum wage adjustment; instead, it follows its general principle of relying on self-reported information without modification.
All models require input data to be set up at the individual level. However, in most household surveys, only work-related income (such as wages or pension income) is typically reported at the individual level. Unearned income (such as cash transfers, gifts in kind, or capital income), income from household businesses or self-production, and expenditures are measured only at the household level. Modelling therefore requires assigning household-level income or expenditure to specific individuals – usually the household head. The modelling results are then aggregated at the household level for poverty and incidence analysis, implicitly relying on the simplifying assumption of equal resource sharing (see the section on welfare measures below).
Some surveys ask about the household head directly, but in other countries this needs to be assumed based on some observable criteria (such as the highest income person in the household). SOUTHMOD models also impute relationships between household members in countries (especially in Africa), where surveys do not have this information directly available.
Adjusting for economic and population changes
Household survey data are available only with a delay and are, moreover, often collected infrequently in L&MICs. The most recent available survey may therefore lag several years behind the policy year of interest. As a result, monetary values and population weights may need to be adjusted to produce estimates that are relevant for contemporary policy analysis.
Across MSMs, monetary values observed in surveys are typically re-scaled to the policy year using observable aggregate indicators, while keeping the underlying distribution of income and consumption expenditure unchanged. TaxDev models use both gross domestic product (GDP) and consumer price indices (CPIs) to uprate income and expenditure variables. SOUTHMOD relies primarily on CPI-based uprating, with the level of granularity depending on data availability in each country. In some cases, only aggregate CPI is available while, in others, CPI series disaggregated by product groups can be used. In several Latin American countries, average wage growth is also used to uprate selected labour income components.
In contrast, because CEQ studies are often conducted for the same year as the survey data, uprating of monetary values is generally unnecessary. When more up-to-date estimates are required, CEQ recommends adjusting monetary values for inflation only but not for GDP growth, following applications such as Aristy-Escuder et al. (2018) for the Dominican Republic. There is limited publicly available documentation on how uprating is implemented in World Bank models that build on CEQ methodologies.
Approaches to population adjustments also differ across model families. TaxDev accounts for population growth between the survey year and the policy year by proportionally adjusting sample weights while holding the population structure fixed. SOUTHMOD considers population adjustments optional (if the changes are significant), but the functionality for implementing population growth is not built directly into its models. Instead, it requires manually adjusting the survey weights in the raw input data. As most CEQ studies analyse the fiscal system in the survey, no population adjustment is needed, although exceptions exist, such as the application in Aristy-Escuder et al. (2018) for the Dominican Republic.
Finally, neither TaxDev nor SOUTHMOD typically adjust input data to reflect structural changes in the economy such as shifts in labour market conditions. An exception emerged during the Covid-19 pandemic, when SOUTHMOD models built an option to simulate labour market shocks. Using user-defined transition probabilities, the model can randomly reallocate a share of individuals out of (full-time) work and reduce their earnings accordingly, while holding household composition constant. More recently, the UNU-WIDER team has experimented with nowcasting techniques to produce more up-to-date synthetic data in Ghana (see Lastunen et al., 2026), but these methods often fail to outperform simple uprating (Mahler, Aguilar, and Newhouse, 2022).
Table 5. Input data: sources, processing choices, and adjustments
Modelling assumptions
Understanding modelling assumptions is important as these can also affect estimates of fiscal incidence and simulated tax revenues and public spending. A central distinction in distributional analysis is between statutory incidence and economic incidence of taxes and transfers. Statutory incidence refers to who is legally responsible for paying a tax or receiving a transfer under the law. Economic incidence, by contrast, refers to who ultimately bears the burden of a tax or enjoys the benefit of a transfer once behavioural responses and price adjustments, including tax compliance, are taken into account. For example, a payroll tax may be statutorily levied on employers, but part of its burden may be shifted to workers through lower wages. Similarly, consumption taxes are collected by producers or retailers but are typically assumed to be passed fully on to consumers through higher prices.
As previously mentioned, all three families of models are static, which means they do not account for any potential changes in individuals’ and households’ behaviour in response to policy changes, and focus only on short-term policy impacts. The models do not account for general equilibrium effects either.
When modelling consumption, both TaxDev and SOUTHMOD models assume that the quantities of goods purchased do not change in response to changing disposable income – the so-called constant-quantities assumption. However, for some countries, SOUTHMOD contains an option to assume that households spend a fixed share of their budget on individual products – the so-called constant budget share assumption. This means that expenditure (and savings) changes proportionally to changes in income.
Incidence
All models make standard simplifying incidence assumptions to assign tax burdens and benefits to individuals and households.
In most cases, personal direct taxes and employee SSCs on wages and earned income are modelled as fully incident on workers. However, the modelling assumptions for employer SSCs and payroll taxes differ across the models. SOUTHMOD assumes employer SSCs are incident on firms and does not take them into account for the calculations of market income and household welfare measures. However, its models still simulate employer SSCs due under both the baseline and any reform scenarios. In contrast, CEQ assumes employer SSCs and payroll taxes to be fully incident on workers. It therefore calculates individuals’ market wages by ‘grossing up’ or summing their self-reported gross wages together with any employer contributions assumed to be paid on top of those wages. Given that CEQ studies mostly focus on modelling the status quo, they can ignore the empirically different short-run effects between employer contribution increases and cuts (see for example Hofer et al., 2015; Melguizo and González-Páramo, 2013). TaxDev models contain an option to switch between the two incidence options – for employer SSCs to be either fully incident on workers or on firms, which is helpful when simulating these alternative policy changes.
Table 6. Modelling assumptions: incidence
For property taxes, both CEQ and SOUTHMOD primarily use self-reported values from surveys. This implies that economic incidence follows the statutory incidence in the given country, which would usually be the owner. In cases where self-reported values are not available in the input data and the property taxes are meant to be simulated, CEQ assumes them to be incident on the owners of the property.
Generally, indirect taxes (or subsidies) are assumed to be fully incident on households as the final consumers across all families of models.17 TaxDev and CEQ use input-output tables to model the indirect (cascading) effects of VAT, excise duties, and (in the case of CEQ, where possible) import duties on intermediate inputs throughout the supply chain on final consumer prices. TaxDev models also contain the option to turn the simulation of these indirect effects on and off interactively. SOUTHMOD currently cannot simulate these indirect effects within its EUROMOD software models, but analysts can calculate effective tax rates for each good including indirect effects outside of the dedicated EUROMOD software and then feed them into the model manually for individual studies. According to SOUTHMOD experts, these effects may be incorporated in the main EUROMOD software models in the future.
When modelling excise duties (and partially also import duties), TaxDev models also consider retailer mark-ups and make assumptions about the size of these mark-ups to arrive at the ex-factory price as the tax base. SOUTHMOD models use the same tax base for excises as the one used for the VAT, though they generally account for the fact that VAT is paid on top of the excise duties.
The economic incidence treatment of turnover taxes varies across the model families and the different types of turnover tax. SOUTHMOD generally models presumptive business turnover taxes (intended to replace standard income taxation) as incident on households that own a small business, effectively reducing their disposable income. On the other hand, turnover sales taxes (charged on every consumer purchase), such as the turnover tax for VAT-unregistered businesses in Ethiopia and the unreclaimable levies in Ghana, are modelled as incident on consumers.18 The TaxDev model for Ghana also models the turnover-based levies as incident on consumers. The CEQ methodology is not explicit about the assumed incidence of turnover taxes, but Rossignolo (2018) models the provincial business turnover taxes in Argentina as incident on consumption, accounting for their cascading effect through every production stage in a simplified way.
Across models, transfers are usually assumed to be fully incident on the recipient household or individual, under no leakages or changes in inter-household transfers (that is, cash transfers increase recipient household income/consumption on a one-to-one basis). Having said this, the SOUTHMOD team recently also conducted modelling of social protection policies accounting for their differential administrative costs (see Lastunen, Zasova, and Rattenhuber, 2025). This applies to in-kind transfers covered by CEQ, which are assumed to fully benefit the recipient households.
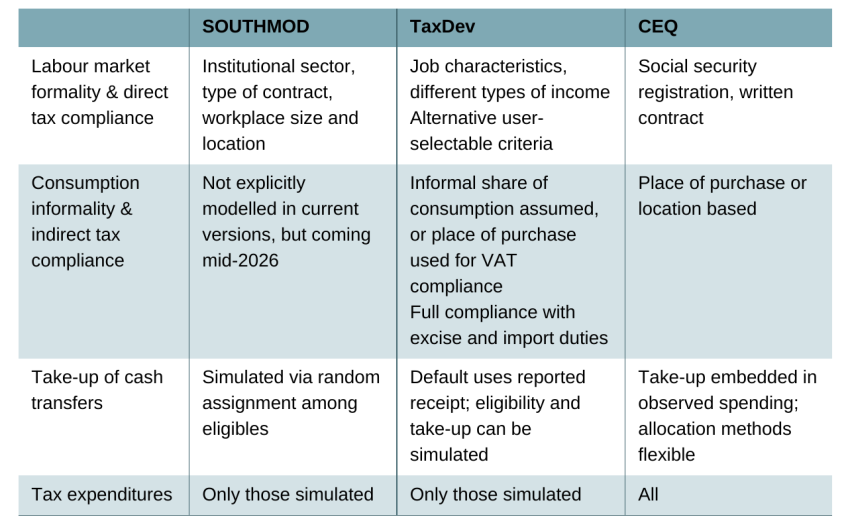
Compliance and policy coverage
MSMs make assumptions about the degree of informality in the economy and the subsequent tax compliance and the take-up rate of government transfers in order to simulate tax liabilities and benefit entitlement. By contrast, CEQ FIA primarily allocates observed aggregate revenues and expenditure, which already reflect the underlying compliance and take-up; survey data are used primarily to identify tax-paying and benefit-receiving households. However, in cases where simulation is used as the allocation method, CEQ equally emphasises the importance of incorporating assumptions about imperfect take-up, informality, and tax evasion. CEQ-based MSMs developed by the World Bank generally follow CEQ conventions but rely primarily on simulation of taxes and benefits over other allocation methods.
The same principles apply to the treatment of tax expenditures by the three approaches. MSMs by SOUTHMOD and TaxDev account only for those special regimes that can be directly simulated based on observable characteristics available in the input data. By contrast, aggregate revenues and individual tax payments used in CEQ studies reflect all tax expenditures and the resulting effective tax rates. However, if the revenues are allocated across the tax-paying population without accounting for differential take-up of tax expenditures, it will produce a relatively more equal distribution of incomes in cases where richer households capture a higher share of the tax expenditure.
SOUTHMOD modelling conventions recommend assuming full compliance with taxes and full take-up of benefits in the baseline. In practice, however, most countries explicitly account for labour market formality, using information either observed in or imputed from survey data. SOUTHMOD follows International Labour Organization conventions, relying on characteristics such as institutional sector (private or public), the type of contract, and workplace size and location to classify employment as formal or informal, and hence to determine whether labour income taxes are paid or not. CEQ similarly uses information on individuals’ registration with the social security system or the existence of a written employment contract to determine formality and compliance with direct taxes on their earnings. TaxDev also models labour market formality based on the job characteristics or the type of business (for enterprise income). Most of its models include multiple alternative definitions that analysts can choose from when running the models. Additionally, some income sources (such as from secondary jobs, agricultural activities, or self-employment) are considered to be completely untaxed in the baseline model, with the option to modify these assumptions to test the sensitivity of the simulated revenues.
When modelling compliance with income taxes, all of the model families focus on the final tax liability and often ignore any presumptive withholding income taxes that exist in some countries. These serve as advance tax payments based on some clearly observable characteristics (such as vehicle ownership) that are creditable when one files a tax return. However, given that most informal workers do not file, such withholding taxes usually serve as the final tax liability for the informal sector. Ignoring these can slightly change the distributional picture.
Different approaches are used to account for informality in consumption and compliance with indirect taxes. The simplest approach assumes that a constant share of final purchases is made from informal or non-tax-compliant stores. More granular empirically based approaches use household-reported information on the type of stores or place of purchase for different goods, geographic location (urban/rural), or a combination of these, allowing informal consumption to be proxied more accurately.
SOUTHMOD currently does not account for consumption informality in any of its country models. However, information on the place of purchase is collected in household surveys in a few countries, and this information is going to be incorporated into the upcoming public model release. In addition to the public models, some analysts have tried to account for consumption informality using information on the place of purchase in individual studies. For example, UNU-WIDER and TaxDev researchers are collaborating on a study of the distributional impacts of consumption taxes in Uganda using this information. CEQ uses information on the type of store, and in some cases the household’s location, to determine whether indirect taxes are paid on specific expenditures.
TaxDev approaches depend on the availability of data and the type of simulated tax. Household surveys in Ghana and Ethiopia do not include information on the place of purchase, so the models for these countries rely on simple assumptions about the share of consumption that is informal, calibrated to match simulated and actual aggregate VAT revenues. By contrast, the household survey in Mexico contained information on the place of purchase, which was used for a more accurate modelling of informal consumption. However, all TaxDev models assume full compliance with taxes collected during the production process at the ‘factory door’ (such as import and excise duties).
When modelling benefit non-take-up, SOUTHMOD prefers random assignment among the simulated eligible households rather than conditioning take-up on self-reported receipt of the transfer in the survey data. TaxDev models, by default, use the values reported directly in surveys, but they contain different options for simulating both the transfer eligibility and the amount based on other observable characteristics and policy rules. CEQ does not prescribe a single preferred approach: matched administrative data, self-reported receipt in surveys, or random allocation among modelled beneficiaries may all be used to match actual recipient numbers or expenditures with external official statistics.
Table 7. Modelling assumptions: compliance and policy coverage
Welfare measures
Welfare measures determine how households are ranked from poor to rich, how poverty and inequality are assessed, and how tax and transfers burdens are expressed relative to living standards. In MSMs and FIA, welfare is typically measured using either consumption or income, with each capturing different dimensions of economic wellbeing. Income-based measures reflect immediately available financial resources that can be utilised without drawing down savings or assets at a specific point in time. Consumption-based measures are often smoother over time (as consumers can borrow and save to avoid fluctuations in income from affecting their consumption) and may better reflect longer-run living standards. Consequently, the choice of welfare measure plays a central role in shaping fiscal incidence and distributional results: the same fiscal system can appear more or less progressive depending on whether welfare is measured using income or consumption.
Before describing the choices made by each family of models, it is important to note that there is no single ‘correct’ welfare measure in FIA or microsimulation. In practice, the choice between income and consumption varies across countries and model families and tends to reflect the country characteristics, in turn embedded in the design and focus of household surveys. HICs traditionally use income-based welfare measures. In highly formalised economies, households typically have relatively few, regular, and easily measurable sources of income, making income a reliable indicator of living standards. At the same time, widespread ownership of various durable goods complicates the measurement of consumption flows. Moreover, absolute poverty is usually less prevalent in these contexts, and distributional analysis therefore focuses primarily on relative poverty and inequality.
In contrast, L&MIC countries commonly rely on consumption-based welfare measures. The presence of informal labour markets, multiple and irregular income sources, and widespread reliance on subsistence agriculture make income difficult to measure, while consumption better reflects households’ ability to meet basic needs. In these contexts, absolute poverty and achieving minimum subsistence consumption levels are often of primary policy concern. This systematic pattern in the methodological choices underlying official poverty statistics across country income groups is documented by Mancini and Vecchi (2022). As shown in Figure 4, all low-income countries and around 90% of L&MICs use consumption as the welfare measure, while 91% of HICs rely on income-based measures.
Figure 4. Use of consumption versus income, by World Bank country income group
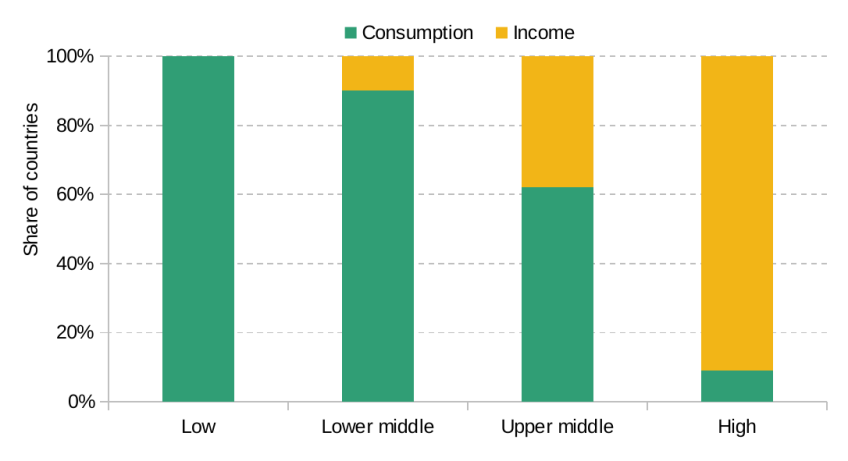
Source: Mancini and Vecchi (2022), Figure 3.2.
TaxDev uses consumption as the main welfare measure for all calculations. CEQ allows all users to choose between pre-fiscal market (also called original) income or post-fiscal income to rank households. Information on consumption can also be used to derive these CEQ income concepts, especially in contexts where income data are not directly available in surveys. In such cases, CEQ assumes that income is equal to expenditure. SOUTHMOD allows users to choose between extended disposable (i.e. post-fiscal) income and consumption as the welfare measure for ranking households, when consumption data are available.19 In practice, African countries include consumption information, while Latin American countries only provide income measures.
The welfare measure used to rank households is also used as the headline indicator for assessing policy impacts. However, because both TaxDev and SOUTHMOD work with the constant-quantities assumption, simulation of the impact of policy changes on consumption is only partial. While expenditure on individual products is assumed fixed, both models assume that aggregate consumption changes one to one with changes in disposable income.
How is the welfare measure of choice calculated?
All models include standard measures of regular original and market (pre-fiscal) income such as earnings, income from capital, private pensions, as well as regular private transfers. CEQ also offers two alternative scenarios where public pensions are treated either as deferred income or as a government transfer. However, the models differ in their treatment and inclusion of specific income or consumption components.
The models differ in their treatment of irregular and lump-sum income (such as capital gains, lottery winnings, severance pay). SOUTHMOD excludes irregular income from its standard disposable income concepts. CEQ similarly excludes this and other one-off income, for example derived from the sale of durables, from its income measures. However, when evaluating taxes on these extraordinary income sources (such as inheritance), it adds at least these tax payments to household income. On the contrary, TaxDev models include irregular income (such as insurance payouts) as part of their income measures, but they are not considered part of welfare, which is based on consumption.
The value of production for own consumption is generally included in all three types of models subject to data availability. Around 80% of CEQ studies (recorded in its database) include this information, and it is incorporated into pre-fiscal income. SOUTHMOD also includes home production in its default extended income measure used for the calculation of poverty and inequality, but Latin American countries do not have this information available. For TaxDev countries, this is included in the surveys as part of the consumption measure.
Table 8. Welfare measures
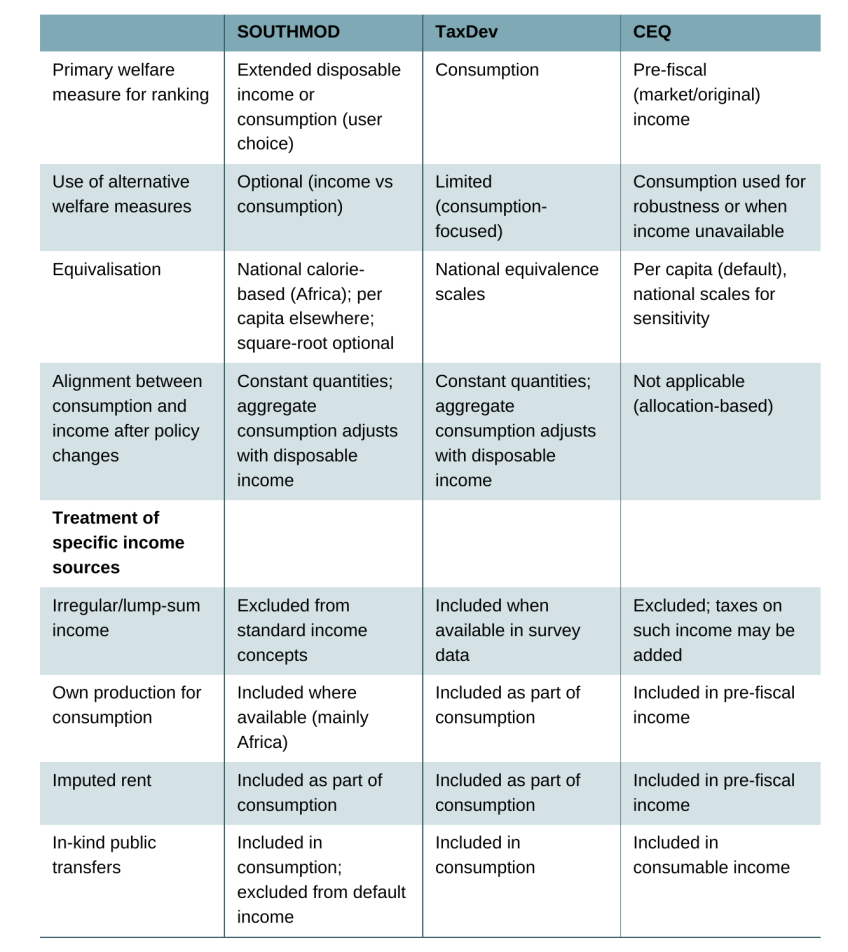
In-kind public transfers (such as free foods consumed in school) would generally be included in the consumption measure produced by statistical offices that underpin TaxDev models. SOUTHMOD includes these benefits in its consumption measure as well but does not include them in the default extended income measure used for inequality and poverty calculations. Moreover, some countries do not include health and education-related benefits at all even when they are available in the input surveys. CEQ includes in-kind benefits only in its final welfare measure – final income – which is not used for calculating poverty indicators.
Imputed rent is similarly part of consumption and would generally be included in TaxDev and some SOUTHMOD models, where it is included in the country’s benchmark welfare statistics and readily available from the input data. CEQ includes imputed rent in its pre-fiscal income measure and around 80% of studies in its database have this available. The value is sometimes directly observed in the survey data but is mostly derived using regression-based imputation.
Finally, all models measure welfare at the level of the household rather than the individual. This relies on the simplifying assumption of equal resource-sharing between household members and ignores intra-household inequality. However, the models differ in their approaches to equivalisation of household-level aggregates. SOUTHMOD applies national calorie-based equivalisation in African countries and per capita equivalisation elsewhere, while also offering an option to switch to square-root equivalisation. TaxDev similarly relies on national equivalence scales when adjusting for household size and composition. On the other hand, CEQ uses per capita measures to emphasise international comparability in the main analysis. However, national scales can be used for sensitivity analysis when these are available.
Validation and calibration
Validation is an essential step in FIA and MSM, as it helps assess how closely models replicate observed aggregated fiscal outcomes, poverty and inequality measures, identify data gaps, inform calibration, and guide the interpretation of the results. This is crucial for building policy credibility of the results produced and recommendations informed by these tools.
In practice, both FIA and MSMs rely on household survey data that are imperfect and typically fail to fully capture the entire population and all economic activities – notably households and individuals at the top of the income distribution and the consumption of vices. These shared data limitations affect distributional incidence and inequality estimates in similar ways across both approaches.
The differences in architecture and analytical approach between FIA and MSMs also shape how calibration and validation are conducted and how closely results match aggregate fiscal outcomes. CEQ analyses use different methods to allocate taxes and spending to individuals and households, including direct identification from surveys, imputation using unit tax (or subsidy) rates derived from administrative aggregates, and simulations using statutory rules. Once these allocations have been made, the resulting aggregates are systematically compared with external administrative data on revenues, expenditures, taxpayers, and programme beneficiaries. In cases where, for example, the number of benefit recipients identified in the survey is lower than in administrative registries, the modelled expenditure, redistributive impact, and coverage of that policy will be underestimated. CEQ therefore recommends using statistical imputation or prediction methods to identify and assign additional likely beneficiaries within the survey data in order to improve consistency with external aggregates. However, as already mentioned, the underlying income and spending data are generally not adjusted for under-reporting or under-representation, so modelled aggregate revenues will often fall short of official figures. What is more important is that the effective burden and its distribution are captured well.
By contrast, MSMs by SOUTHMOD and TaxDev primarily simulate taxes and benefits using household survey data and statutory rules. As a result, they will not necessarily reproduce aggregate fiscal outcomes exactly for every policy instrument. This reflects both data limitations and the need to rely on simplifying assumptions regarding incidence, take-up, informality, and tax compliance. As discussed in Section 2, while MSMs can be used to estimate aggregate fiscal outcomes, their main strength lies in analysing the ex-ante and ex-post distributional and poverty effects of counterfactual policy reforms. It is therefore more informative to focus on broader patterns, relative changes, and policy trade-offs rather than on exact revenue or expenditure totals.
Nevertheless, comparing MSMs’ outputs with external information remains essential for assessing their reliability and internal consistency. Validation can be done at both the micro and macro level. At the micro level, simulated benefits and taxes can be compared with values reported in the survey or with amounts that are legally feasible at the household or individual level. At the macro level, aggregate tax revenues, expenditures, and the number of taxpayers and beneficiaries can be compared with official statistics and administrative records.
We illustrate the extent of these discrepancies by examining the revenue ‘accuracy’ for selected countries for both TaxDev and SOUTHMOD models.20 The TaxDev model for Ethiopia simulates 93% of actual VAT revenues with the baseline informality assumption, and simulation of excise and import duties has a discrepancy of less than 5%. The simulation of PIT on employment income captures only three-quarters (78%) of actual revenue in the baseline but simulates almost twice (183%) the actual revenue from self-employment taxes. The simulation of social assistance captures only 40% of the actual spending. The model for Ghana over-simulates PIT by 17% and captures 91% of actual VAT revenues. However, only around three-quarters of revenue from the associated levies is simulated. The simulation of fuel taxes and other excises captures only around 80% and 35% of actual revenues respectively.
The results for individual SOUTHMOD countries vary significantly, which highlights the differences in the quality of the underlying input data. Details of the validation exercises for each country are beyond the scope of this report and can be found in the individual country reports, but some general patterns can be described. SOUTHMOD models generally under-simulate VAT revenues to a substantially greater extent than TaxDev models, typically capturing 50% or less of actual revenue in most countries. PIT revenues are usually also under-simulated, but the discrepancy varies significantly across countries, from capturing around 90% of actual revenues in Ecuador or Rwanda to just around 20% in Peru.
In light of the initial validation results, simulations of selected policies can be adjusted – for example by calibrating the assumed tax compliance or benefit take-up rate – to more closely match official aggregates. For example, SOUTHMOD models often calibrate the simulation of cash and near-cash transfers to external data using random assignment self-reported participation in the programme. TaxDev models calibrate the share of commodity purchases assumed to be done in formal outlets and hence subject to consumption taxes to match simulated indirect tax revenues with official statistics.
Finally, simulations can be run under alternative sets of assumptions to assess the sensitivity of the results. For example, earlier TaxDev work on Mexican tax reforms produced alternative estimates by accounting for missing income using different assumptions (see Abramovsky and Phillips, 2015).
Outputs and summary statistics
There are important differences across families of models in terms of the indicators they produce to summarise the distributional, poverty, and inequality effects of existing policies and policy changes, and how these indicators are presented. Some of these choices can qualitatively affect the distributional results and hence should be considered when understanding differences in the results for the same policy across models for a given country.
A key issue in assessing the distributional impact of taxes is how to calculate proportional effects for direct and indirect taxes – specifically, whether to use consumption or income as the denominator. This choice is closely related to the welfare measure used to rank households and may depend on the policy change being considered. Income is typically used as the denominator for direct taxes and transfers. However, for indirect taxes, using income can overstate regressivity. This is because some households with temporarily low incomes may have higher long-run incomes or resources, which is often reflected in consumption expenditure temporarily exceeding current income. When evaluating complex reforms involving both direct and indirect tax changes, analysts need to choose a denominator, but it is good practice to present results using both approaches.
Table 9. Indicators and summary statistics
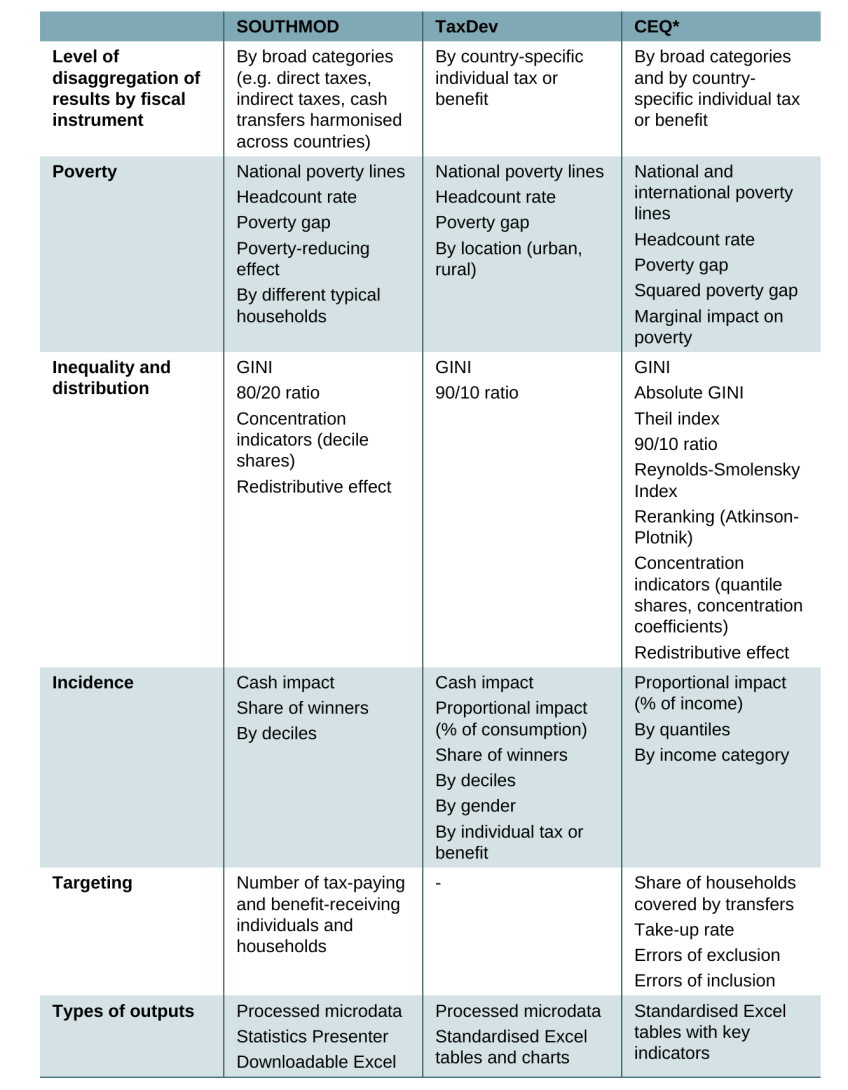
Note: Different modelling approaches may name these indicators differently.
As consumption is generally considered a better proxy for lifetime resources, TaxDev uses consumption as the default denominator for both direct and indirect taxes and cash transfers. CEQ suggests rescaling indirect taxes such that their proportion of income is equal to their proportion of consumption when income is used as the observed (primary) welfare measure. SOUTHMOD models’ default Statistics Presenter does not currently offer incidence results and proportional effects of policies, allowing users to choose how to compute them.
TaxDev provides detailed microdata with the simulated results and summarises the main distributional indicators in a standardised Excel format. This includes impacts on poverty (headcount and gap measures, disaggregated by locality) and inequality (GINI and 90/10 ratio), impacts across deciles of equivalised consumption (both cash and proportional) as well as revenue and spending estimates (tax revenues and benefit expenditures disaggregated by tax and benefit type). It also includes impacts based on the gender of household head and the percentage of winners and losers from a reform (relative to the baseline).
SOUTHMOD also provides detailed microdata for further analysis as well as a comprehensive set of standardised indicators. These can be viewed via the EUROMOD software’s own interface using the so-called Statistics Presenter, and the results displayed there can then be easily downloaded in Excel format as well. This includes fiscal estimates disaggregated into standardised categories of taxes and benefits, and the number and share of individuals and households paying certain taxes or receiving certain benefits. Poverty measures include the headline rate and gap, disaggregated by different types of standardised households. Several inequality measures include GINI, 80/20 ratio, or decile shares. However, it currently does not include proportional impacts by deciles (average cash impacts can be derived from the decile shares). SOUTHMOD also calculates the redistributive and poverty-reducing effects of the system (relative to a scenario with no taxes and benefits).
CEQ provides an extensive list of standardised indicators across all studies. They are summarised and presented in one Excel overview for easy comparison across countries. At the same time, it has an online repository of all the detailed results from all studies.
Inequality measures include GINI coefficients, Theil index, 90/10 ratio, absolute GINI, vertical inequality (Reynolds-Smolensky Index) and reranking (Atkinson-Plotnik) indicators, decile shares, and the concentration coefficients of different taxes and benefits to measure their progressivity.
Poverty measures include headcount ratio, poverty gap, and squared poverty gap ratios based on international poverty lines. These are expressed in both 2005 purchasing power parity $ (PPP$) and 2011 PPP$, mostly due to the time of the studies, but newer studies (especially by the World Bank) also tend to use more up-to-date poverty lines.
Because all inequality and poverty measures are usually estimated separately for each of the measures of income, CEQ studies also provide marginal impacts on poverty and inequality of the entire fiscal system and individual policies. The marginal impact of the system on inequality is also enshrined in the SDGs as Indicator 10.4.2. under SDG 10 – Reduce inequality within and among countries.
Additional measures include impacts by income deciles or different measures or the efficiency of targeting of the transfer system. This includes coverage of households (i.e. the share receiving transfers) by different transfers and their take-up rates, the share of poor households not receiving specific transfers (errors of exclusion), and the share of non-poor households receiving them (errors of inclusion or leakages).
Wider issues
The value of these distributional analysis tools depends not only on their underlying methodological choices but also on the ability of policymakers and researchers to access them with ease and use them regularly, rapidly, and reliably. Embedding these tools takes time, and these initiatives take different approaches to engaging with local stakeholders, developing internal analytical capacity, and helping build the demand for distributional analysis.
Availability and accessibility
This section considers the ability of different users to access the models and the underlying input data. It also looks at any additional materials that can help users familiarise themselves with the models and embed their use into policy analysis.
Availability of data and models
SOUTHMOD models are freely available for non-commercial research use. Access must be requested through an online form and approved, but the process is quite easy and the response relatively quick. Processed country-specific input data are also available upon request together with the models, but some countries do not share the data (only the Stata do-files used to process them) due to restrictions from data providers. People wishing to use these models need to contact the data providers directly to secure access to the raw input data, and then process the data themselves using the provided do-files.
For the wider family of TaxDev models, access is not standardised. The generic LATAX model is freely available online, including do-files used to process input data and processed survey data for Mexico. More recent models for Ghana and Ethiopia are developed in collaboration with government staff for internal purposes. They are therefore not freely available for public users at the moment. The primary household survey data which underlie the models are available publicly and access can be requested from the respective national statistical offices. The MoF in Ghana is also currently considering making its model available to the local research community if a collaboration agreement is signed in order to support maintenance of the model.
The CEQ initiative has a freely accessible online repository that contains do-file codes used for the FIA in each country in its database. Moreover, around 30 countries currently also share the full microdata used for their FIA on the CEQ website. According to World Bank (2022), World Bank microsimulation tools are often not publicly available except for some online tools such as for the VAT in Brazil or some codes available through the Equity Poverty Lab repository through GitHub.21 They are often private and restricted for use only by the World Bank and its partners.
Transparency and documentation
SOUTHMOD provides clear and transparent documentation of different aspects of its models. This includes the Modelling Conventions, which aim to harmonise the processing of input data, modelling approaches and assumptions, as well as the outputs and approaches to quality assurance. A detailed User Manual is available to guide users through each step from the installation of the software and the user interface, through modelling of policies to producing and interpreting results. The model for each country is accompanied by a detailed Country Report, which documents the tax-benefit system in the country and the modelling assumptions and input data used, and then validates the accuracy of the results against external statistics. There is also a separate Data Requirement Document for each country that lists all the available variables and provides the details on the individual steps in processing the input survey data.
TaxDev models also come along with detailed documentation explaining the technical considerations behind the models, instructions on how to use them, and guidance for interpreting the results. However, unlike the other model families, there are no attempts to harmonise documentation, and approaches differ across countries in order to best meet different partners’ needs. Documentation and a manual for the LATAX model is freely available online, but information on the latest models has not been published and is only available for internal use or upon request.
CEQ provides extensive documentation of its methodology in the CEQ Handbook, but the implementation of the methodology is different in each country studied. Reports for each individual FIA often discuss the details of the approach taken in the analysis, but the level of detail varies considerably across individual studies. There are also no standardised documents on the input data used and how they are processed.
To the best of our knowledge, documentation of the World Bank MSMs is not publicly available.
Training materials
SOUTHMOD provides an extensive set of training materials. Users can register for a free online 10-module training course available upon registration. In-person training and modelling retreats, including for government analysts, are delivered through national teams and UNU-WIDER, often in partnership with other organisations in individual countries and on an ad-hoc basis. There are also country-specific exercises with solutions available for some of the SOUTHMOD countries and a help sheet that summarises the software’s main functions. SOUTHMOD users can then also benefit from training resources provided by the EUROMOD team. The JRC organises regular (online and in-person) training that explains the software interface and modelling principles but focuses on European models. Its training materials and slides are also available online.
TaxDev focuses on tailored training of government staff through in-person and practical hands-on sessions. Training materials, including presentation slides and interactive exercises, have been developed for these sessions but they are always tailored to the country and the target audience. No standardised training materials or training to external users of the models can be provided.
The CEQ Institute and the World Bank have both provided in-person training on FIA during their engagements with governments. The World Bank also provides training on its MSMs, but this is decentralised rather than standardised and organised by individual experts working in the specific countries, reflecting the needs and requests from the host countries. The CEQ Institute provides training on FIA also to non-governmental researchers in local universities, civil society organisations, or similar (World Bank, 2022).
Software requirements, user interface
SOUTHMOD uses a dedicated EUROMOD software that was initially developed by ISER in Essex and is now maintained and updated by the JRC. Part of the EUROMOD software is SOUTHMOD specific and loads only if a SOUTHMOD country is selected. The software is freely available from the EUROMOD website and has an open-source code, but the programme currently only runs on Windows. It has its dedicated language and a predefined set of commands and options that the users can choose from, but which require harmonised variables and input data in a specific format. There are also libraries that enable the models to be run from Stata, Python, and R. The software enables results to be analysed directly through its interface and most of the summary statistics can then be downloaded in an Excel format as well. Microdata with simulated results in a delimited text format are also produced and can then be imported and analysed further in a dedicated statistical software.
TaxDev models are based primarily on Stata. Earlier models rely on only Stata, including for setting up the policy parameters. A more recent version of the model for Ghana now uses a front-end Excel interface with which the users interact and set simulation parameters, and the calculations are then still done in Stata. Once the calculations are completed, the detailed microdata are saved in Stata format for further analysis, and summary results are outputted into four standardised Excel files for easy interpretation.
CEQ FIAs are usually done using Stata. The CEQ Institute provides some standardised do-file templates and ado-file programmes for practitioners to use, but they are, in principle, free to use different platforms such as R, Python, or others as well. Standardised outputs are then recorded and shared in Excel. Where microdata are available, these are shared in easily readable delimited text formats.
CEQ-based World Bank models are currently developed with two different approaches. The first uses an Excel dashboard combined with Stata calculations running in the background that allow for a more detailed adjustment of individual policies. The second uses a dedicated online tool based on R Shiny, which is easier for users without any technical background (World Bank, 2022).
Sustainability and local ownership
This section looks at the target audience and the support available to embed the tools in regular policymaking, research, and public debate.
Maintenance and regular (data, baseline policy) updates
SOUTHMOD is the only family of models that has been regularly updated and maintained. At the end of Phase 2, models for each country were fully updated and covered the baseline policies up to the year 2023. The project is currently in Phase 3 with funding secured through 2027. An update of the baseline policies covering 2024 has recently been published and will be updated regularly on an annual basis. The availability of new input data depends on whether new surveys are conducted in the individual countries.
The TaxDev model for Ghana is regularly used and updated to reflect new policy changes. In contrast, the Ethiopia model has not been updated for several years, largely due to limited capacity and its lack of use within the MoF. The LATAX model now primarily serves as a template that researchers and analysts can adapt and update for their own purposes, and it is no longer actively maintained.
CEQ FIAs are often one-off exercises at a single point in time, but multiple studies in different years have been conducted in a subset of countries. Some analyses are conducted for specific research or policy projects for which they may be updated or refined depending on the type of policy question (e.g. Lustig, Martinez-Pabon, and Pessino, 2025). The approach of the World Bank to updating its MSMs varies across countries. Many models are developed for a specific mission or an analysis of a given reform, and it is then left to the host governments to potentially maintain the models. However, in some countries, such as Indonesia, the engagement is ongoing, and continued interest from the government means the model is being regularly updated (World Bank, 2022).
Local community and take-up by researchers and policymakers
SOUTHMOD is already working actively with local researchers, universities, or research institutes to develop the models in most countries. The collaborations have also resulted in some published research using the models. The core team at UNU-WIDER is also actively promoting take-up of the models among RAs and MoFs, with some success.
TaxDev models are developed in collaboration with MoFs, who are the primary owners and users. The model is most actively used for tax policy analysis in Ghana. Published studies on the distributional analysis of taxes in Ghana using this model (such as Iddrisu et al., 2023) have sparked interest from the local research community and civil society organisations in using this tool. However, the models are not currently available for such use due to their use for internal government policy analysis. On the other hand, the publicly available LATAX model has been downloaded many times and has attracted users from across Asia, Africa, and Europe.
The CEQ Institute developed Fiscal Equity Labs in Argentina, Brazil, and Mexico to bring together researchers at local universities to help with updating and disseminating FIA. The institute focuses primarily on building capacity in the civil society and supporting independent non-governmental analysis. On the other hand, the World Bank works predominantly with governmental agencies as part of technical assistance missions and develops in-house models and builds capacity for governments (World Bank, 2022).
Expansion to new countries
This section has so far talked about sustaining existing models. However, there are many countries currently not covered by any of the three initiatives. Even though all the initiatives have templates and harmonised approaches that can ease the process, building new tools from scratch for new countries is costly and takes a long time. It requires understanding and processing local input survey data, and learning and then modelling the details of individual policies. As all three of the approaches discussed here demonstrate, this is usually a joint effort based on collaboration and active engagement between local teams who bring the local knowledge and external researchers with technical expertise. Expanding to new countries therefore depends on the demand from the host country as well as on the funding available for external experts to support this.
Even though all three of the initiatives generally build comprehensive tools covering most taxes and benefits, successful adoption often requires a gradual and pragmatic approach. Countries do not need to begin with highly complex models covering the entire fiscal system. Starting with simple analyses covering only a few policy instruments can already provide valuable insights and help build internal capacity and external demand for distributional analysis. These models can then be expanded over time as distributional analysis becomes increasingly embedded in policymaking and public discourse.
Table 10. Wider issues
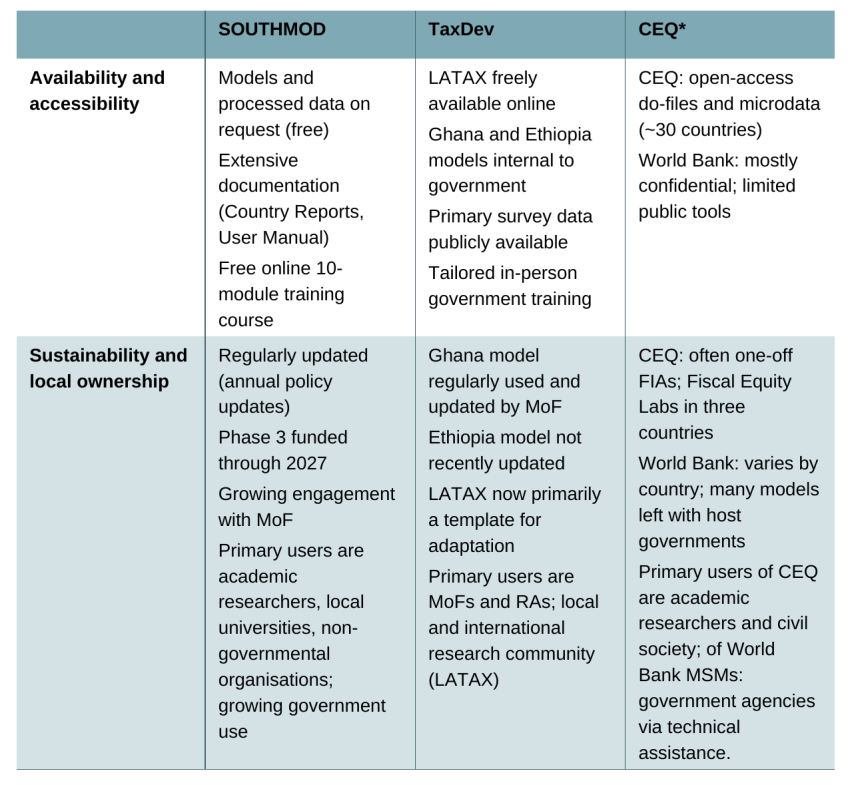
5. Key takeaways
Generating high-quality evidence on the distributional impact of fiscal policies and producing credible projections of the effects of policy reforms are increasingly important for national development strategies, medium-term fiscal frameworks, and effective coordination on shared distributional and poverty reduction objectives between MoFs and sectoral ministries. Distributional analysis can help policymakers move beyond assessing individual taxes or expenditures in isolation and instead evaluate packages of reforms, trade-offs across objectives, and the combined effects of revenue and spending measures on different population groups. As fiscal systems become more complex and governments face tighter fiscal constraints, integrating distributional analysis into routine policymaking processes becomes increasingly valuable.
This report compared three broad families of tools that have been developed and applied in L&MICs to support such analysis: CEQ-style FIAs and MSMs such as SOUTHMOD and TaxDev. The comparison reveals substantial common ground across approaches, but also important methodological, practical, and institutional differences.
First, no single model is best suited to all purposes. FIAs and MSMs should often be seen as complementary rather than competing approaches. FIA frameworks such as CEQ are particularly valuable for analysing the incidence of a broad range of fiscal instruments, including direct and indirect taxes, cash transfers, subsidies, and in-kind benefits such as education and health spending, and for assessing the redistributive profile of existing fiscal systems. MSMs are particularly well suited to simulating counterfactual policy reforms and analysing how changes in tax and benefit rules affect different households before reforms are implemented. In practice, countries may benefit from combining elements of both approaches over time. FIA and MSM development can also be sequential rather than alternative strategies. An FIA exercise may help establish the demand, institutional partnerships, and data infrastructure needed for the later development of an MSM.
Second, embedding distributional analysis tools within policymaking institutions and processes is as important as the technical model itself. The usefulness of these tools depends not only on methodological sophistication but also on whether governments and other local users can use them regularly, rapidly, and credibly during budget preparation and policy negotiations. Building sustained capacity within the MoF, RA, and sector ministries is therefore critical. Identifying policy champions and technical experts inside government institutions can help ensure that these tools become part of routine fiscal analysis rather than one-off academic exercises. In many countries, FIA and MSM initiatives initially emerge through donor-funded technical assistance, international organisations, or research collaborations. However, their long-term value depends on whether governments develop the institutional capacity, ownership, and incentives to maintain and use these tools regularly in policymaking.
Third, successful adoption often requires a gradual and pragmatic approach. Countries do not need to begin with highly complex models covering the entire fiscal system. Starting with simple analyses using household survey microdata and focusing on a subset of key taxes or transfers can already provide valuable insights and help build institutional familiarity with distributional analysis. Over time, models can be expanded to incorporate additional fiscal instruments, administrative data, behavioural assumptions, or indirect effects through production chains.
A further practical consideration is ensuring consistency between FIA and MSM outputs and official national poverty and inequality measurement frameworks, including the definition of welfare aggregates (income or consumption), equivalence scales, and poverty lines. Alignment with national statistical practices is important for policy credibility and comparability with official indicators.
For policymakers starting from scratch, one practical option is to explore the development of an MSM capable of supporting both FIA and the simulation of past and future reforms. Approaches such as SOUTHMOD may provide useful institutional models because they combine technical model development with collaboration between local researchers and government counterparts, helping to embed country-specific expertise and policy ownership. Existing applications in countries such as Uganda and South Africa illustrate how these models can gradually evolve to address specific government priorities, including excise reforms, PIT thresholds, PAYE reforms based on administrative payroll data, or the indirect effects of VAT and excise duties through input-output linkages. The approach taken by TaxDev may be more appropriate for users interested in a tailored approach that enables more complex analyses. Lastly, countries interested in analysing a broader set of fiscal instruments – including in-kind education and health benefits alongside taxes and cash transfers – may wish to consider CEQ-style FIA approaches, particularly where sufficient resources and institutional partnerships are available to support the required data collection, reconciliation, and analysis.
Finally, the long-term effectiveness of these tools also depends on whether they contribute to broader national analytical capacity, including among universities, research institutes, and civil society organisations. Collaborative approaches that encourage shared use, transparency, and local adaptation may help strengthen the wider fiscal policy ecosystem and support more informed and inclusive fiscal policy debates over time.
References
Abramovsky, L., Attanasio, O. and Phillips, D., 2015. Value added tax policy and the case for uniformity: empirical evidence from Mexico. IFS, Working Paper W15/08.
Abramovsky, L., Bird, N., Harris, T., Keable-Elliot, I. and Molla, K., 2018. ETHTAX: a tax microsimulation model for Ethiopia. IFS report (confidential).
Abramovsky, L. and Phillips, D., 2015. A tax micro-simulator for Mexico (MEXTAX) and its application to the 2010 tax reforms. IFS, Working Paper W15/23.
Abramovsky, L. and Rattenhuber, P., 2024. Gendered fiscal incidence analysis and tax-benefit microsimulation models: overview, opportunities, and caveats. Presentation, London: UNU-WIDER and IFS, https://doi.org/10.1920/ps.ifs.2024.1312.
Ambel, A. A., Tesfaye, W. M. and Yonis, M. B., 2022. A gendered fiscal incidence analysis for Ethiopia: evidence from individual-level data. World Bank Policy Research Working Paper 10130.
Amjad, B., Carassco, H., and Meyer, M., 2025. The effects of taxes and transfers on inequality and poverty in Pakistan. World Bank, https://doi.org/10.1596/43125.
Amjad, B., Lustig, N. and Popova, D., 2024. Distributional impact of fiscal policies: a survey of methodological approaches. AFD Research Papers.
Aristy-Escuder, J., Cabrera, M., Moreno Dodson, B. and Sánchez-Martin, M. E., 2018. The Dominican Republic: fiscal policy, income redistribution, and poverty reduction. In N. Lustig (ed.), Commitment to Equity Handbook: Estimating the Impact of Fiscal Policy on Inequality and Poverty, Brookings Institution Press and CEQ Institute–Tulane University.
Barugahara, T.K., Lastunen, J., Noble, M., Ayo, J.O., 2025. UGAMOD-TAX: a microsimulation model of taxation in Uganda: Model and data documentation. WIDER Technical Note 2025/3. UNU-WIDER.
Bourguignon, F. and Spadaro, A., 2006. Microsimulation as a tool for evaluating redistribution policies. Journal of Economic Inequality, 4, 77–106, https://doi.org/10.1007/s10888-005-9012-6.
CEQ Institute, 2024. CEQ Data Center on Fiscal Redistribution. CEQ Institute, Tulane University.
Colombo, G., 2018. Linking CGE and microsimulation models: a comparison of different approaches. International Journal of Microsimulation, 3(1), 72–91, https://doi.org/10.34196/ijm.00026.
Del Carmen, G., Garriga, S., Ponce, W. and Scot, T., 2025. Two decades of top income shares in Honduras. Journal of Public Economics, 246(C), https://doi.org/10.1016/j.jpubeco.2025.105362.
Enami, A., Higgins, S. and Lustig, N., 2022a. Allocating taxes and transfers and constructing income concepts. In N. Lustig (ed.), Commitment to Equity Handbook: Estimating the Impact of Fiscal Policy on Inequality and Poverty, Brookings Institution Press and CEQ Institute–Tulane University.
Enami, A., Larroulet, P. and Lustig, N., 2022b. CEQ Desktop Tax Simulator. In N. Lustig (ed.), Commitment to Equity Handbook: Estimating the Impact of Fiscal Policy on Inequality and Poverty, Brookings Institution Press and CEQ Institute–Tulane University.
Hill, R., Inchauste, G., Lustig, N., Tsehaye, E. and Woldehanna, T., 2017. A fiscal incidence analysis for Ethiopia. CEQ Working Paper 41.
Hofer, H., Hyee, R., Loretz, S., Müllbacher, S., Baldini, M., Gallo, G., Styczyńska, I., Aydilek, G., Valkonen, T., Adam, S. and Philips, D., 2015. Study on the effects and incidence of labour taxation. Taxation Papers, Working Paper No. 56. Luxembourg: Publications Office of the European Union.
Iddrisu, A. M., Phillips, D., Chackson, B. K. and Blanchard, T., 2023. Distributional analysis of Ghana’s tax system. Institute for Fiscal Studies (IFS) and Ministry of Finance, Ghana.
Jara, H. X., Gasior, K., Lastunen, J. and Rattenhuber, P., 2026. The emergence of tax-benefit microsimulation models in the Global South: The experience of SAMOD, SOUTHMOD and EUROMOD-based models for Latin America. WIDER working paper, forthcoming. UNU-WIDER.
Jara, H. X. and Varela M., 2019. Tax-benefit microsimulation and income redistribution in Ecuador. International Journal of Microsimulation, 12(1), 52–82, https://doi.org/10.34196/ijm.00194.
Jellema, J., Lustig, N., Haas, A. and Wolf, S., 2016. The impact of taxes, transfers, and subsidies on inequality and poverty in Uganda. CEQ Working Paper 53.
Jouste, M., Barugahara, T. K., Ayo, J. O., Pirttilä, J. and Rattenhuber, P., 2024. Taxpayer response to greater progressivity: evidence from personal income tax reform in Uganda. International Tax and Public Finance, 32, 1177–212, https://doi.org/10.1007/s10797-024-09861-w.
Kalikeka, M., Mwiya, I., Bowa, J., Chilala, E. and Musonda, E., 2025. Assessing the impact of fuel subsidies on the poor and vulnerable. SOUTHMOD Policy Note.
Lastunen, J., de Mahieu, A., Gasior, K., Jara, H.X. and Pirttilä, J., 2024. Microsimulation of tax-benefit systems in the Global South: a comparative assessment. WIDER Working Paper 2024/35. UNU-WIDER, https://doi.org/10.35188/UNU-WIDER/2024/439-9.
Lastunen, J., Dietrich, S., Rattenhuber, P., Adu-Ababio, K., Baah, P., Goriola, O. and Bay, B., 2026. Synthetic data and AI in microsimulation models: a feasibility study using GHAMOD. WIDER Technical Note. UNU-WIDER, https://doi.org/10.35188/UNU-WIDER/ATZV1858.
Lastunen, J., Zasova, A. and Rattenhuber, P., 2025. Administrative costs of social protection in Sub-Saharan Africa and Latin America: a microsimulation study. UNU-WIDER.
Lustig, N. (ed.), 2022a. Commitment to Equity Handbook: Estimating the Impact of Fiscal Policy on Inequality and Poverty (2nd ed., Vols. 1–2). Brookings Institution Press and CEQ Institute–Tulane University.
Lustig, N., 2022b. Fiscal policy, income redistribution, and poverty reduction in low- and middle-income countries. In N. Lustig (ed.), Commitment to Equity Handbook: Estimating the Impact of Fiscal Policy on Inequality and Poverty, Brookings Institution Press and CEQ Institute–Tulane University.
Lustig, N., Martinez-Pabon, V. and Pessino, C., 2025. Fiscal policy, income redistribution, and poverty reduction in Latin America. Oxford Open Economics, 4(Supplement 1), i426–i446, https://doi.org/10.1093/ooec/odae034.
Lustig, N. and Vigorito, A., 2025. Including the rich in income inequality measures: an assessment of correction approaches. ECINEQ Working Paper.
Mahler, D. G., Aguilar, R. A. C. and Newhouse, D., 2022. Nowcasting global poverty. The World Bank Economic Review, 36(4), 835–56, https://doi.org/10.1093/wber/lhac017.
Mancini, G. and Vecchi, G., 2022. On the construction of a consumption aggregate for inequality and poverty analysis. World Bank.
Manda, D. K., Mutegi, R., Kipruto, S., Muriithi, M., Samoei, P., Oleche, M., Mwabu, G. and Younger, S. D., 2020. Fiscal incidence, inequality, and poverty in Kenya: A CEQ Assessment. African Centre of Excellence for Inequality Research (ACIER) Working Paper series, no. 6.
Melguizo, Á. and González-Páramo, J. M., 2013. Who bears labour taxes and social contributions? A meta-analysis approach. SERIEs, 4(3), 247–71, https://doi.org/10.1007/s13209-012-0091-x.
Mesfin, W. and Gao, J., 2020. Fiscal incidence analysis for Ethiopia. World Bank.
O’Donoghue, C., 2025. Dynamic microsimulation modelling: a survey and critical assessment IV. International Journal of Microsimulation, 18(1), 56–83.
Osei, R. D., Pirttilä, J. and Rattenhuber, P., 2019. Quantifying the impacts of expanding social protection on efficiency and equity: evidence from a behavioural microsimulation model for Ghana. International Journal of Microsimulation, 12(1), 105–23, https://doi.org/10.34196/ijm.00196.
Palomo, T., Bhering, D., Scot, T., Bachas, P., Barcarolo, L., Campos, C., Feinmann, J., Moreira, L. and Zucman, G., 2025. Tax progressivity and inequality in Brazil: evidence from integrated administrative data. Reports 009. EU Tax Observatory.
Paulus, A. and Sutherland, H., 2016. EUROMOD, CEQ, LIS and TAXSIM: a note on overlaps, differences and complementarities. EUROMOD Technical Note 2.0.
Popova, D., 2024. Guidelines for integrating a microsimulation model into the standard CEQ fiscal incidence exercise [forthcoming].
Rossignolo, D., 2018. Argentina: taxes, expenditures, poverty, and income distribution. In N. Lustig (ed.), Commitment to Equity Handbook: Estimating the Impact of Fiscal Policy on Inequality and Poverty, Brookings Institution Press and CEQ Institute–Tulane University.
Sinha, N., Inchauste, G. and Narayan, A. (eds), 2024. Leveling the playing field: addressing structural inequalities to accelerate poverty reduction in Africa. Washington, DC: World Bank, https://doi.org/10.1596/978-1-4648-2160-8.
Steyn, W., Sithole, A., Ngobeni, W., Muwanga-Zake, E., Barnes, H., Noble, M., McLennan, D., Wright, G. and Gasior, K., 2021. Simulating personal income tax in South Africa using administrative data and survey data: a comparison of PITMOD and SAMOD for tax year 2018. WIDER Working Paper 2021/120. UNU-WIDER, https://doi.org/10.35188/UNU-WIDER/2021/060-3.
Sutherland, H., 2018. Quality assessment of microsimulation models: the case of EUROMOD. International Journal of Microsimulation, 11(1), 198–223, https://doi.org/10.34196/ijm.00178.
Warwick, R., Harris, T., Phillips, D., Goldman, M., Jellema, J., Inchauste, G. and Goraus-Tańska, K., 2022. The redistributive power of cash transfers vs VAT exemptions: a multi-country study. World Development, 151, 105742, https://doi.org/10.1016/j.worlddev.2021.105742.
World Bank, 2022. Capacity building in fiscal incidence analysis: lessons and reflections from the field. Learning Note. World Bank.
World Bank, 2024. MauSim 2024: the incidence of tax expenditures and electricity subsidies in Mauritania. World Bank.
Younger, S. D., Myamba, F. and Mdadila, K., 2016. Fiscal incidence in Tanzania. CEQ Working Paper 36.
Younger, S. D., Osei-Assibey, E. and Oppong, F., 2017. Fiscal incidence in Ghana. Review of Development Economics, 21(4), e47–e66, https://doi.org/10.1111/rode.12299.
Acknowledgements
The authors would like to thank the UK Government Public Finance Centre of Expertise – funded by UK International Development - for financial support, through the grant to TaxDev. TaxDev is a collaboration between ODI Global and IFS, and aims to promote more effective tax policymaking in low- and middle-income countries through research, applied analysis, and partnerships with policymakers. The IFS-affiliated authors also gratefully acknowledge the support of the Economic and Social Research Council (ESRC) through the Centre for the Microeconomic Analysis of Public Policy (ES/Z504634/1). The authors are grateful to Jon Jellema, Jesse Lastunen and Pia Rattenhuber for their helpful comments.
Endnotes
Authors

Laura Abramovsky
Laura is a Research Fellow at IFS. Her current work focuses on tax and social protection policy and programme evaluation in developing countries.


Abdul Malik Iddrisu
Abdul joined the IFS in 2019 and works as the Country Adviser for Ghana within the Centre for Tax Analysis in Developing Countries (TaxDev).

Martin Mikloš
Martin is a research economist at TaxDev and works on taxation in developing countries.

David Phillips
David is Head of Devolved and Local Government Finance. He also works on tax in developing countries as part of our TaxDev centre.
More from IFS
Understand this issue


Policy analysis


Academic research


