
Downloads
Download the chapter PDF
PDF | 1.09 MB
After periodic bouts of volatility, the Budget will be closely watched by the gilt market. The government has an opportunity to deliver a credibility-enhancing suite of fiscal measures in order to placate a sceptical market.
Key findings
- The UK is not a fiscal outlier among advanced economies when measured by traditional debt and deficit metrics. Projections from the International Monetary Fund show that the stock of UK government debt as a share of GDP and the UK’s fiscal balance are relatively favourable compared to peers, with projections indicating that the UK will undertake a larger fiscal consolidation (2.2% of GDP) between 2025 and 2030 than the average across advanced economies (0.3%). The UK is also expected to see a smaller rise in gross government debt (2.2% of GDP) than most advanced economies (3.2% on average).
- Gilt yields have risen sharply, with 30-year yields rising from 4.5% a year ago to reach 5.7% recently, their highest levels since 1998. Yields on 10-year gilts rose sharply from 1.0% to 3.7% over 2022, and are now close to 4.7%. This increase in the cost of borrowing is an important contributor to the difficult outlook for the public finances.
- An increase in yields on government bonds has been seen across advanced economies, partly as a result of a higher expected path for central bank policy rates. That yields on longer-maturity gilts are higher than in other countries partly reflects a consensus that the neutral policy rate is higher in the UK than in the US or Euro Area. An even more significant factor in the global increase has been rising term premium, reflecting global trends such as the normalisation of interest rates, higher inflation and rising sovereign bond supply.
- The gilt market faces unique challenges. There has been a step change in the supply of gilts that the private sector is being asked to absorb, with net supply now averaging 4% of GDP. As a result of the Bank of England’s balance sheet reduction, private sector holdings are set to rise even more quickly, by 6% of GDP on average over the next four fiscal years, compared with an average of 2.5% in the two decades up to 2019. This structural increase in supply is forecast to persist, placing ongoing pressure on yields and challenging the market’s absorption capacity.
- The government no longer enjoys ‘borrower’s privilege’ and instead faces the challenge of recalibrating supply to match a more elastic and less predictable demand base. For over two decades, regulatory and demographic factors had created strong demand for long-dated government assets and compressed the 30-year term premium, reducing yields. But in the post-quantitative-easing and post-defined-benefit-pension world, demand for long-dated gilts has waned. While domestic financial institutions, especially banks, are buying more, this is primarily sub-15-year gilts. This shift in demand has led the UK Debt Management Office (DMO) to rotate issuance toward shorter maturities. We forecast that the weighted average maturity of primary gilt supply – which was more than 20 years in 2016–17 – will dip below 10 years in 2025–26. This reduction is a trend that is likely to continue given the elevated levels of long yields and the DMO’s focus on value for money in terms of the cost of supply.
- The identity of the marginal buyer is less important than the need for credible fiscal and monetary policy to reassure a more discretionary investor base. The credibility of the government’s fiscal consolidation plan is paramount to delivering bond market stability. Changing the fiscal rules or tinkering with the existing fiscal architecture would likely be seen as self-serving and could generate an adverse market reaction. In the extreme, such changes run the risk of catalysing a gilt crisis.
- The bond market will judge the upcoming Budget by whether its consolidation measures are credible and deliverable, not just by the headline savings but in their composition. This is a political choice, but the market perspective is that both revenue-raising and spending-reduction measures will have to play their role. In particular, market participants have come around to viewing spending reform as a critical signal of intent. A credible attempt to reduce spending would demonstrate that the government has the political will and ability to deliver on its fiscal objectives. The signal this would send could be equally, if not more, important than the amounts any reforms actually saved. Welfare spending reform, in particular, has become a bellwether for the government’s willingness to tackle politically difficult issues. Without reductions in spending, to deliver the sums required solely via tax increases could require breaking manifesto promises – not something done lightly. Should the Chancellor raise the basic rate of income tax, it would be the first rise in over 50 years and would demonstrate a willingness to spend significant political capital in order to support fiscal stability. Again, the signal is crucial.
- This Budget will be a key moment to announce measures needed to maintain and bolster market confidence. The crucial task for the UK government is maintaining both monetary and fiscal credibility, such that discretionary macro investors feel confident enough to be comfortable in owning gilt risk. The government’s focus on stabilising the bond market – sometimes at the expense of its broader policy goals – reflects the increasing constraint that market sentiment places on fiscal policy. That need for credibility-enhancing policy choices is the price that the government must be seen to be paying in order to provide reassurance to a wary market that has been quick to move sharply on any perception of rolling back on fiscal policy choices. With that in mind, this Budget needs to be seen as part of a sequence of steps towards the goal of enhancing market credibility.
2.1 Introduction
Former Labour Chancellor Denis Healey’s first law of holes – that ‘if you find yourself in a hole, stop digging’ – offers much wisdom to today’s policymakers. What is less often quoted is the second law: ‘when you stop digging, you are still in a hole’.
Governments globally are discovering that bond vigilantism is alive and well. The age of tolerance of high deficit financing without credible fiscal consolidation plans is behind us. The UK had a taste of this in Autumn 2022 that led to the liability-driven investment (LDI) crisis, but across developed markets, governments are experiencing a rapid rise in borrowing costs as the combination of monetary policy tightening, higher inflation and elevated borrowing needs drives yield curves steeper. This has raised wider questions relating to the sustainability of sovereign debt levels, the appropriate balance between taxation and spending, intergenerational equity in the face of an ageing population and myriad other complex policy issues.
It is against this backdrop that the Chancellor will present her Budget including updated plans for gilt supply for 2025–26 and beyond. Perhaps the most important immediate outcome of this will be the market reaction to the near-term fiscal forecasts and the outlook for government borrowing. The government now finds itself in the unenviable position where the reaction of the bond market is increasingly becoming the constraint on fiscal policy.
Indeed, the government seems at times to have the sole objective of stabilising a restive bond market. It finds itself facing the immovable object of its pre-election manifesto commitments and the irresistible force of bond market scepticism. In having to find new policy measures to restore its own ‘headroom’ measure, while being unwilling to break manifesto commitments, the policy levers used are viewed as increasingly untenable. By being in thrall to the headroom measure (which, lest we forget, was a measure of margin, nothing more, and certainly not a fiscal target), the government is increasingly unable to deliver its wider policy agenda, against which it will ultimately be judged by voters at the next general election. The UK seems trapped in a negative spiral where the combination of the rigidity of its current fiscal rules and a mini crisis of confidence seems intractably locked. Viewed from a bond analyst’s perspective, breaking this cycle should be a key objective in the Budget.
This chapter proceeds as follows. Section 2.2 puts the UK’s fiscal position in international context. Section 2.3 sets out some of the UK-specific issues driving recent gilt market developments. Section 2.4 considers the role of the term premium in driving changes in yields. Section 2.5 examines changing patterns of demand for gilts. Section 2.6 concludes with the implications of the end of ‘borrower’s privilege’ for the UK government.
2.2 The UK is not a fiscal outlier internationally
Based on fiscal fundamentals, such as traditional stock and flow measures of government debt and deficit, the UK is by no means an outlier. Figures 2.1 and 2.2 show the International Monetary Fund (IMF)’s latest assessment of general government gross debt and fiscal balance (net government lending). While these are not cyclically adjusted measures which are perhaps the best measure of the underlying fiscal stance, they are the most easily comparable fiscal metrics across countries. On both these measures, it would appear that the UK does not score relatively badly, with a smaller stock of debt than, and a similar level of net borrowing to, the average across advanced economies.
Figure 2.1. General government gross debt as a percentage of GDP in the UK and comparator countries
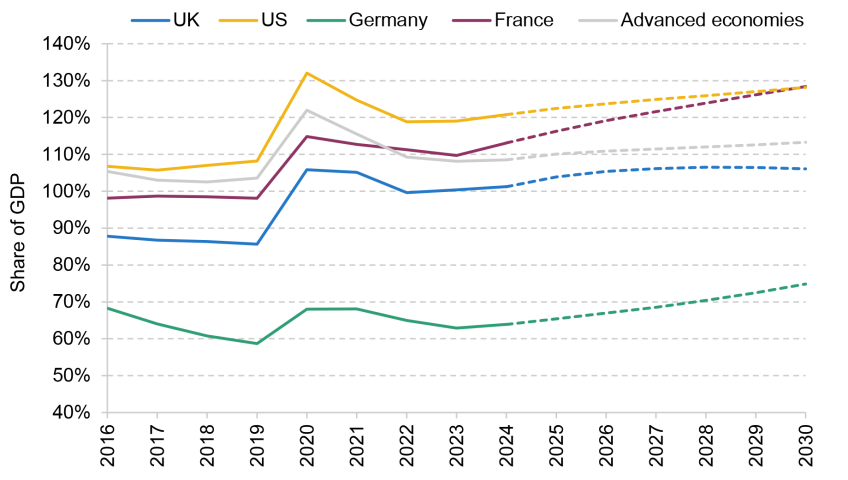
Note: Figure for advanced economies is a weighted average for 41 advanced economies.
Source: IMF World Economic Outlook April 2025 and Haver Analytics.
Figure 2.2. General government fiscal balance as a percentage of GDP in the UK and comparator countries
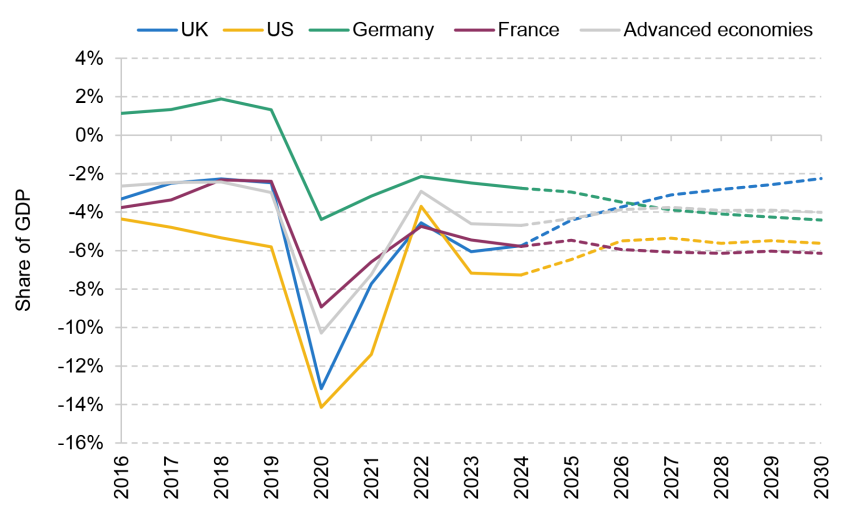
Note: Figure for advanced economies is a weighted average for 41 advanced economies. Negative values denote a budget deficit.
Source: IMF World Economic Outlook April 2025 and Haver Analytics.
Figure 2.3 shows the projected change in each of these two key ratios between 2025 and 2030. The UK fiscal balance is projected to increase by 2.2% of GDP, representing a fiscal consolidation, which is significantly larger than that expected in any comparable market, and compares with an average of 0.3% for advanced economies. The UK government is still expected to be a net borrower over this period, but its gross debt is projected to rise by just 2.2% of GDP compared with 3.2% for advanced economies.
Figure 2.3. IMF forecasts for the change in gross debt and fiscal balance, 2025 to 2030, as a percentage of GDP
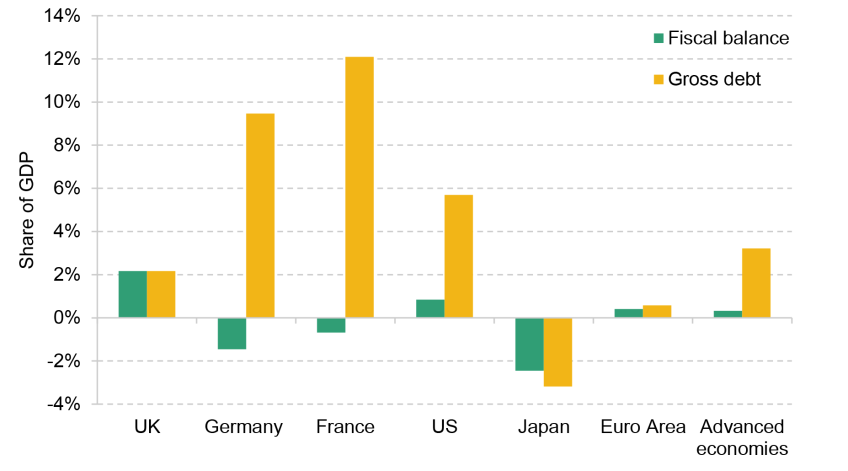
Note: Figure for advanced economies is a weighted average for 41 advanced economies. An increase in fiscal balance represents a decline in net government borrowing.
Source: IMF World Economic Outlook April 2025, Haver Analytics and Barclays Research calculations.
It is a truism that any market will always find a clearing level where supply and demand will be matched; it is just a question of whether the path to that level and the level itself are acceptable to all concerned. This rather basic point is often forgotten in some of the debate about the outlook for the market. The reason we reiterate this point is twofold. First, the supply of gilts – largely dictated by the level of borrowing – is one of the key determinants in arriving at the market clearing rate, i.e. the marginal rate at which the government can borrow. Second, how the supply of gilts is structured (e.g. the maturity mix, the split of issuance) will also matter. In subsequent sections, we consider the developments in the fiscal fundamentals that are seen as dictating gilt supply, and assess what they might mean for the Budget.
2.3 Dismal dynamics: fiscal fragility leads to a gilt glut
Given a ‘middle of the pack’ debt and deficit outlook compared with other markets, why does the gilt market repeatedly suffer more than other markets? In particular, why are long-dated gilt yields higher and rising more sharply than in other markets?
Fundamentals would point to the answer being most succinctly captured in Figure 2.4. This shows net gilt issuance and the change in private sector holdings between 1999–2000 and 2019–20, both expressed as a percentage of GDP. Net supply of gilts has been above 4% of GDP for the past two years and is expected to remain around 4% of GDP for three of the next four fiscal years, only dropping below 3% in the final year of the forecast. This is more than double the average 1.9% of GDP in the pre-financial crisis era. The average annual increase in the private sector’s holdings of gilts is expected now to be around 6% of GDP over the next four fiscal years, having been just 1.8% of GDP in the pre-financial crisis period. As shown by the dashed line, this is substantially higher than the 2.5% average over the much longer period between 1999–2000 and 2019–20.
Figure 2.4. Net gilt issuance and change in private sector holdings of gilts each year
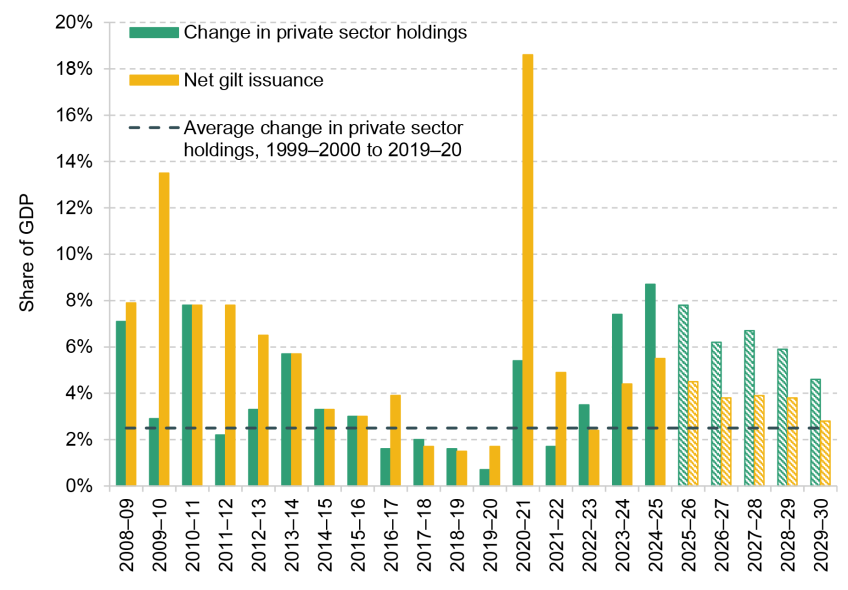
Note: Striped bars show OBR forecast.
Source: Office for Budget Responsibility, Economic and Fiscal Outlook, March 2025 and Barclays Research calculations.
Quantitative easing (QE) is key to understanding this story. The most striking aspect is how during the ‘QE era’ (broadly 2009 to 2021), net issuance was around 6% of GDP but the average annual change in private sector holdings was 3.3% of GDP. The remaining government bond supply was absorbed by the Bank of England in QE gilt purchases. But now we are entering a period of heavier supply without the backstop of central bank buying. For the market to clear, all else equal, it is natural that yields move higher as the burden that the market is being asked to absorb has structurally risen and is only forecast to fall marginally during the Office for Budget Responsibility (OBR)’s current forecast window.
We can think of the evolving supply side of gilts as being driven by the primary deficit (the difference between revenues and expenditure excluding interest payments). This provides a more transparent picture of overall fiscal performance and whether the stock of government debt will be rising or falling, since it will be indicative of whether the government is generating enough in revenues to cover its debt obligations without needing to raise new debt in the market. There are additional factors, such as quantitative tightening (QT) – but active sales under QT are small in scale and of far less significance than the underlying fiscal drivers.
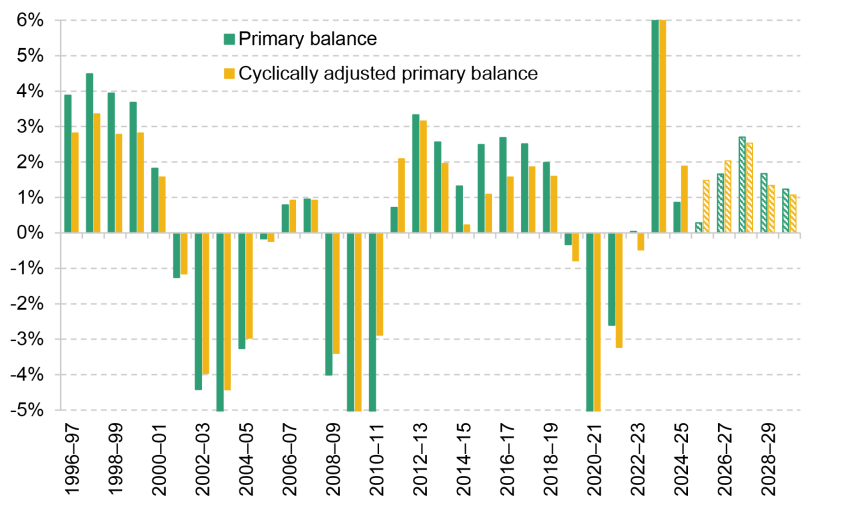
Figure 2.5 shows both the primary balance (net government lending) and the cyclically adjusted primary balance. The latter serves as a measure of the underlying or ‘structural’ budget position since it nets out both the impact of the economic cycle and debt interest payments, and shows the effect of government fiscal choices. In so doing, it indicates what the budget position would be if the economy was growing at trend.
Figure 2.5. UK primary balance as a percentage of GDP
Note: Striped bars show OBR forecast. Negative values denote a budget deficit.
Source: Office for Budget Responsibility, Economic and Fiscal Outlook, March 2025.
This more nuanced metric offers a bleak assessment. Since 2002–03, the UK has run a primary balance deficit every single year both on a headline and a cyclically adjusted basis. Since 1990–91, there have only been five fiscal years (1997–98 to 2001–02) where the government ran a primary balance surplus. In its March forecast, the OBR expected the balance to limp back into surplus from 2027–28 onwards, with the primary balance improving by 1.0% of GDP between 2026–27 and 2028–29.
Looking back over the last three decades, the relative rate of nominal growth compared with the interest rate (the ‘r minus g’ in debt sustainability analysis) meant that successive governments could run a primary deficit and have debt expected to fall as a share of GDP as the interest rate on borrowing was below nominal growth levels. As yields have risen, this is now no longer the case (i.e. ‘r’ is no longer lower than ‘g’) across all maturities at which the government might borrow, most notably at the 30-year point. So, whereas running deficits in the past was effectively consequence-free in terms of (not) seeing a higher debt stock, in an environment of secularly higher rates, the government now has to run fiscal surpluses just to stabilise the debt stock – never mind get it falling. This is the brutal mathematics of debt stability writ large but it is also a consequence of having delayed fiscally prudent reforms in the past.
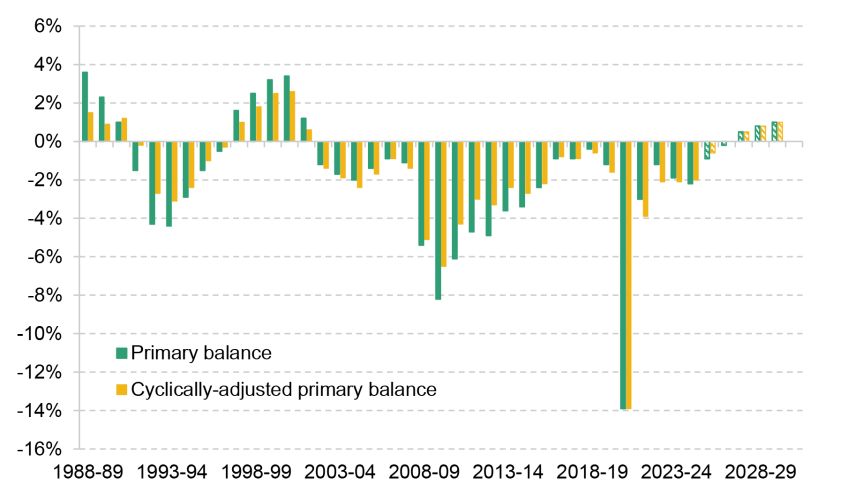
How plausible are the OBR’s projections? Figure 2.6 shows the rolling three-year change in both the headline and structural measures of the primary balance, where an increase indicates a fiscal consolidation. With the exception of the post-COVID changes, which were clearly outsized, the chart shows that the degree of consolidation that the OBR is forecasting between 2025–26 and 2029–30 is on the cyclically adjusted measure, at 1.7% of GDP, higher than the 1.2% average during the ‘austerity’ period of 2010–11 to 2018–19. Comparatively, over the period shown, the 1.7% average is only eclipsed by the rolling three-year average of 2.6% of GDP delivered under the first Labour administration of 1997–2001.
Figure 2.6. Rolling three-year change in the headline and structural primary balance as a % of GDP
Note: Striped bars based on OBR forecast. Vertical axis is truncated. Positive values represent a decline in net government borrowing, i.e. a fiscal consolidation.
Source: Office for Budget Responsibility, Economic and Fiscal Outlook, March 2025 and Barclays Research.
For all the protestation over ‘no return to austerity’, the government’s forecasts are predicated on a substantial fiscal consolidation – the alternative to which would be an inexorable and probably indigestible rise in gilt supply. What matters for the Budget is whether this planned consolidation is viewed by the market as both credible and deliverable.
There are two options available: raise taxes or cut spending. The issue for the government is that there are credibility risks associated with both. Taxes as a percentage of GDP are already touching multi-decade highs (Figure 2.7), and credibly raising revenues on the scale required may require breaking a manifesto pledge (see Chapter 4). Relying on revenues alone brings risks.
Figure 2.7. Public sector current receipts as a percentage of GDP
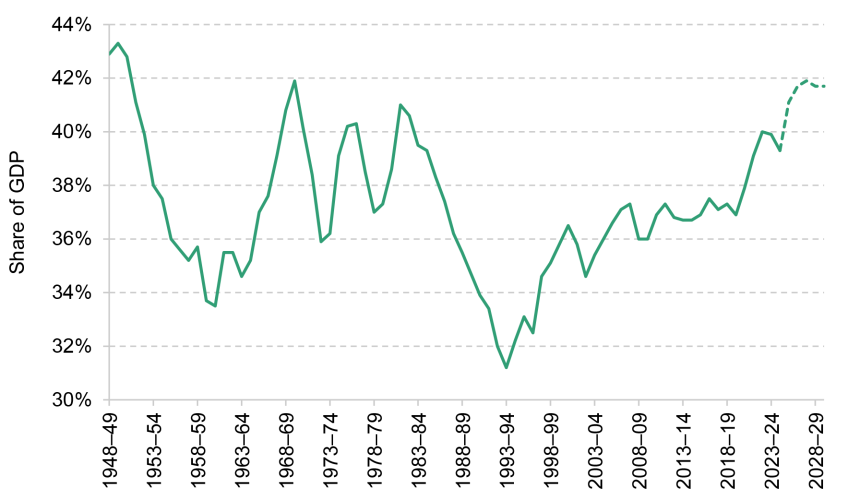
Source: Office for Budget Responsibility, Economic and Fiscal Outlook, March 2025.
Yet on the other side of the ledger, government expenditure is increasing driven by spending on social security and debt interest, with spending on the state pension, other pensioner benefits and debt interest spending as a percentage of GDP alone set to reach 9.8% by 2029–30 (Figure 2.8), making credible spending cuts more difficult to achieve. Welfare spending reform is becoming a bellwether for the government’s willingness to take on and deliver politically difficult challenges. That reform could not be delivered over the summer was a red flag from the perspective of the gilt market, as a lack of spending reform leaves the government increasingly dependent on tax revenues. This is why spending reform is now seen as a totemic issue by the market. It is not the quantum of money (which in the grand scheme of the public finances is not huge) but rather the signal it sends. Given that it is on the credibility of the consolidation plan that the Budget’s fiscal projections will be judged, this is important.
Figure 2.8. Spending on the state pension, other pensioner benefits and debt interest as a percentage of GDP
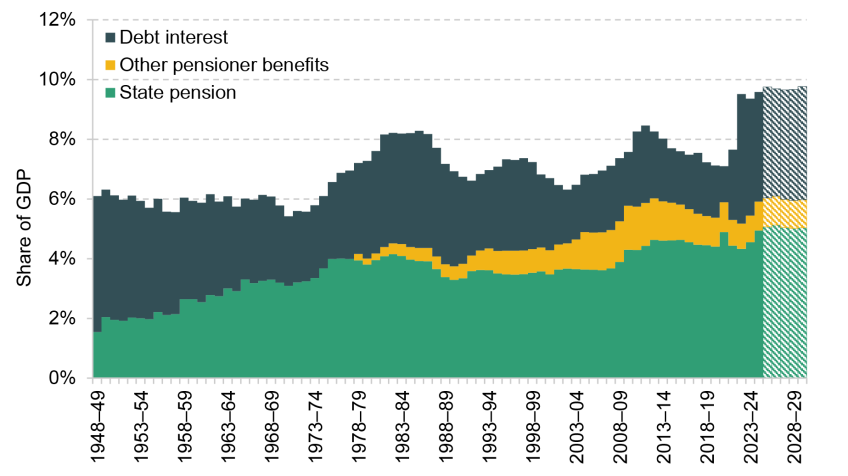
Note: Striped bars based on OBR forecast.
Source: Office for Budget Responsibility, Economic and Fiscal Outlook, March 2025 and Fiscal Risks and Sustainability, July 2025.
2.4 Did yields get high on their own supply?
The combination of fiscal fragility and an unwillingness to address long-standing structural weaknesses on the fiscal side is the current backdrop in front of which the gilt market sits. Figure 2.9 shows the evolution of 30-year gilt yields over the past 12 months with some key events highlighted.
Figure 2.9. Evolution of 30-year gilt yields and the Bank of England policy rate over the past 12 months
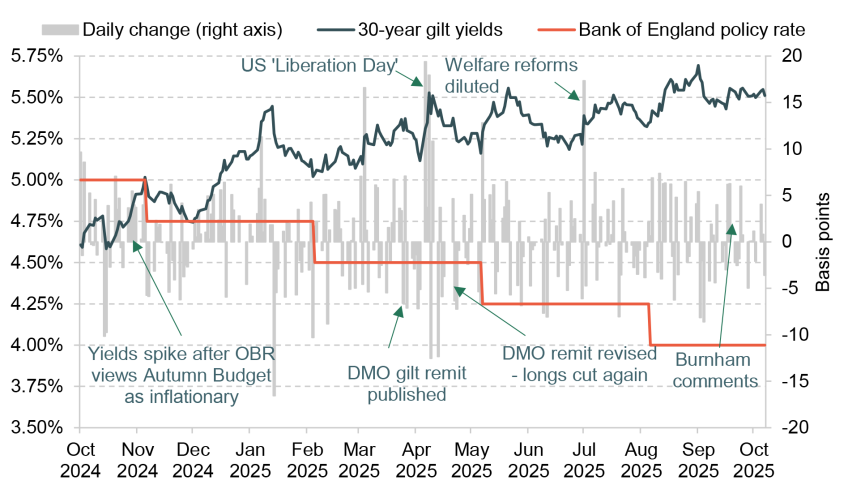
Note: DMO is the UK Debt Management Office.
Source: Barclays Research.
Thirty-year gilt yields have risen by around 100 basis points (bp) over the last year, from 4.5% to settle at around 5.5%, peaking at 5.7% in September 2025, their highest level since 1998. The rise in yields has resulted from the persistence of inflationary pressures, which has reduced expectations of rate cuts from the Bank of England, and wider concerns about the sustainability of the UK’s fiscal position as well as the potential economic impact of US tariffs. There have been particular spikes around major UK fiscal decisions – measures in the Autumn 2024 Budget that the OBR deemed would be inflationary, and when the Chancellor announced the reversal of planned welfare reforms – and in response to global events, notably US ‘Liberation Day’ (President Trump’s announcement on 2 April 2025 of higher US tariffs on imports) which saw global yields rise. On the plus side, declines in 30-year gilt yields have followed changes to the Debt Management Office’s remit, where it reduced planned supply of long-maturity paper above and beyond market expectations.
The rise in rates has been a global phenomenon, with yields rising as the central bank interest rate-hiking cycle took off in 2022–23. As shown in Figure 2.10, we see that 10-year rates on UK gilts have risen in tandem with US Treasury 10-year rates, though both lie higher than the international pack. We think of 10-year rates as primarily driven by expectations of the path of the central bank policy rate. Figure 2.11 shows USD, EUR and GBP 1y1yf OIS rates (one-year rate, one-year forward Overnight Index Swap rates). These are used as a measure of where the market prices the path of the Federal Reserve (Fed), European Central Bank (ECB) and Bank of England (BoE) policy rates respectively, as they show where the rates market is pricing one-year rates to settle in one year’s time. Short rates are those most sensitive to moves in the central bank’s policy rate.
Figure 2.10. Yields on 10-year government bonds issued by different countries
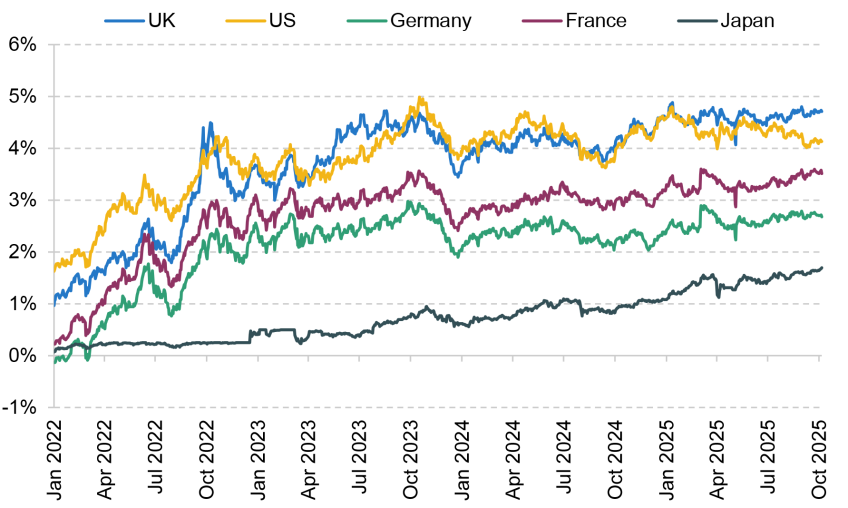
Source: Barclays Research.
Figure 2.11. One-year rate, one-year forward Overnight Index Swap rates for different currencies

Source: Barclays Research.
We see that consistently GBP 1y1yf has been higher than its US and European equivalents. Most economists’ estimates for where neutral rates lie for the three regions have the BoE’s neutral level as higher (3.25–3.75%) than both the Fed’s (2.50–3.50%) and the ECB’s (1.75–2.25%). Given a consensus that the underlying nominal neutral rate is higher in the UK, it makes sense that gilt yields are structurally higher than those seen in other markets.
The other key component that underpins the rise in gilt yields has been a significant upward shift in global term premiums. From a yield curve modelling perspective, nominal yields can be decomposed into a ‘rate expectation’ component (the portion that can be explained by the expected future path for policy rates) and a ‘term premium’ component (which can be thought of as capturing what rate expectations cannot explain). The term premium becomes a larger explanatory factor in yield movements at longer maturities. This is because over the yield curve, the rate expectations component should settle at or close to neutral rate expectations as we move to longer maturities. Intuitively, this makes sense as the path of rates over the next 10 years captured in the 10-year rate expectations component should not be materially different from the path between 10 years and 30 years. Or more prosaically, ‘What is it that you know about the path of rates between 10 and 30 years that is not captured at the 10-year point?’.
Figure 2.12 shows a long-run history of the estimated term premium in 10-year US Treasuries from the New York Federal Reserve’s ACM model and our own estimate for the 10-year term premium on gilts. It is clear that the term premium is positively correlated across markets. Having been trending downwards for most of the QE (post-financial crisis) era, it is noticeable that the gilt measure has moved upward more sharply than its US equivalent. This has been coincident with the aftermath of the LDI crisis in the fourth quarter of 2022, higher expected supply, and the Bank of England’s moves towards reducing the size of its balance sheet via active selling of its gilt portfolio. But overall, this rise in term premium has been the key driver of rising yields across the curve (Figure 2.13).
Figure 2.12. Term premium: US 10-year Treasuries and UK 10-year gilts
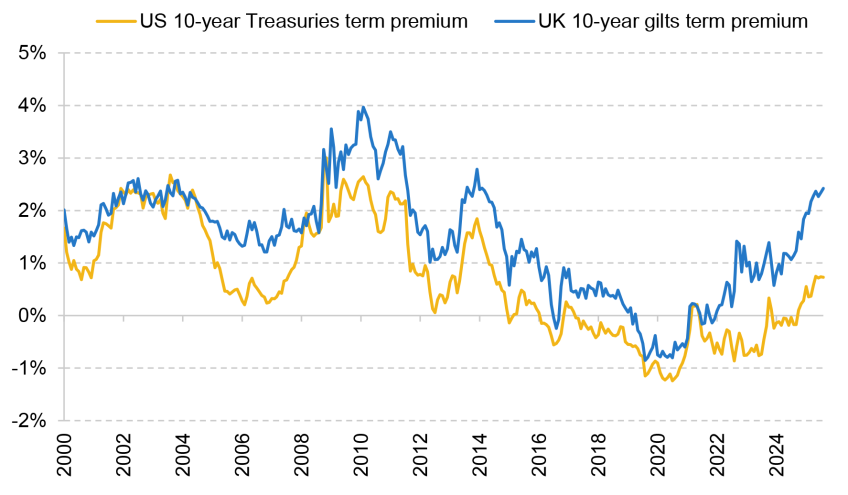
Source: Federal Reserve Bank of New York, Haver Analytics and Barclays Research estimates.
Figure 2.13. Decomposition of 10-year UK gilt yields
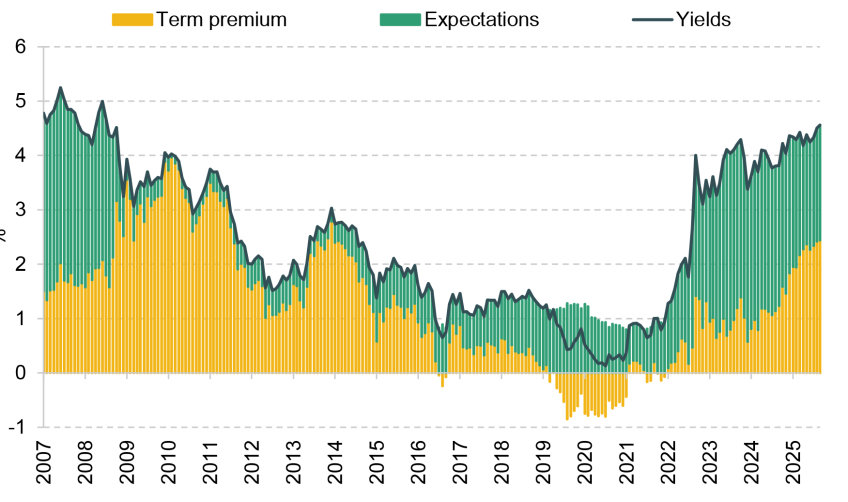
Source: Barclays Research.
The rise in the 10-year term premium has coincided with a significant shift in the composition of gilt supply that has seen the UK Debt Management Office (DMO) reduce the maturity of supply away from its traditional home in the long end (15+-year maturity issues) and more towards short (1- to 7-year) and medium (7- to 15-year) maturities. As shown in Figure 2.14, compared with its peers, the DMO was a notable outlier in terms of the structure of supply between 2015 and 2019. But the shifts by the DMO have left the structure of conventional gilt supply looking much more like that of other G7 countries and, consequently, it has led to a sharp shortening of the average maturity of the gilt market relative to other global markets. At the end of August, the weighted average maturity of gilts stood at just under 12 years, compared with 8.8 years for Bloomberg’s Global Aggregate Treasuries Index (Figure 2.15). As shown in Figure 2.16, this has followed a decline in the average maturity of primary gilt supply over the last decade, with gilts issued from the DMO so far this fiscal year having an average maturity of less than 10 years, compared with an average maturity of over 20 years in 2016–17.
Figure 2.14. Maturity breakdown of conventional sovereign bond supply, G7 countries
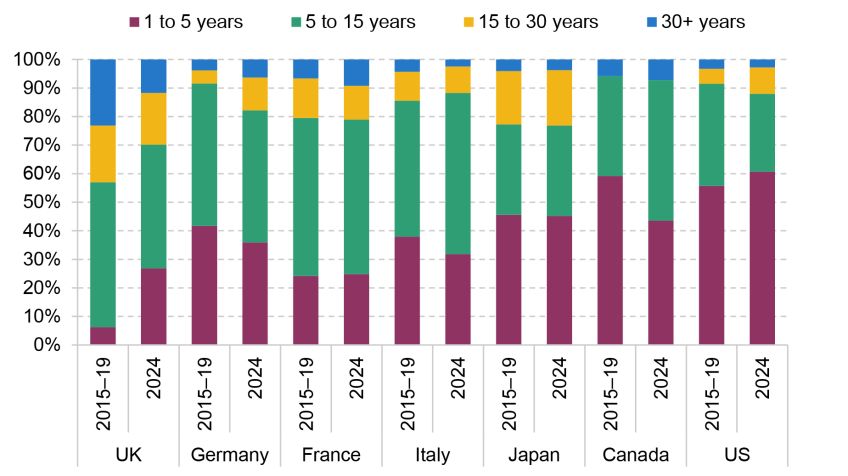
Note: Conventional sovereign bonds have a fixed interest rate (coupon) and maturity, and make up around three-quarters of all gilts.
Source: Office for Budget Responsibility, Fiscal Risks and Sustainability, July 2025.
Figure 2.15. Weighted average maturity of gilts vs global sovereign index
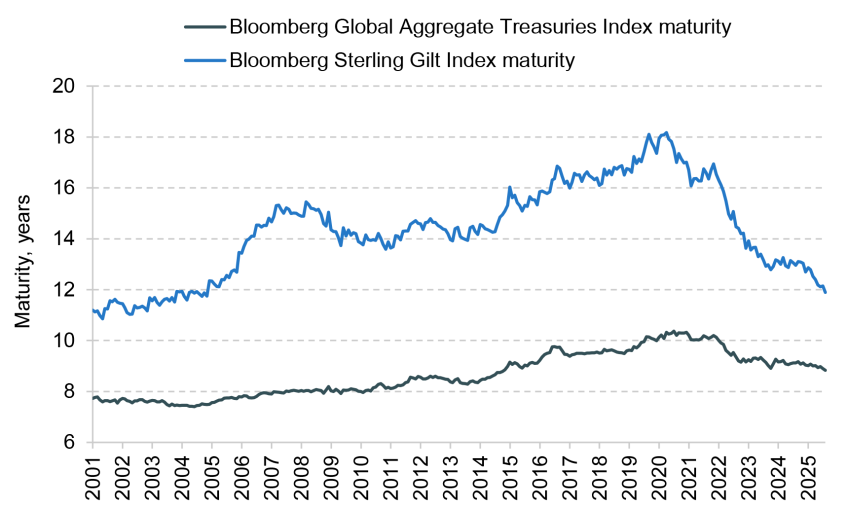
Source: Bloomberg.
Figure 2.16. Weighted average maturity of primary gilt supply
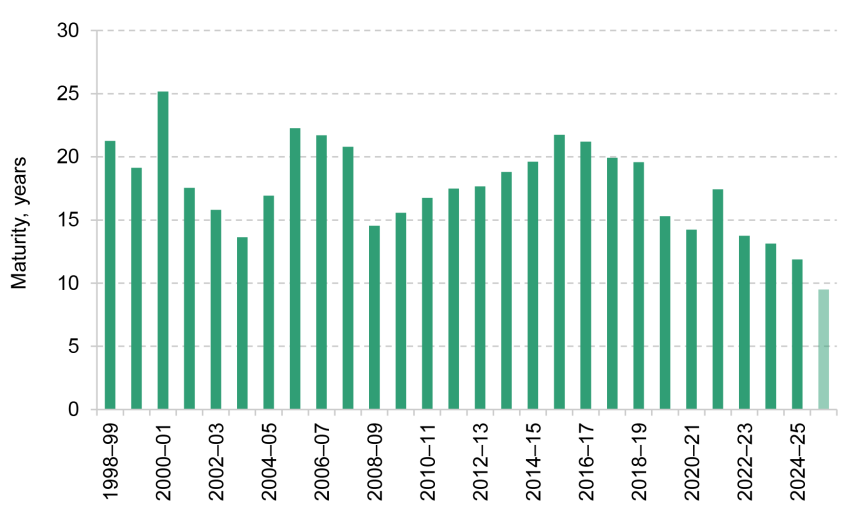
Source: UK Debt Management Office and Barclays Research.
This shortening does mean that the gilt portfolio becomes more sensitive to changes in interest rates, since government debt is being more frequently refinanced. But there is still clear distance between the UK and other markets in terms of market maturity. This gives the DMO the luxury of continuing an overall strategy of reorientation of supply away from the long end of the curve and ongoing reduction in the supply of longer-dated instruments.
To what extent can the rise in the UK’s 10-year term premium above and beyond the movement seen globally be explained by the rise in UK issuance? We look at the excess in the 10-year gilt term premium over its US Treasury equivalent and the total net supply of gilts to the market (i.e. net issuance from the DMO plus buying/selling from the Bank of England Asset Purchase Facility) on a rolling 12-month basis in Figure 2.17. We find that the recent increase does indeed coincide with the material increase in gilt supply to the market although the sharp increase in gilt term premium in 2022–23 coincided with the start of the Russia–Ukraine conflict and the subsequent rise in inflation which was more sharply felt in Europe and the UK than in the US and, more locally, also with the Truss–Kwarteng era.
Figure 2.17. Net gilt supply and gilt term premium
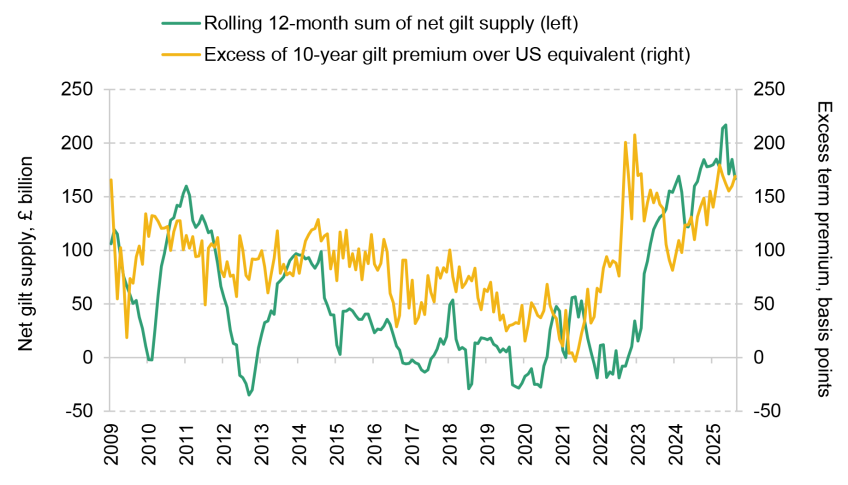
Source: Federal Reserve Bank of New York, Bank of England, UK Debt Management Office, Haver Analytics and Barclays Research.
We also see a reasonably long-run linear relationship between observed changes in 30-year yields and model-generated changes in 30-year term premiums (Figure 2.18), and an increase in the term premium at different maturities (Figure 2.19). From all of this, we can conclude that observationally, the rise in longer-dated (10-year and longer) yields can be explained not only by the post-QE restoration in the term premium globally but, more locally, by the significant rise in gilt supply and shifts in issuance patterns from the DMO. It is against this backdrop that the Chancellor and the Treasury must find a fiscal path that satisfies a multiplicity of demands.
Figure 2.18. Monthly changes in 30-year gilt yields and 30-year term premiums
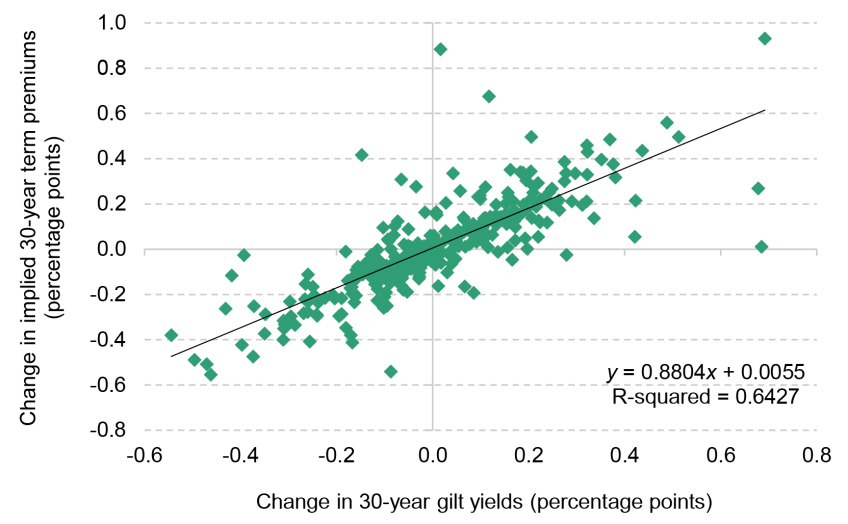
Note: Each marker represents a monthly change since January 2000.
Source: Barclays Research.
Figure 2.19. Term premiums on 5-year, 10-year and 30-year gilts
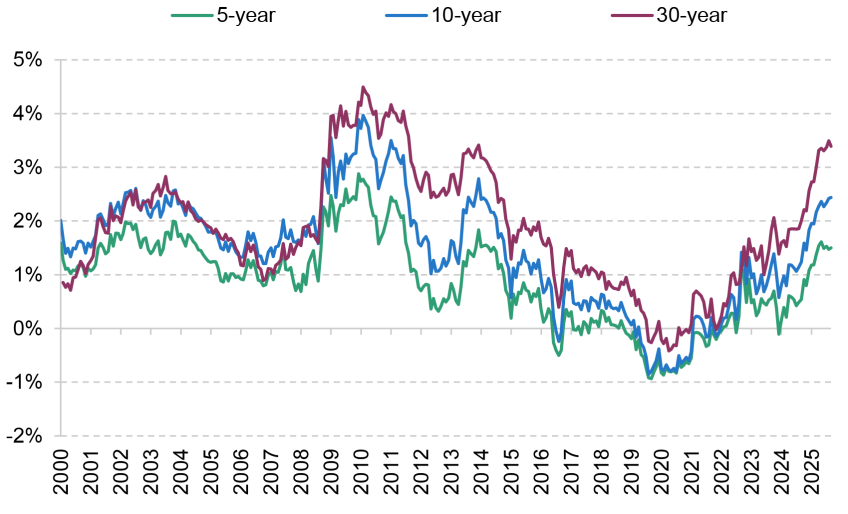
Source: Barclays Research.
2.5 Sellers need buyers: changing patterns of gilt demand
Figure 2.20 shows the percentage share of gilt ownership across the major investor bases at the end of 2008 (i.e. prior to QE), the end of 2021 (i.e. at the end of QE) and at the end of the second quarter of 2025, the most recent data available from the Office for National Statistics. The most striking difference has been the decline in the share owned by pension funds and insurance companies, where their holdings as a share of the market have nearly halved from 39% in 2008 to 21%. Equally, the Bank of England is shedding its gilt holdings, which now lie at 20%. The most notable increases have been since 2021 in holdings by monetary and financial institutions (i.e. the banking sector) up to 10% and by other financial intermediaries (i.e. domestic non-banking financial institutions) up to around 15%. These high-level data suggest that as pension fund appetite has declined, the burden of gilt absorption has been taken up by other domestic sectors, primarily banks and asset managers.
Figure 2.20. Share of stock of gilts owned by different major investors on selected dates
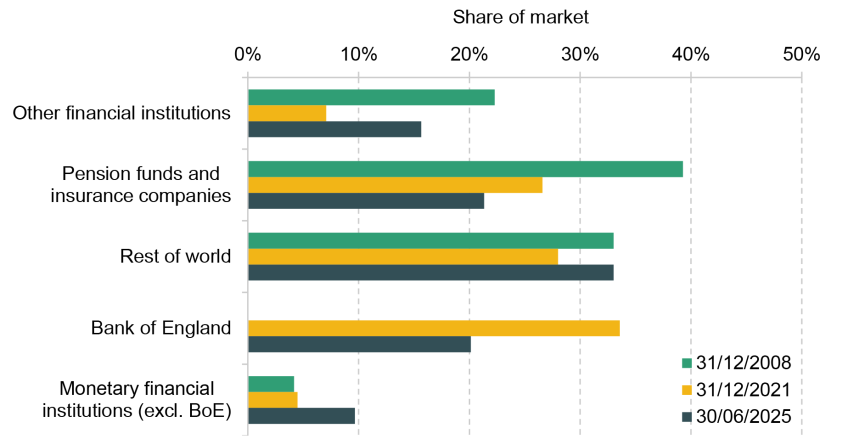
Source: National Statistics and Haver Analytics.
This shift in sectoral demand comes also with a rotation in maturity demand. Data on holdings by maturity are not available across all sectors but the Bank of England publishes statistics on the holdings of the banking sector. Figure 2.21 shows the detailed breakdown of the banking sector’s holdings of gilts by residual maturity. Headline holdings have near doubled since the end of 2021 to stand at £159 billion at the end of August 2025. Holdings of gilts with residual maturities of more than 15 years have shrunk from £25 billion to £14 billion while holdings of 3- to 15-year bonds have risen from £45 billion to £90 billion: banks are increasingly demanding shorter-term gilts. Bank buying is notable as it is underpinned by regulatory factors, notably the move after the financial crisis to require banks to have higher levels of liquidity, and the creation of a more prescriptive framework around liquidity and risk management.
Figure 2.21. Maturity breakdown of commercial bank gilt holdings
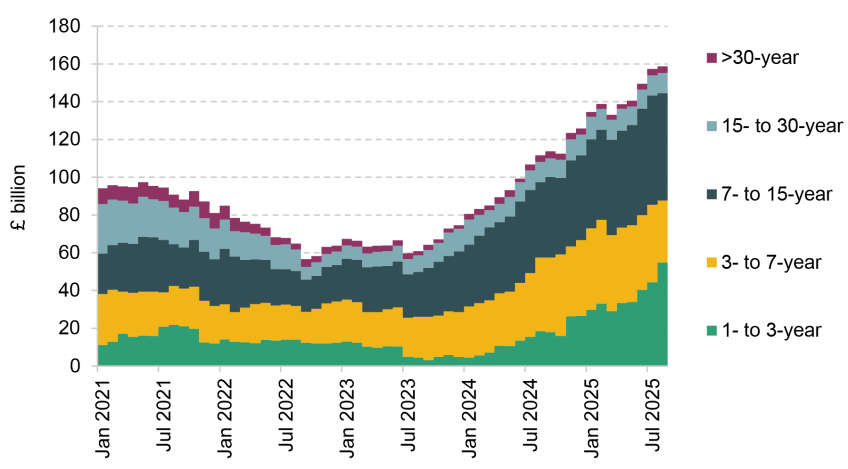
Source: Bank of England and Barclays Research.
The buying is largely in the form of asset swaps (ASW): buying gilts versus paying interest rate swaps, a way of reducing interest rate risk in bank liquidity portfolios. As both the swap and gilt carry interest rate risk, the asset swap becomes a relevant market metric for the relative pricing of bonds versus swaps. As such, it is a traditional market measure of fiscal risk as, all else equal, gilts will cheapen versus swaps (i.e. gilt yields rise more than swap yields) if supply is expected to rise. Referring to the discussion of term premiums, asset swaps can be viewed as reactive to changes in the term premium regime. Hence, if the DMO is rotating supply into the sub-15-year sector to cater for banking sector demand, the term premium must stay relatively high in order that the asset swap stays at a sufficiently cheap level to attract buyers. As supply has weighed on the market, the market has steepened the 10- to 15-year sector of the asset swap curve (Figure 2.22), reflecting also this flow of supply and a rise in gilt 10-year asset swaps (Figure 2.23).
Figure 2.22. Gilt asset swap curve at end of September 2025

Source: Barclays Research.
Figure 2.23. Gilt 10-year asset swaps
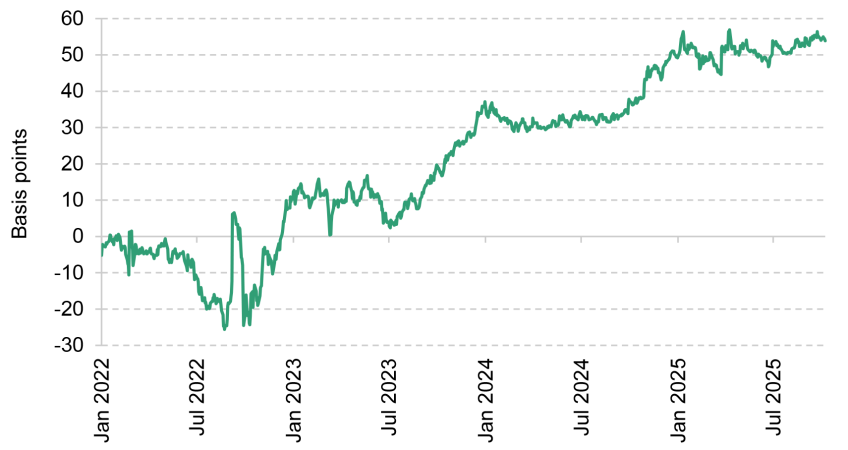
Source: Barclays Research.
2.6 Conclusion: the unwinding of the UK’s ‘borrower’s privilege’
The shortening of maturity in underlying demand has played a key role in the DMO’s decision to alter the maturity mix of its issuance. The underlying rise in 30-year term premiums can be viewed as a form of normalisation and this goes some way towards explaining the rise in 30-year yields. We would contend that for the best part of two decades, successive governments have benefited from ‘borrower’s privilege’. That is, a combination of regulatory and demographic factors drove demand for long-dated government assets. This was a key driver in the compression of the 30-year term premium, which saw it broadly flat to or lower than the 10-year term premium in the pre-financial crisis period. This coincided with a period when the DMO was structurally increasing the maturity of the market by issuing ultra-long (over 30-year maturity) gilts as well as skewing supply towards long maturities.
Although observationally the outcome would have been the same, this compression of term premiums was subtly different from ‘financial repression’ policy, whereby governments seek to lower yields deliberately below their ‘natural’ level by the use of explicit regulatory measures. But the decline in long-dated yields in the 2000s was not an ex ante aim of regulatory policy that one would associate with a regime of financial repression, but rather an ex post outcome. Regulation was more concerned with guaranteeing private sector defined benefit (DB) pension plan solvency and tightening trustee responsibilities after the experiences of the 1990s. But since 2022, we have seen a reduction in underlying demand from these pension plans for long-dated assets, as higher yields reduced the overall deficits of the plans overall, reducing demand for long-dated assets to hedge liabilities. As schemes’ liabilities have been derisked in the transfer to life insurance entities, so pension schemes’ investments have diversified away from gilts and towards credit and private assets.
The challenge that the government faces in the post-QE/post-DB gilt-buying world is working out what gilt demand looks like and how supply should respond. After a multi-decade period where governments had been accused of forcing domestic investors to buy long-dated paper (a point which we think does not wholly stand up under scrutiny), it would be somewhat ironic for the government to now look at regulatory shifts explicitly aimed at creating pockets of more inelastic domestic gilt demand.
The DMO can only respond to demand signals and has deliberately skewed supply away from the long end, unwilling to lock in higher borrowing costs. The cancellation of an auction of long-dated conventional gilts, which had been scheduled for December 2025, was the latest in a sequence of decisions that have systematically reduced long supply and fed into emerging domestic demand for shorter maturities.
Overall, the new demand outlook is more elastic than has previously been experienced. Higher cross-market spreads – higher yields on 10-year gilts than on bonds of the same maturity issued by the governments of Japan, Germany and France, and more recently the US (Figure 2.24) – have been underpinned by a higher neutral rate differential. Equally, despite this higher neutral rate differential, the term structure has needed to remain relatively steep, reflecting a persistence of elevated term premiums (Figure 2.25).
Figure 2.24. Cross-market spread of yields on 10-year gilts versus 10-year bonds issued by other governments
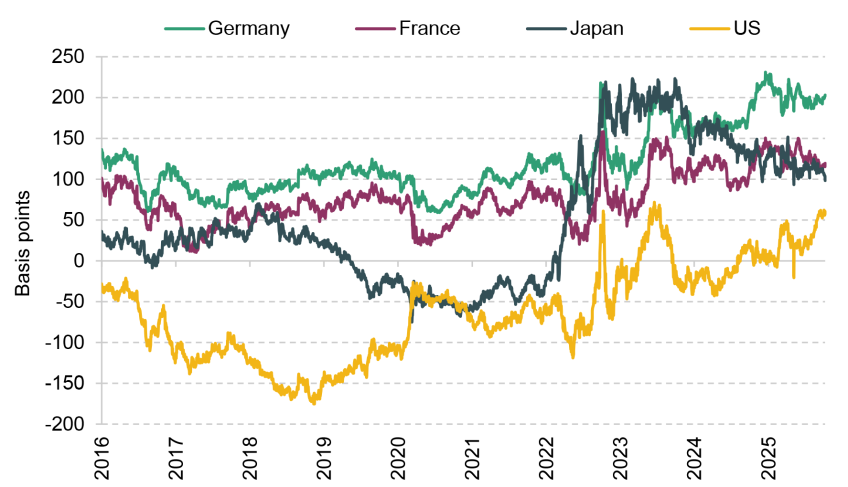
Source: Barclays Research.
Figure 2.25. Spread between 30-year and 5-year yields in selected markets
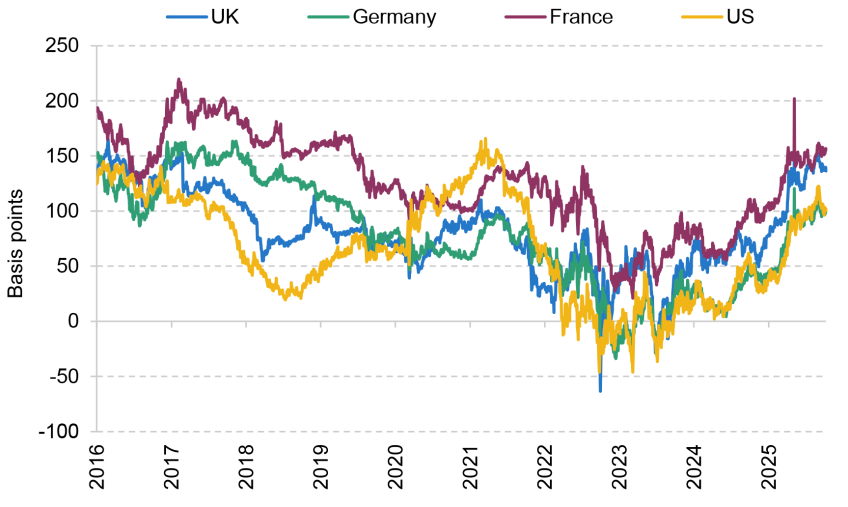
Source: Barclays Research.
While the burden of gilt absorption has so far been taken up by other domestic sectors, this might suggest overseas participants will need to become the marginal buyers of gilts. However, we would argue that the identity of the marginal buyer is less important than the need for the UK to maintain both monetary and fiscal credibility, such that discretionary macro investors feel confident enough to be comfortable owning gilt risk. Credibility-enhancing policy choices are the price that the government must be seen to be paying in order to provide reassurance to a wary bond market that has been quick to move sharply on any perception that the government might be rolling back on its promises of fiscal consolidation. With that in mind, next month’s Budget needs to be seen as part of the sequence of steps towards the goal of restoring and enhancing the UK’s fiscal credibility in the eyes of an increasingly sceptical bond market. To that end, it is not only the decision on consolidation that matters but also its composition. The market’s patience can only be tested so many times before fiscal scepticism morphs into the preconditions needed to see a full gilt funding crisis. Having experienced one in 2022, it would seem highly perilous to follow a policy path that might engineer another.
Acknowledgements
I am very grateful for comments from Jack Meaning and Cian Hennigan from the Barclays UK Economics team on an early draft of this chapter. Our many clients through their comments, questions and feedback have helped immeasurably to improve our work. IFS’s Carl Emmerson, Kate Ogden and Ben Zaranko’s perceptive questions and comments forced rigour and clarity of thought onto a rate strategist. They should take much of the credit for this. Any and all mistakes remain with me.
Authors

Moyeen Islam
More from IFS
Understand this issue


Policy analysis


Academic research


