Download summary | Download full report
The March 2017 Budget plan
The key backdrop to all fiscal events in the UK since the financial crisis has been the weak performance of the economy. At the time of the March 2017 Budget, national income per adult was around 15% lower than it would have been had output per adult instead grown by 2% a year (close to the post-war average) since the start of 2008. Despite this historically poor performance, weak growth was forecast to continue. The March forecast implied that, by 2022, national income per capita would be 18% lower than it would have been if it had grown at 2% per year since 2008. That is astonishing.
The Office for Budget Responsibility (OBR)’s judgement over the implications of Brexit for growth and the public finances are included in all these figures. In November 2016, it attributed to the effects of Brexit lower economic growth and a £15.2 billion increase in borrowing by 2020–21. There would be much uncertainty around this forecast even if we knew the form that Brexit will eventually take. So-called ‘no deal’ or ‘hard’ Brexit scenarios would likely have a much bigger negative effect over the next five years than that currently assumed by the OBR, with much more uncertainty around the outcome.
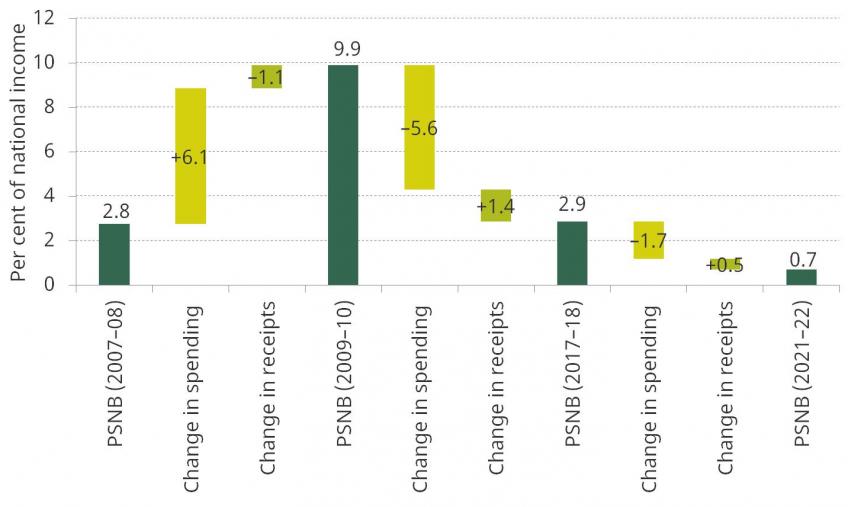
Such future uncertainties apart, this weak growth has had severe implications for both household incomes and the public finances. Figure ES.1 shows public sector net borrowing (PSNB) as a share of national income in 2007–08 (pre-crisis), 2009–10 (the peak), 2017–18 (the current year) and 2021–22 (the end of the March 2017 Budget forecast horizon). The changes in borrowing between these years are decomposed into changes in spending, and changes in receipts, as a share of national income.
Figure ES.1. Latest out-turns and March 2017 Budget forecasts for taxing, spending and borrowing
Source: See Figure 2.2.
As national income fell between 2007–08 and 2009–10, public spending increased sharply as a share of national income while government revenues fell. Since then, most of the increase in spending has been unwound, such that it in 2017–18 it was 0.5% of national income greater than it was in 2007–08 (6.1% less 5.6%). This is an important fact. Seven years of cuts have served merely to return public spending to its pre-crisis level as a share of national income.
Total government receipts have risen by more as a share of national income since 2009–10 than they fell over the preceding two years, such that they are now 0.4% of national income greater than in 2007–08 (–1.1% plus 1.4%; numbers do not sum due to rounding). So overall borrowing is now only slightly greater than it was in 2007–08, with both receipts and spending slightly above their pre-crisis shares of national income.
Going forwards, the Budget plan was for receipts to continue growing, and for spending to continue falling, as a share of national income, such that the deficit would decline to 0.7% of national income in 2021–22. This would be the lowest deficit since 2001–02. The forecast rise in receipts was driven by an increase in tax revenues which, if delivered, would see taxes reach a share of national income that has not been maintained in the UK since the 1950s. Spending would fall to its lowest share of national income since 2003–04.
This forecast deficit reduction came neither from strong rates of growth, nor from any underlying improvement in the public finances. Rather, it was almost entirely driven by the estimated impact of further net tax rises, further cuts to working-age benefits and further cuts to spending on public services as a share of national income. Net tax rises up to 2021–22 (relative to 2017–18) amounted to around £6 billion, while benefit cuts – many of which are already in place but apply to more claimants over the next few years – save £12 billion.
By far the largest contribution to deficit reduction was to come from spending by government departments, which was set to fall substantially as a share of national income, equivalent to £24 billion by 2021–22. These cuts were not planned to be spread evenly. Investment spending was set to increase to, and be maintained at, over 2% of national income, a reasonably high level by recent UK historical standards. This meant that the planned spending restraint came entirely through day-to-day spending, with real spending per capita set to fall almost 5% between this year and 2021–22 on top of falls of 13% between 2010–11 and the current year. And planned cuts were not shared evenly across departments, either. While the budgets of International Development, Health, Education and Defence were all relatively protected, real-terms cuts of almost 20% were planned for DEFRA and the Ministry of Justice over the next two years, despite the fact that these departments have already experienced large cuts since 2010.
In the March forecast, the combined effect of the substantial fiscal tightening planned over the next few years was a below-average deficit of 0.7% of national income by 2021–22. However, even if this were to be achieved, it would still be tough for the Chancellor to meet his overarching fiscal objective of eliminating the deficit by the mid 2020s. The pace of tightening would have had to accelerate beyond 2021–22 (there was a considerable easing off after 2019–20), while at the same time demographic pressures were set to put upwards pressure on spending worth 0.8% of national income by 2025–26. Overall, therefore, these plans implied a tight fiscal position over the next few years, with the prospect of more austerity measures further down the road if the overarching fiscal objective was to be achieved.
Developments since March
Data for the first six months of the financial year paint a rosier picture for the public finances than at the time of the March forecast. The latest estimate for borrowing last year – at £45.7 billion – is £6 billion below the March forecast, and the out-turns for the year to date suggest higher tax revenues, and lower spending, than the OBR thought in March. This is likely to outweigh any negative effects from weaker growth this year, with the combined effect that borrowing this year might come in at around £51 billion, or around £7 billion lower than forecast. That this improvement has arisen in spite of weaker-than-expected growth (which would otherwise have been expected to add around £4 billion to the deficit this year) implies an even greater underlying improvement in the public finances. Assuming this underlying strength persists, this public finance good news also puts downward pressure on medium-term borrowing to the tune of around £12 billion a year (set out in detail in Table ES.1).
On the other hand, forecast government borrowing over the next five years will be pushed up by the fact that the Bank of England’s Monetary Policy Committee is now expected to raise interest rates sooner. This will increase measured debt interest spending, although the difference from March is most stark in the next couple of years: while it adds £1.5 billion to borrowing in 2018–19, it only adds £0.7 billion to borrowing in 2021–22.
Policy measures announced since March – in particular, the reversal of the Budget measure on self-employed National Insurance contributions and additional spending pledges in Northern Ireland – combine to increase borrowing slightly over the next few years (peaking at an estimated £1.4 billion in 2019–20). The most significant giveaway since the Budget is the increased generosity of the student loan system in England, which will eventually increase borrowing by around £2 billion a year. But this is a long-term effect with little impact on the public finances in the next decade.
As ever, the public finance forecast is most sensitive to the anticipated size of the economy. Independent forecasters, including the Bank of England, have slightly downgraded their medium-term growth forecast since the beginning of the year. Downgrading in line with these forecasts would lead to the economy being 0.4% smaller in 2021–22 than forecast in the March Budget. But we expect the OBR to downgrade by more, given that it has indicated its likely intention to reduce its forecast for future productivity growth. This view is based on the terrible productivity growth that the UK has experienced since 2010. Any substantial downgrade to productivity forecasts would easily dwarf the other factors affecting borrowing and lead to the medium-term outlook being worse than in March.
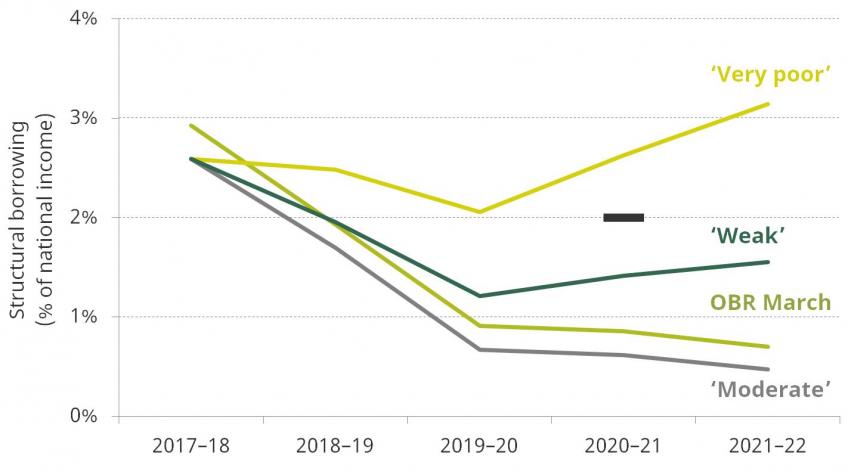
Quite how the borrowing forecast changes will depend on the extent of the productivity downgrade. Were the OBR merely to downgrade its growth forecasts in line with the Bank of England and independent forecasters, other factors could mean borrowing forecasts being revised down overall (the ‘moderate’ scenario in Figure ES.2 and Table ES.1).
But a more significant downgrade to growth prospects is likely. If the OBR were to decide that the terrible productivity growth of the last seven years were now the new normal (the ‘very poor’ scenario, under which output per hour grows at just 0.4% a year), without further policy action structural borrowing would rise above 3% of national income (almost £70 billion) in 2021–22 and rise further thereafter. Even if future productivity growth is
Table ES.1. Borrowing under different real growth scenarios, £ billion
| 2017–18 | 2018–19 | 2019–20 | 2020–21 | 2021–22 |
OBR March borrowing forecast | 58.3 | 40.8 | 21.4 | 20.6 | 16.8 |
‘Moderate’ total change | –6.9 | –4.9 | –5.3 | –5.5 | –5.4 |
Of which: |
|
|
|
|
|
Total underlying change | –6.9 | –5.7 | –6.7 | –6.4 | –6.3 |
Of which: |
|
|
|
|
|
Real growth downgrade | +3.7 | +3.4 | +2.9 | +4.0 | +4.8 |
Higher base rate expectation | +0.4 | +1.5 | +1.3 | +1.1 | +0.7 |
Underlying improvement | –11.0 | –10.6 | –10.9 | –11.4 | –11.8 |
Total policy change | 0.0 | +0.8 | +1.4 | +0.9 | +0.9 |
‘Moderate’ borrowing forecast | 51.3 | 35.9 | 16.0 | 15.1 | 11.4 |
‘Weak’ total change | –6.9 | +0.2 | +6.1 | +12.0 | +19.1 |
Of which: |
|
|
|
|
|
Total underlying change | –6.9 | –0.6 | +4.8 | +11.1 | +18.1 |
Of which: |
|
|
|
|
|
Real growth downgrade | +3.7 | +8.5 | +14.4 | +21.5 | +29.3 |
Higher base rate expectation | +0.4 | +1.5 | +1.3 | +1.1 | +0.7 |
Underlying improvement | –11.0 | –10.6 | –10.9 | –11.4 | –11.8 |
Total policy change | 0.0 | +0.8 | +1.4 | +0.9 | +0.9 |
‘Weak’ borrowing forecast | 51.3 | 41.0 | 27.5 | 32.6 | 35.8 |
‘Very poor’ total change | –6.9 | +10.7 | +23.4 | +37.4 | +53.1 |
Of which: |
|
|
|
|
|
Total underlying change | –6.9 | +9.9 | +22.0 | +36.5 | +52.2 |
Of which: |
|
|
|
|
|
Real growth downgrade | +3.7 | +19.0 | +31.7 | +46.9 | +63.4 |
Higher base rate expectation | +0.4 | +1.5 | +1.3 | +1.1 | +0.7 |
Underlying improvement | –11.0 | –10.6 | –10.9 | –11.4 | –11.8 |
Total policy change | 0.0 | +0.8 | +1.4 | +0.9 | +0.9 |
‘Very poor’ borrowing forecast | 51.3 | 51.5 | 44.8 | 58.0 | 69.9 |
Note and source: See Table 3.3.
Figure ES.2. Structural borrowing under different growth scenarios
Note and source: See Figure 3.7.
downgraded halfway towards that seen over the last seven years (the ‘weak’ scenario, under which output per hour grows at just 1.0% a year), the deficit in 2021–22 could be around 1.6% of national income. At around £36 billion, this would be almost £20 billion higher than the £17 billion forecast by the OBR back in March. This could be even higher if the underlying improvement in the public finances this year were judged to be a temporary phenomenon (rather than acting to reduce 2021–22 borrowing by £12 billion) or if the downgrade to growth were deemed to be particularly tax-rich.
Under our ‘weak’ productivity scenario, the Chancellor would still be on course to meet his fiscal mandate (requiring structural borrowing below 2% of national income in 2020–21), albeit having lost around 50% of the headroom he had just eight months ago. Based on historical forecast errors, there would be a 40% chance that the target would be missed unless further policy action were taken. Achieving the Chancellor’s overarching fiscal objective of eliminating the deficit by the mid 2020s – a challenge even on the March forecasts – would be considerably more difficult if this weak productivity growth were to materialise.
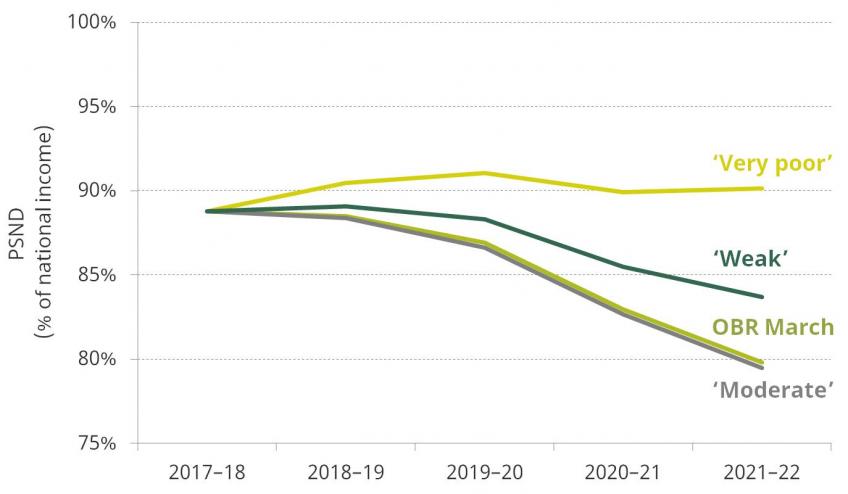
Absent offsetting policy measures, under our ‘weak’ productivity growth scenario the national debt would be almost 4% of national income higher in 2021–22 than on March forecasts (Figure ES.3).
In our ‘very poor’ productivity scenario, the fiscal mandate – for structural borrowing to be below 2% of national income in 2020–21 – would be missed. The fiscal objective – to eliminate the deficit entirely by the mid 2020s – would seem almost sure to go the same way. Debt would still be hovering around 90% of national income (although expected repayments of loans made by the Bank of England would still leave the Chancellor on course to meet his target of having lower debt as a share of national income in 2020–21 than in 2019–20: the fact that this target could be met in this way highlights how flawed it is).
Figure ES.3. Public sector net debt under different growth scenarios
Note and source: See Figure 3.7.
Policy options for the Budget
This likely downgrade to the forecasts for borrowing poses a dilemma for the Chancellor. Ordinarily, we might expect a medium-term fiscal tightening in response – at least based on fiscal events since 2010. And given that this is the first Budget since a general election, we might have expected some tax rises to be announced this time around. However, the Chancellor must balance the needs of the economy, strains on public services and other pressures with the costs of having higher debt. Much of the public debate in the lead-up to the Budget has been about ways to ease the squeeze rather than options for reducing borrowing, and any takeaway measure would have to pass a vote in the House of Commons – no small challenge given current parliamentary arithmetic.
If economic growth disappoints, then meeting the fiscal objective will require further tax rises or spending cuts at some point. Neither seems likely at this Budget. Tax rises may be limited to the seemingly obligatory package of anti-avoidance measures. Some small tax cuts seem likely. Conservative manifesto commitments on raising income tax thresholds are now less expensive due to higher-than-expected inflation (just £1.1 billion a year needed to deliver a personal allowance of £12,500 and a higher-rate threshold of £50,000 in 2019–20), while it would also be a surprise if rates of fuel duties were not frozen in cash terms for a seventh consecutive year (at a cost of £¾ billion a year).
On the spending side, too, there appears to be more appetite for giveaways than takeaways. Welfare measures already in place will reduce spending over the next few years as they apply to more claimants. As universal credit continues to be rolled out nationwide, one concern that has been raised is the typical six-week period before payments are usually made – the Chancellor could choose to devote additional funds to reducing this. The largest cut to come over the next couple of years is the continued freeze to the rates of most working-age benefits, which is now a bigger saving to the exchequer – and a bigger cut to real household incomes – than originally intended due to higher inflation. In order to achieve the apparently originally intended savings, the freeze could be stopped a year early, or the increase over the next two years could be 1% instead of zero. Cancelling the policy entirely would cost £4 billion in 2019–20.
Pressures on public service spending abound. Three particular areas where there is quantitative evidence indicating pressure are public sector pay, the NHS and prisons. Relative to private sector wages, public sector pay has already been returned to around the level it was before the financial crisis. Based on current forecasts, the 1% pay cap planned for the next two years would see public sector pay fall to its lowest level relative to private sector pay for at least 20 years, which is likely to risk greater problems with recruitment, retention and morale. Loosening the cap is expensive, however. Increasing pay in line with inflation for two years would (relative to the 1% cap) cost £6 billion more in 2019–20, which could either mean more borrowing or, if departments are not allocated extra funds, an even greater squeeze on departmental budgets.
While the NHS has seen modest per-capita real-terms funding increases since 2010, these settlements are the tightest in the NHS’s history. Activity levels have continued to grow, but there are clear signs of strain. Both the four-hour A&E target and the 18-week waiting period target are being missed nationally. The indicators paint a worrying picture for prisons, which, unlike the NHS, have seen large real-terms cuts (over 20%) since 2009–10. Statistics compiled by the Institute for Government show that while the prison population is at roughly its 2009 level, staffing is down and violence (both against fellow prisoners and prison staff) and prisoner self-harm rates are on an alarmingly steep upwards trajectory. The Chancellor has already abandoned the pay cap here and provided more money for recruitment at last year’s Autumn Statement, but he may decide that more support is required.
So what’s a Chancellor to do?
So what is a Chancellor to do? The first Budget of a new parliament is often the best chance a Chancellor has to set out her stall. She can raise taxes if need be, set an agenda for the next five years, and set in train economic and fiscal reforms. Mr Hammond, though, has been dealt a very tricky hand indeed. The political arithmetic makes any significant tax increase look very hard to deliver. It looks like he will face a substantial deterioration in the projected state of the public finances. He will know that seven years of “austerity” have left many public services in a fragile state. And, in the known unknowns surrounding both the shape and impact of Brexit, he faces even greater than usual levels of economic uncertainty.
Even if he does find some money, unless it did represent a very big change of direction, it won’t mean ‘the end of austerity’. Tight spending settlements, net tax rises and cuts to working-age benefits are all putting significant downward pressure on borrowing over the next two years in particular.
Mr Hammond is likely still to be on course to meet his target of a structural deficit of no more than 2% of national income by 2020–21, if by a much reduced margin. It looks increasingly unlikely that the ever-receding target to get rid of the deficit altogether will be achieved by the mid 2020s, which is when that is currently supposed to happen. Of course, it is possible that the economy, or the public finances, will perform much better than expected. But given all the current pressures and uncertainties – and the policy action that these might require – it is perhaps time to admit that a firm commitment to running a budget surplus from the mid 2020s onwards is no longer sensible.


